
Liaison Strategies published a poll today, September 9, conducted for their Toronto Pulse Series and the Toronto Star. The questions concern mainly the coming mayoral election, and these have been covered in the mainstream media. However, there are four questions about TTC usage that make interesting reading considering how much transit policies are discussed (or not) in various circles.
The questions are:
- Compared with before the COVID-19 pandemic, do you now choose to take the TTC more often, less often or about as often?
- For those who cite “less often”:
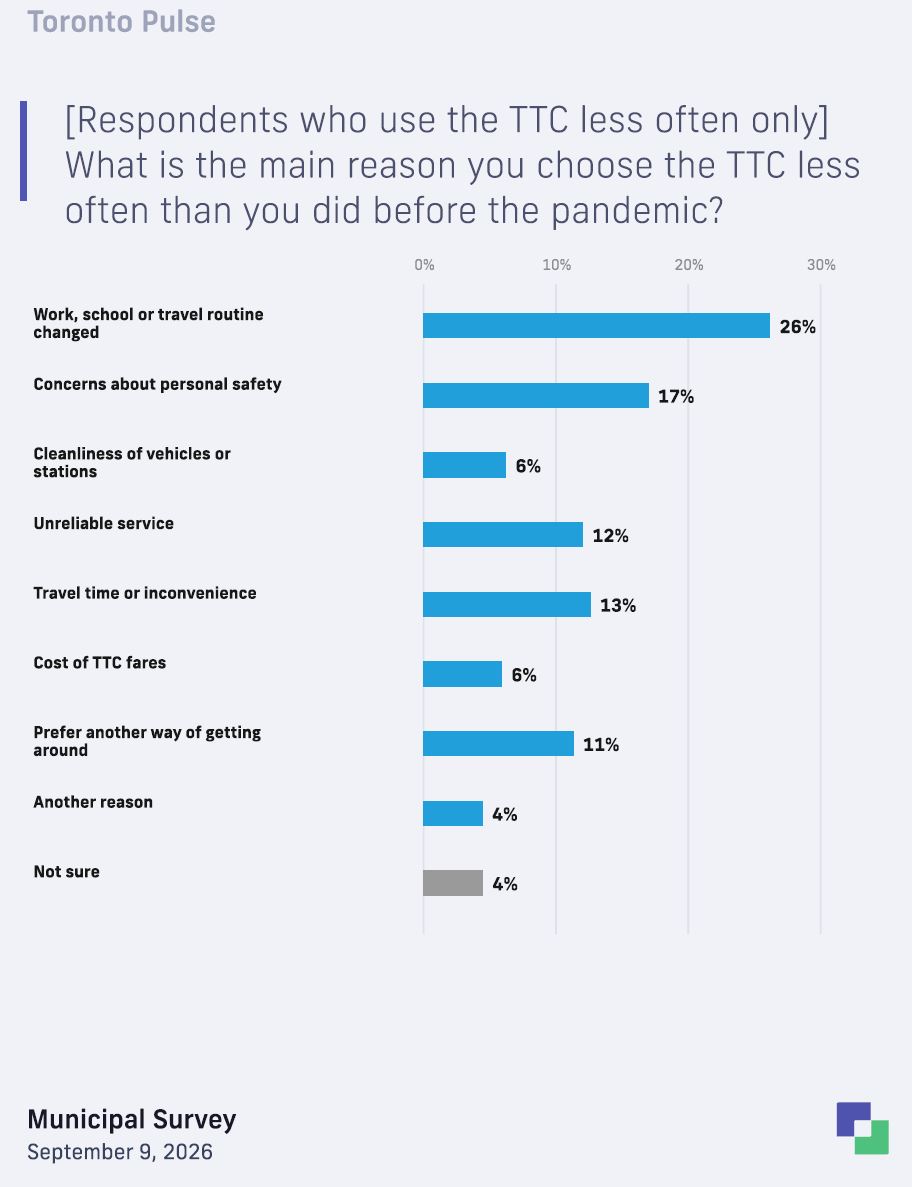
- What is the main reason you choose the TTC less often than you did before the pandemic?
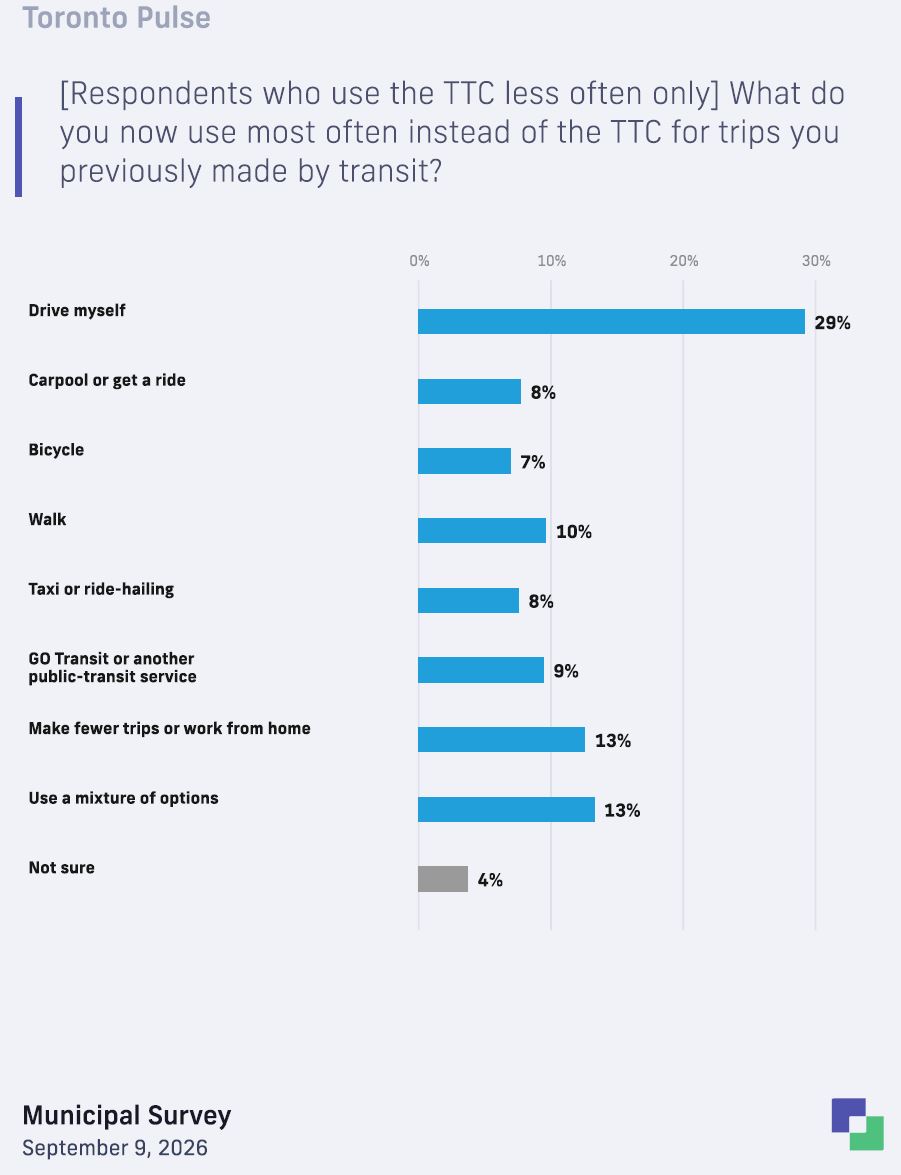
- What do you now use most often instead of the TTC for trips you previously made by transit?
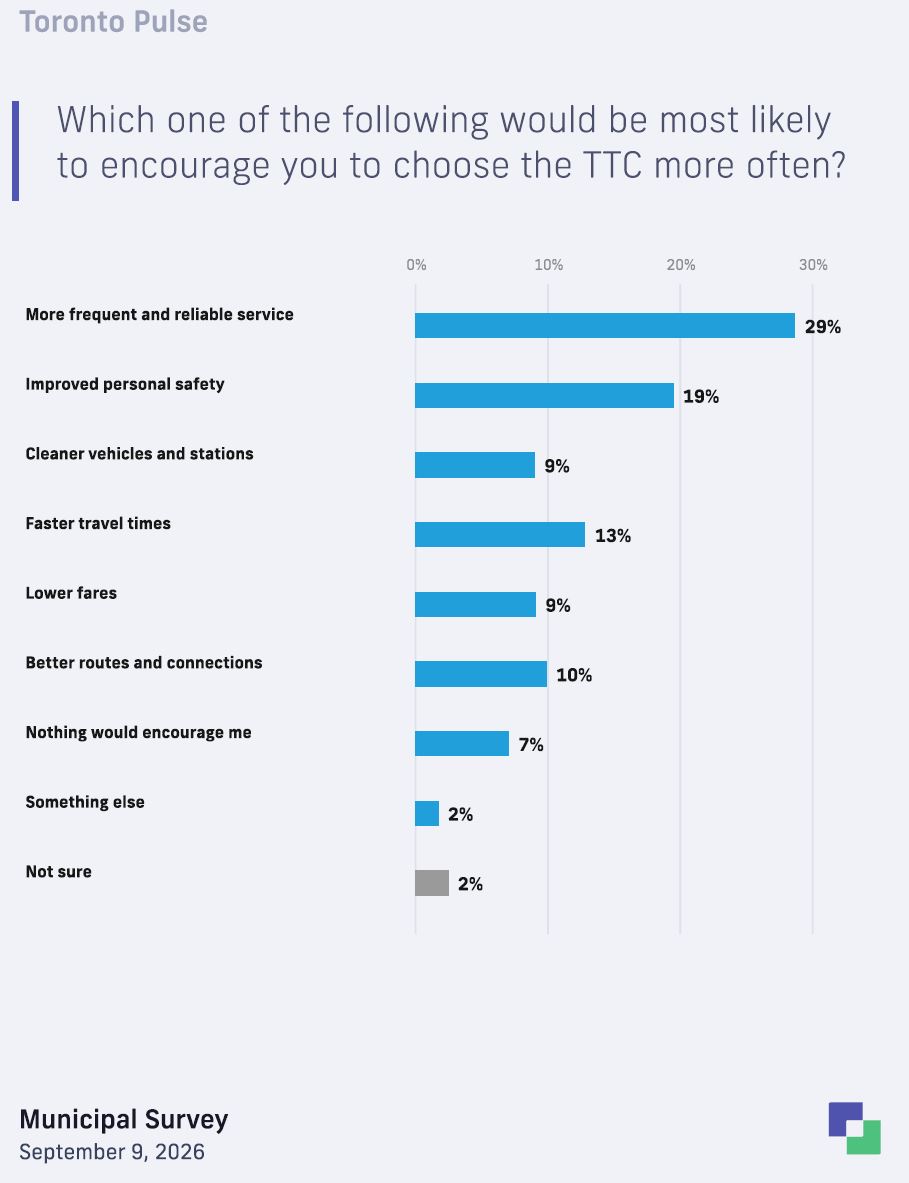
- What one of the following would be most likely to encourage you to choose the TTC more often?
The high level numbers are discouraging for transit advocates. Although 39% ride TTC about the same as before, 29% say less often while only 15% say more often. The remaining 17% are split between non-TTC users and “not sure”.
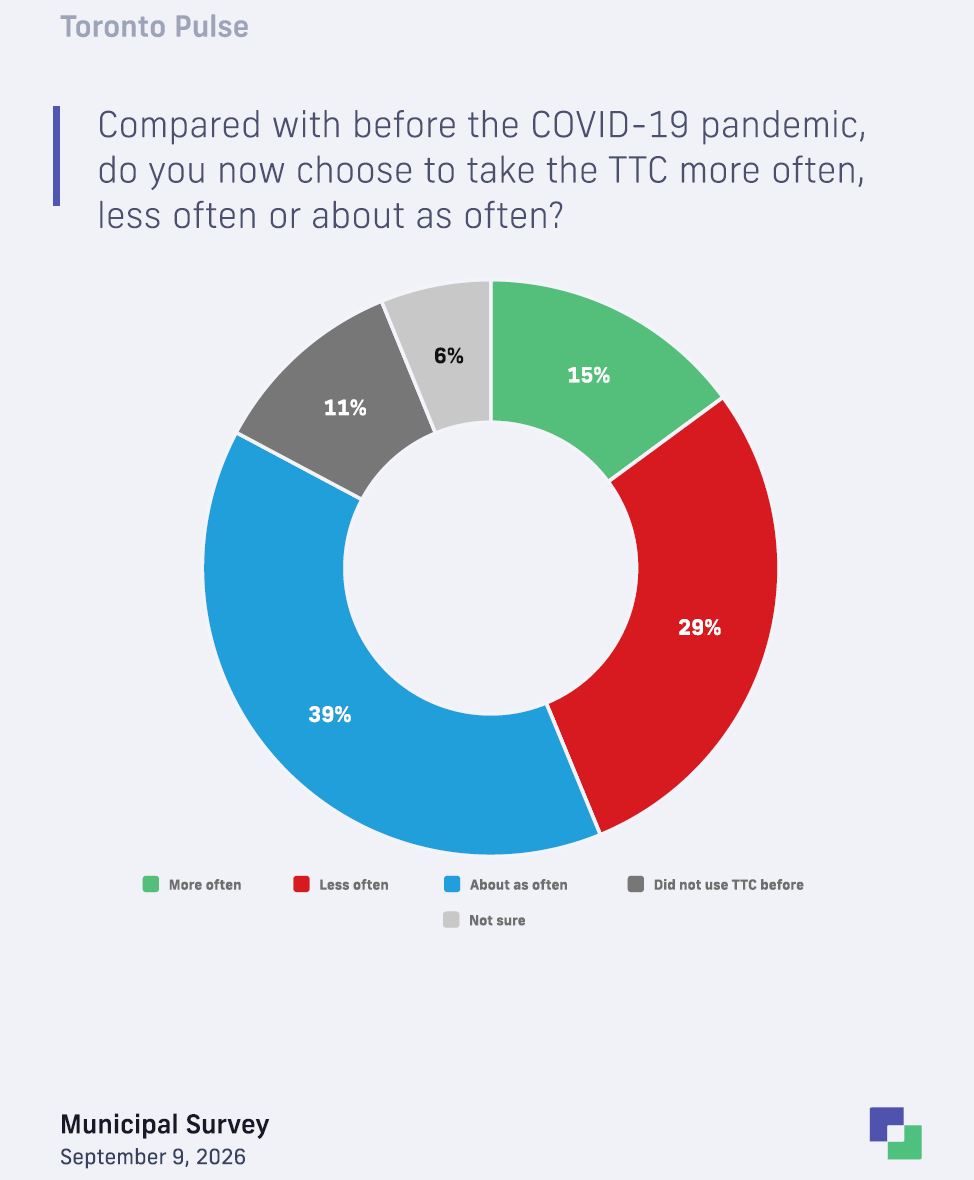
The detailed breakdown of these groups shows interesting differences across the city, but to a much lower extent by age and sex.
Unsurprisingly, the “more often” group is concentrated downtown with 27% of responses coming from there. The numbers drop off in the suburbs with 13% in North York, 11% in Etobicoke, and 9% in Scarborough.
Conversely, the “less often” group is 33% in Scarborough, 29% in North York, 28% in Etobicoke and 24% downtown.
The “About as often” numbers have a smaller range from 36% in Etobicoke to 41% in Scarborough.
The non-TTC-riders pre-pandemic were highest in Etobicoke at 19% and lowest downtown at 6%.
The details of why riders have left the TTC, and how both ex-riders and those still on the system can be encouraged to ride more follow in the long version of this article.
Overwhelmingly, riders (past and present) want better service — a combination of frequency, reliability and speed.
Better service usually means more vehicles and drivers, not to mention line management and a culture that values reliability. Transit priority has to be real, not something at selected locations when enough traffic wardens are free to wrangle motorists, pedestrians and cyclists who make up their own rules.
These cost serious money and step on political toes. Toronto Council has a dream of massively improved transit service, but no sense of how it would be implemented nor any plan for the necessary fleet, infrastructure and staff needed to ramp up service. Meanwhile we celebrate multi-billion dollar lines on maps in media events and election campaigns.
The TTC had a Strategic Planning Committee for the past few years, but it did not spend much time on real “strategy”, certainly not on options that might bring riders back to the TTC. Everyone seems afraid to talk about any policy that has a cost, and some penny-pinchers think every problem can be solved with belt-tightening. Exactly what is needed and possible is never debated nor presented for public discussion. Toronto bumbles from year to year with minimal changes most riders cannot see in their daily travels.
This survey and others like it from past years should be a wake-up call to Toronto that service matters, and Toronto politicians should explain just how much they will fight to improve the TTC beyond the status quo.
Why Do Riders Use The TTC Less?
The primary reason cited for using the TTC less was that rider travel routines changed (26%). This could mean that they simply did not need to travel (e.g. work from home, retired) or that transit no longer suited their regular travel. This item ranked higher downtown and in Scarborough (31%), slightly lower in Etobicoke (27%) and much lower in North York (17%). The values broken down by age and sex lie close to the 26% average.
Personal safety was the next highest topic at 17%. It is highest in Etobicoke at 21% falling off through Toronto (19%), Scarborough (16%) and North York (15%). The rank is higher among older population and women, but only slightly above the average (19%).
Unreliable service, travel time or inconvenience account for 25% between them, although there are differences between parts of the city. The highest numbers are in North York (19% unreliable, 15% travel time or inconvenience), with lower values in downtown (13% and 9%), Scarborough (8% and 14%) and Etobicoke (8% and 10%).
There is only a small difference between men and women in these categories, but moreso by age groups. Of the 18-34 group, 20% cite one of these factors. This rises to 28% for the 35-49 group, and 30% for 50-64. It drops back 21% for the 65+ group.
Vehicle and station cleanliness account for only 6% although the highest value is in North York at 12% and the lowest downtown at 2%.
Fares also come in at 6%, but with Scarborough citing 9% and other areas 4-5%. The highest age groups at 9% citing this factor are 18-34 and 65+.
Preference for another mode of travel was highest downtown at 15%, lowest in Etobicoke at 6%, with North York (12%) and Scarborough (11%) in the middle of the pack. Values vary by age with 15% of the 18-34 group dropping to 9% of the 65+.
It is important to remember that the survey asked for “the main reason” someone used the TTC less, and several issues could have contributed to the decision.
What Alternative to the TTC Do You Use Now?
For those who use the TTC less now than in 2019, driving was the primary alternative at 29% with a further 8% car pooling or getting a ride, and another 8% moving to taxis or ride-hailing. Active transportation took 7% for cycling and 10% for walking. Some trips shifted to GO or another transit agency (9%). Some former riders used a mix of options (13%), and a similar proportion either made fewer trips of work from home.
The driving option was highest downtown and in Scarborough at 35% with noticeably lower values in Etobicoke (25%) and North York (20%). This was lowest among the 65+ group at 21%.
Car pooling was higher among women (10% vs 5% for men) and seniors (10%), and was most common in North York (11%) vs downtown (4%).
Taxis and ride hailing were cited most downtown (10%), with lower values in North York (9%), Scarborough (7%) and Etobicoke (4%).
Cycling was cited as an alternative the least downtown (2%) with higher numbers in both North York and Scarborough (9%). Walking was most common downtown (15%) and least in Etobicoke and Scarborough (6%).
Another transit service, to no surprise, was cited more in North York (10%) and Scarborough (14%), much less so elsewhere.
Reduced travel and work from home averaged 13% with a range from 11-15% among various groups.
The standouts among the “mix of options” group are in Etobicoke (25%) and Scarborough (7%).
It is important to remember that when the overall responses are subdivided, the number in each group is smaller and the potential variation from a larger sample is greater.
What Would Encourage More Riding?
The table below should be no surprise to anyone familiar with transit passenger surveys. Service related issues – frequent and reliable service, faster travel times, better routes and connections – account for 58% of the responses. Personal safety and system cleanliness count for another 28%. Only 9% say they would ride more if fares were lower.
This is not to say that fares are unimportant, especially for frequent users and those on low incomes, but fares alone will not make up for service quality and a sense of security. By analogy, a store with big “SALE” sign in the window, but half-empty shelves of outdated goods will not attract customers. Even worse, the dreaded phrase “shuttle buses are running” is the equivalent of a supermarket setting up a few barrow-boys in the parking lot.
Toronto has seen a string of fare freezes and now monthly capping that brings its fare policies more in line with other cities, but this alone will not get people using transit more, especially if they have already given up hope.
Both TTC and Metrolinx have a lot to answer for with a mixture of infrastructure and vehicle problems that guarantee a miserable journey for regular riders often enough that they will cite them to friends, colleagues and survey takers.
Fare policy, especially as the proportion of revenue coming from riders has dropped over the years (from 70% to under 40%), is comparatively cheap. Service is quite another matter.
Better frequency and reliability has an average score of 29%, and the breakdowns across sex, age and location are close to this value. Faster travel times similarly with an average of 13% show only small differences across all groups. Better routes and connection average 10% with a lower score downtown (7%) where there is a dense, frequent network and higher especially in Scarborough (12%).
Lower fares at an average of 9% has a higher rank (14%) in the 18-34 group.
Again, remember that the survey asked for one response from a list, and many factors could influence riders. They were asked to name only one.
Methodology
Liaison surveyed a random sample of 1,000 Toronto residents from September 4 to September 5, 2026, using Interactive Voice Recording (IVR) technology. Participants were reached through random digit dialling (RDD) across both landline and cellular phone networks. The resulting data was weighted to match targets based on the 2021 Census. For the total sample, the margin of error is +/- 3.1 percentage points, 19 times out of 20. The margin is higher for sub-samples. Totals may not add up to 100% due to rounding. [Source: Liaison Strategies article]
 Steve Munro