
This article updates a series of posts looking at the 7 Bathurst bus and the effect of transit priority changes made on that route. Originally the City and TTC had proposed red lanes from Bathurst Station north to Eglinton. This was substantially changed to parking and turning restrictions, and the elimination of some transit stops. The changes predominantly affected northbound travel and in the interest of brevity, I have included mainly northbound data here. The changes implemented were:
- Extendind the no stopping period on the east side of Bathurst between Eglinton and Bathurst Station North Exit from 2:00 to 7:00pm, weekdays, and from noon to 7:00pm, weekends, except public holidays. Previously, there was no stopping from 4:00 to 6:00pm or 3:30 to 7:00pm, Monday to Friday, depending on the segment
- No left turns northbound from 7:00am to 7:00pm Monday to Saturday, except public holidays (Toronto Transit Commission vehicles excepted), at Bathurst & Davenport northbound, and at Bathurst & Dupont southbound. Previous hours were 4:00 to 6:00pm weekdays northbound at Davenport, and 7am to 6pm southbound at Dupont.
- The existing no left turns restriction northbound at Bathurst & Dupont from 7:00 to 9:00am weekdays was removed.
- Concurrently with these changes, the TTC removed stops from the route, mostly north of St. Clair, with the premise that fewer stops would make faster trips. The actual effect varies depending on how heavily a stop is used, whether each bus or only some trips actually stop there, and whether there is an associated traffic signal that could compound the delay of serving a stop.
A saving of 1/3 in travel times has been claimed between Bathurst Station and Dupont, but this is not supported by actual tracking data. There may be best case comparisons where there is a 1/3 saving, but this does not apply across the board. The primary intent, as explained in the presentation to Council at the time, was to improve the reliability of travel times, not to speed up service.
A major issue on Bathurst is that the service is infrequent (generally every 10 minutes) and very unreliable. How much road capacity should be dedicated to such a route by comparison with other priority implementations such as on King Street or Eglinton Avenue East?
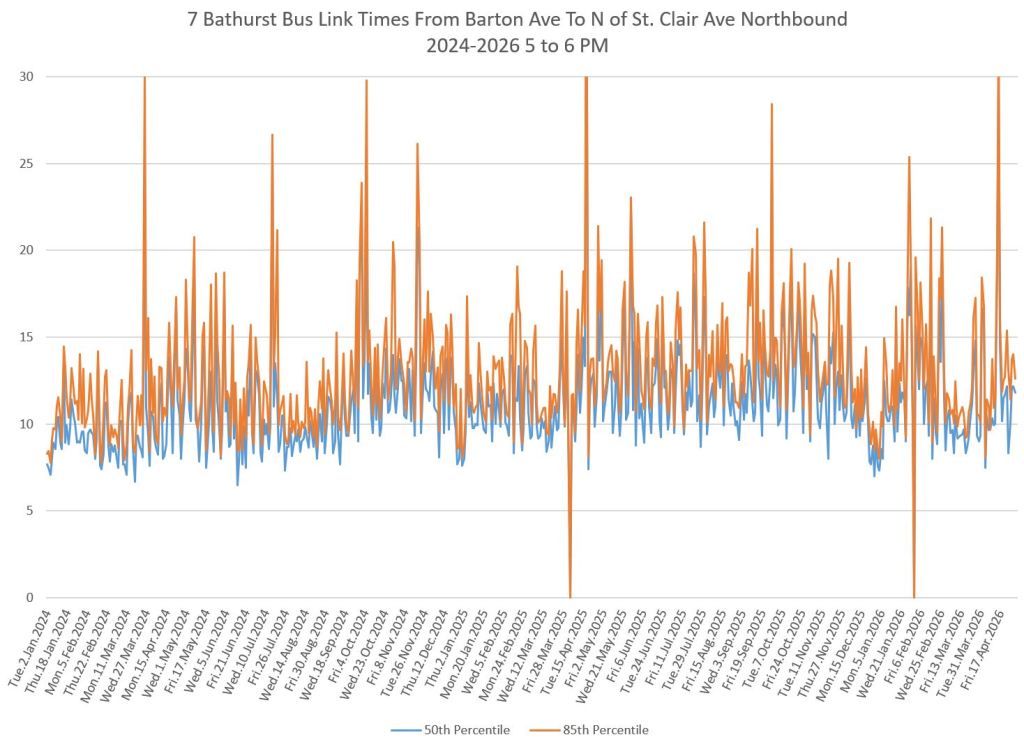
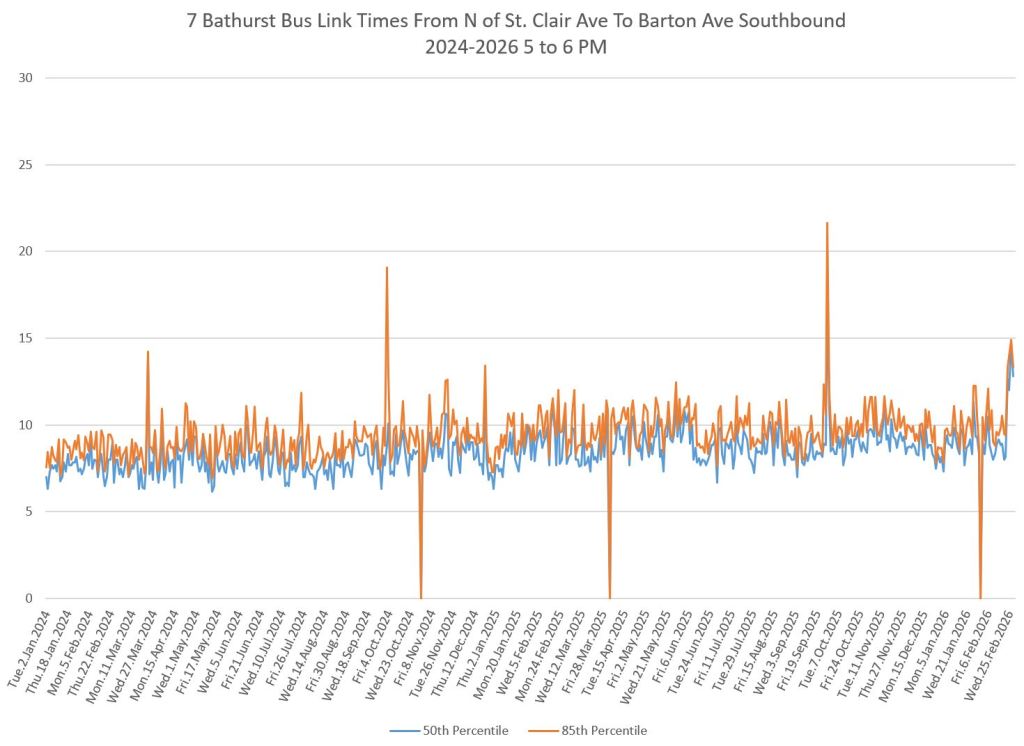
The first set of charts in this article shows the evolution of travel times between Barton (just north of Bathurst Station), St. Clair and Eglinton. The second compares April 2026 with April 2025 in detail. The third reviews the history of headway reliability on the route.
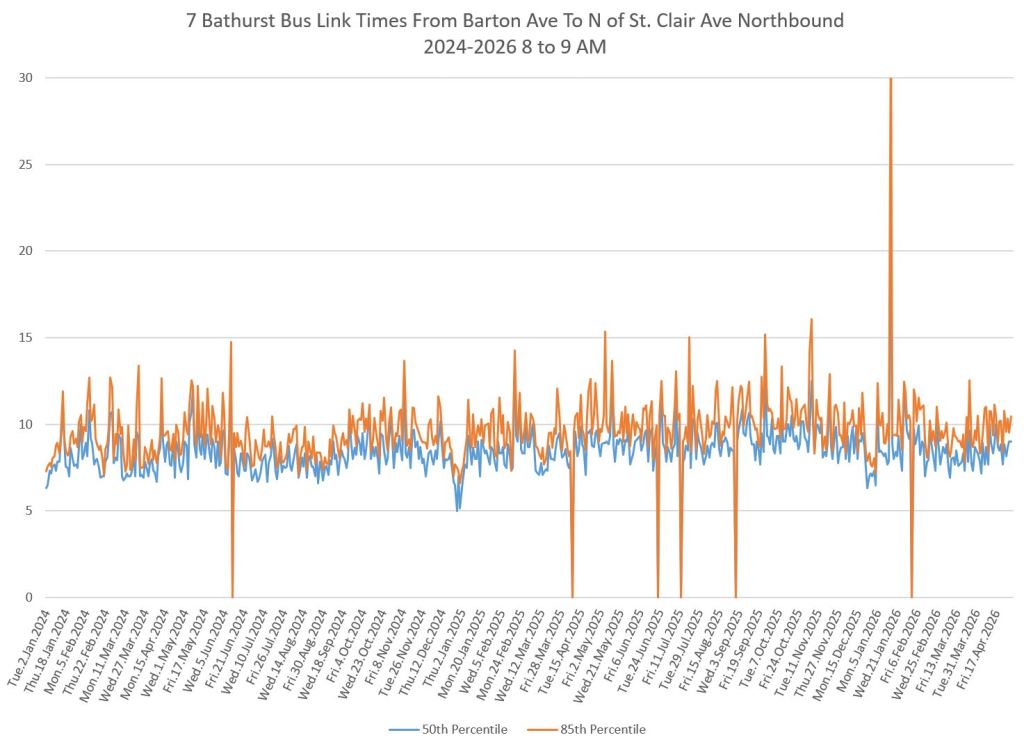
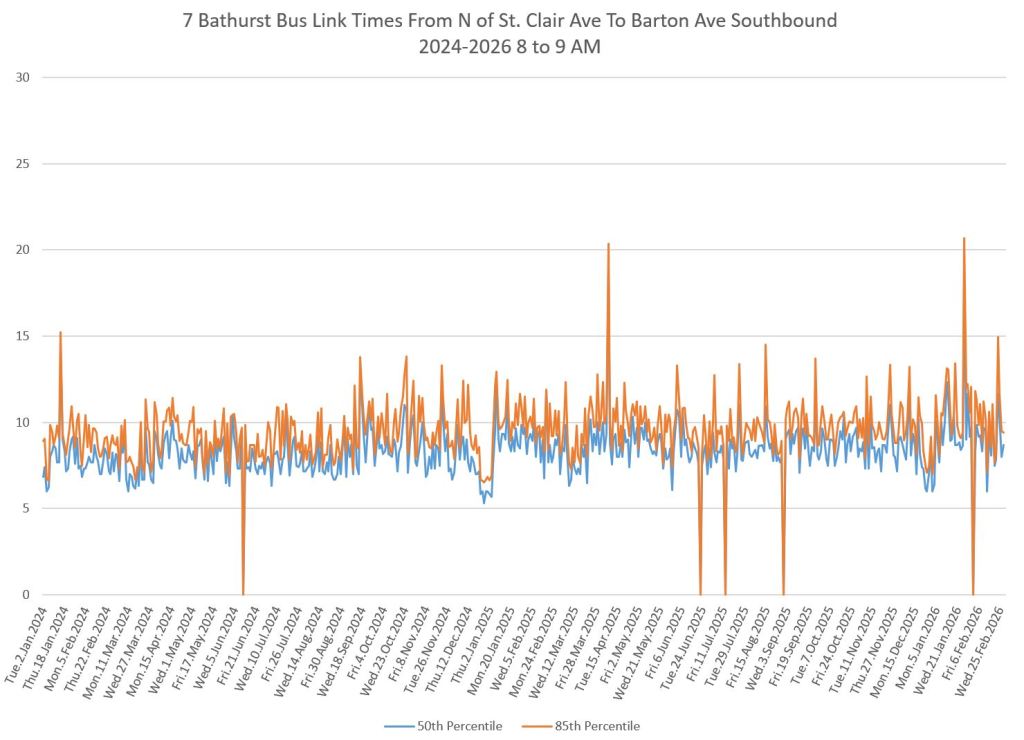
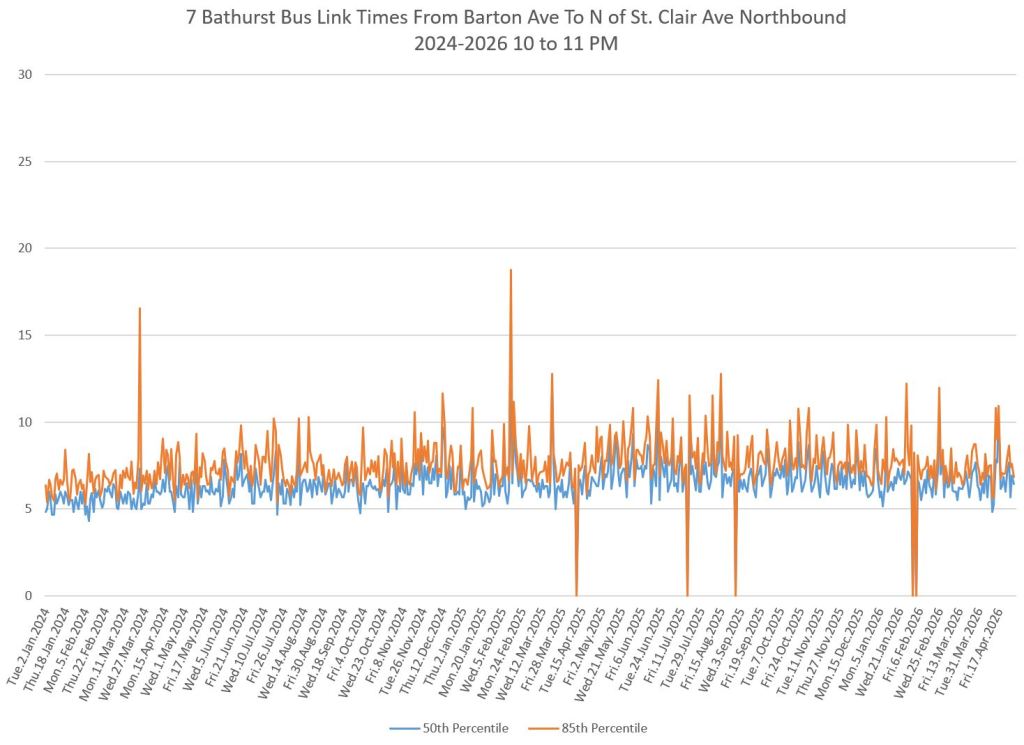
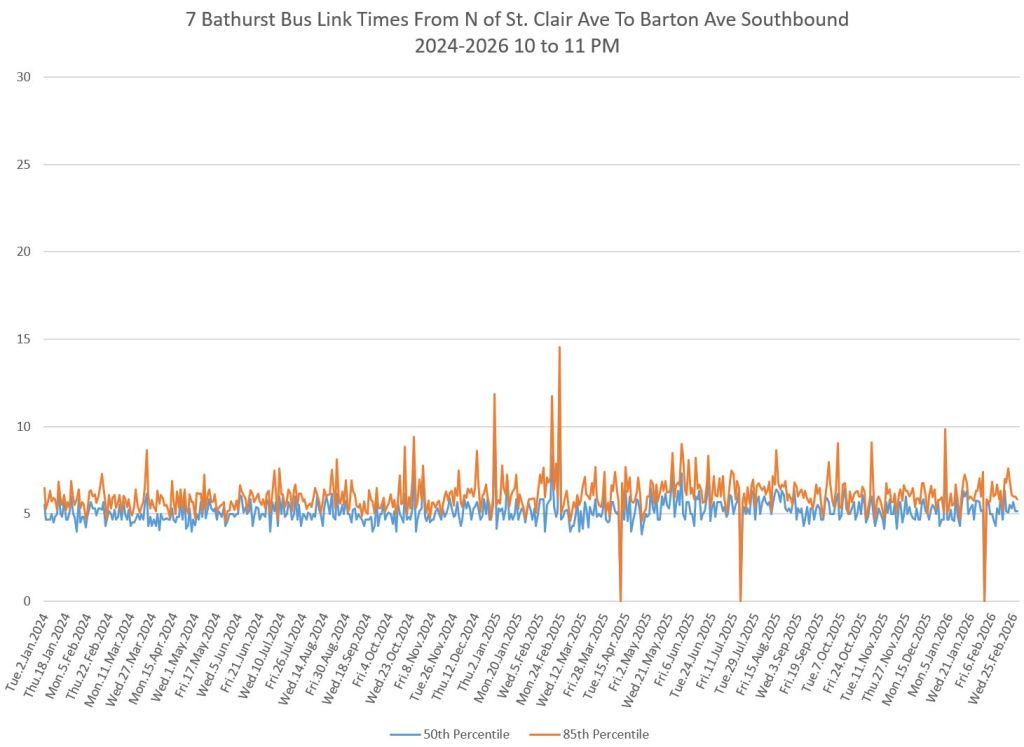
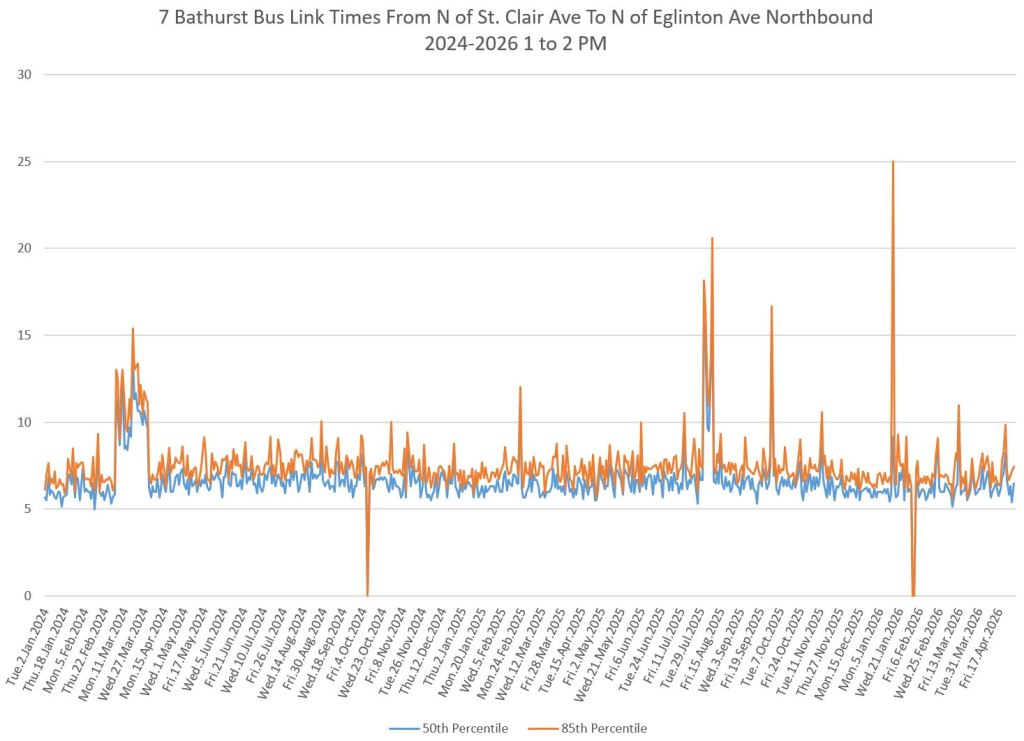
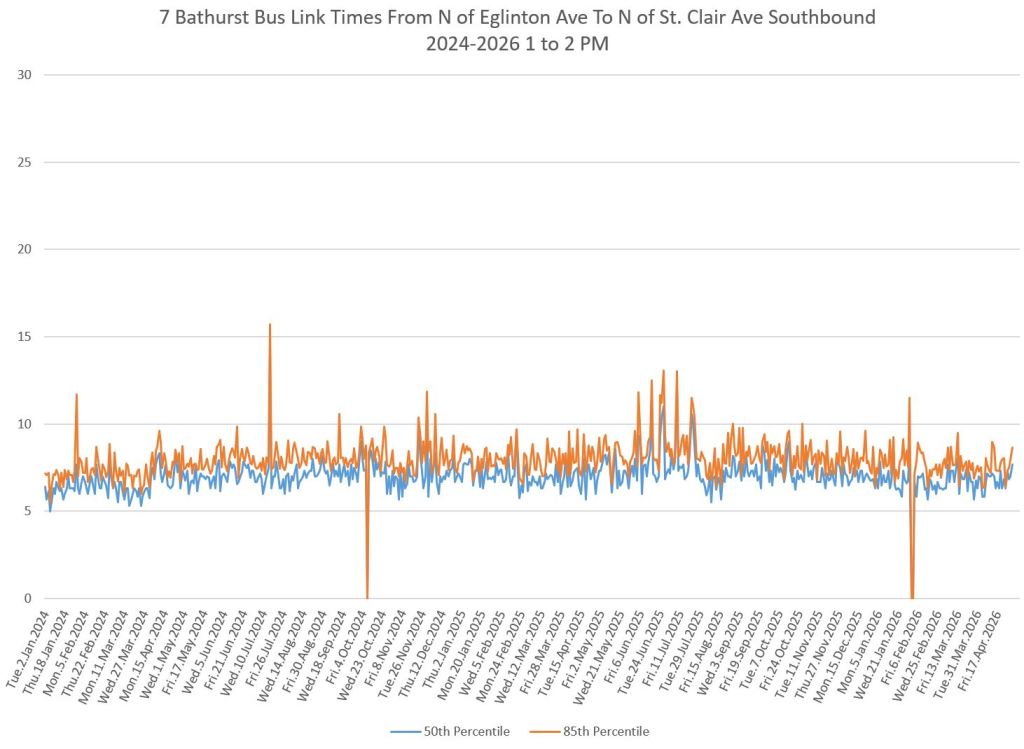
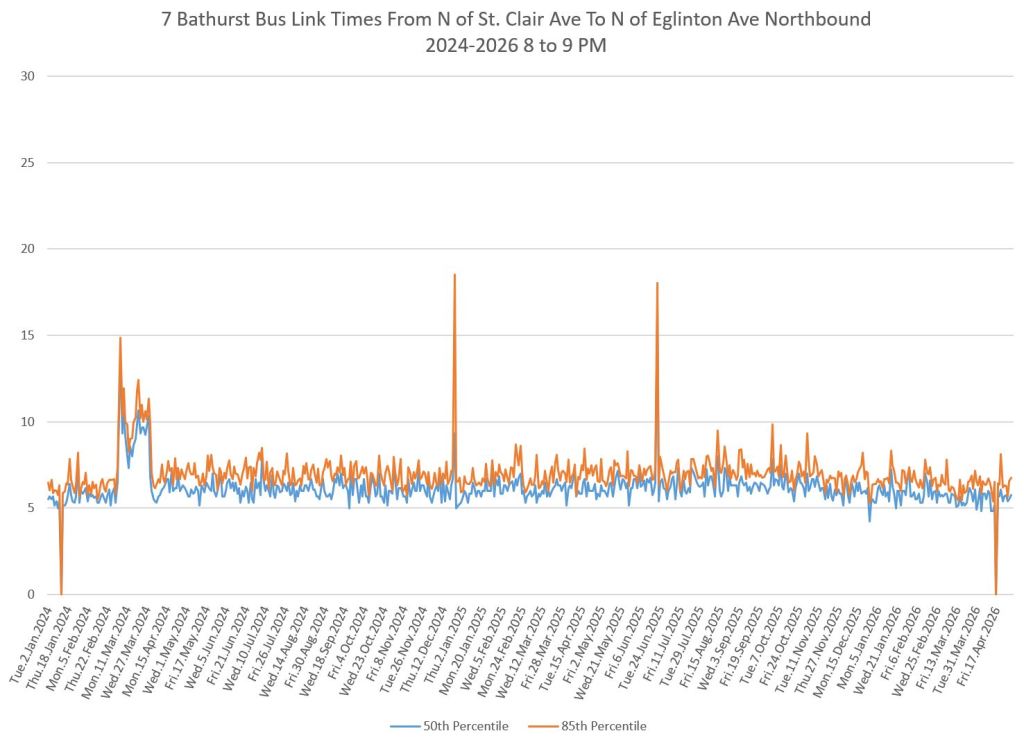
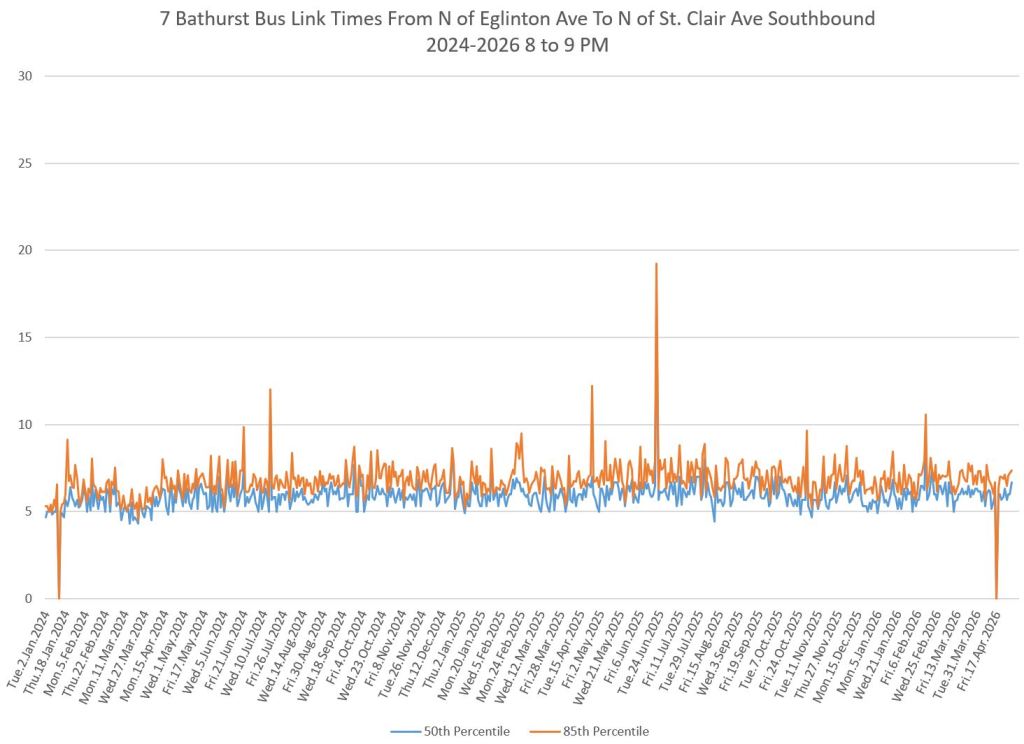
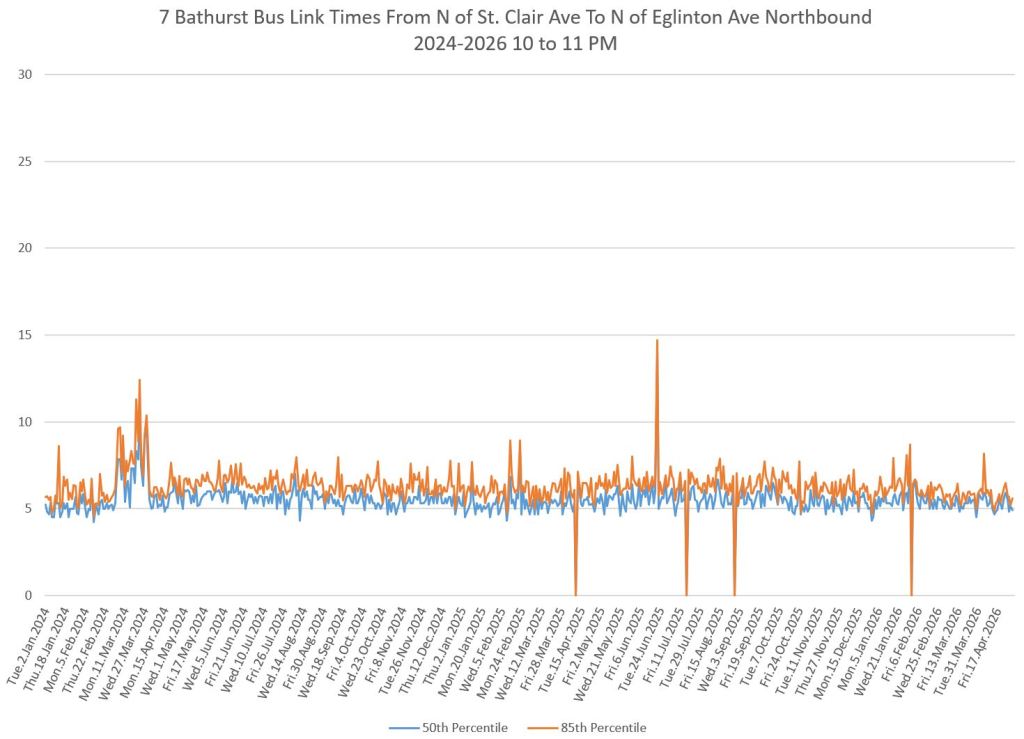
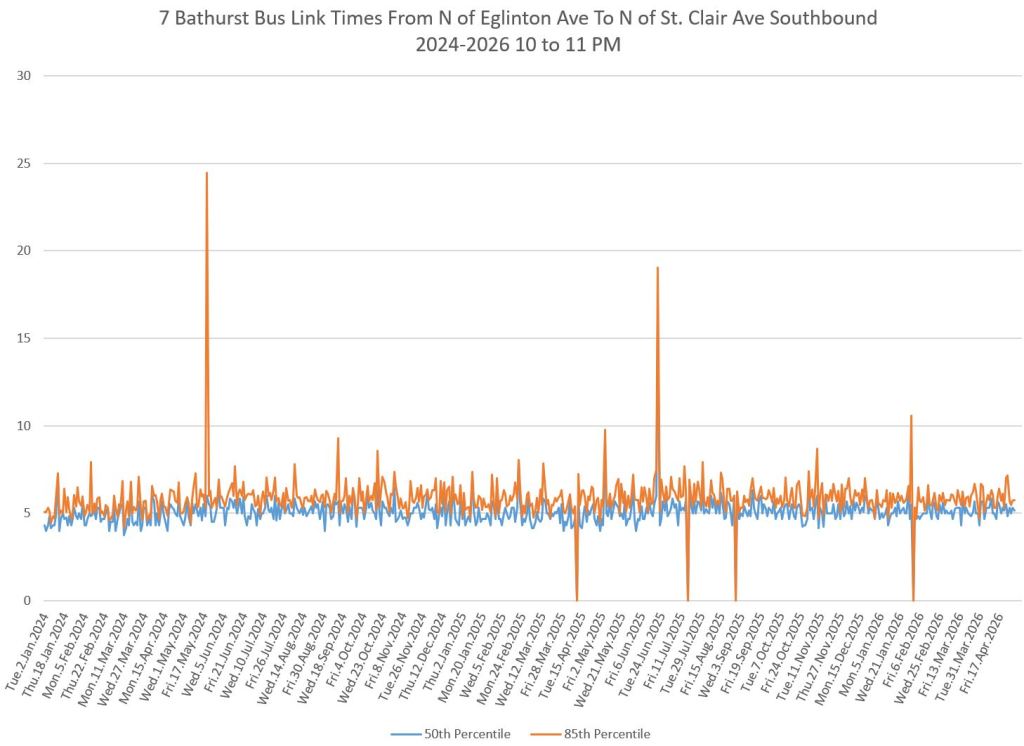
Travel Times Between Barton and St. Clair
Barton Avenue is just north of Bathurst Station, and for these measurements is used as the southern boundary. The northern boundary is just north of St. Clair Avenue West.
In these charts, the blue line shows the median value of travel times for each weekday from January 2024 to April 2026. The orange line is the 85th percentile, and it tracks fairly closely to the median line although there are spikes. Where the two lines are not close together, this shows a spread in travel times. The median might be nice to achieve, but enough trips take longer that riders will encounter them regularly.
Northbound data are on the left, and southbound on the right. There is a quite notable difference both in values with southbound travel showing generally shorter times and less dispersion of values.
There is little change in the values from Fall 2025 onward
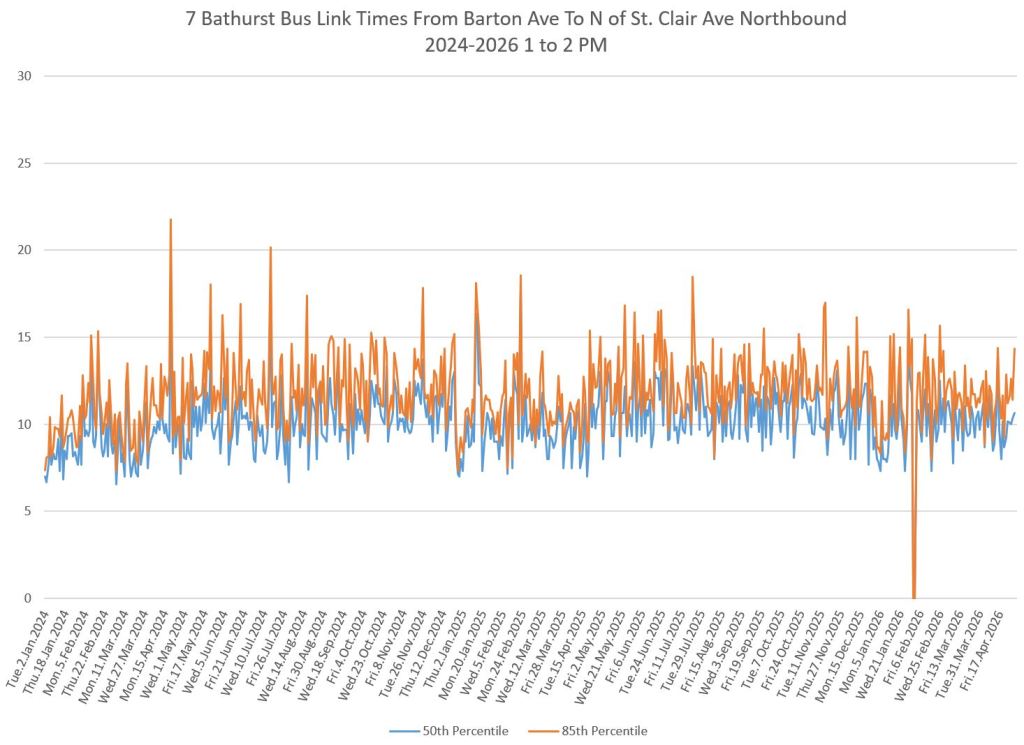
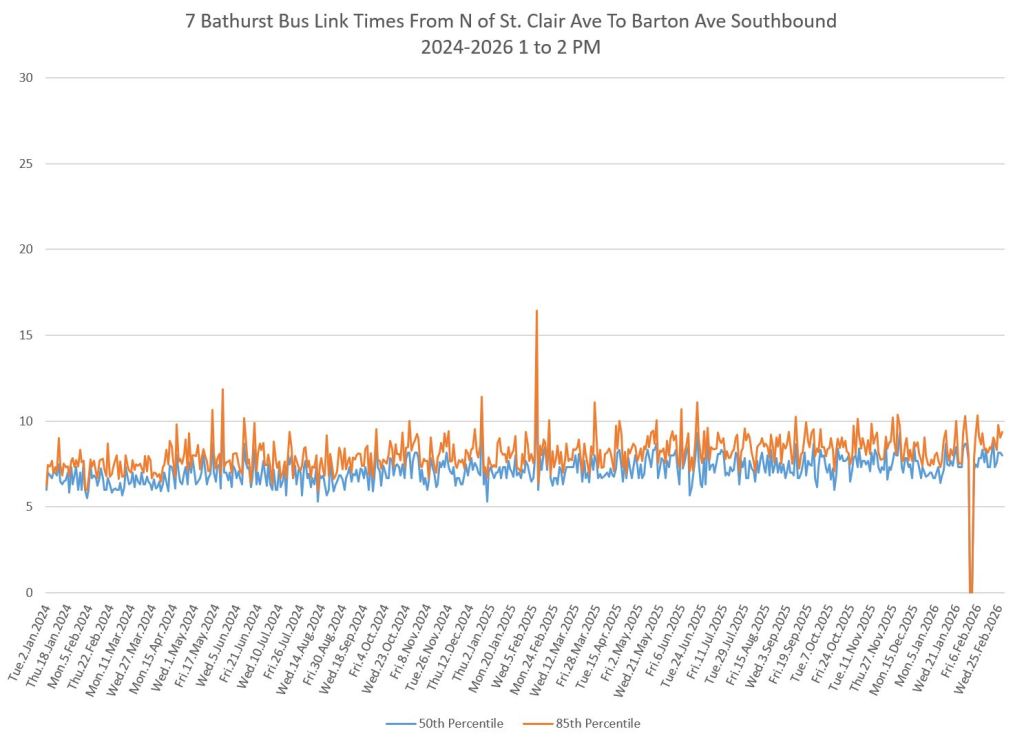
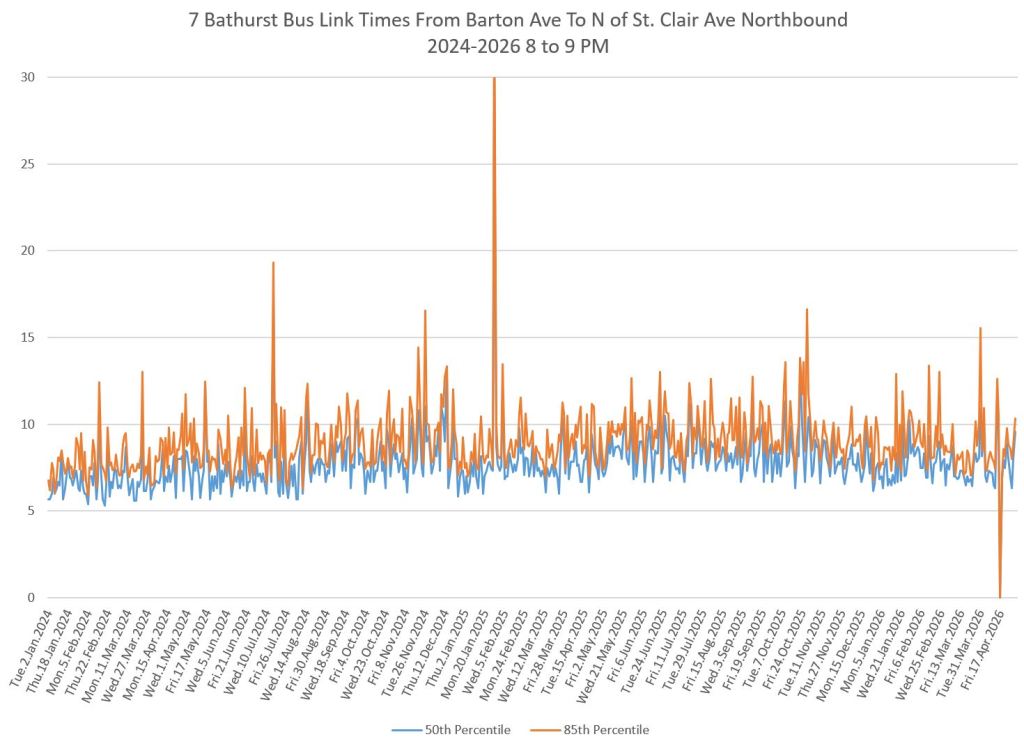
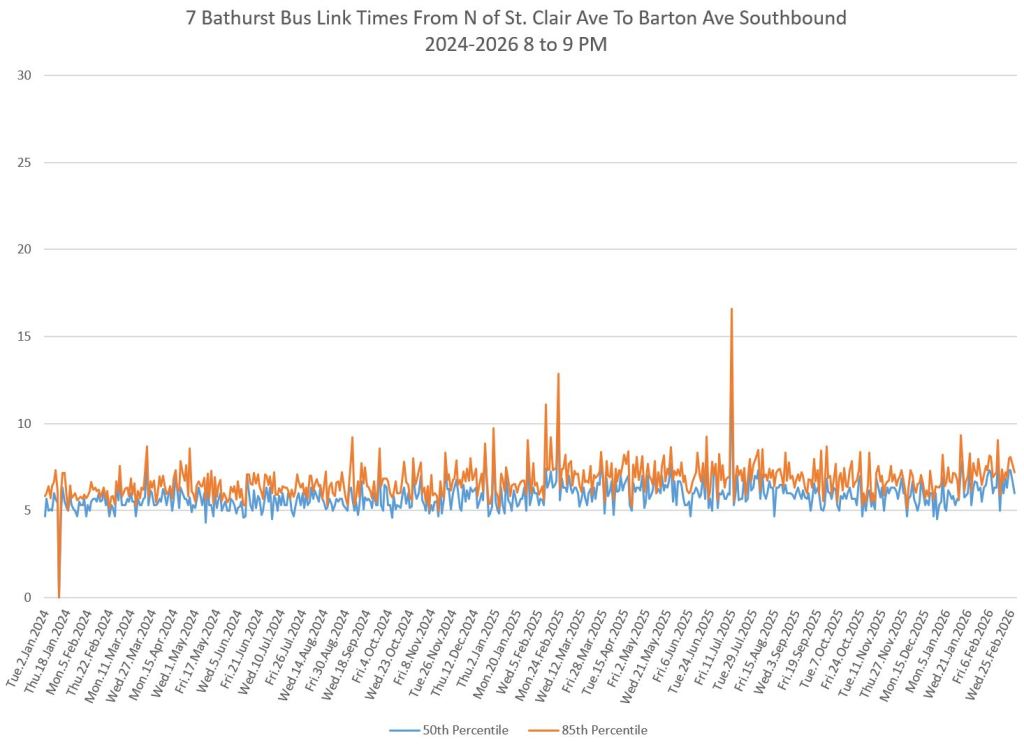
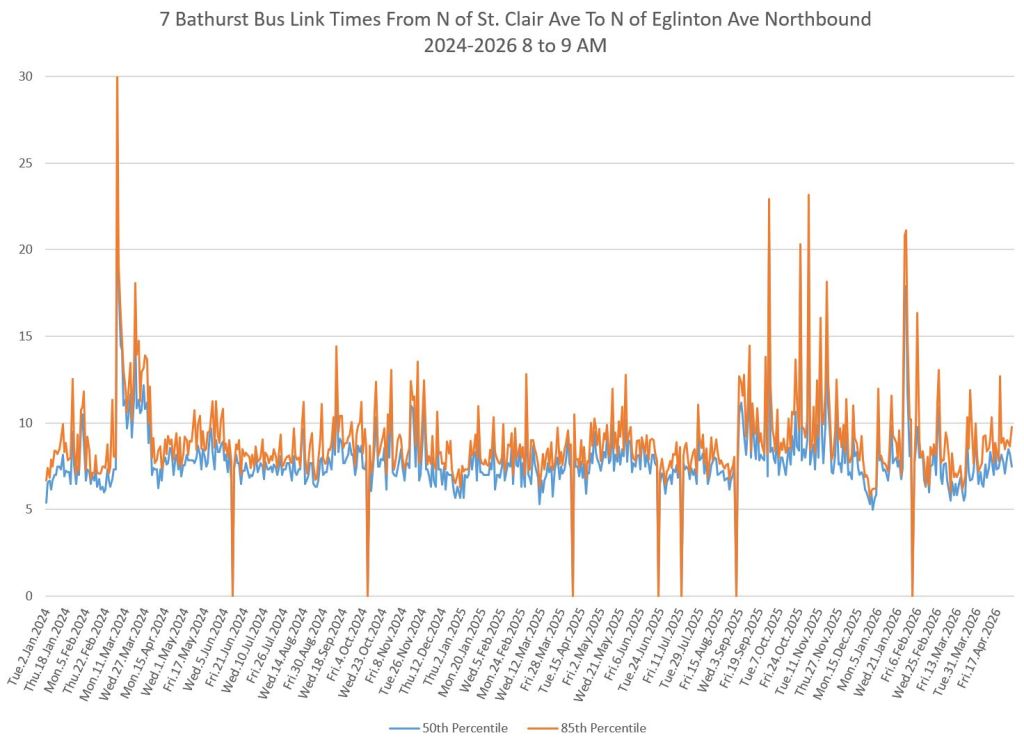
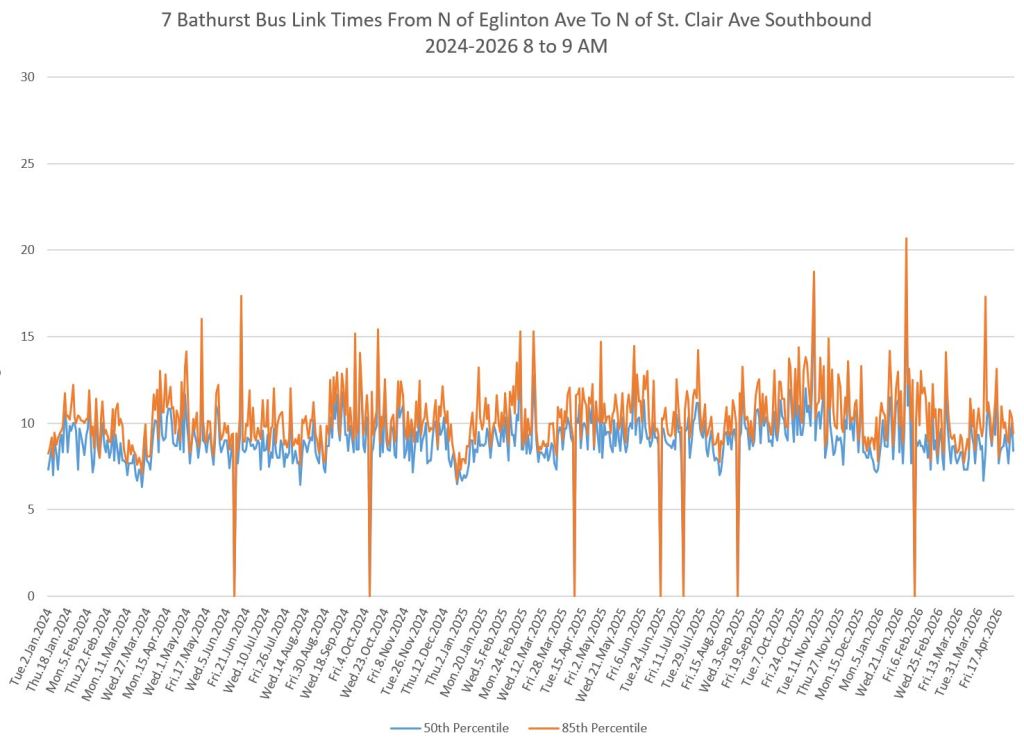
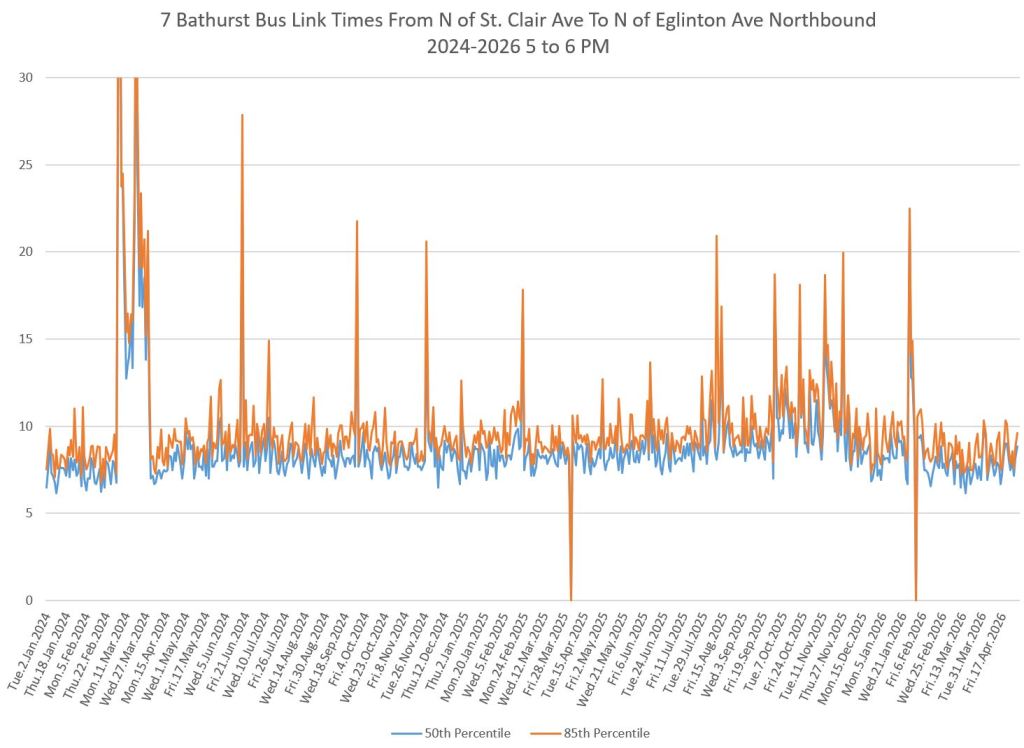
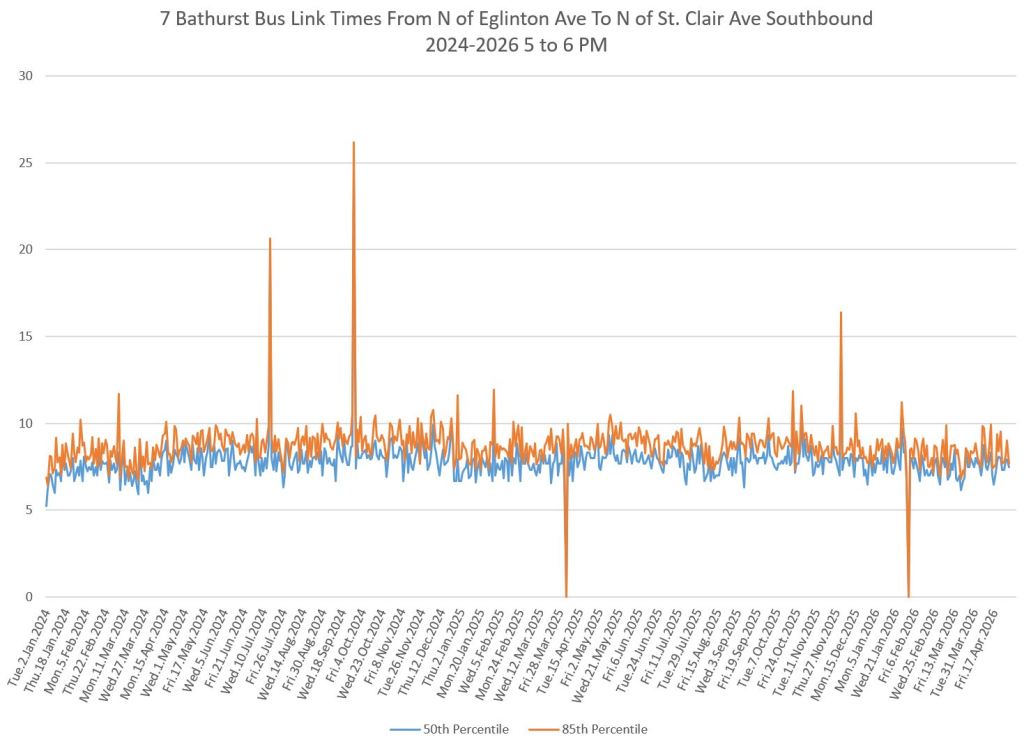
Travel Times Between St. Clair and Eglinton
The screenlines for these measurements are just north of St. Clair, and just north of Eglinton. Unlike the segment from Bathurst Station to St. Clair, there is little difference in travel times for each direction, and much less dispersion in values.
Northbound travel times are moderately better over the short term in the AM peak, but current values are similar to those in 2024 and 2025. There is a slight decline in the evening, but not substantial.
Details of April 2025 and April 2026
Any comparison of past and present data must use periods with similar conditions. For example, Spring and Fall months cannot be compared to December through February because of holidays and weather. March typically has a dip in travel times and demand thanks to school breaks. This is why I have waited for April data.
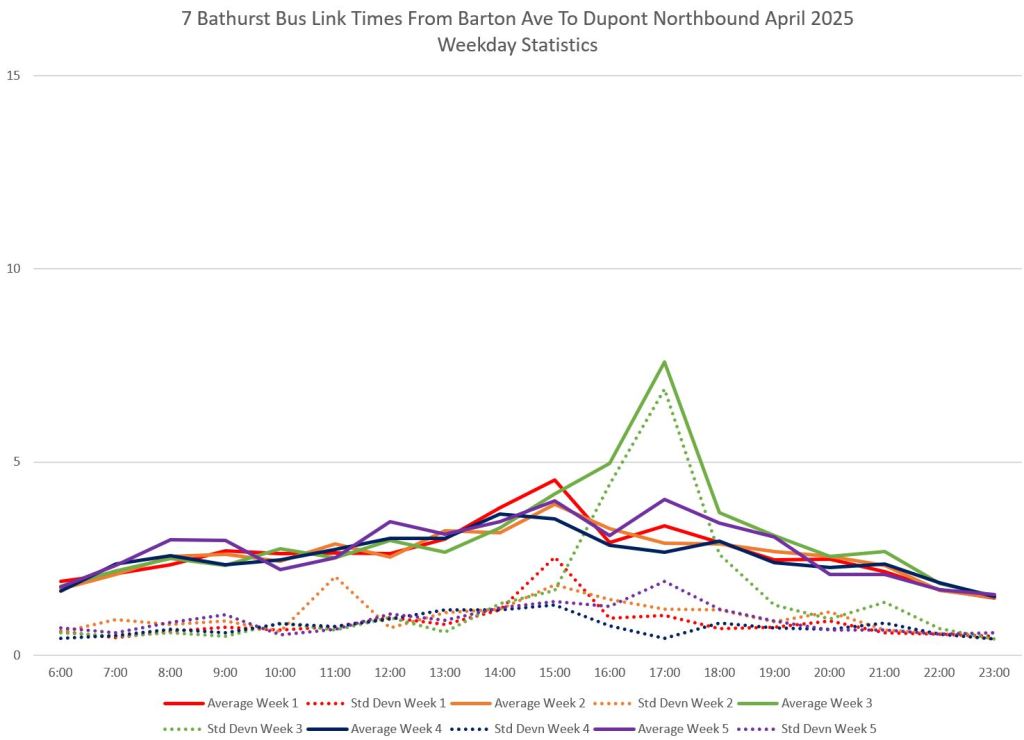
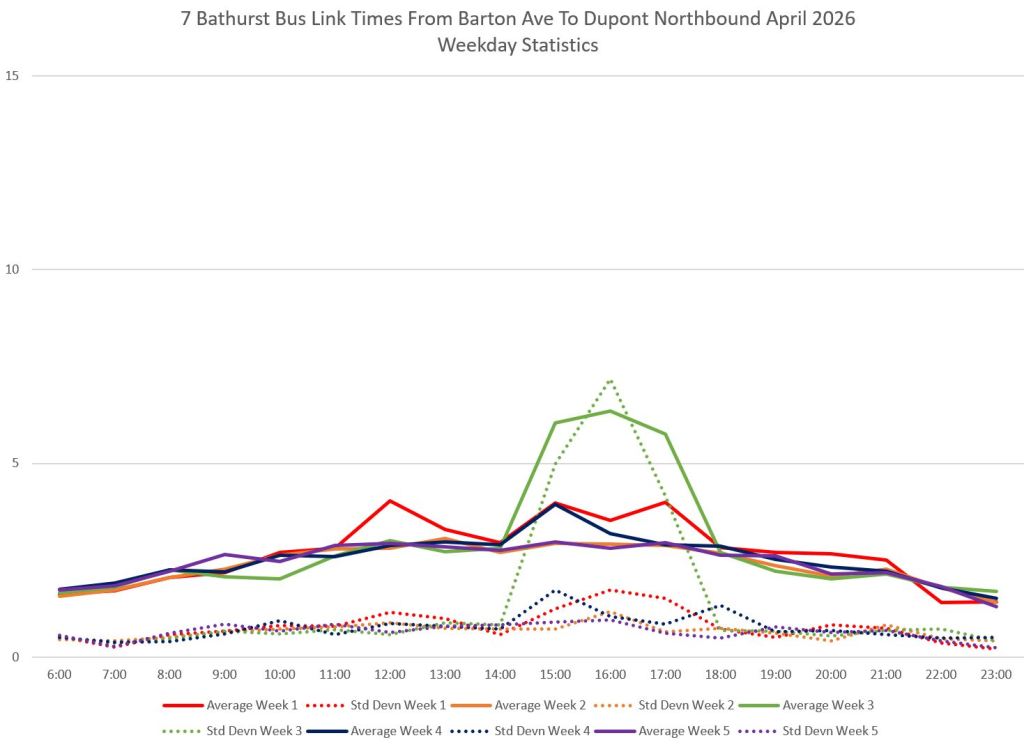
Northbound from Barton to Dupont
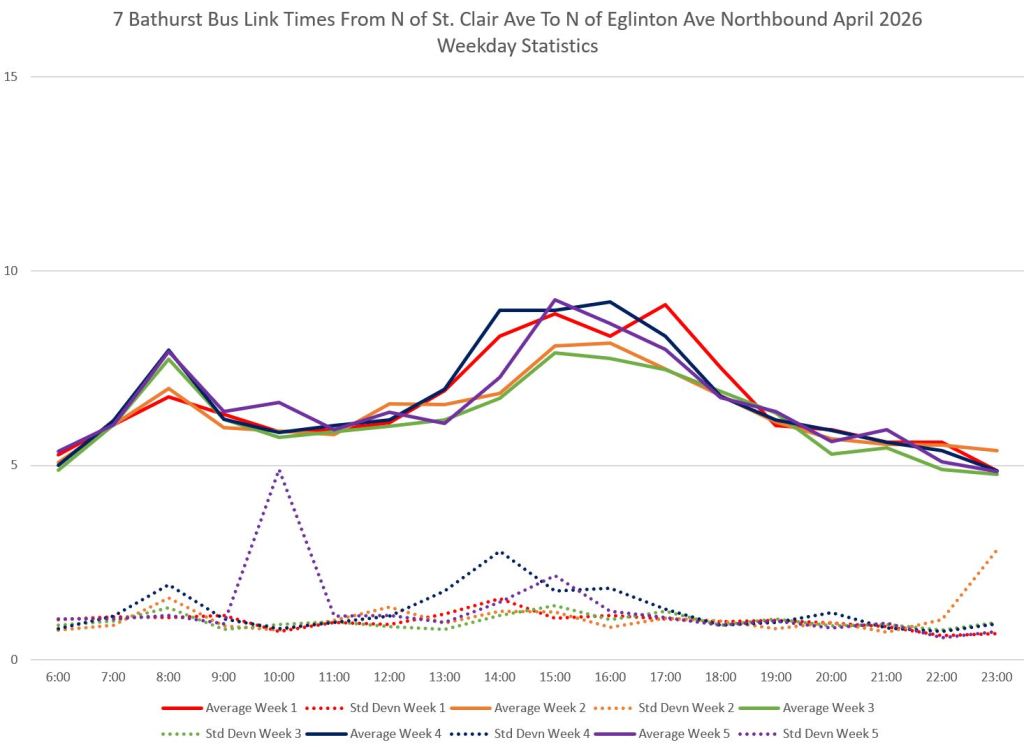
The overall weekday stats for both Aprils are shown below. By odd co-incidence, both years saw a big jump in travel times thanks to congestion primarily on the Thursday of Week 3. This causes the rise in the green lines tracking the averages (solid) and standard deviations (dotted).
In this segment the primary change was to extend the “no stopping” hours from 2pm to 7pm weekdays on the northbound (east) side of Bathurst, and from 12pm to 7pm on weekends. There is a small reduction in the hourly averages between 2pm and 7pm, but not much.
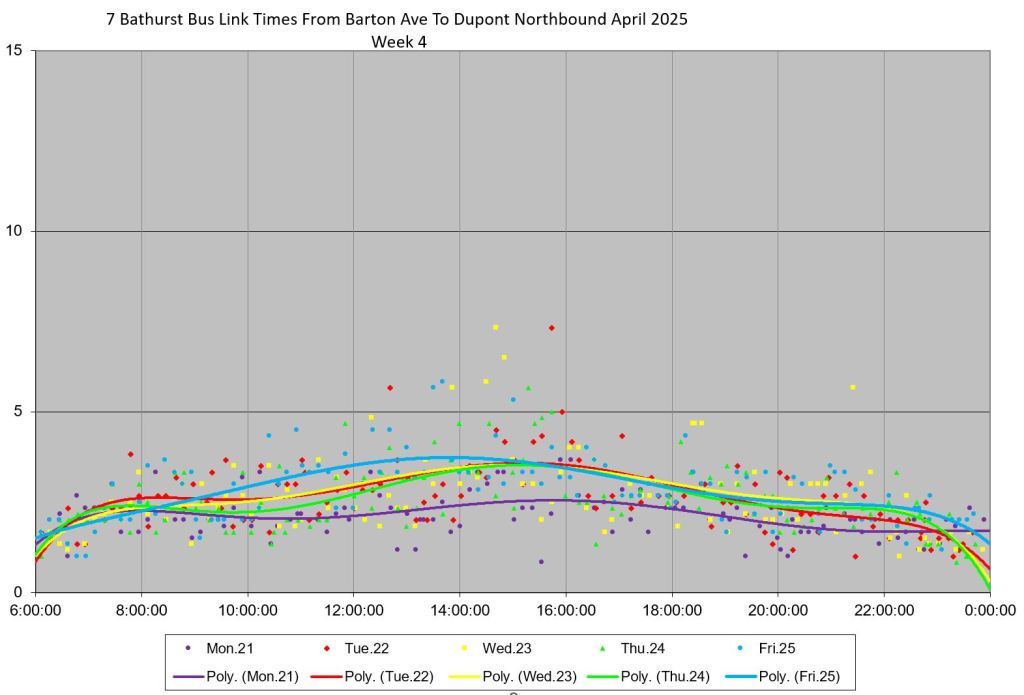
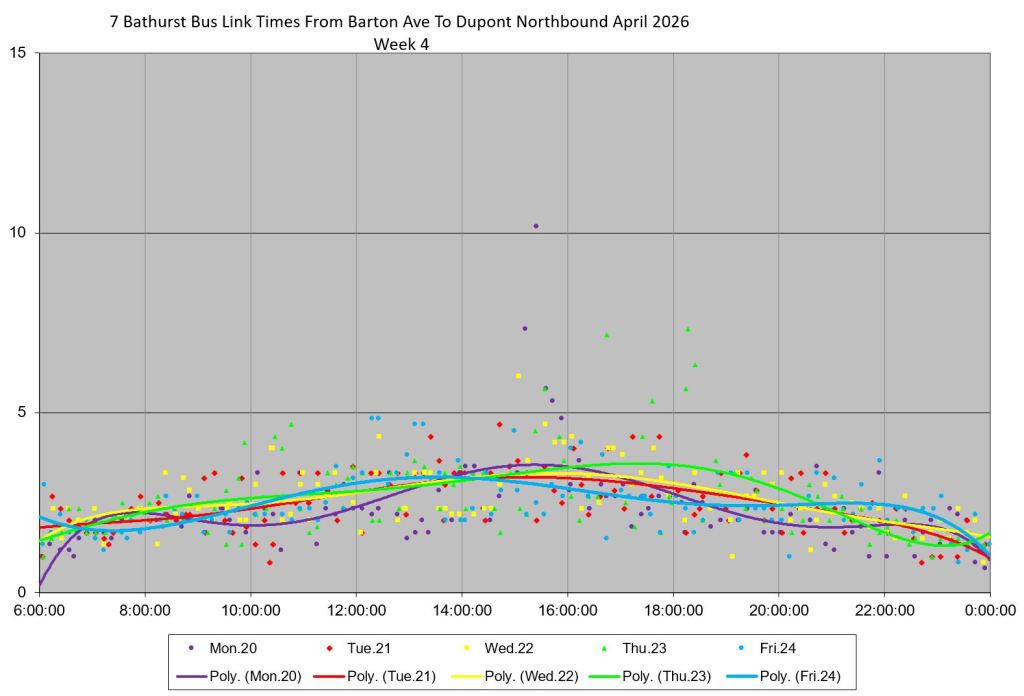
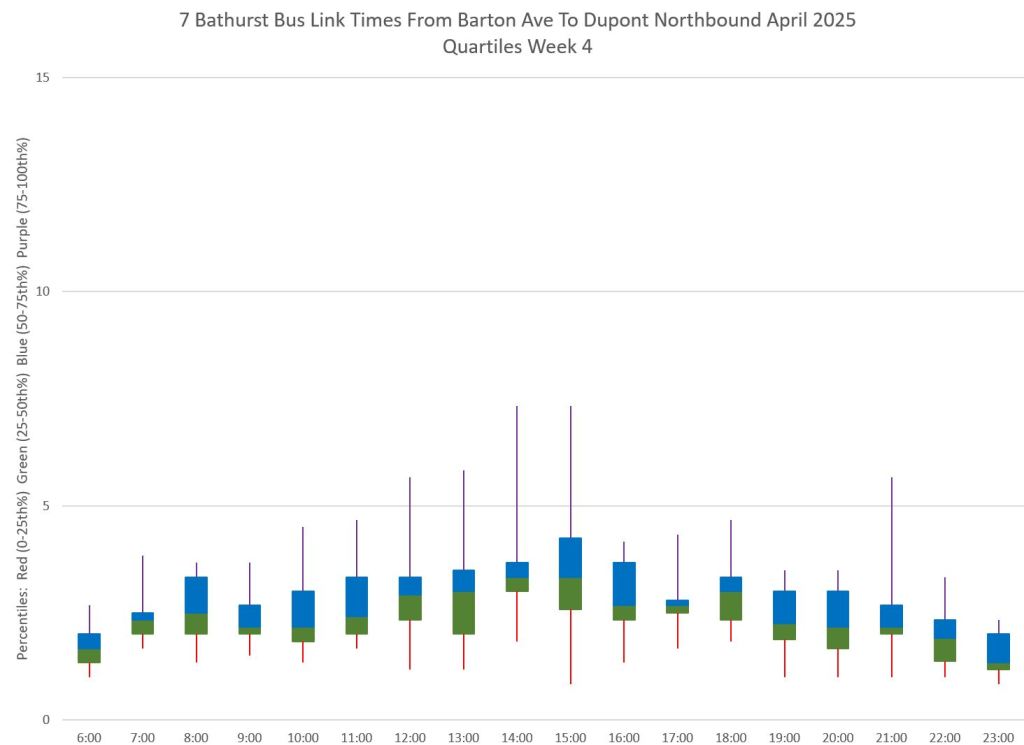
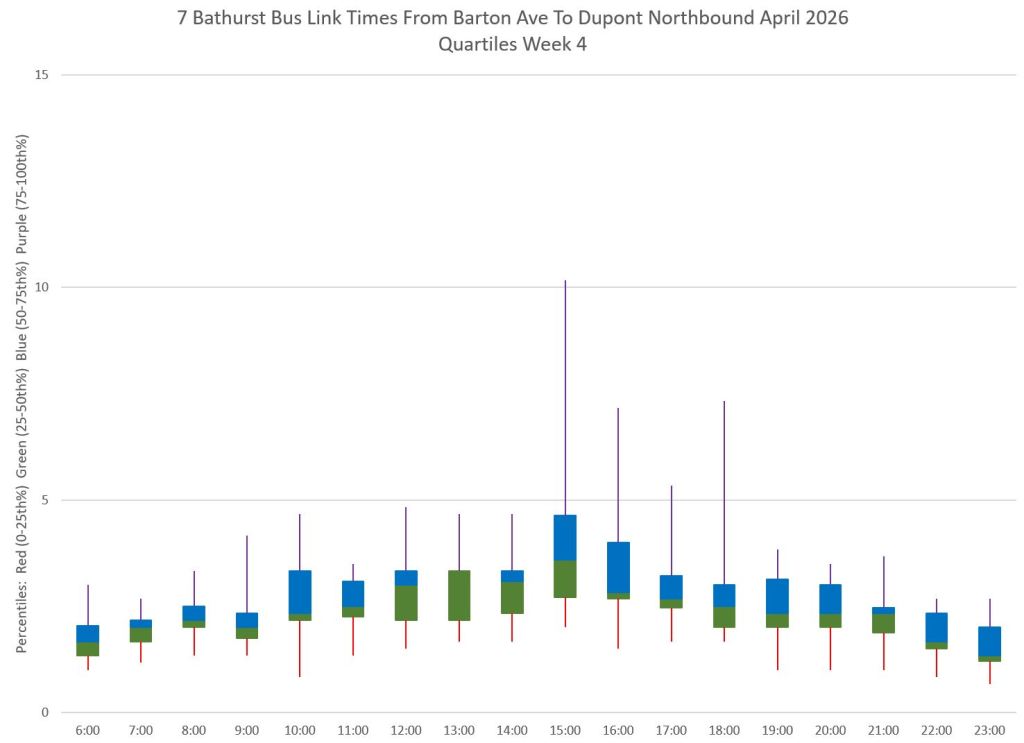
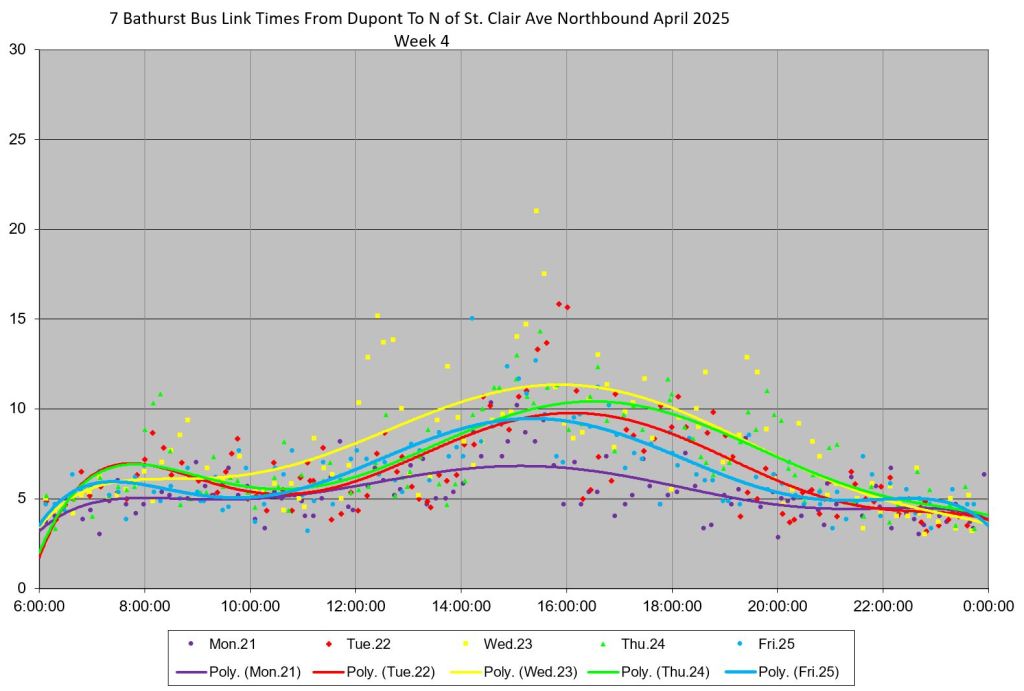
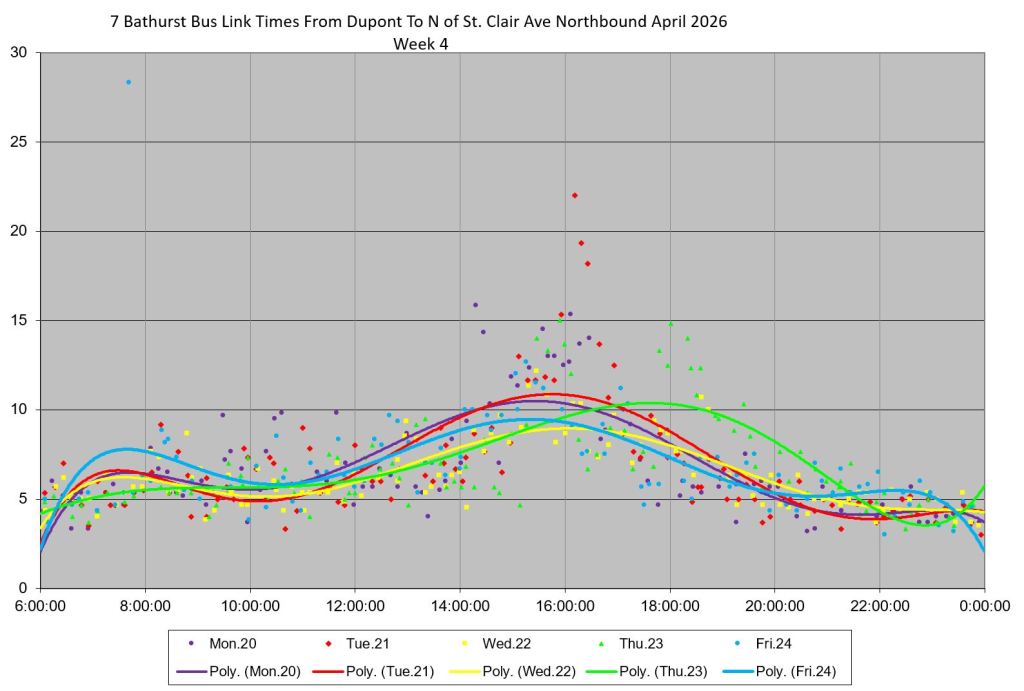
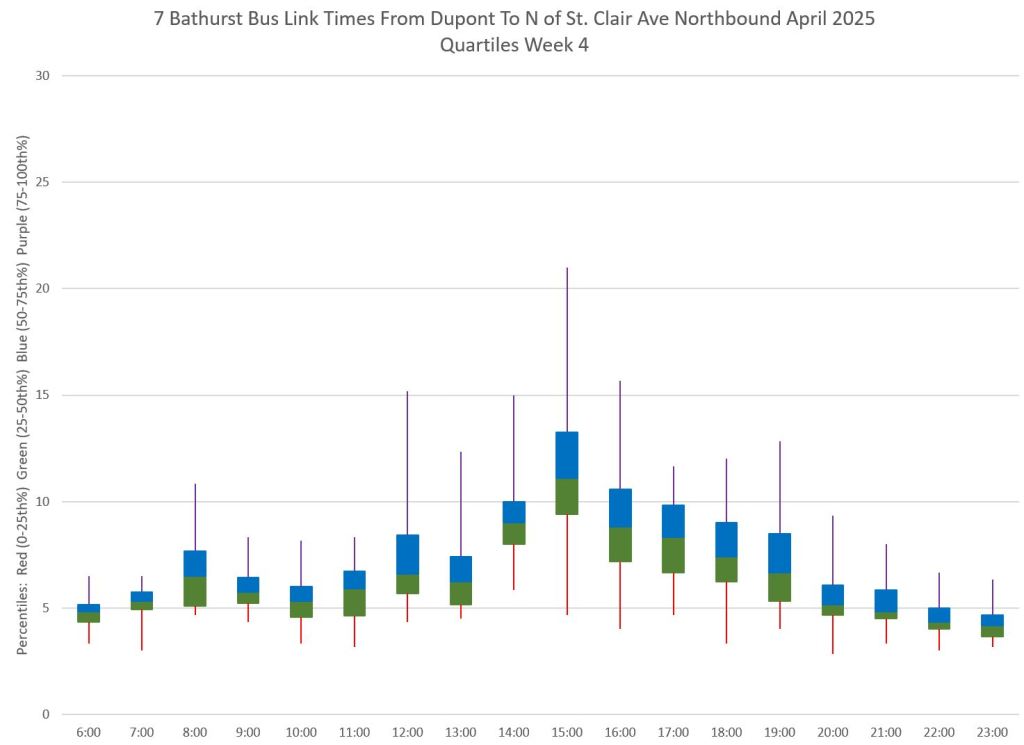
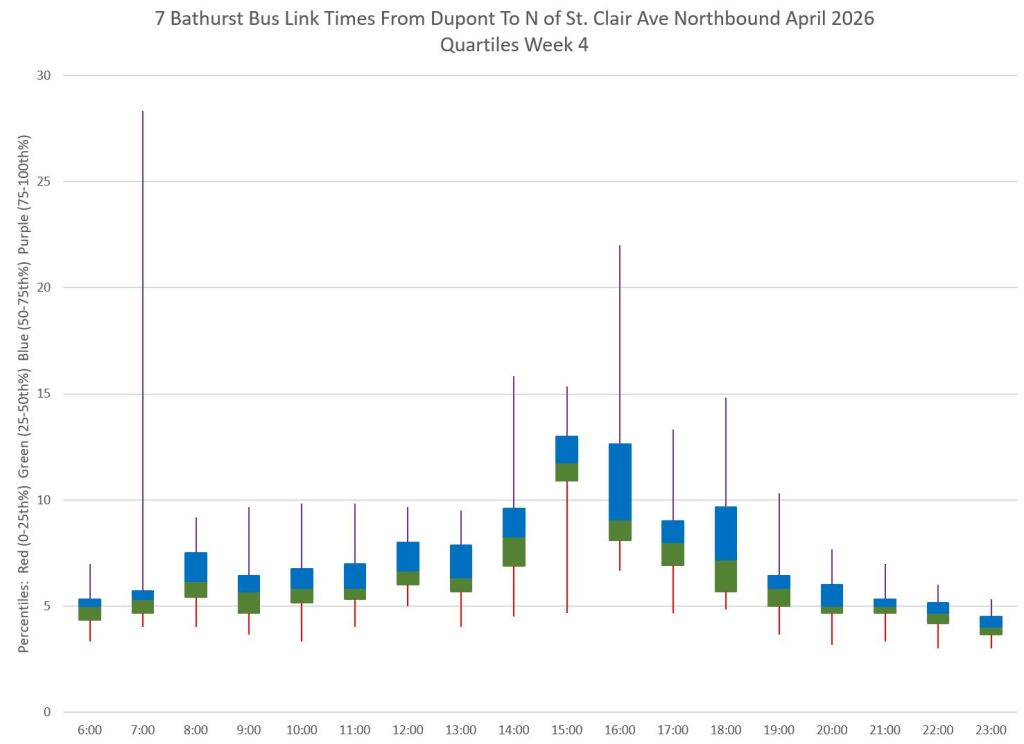
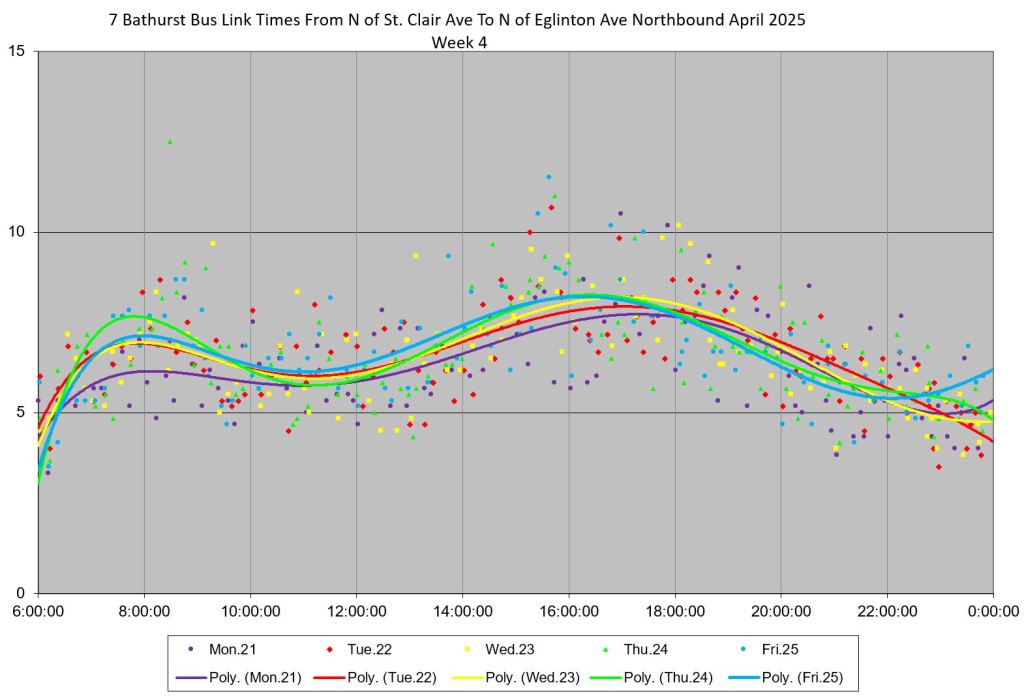
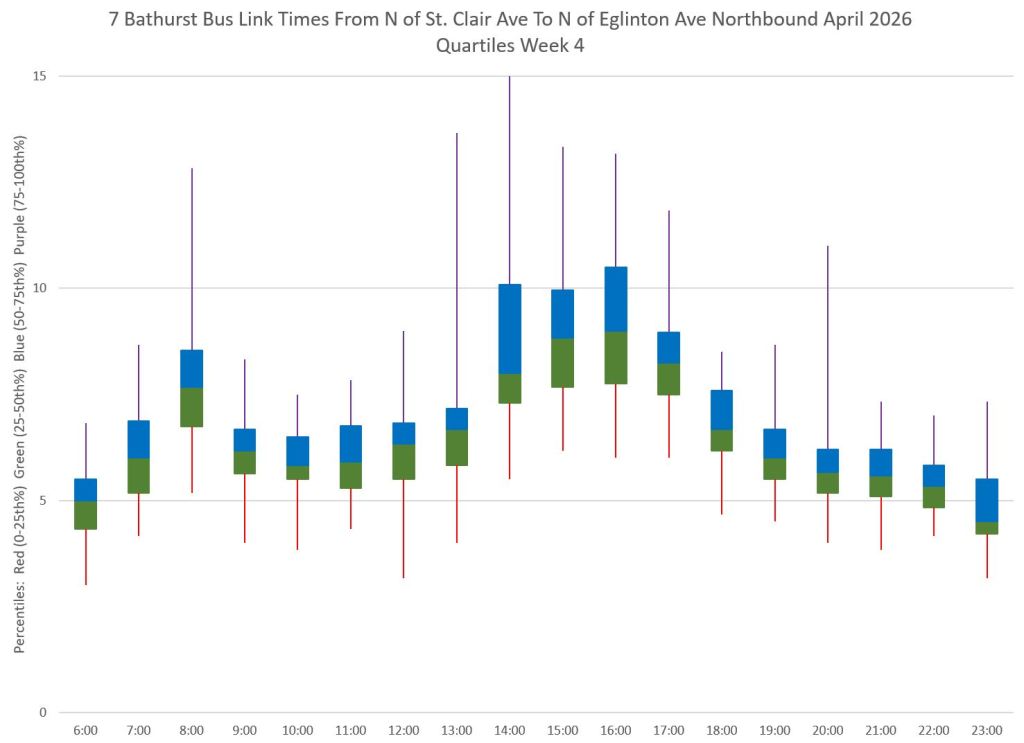
As a sample of the detailed data, the next group of charts shows week 4 for both years. There is little change from 2025 to 2026. Note that Monday, April 21, 2025, was Easter Monday which typically has lower than average demand and traffic congestion. This is reflected in its trend line (purple) lying below the lines for other days of the week.
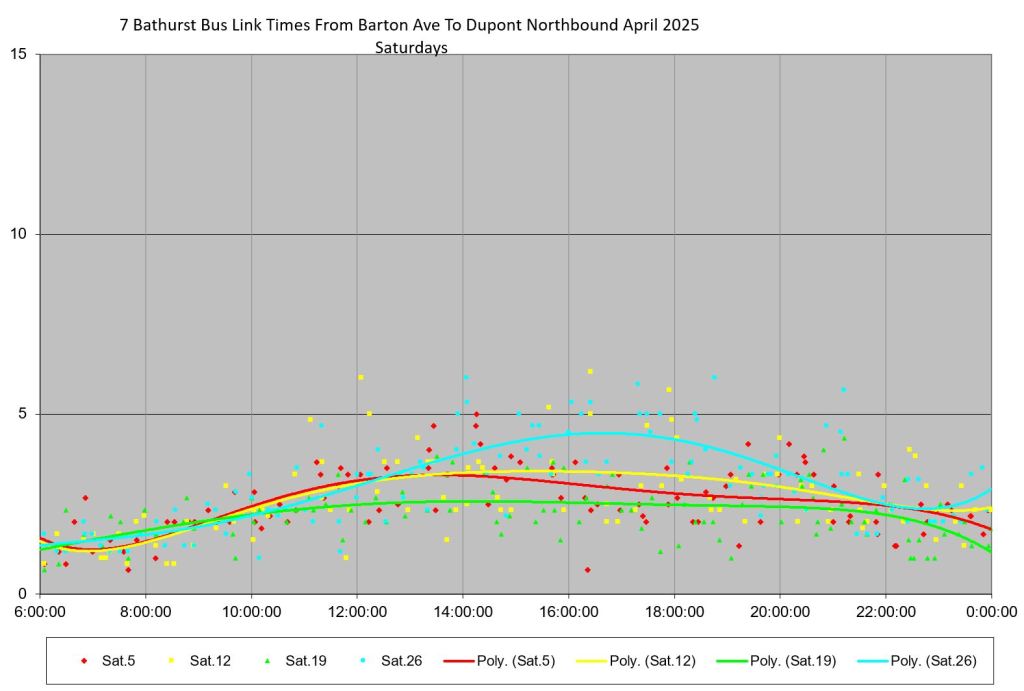
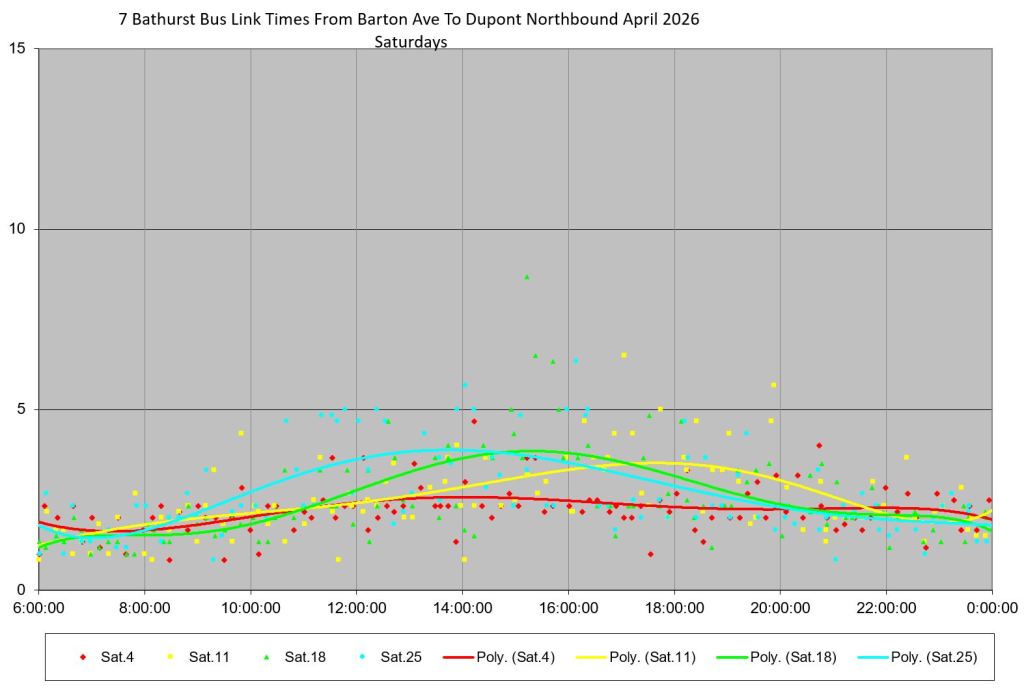
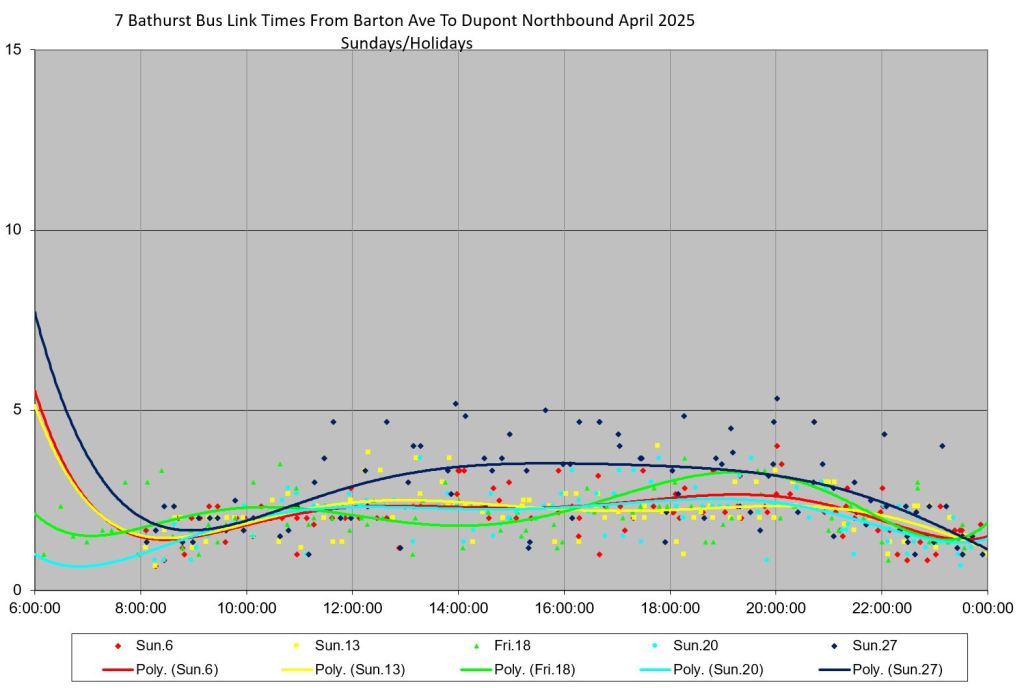
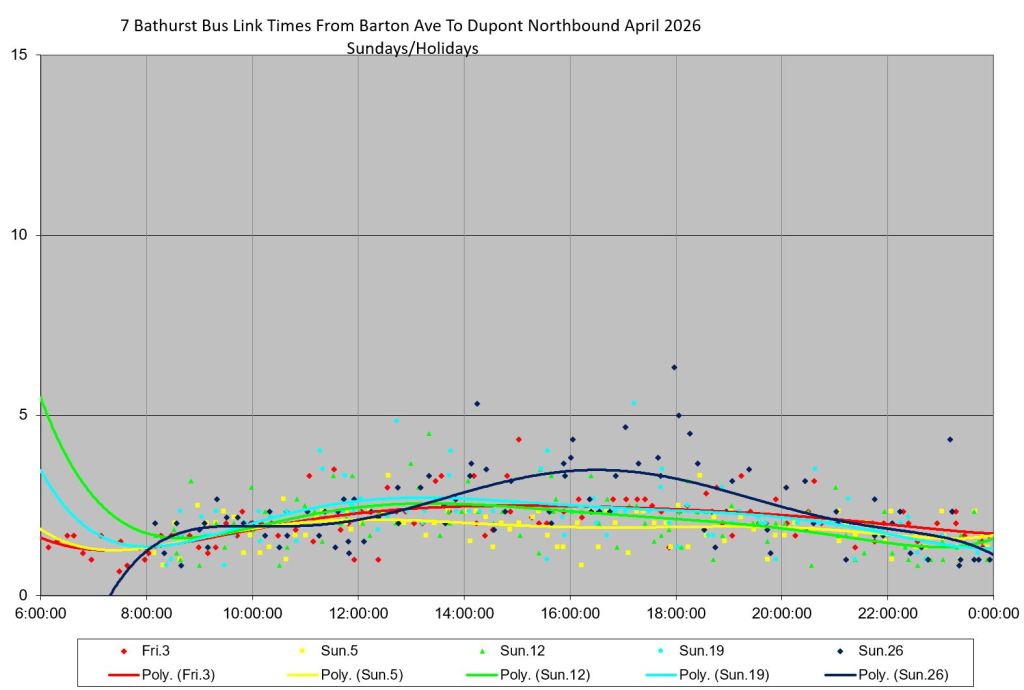
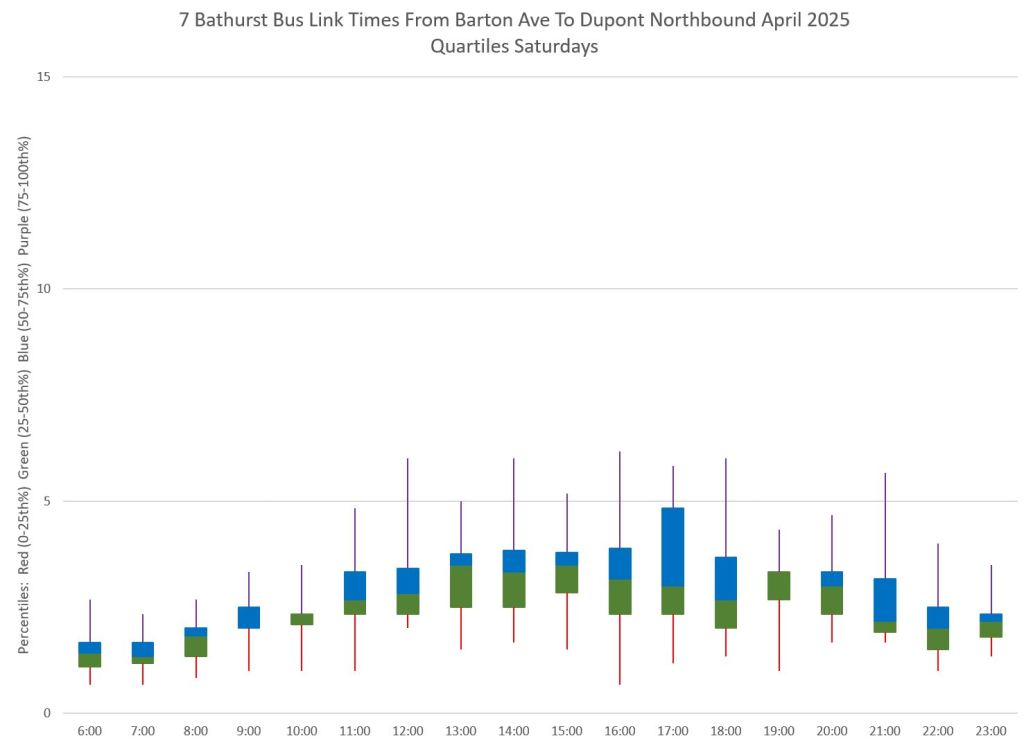
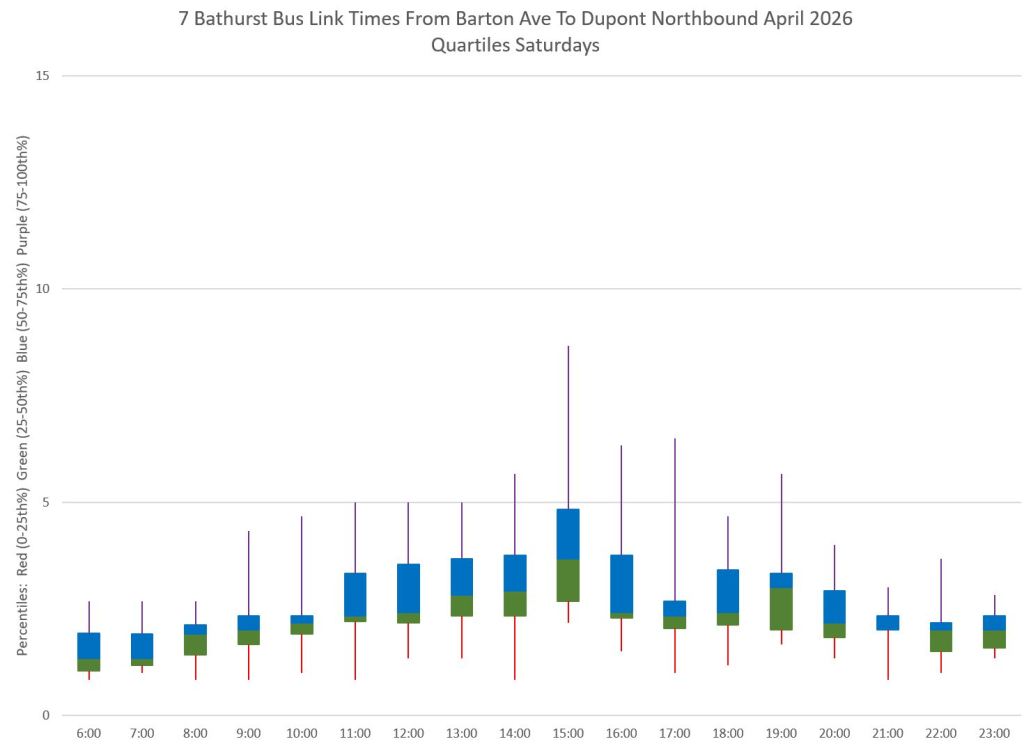
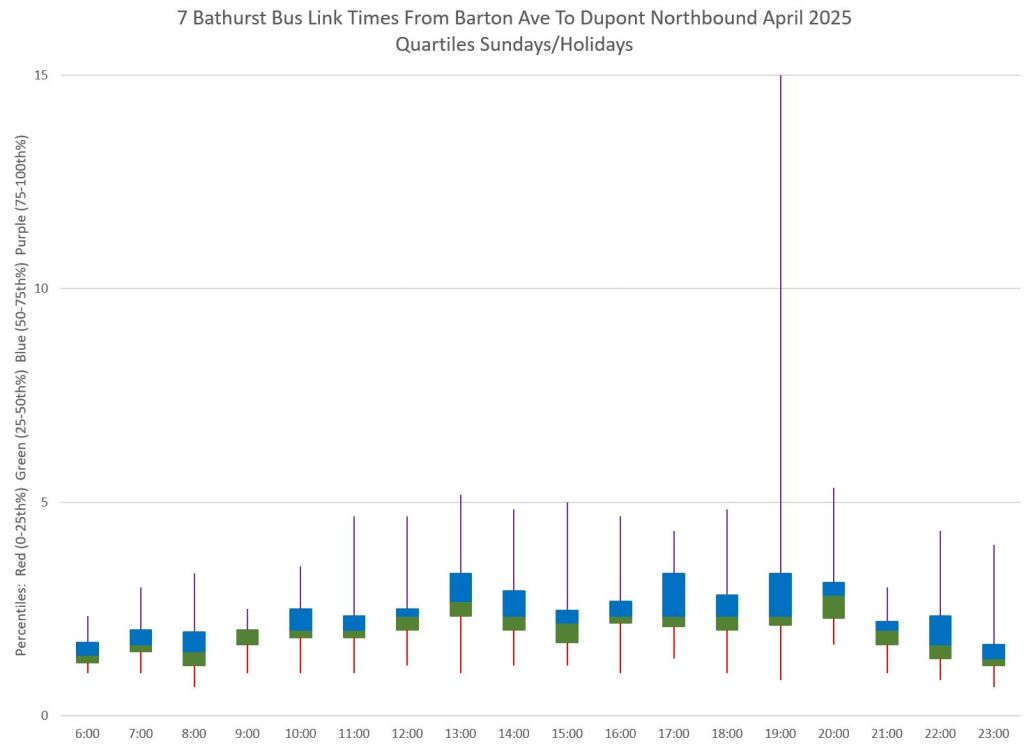
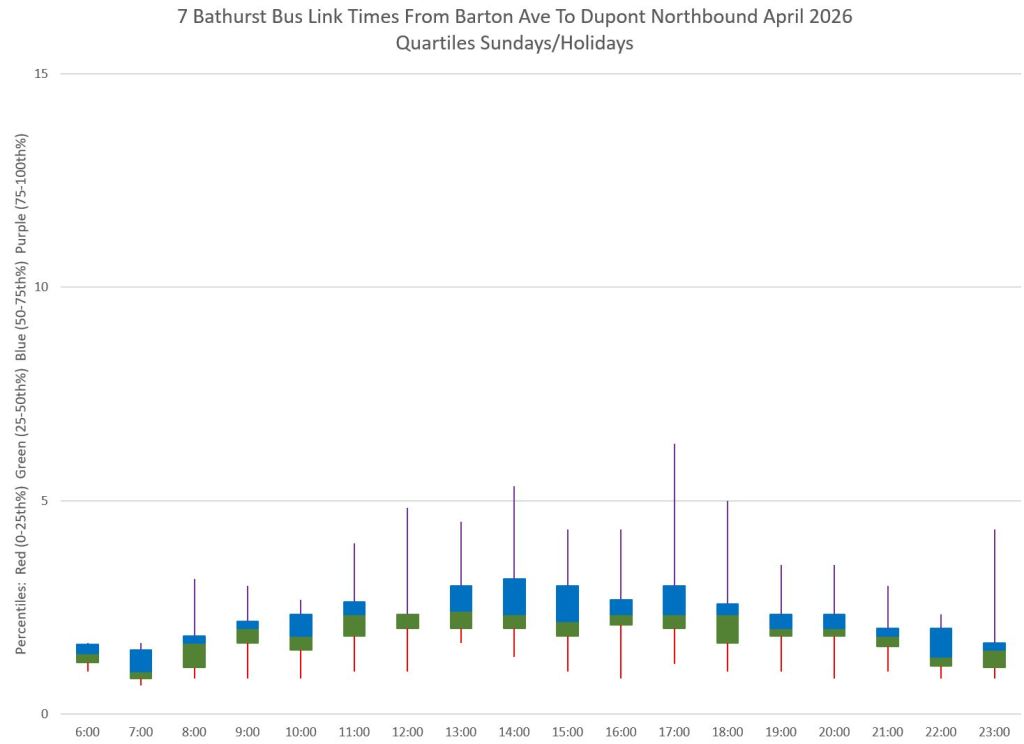
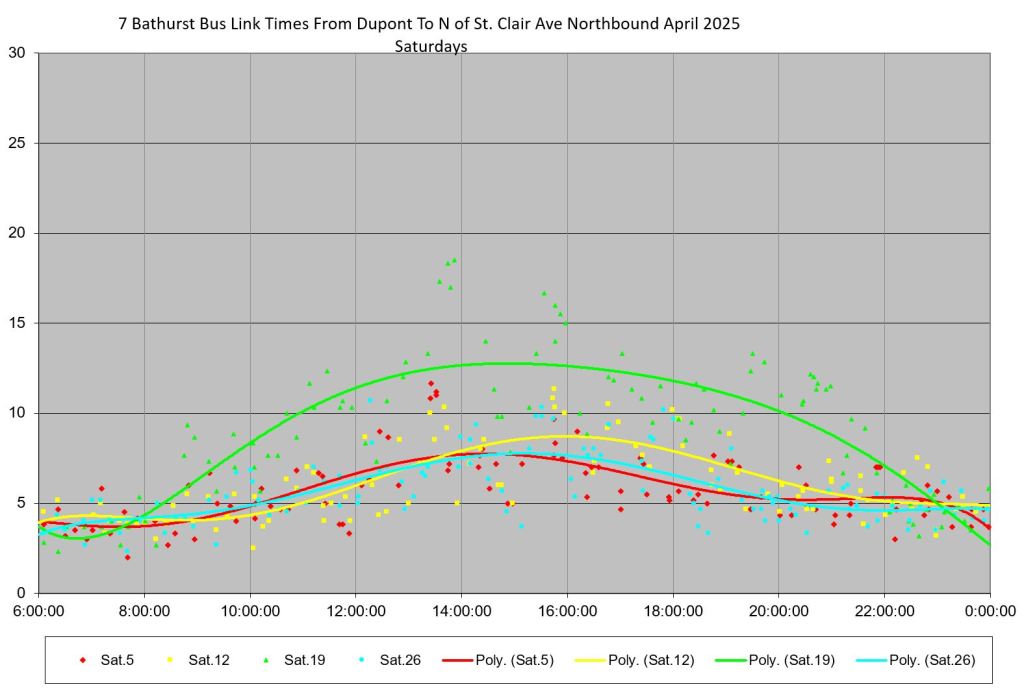
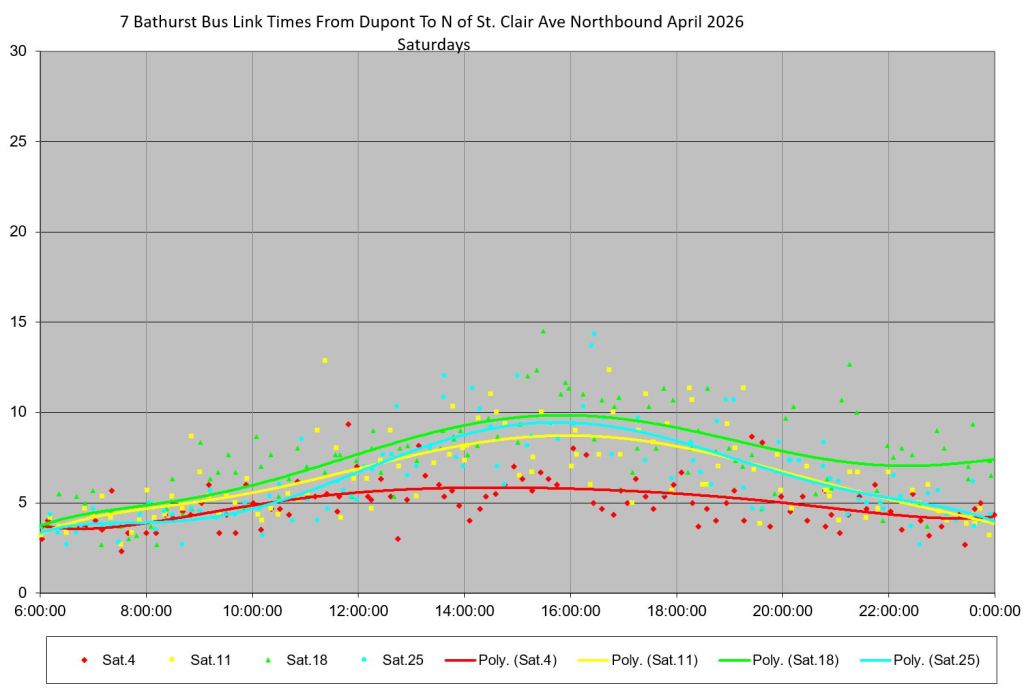
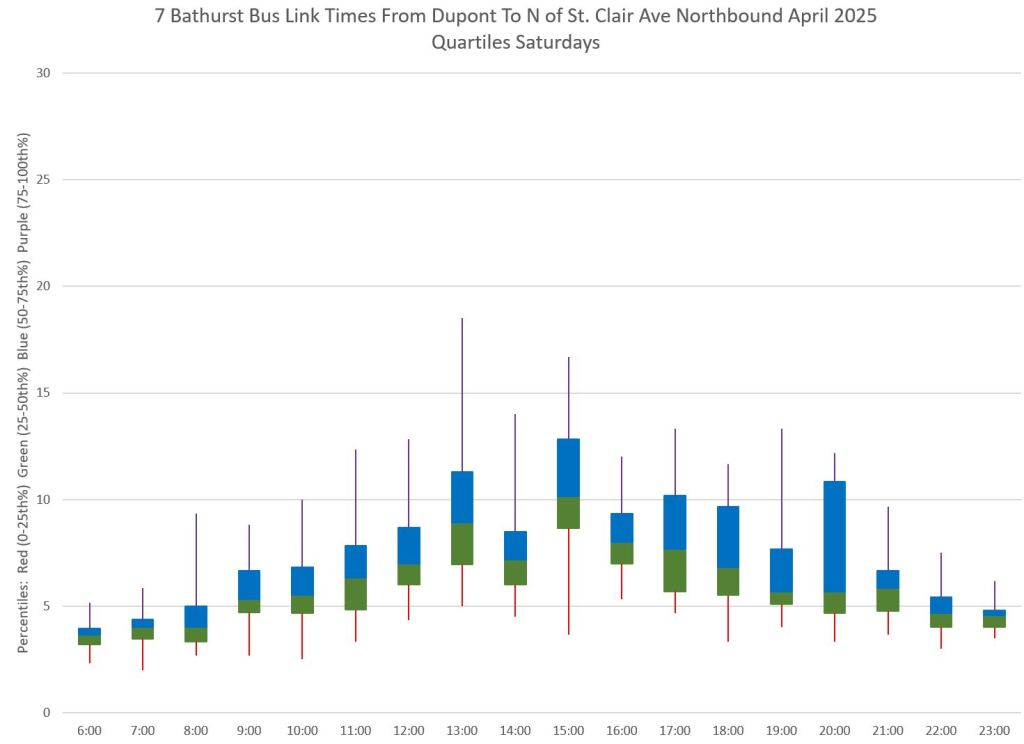
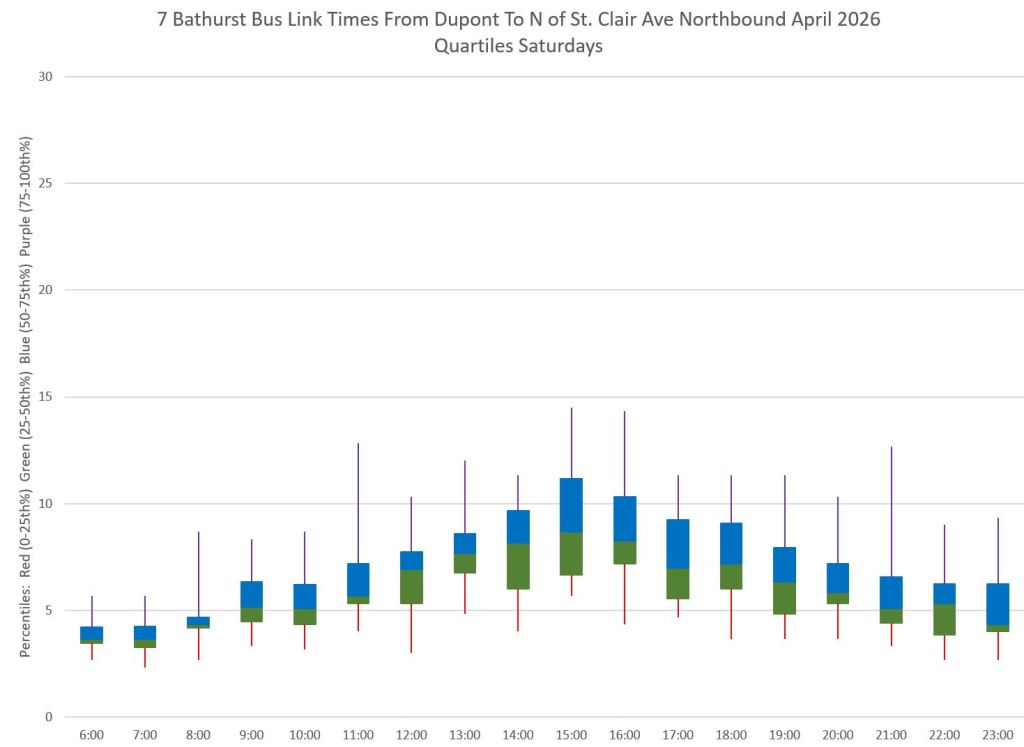
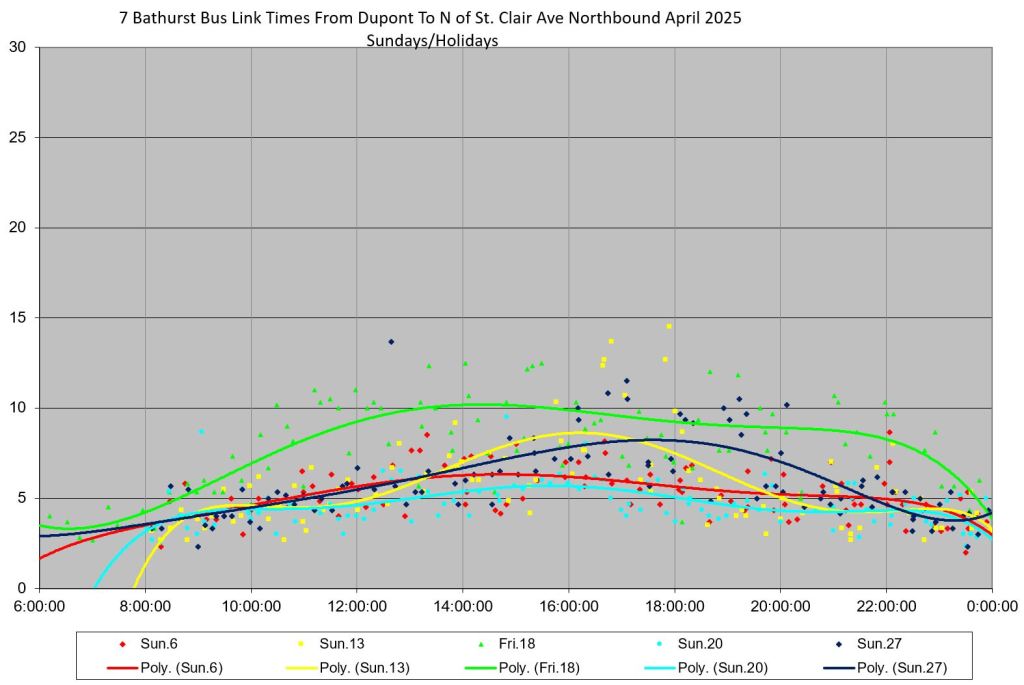
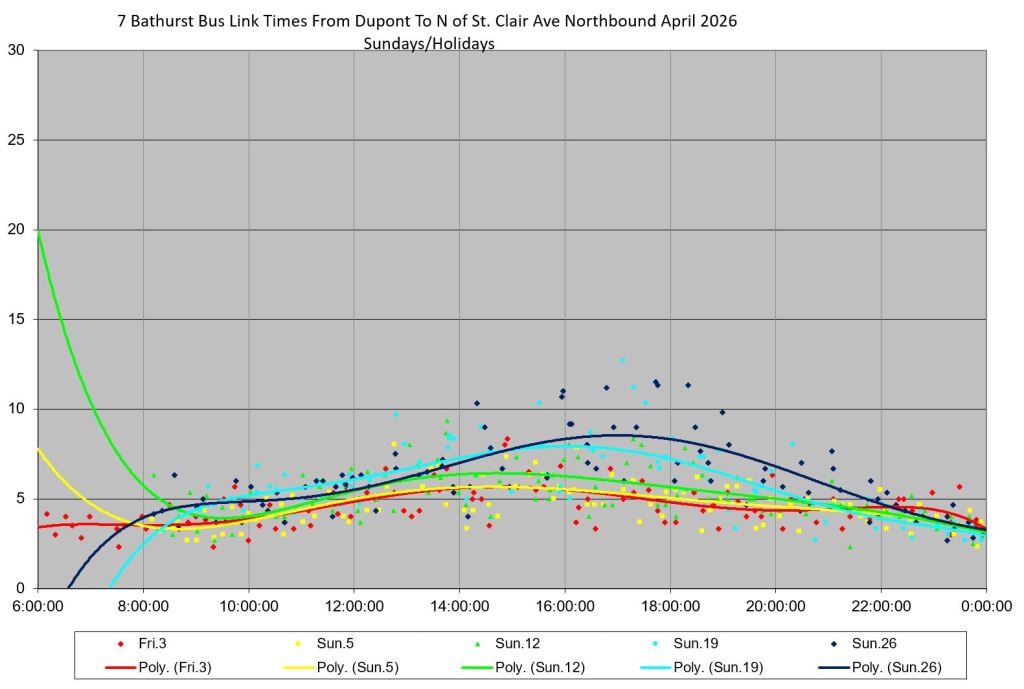
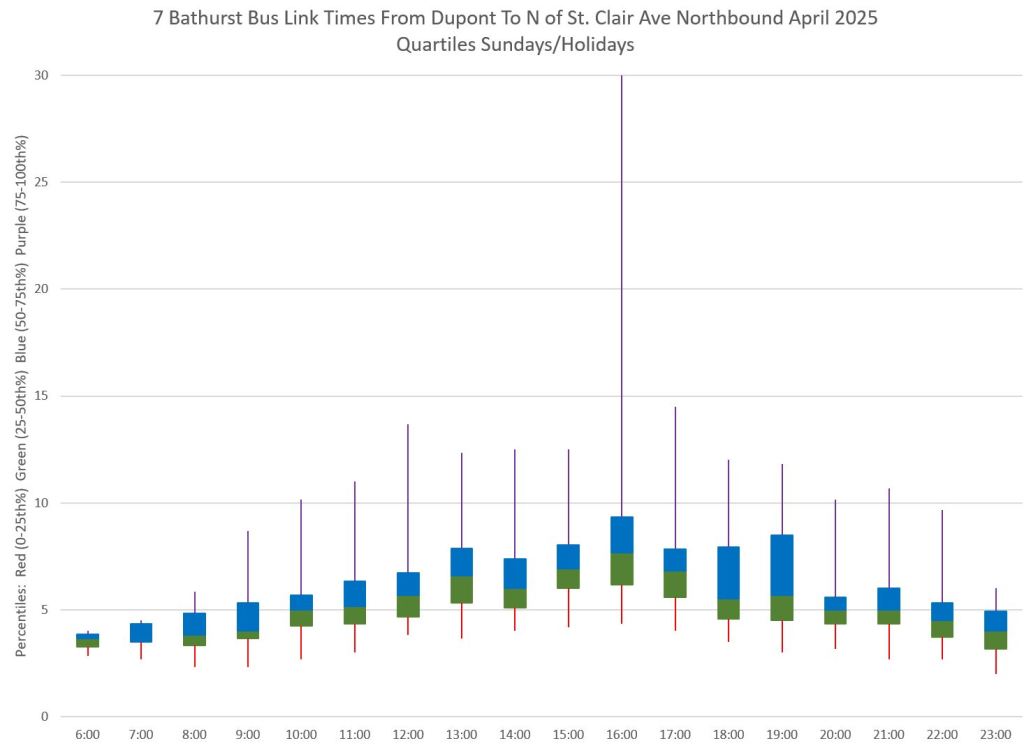
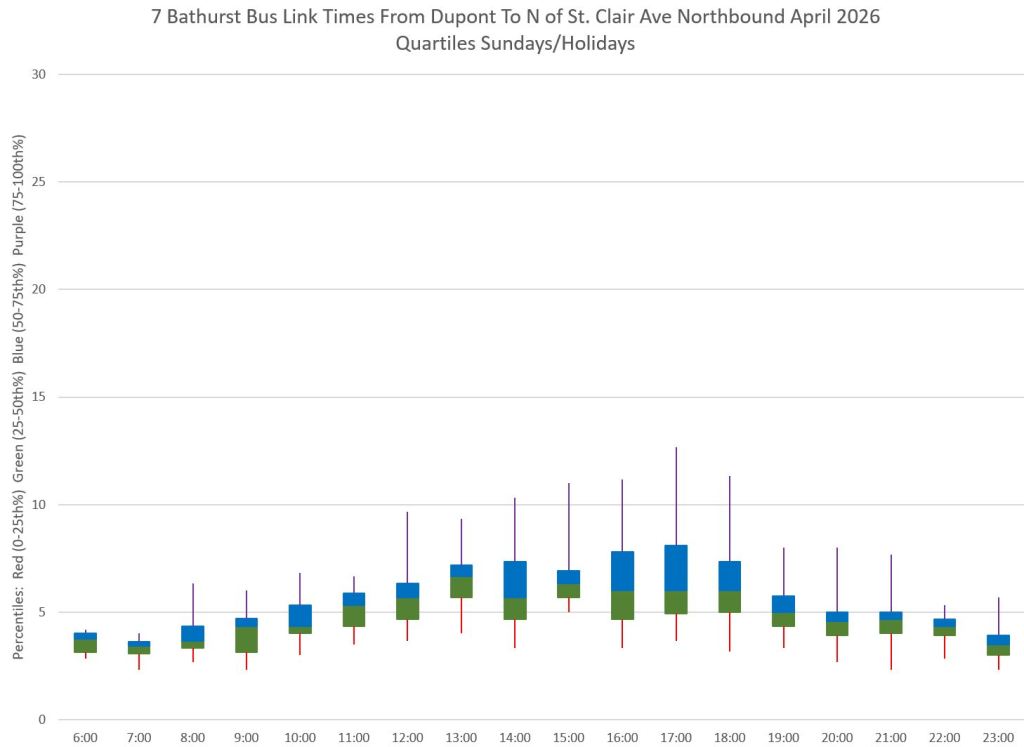
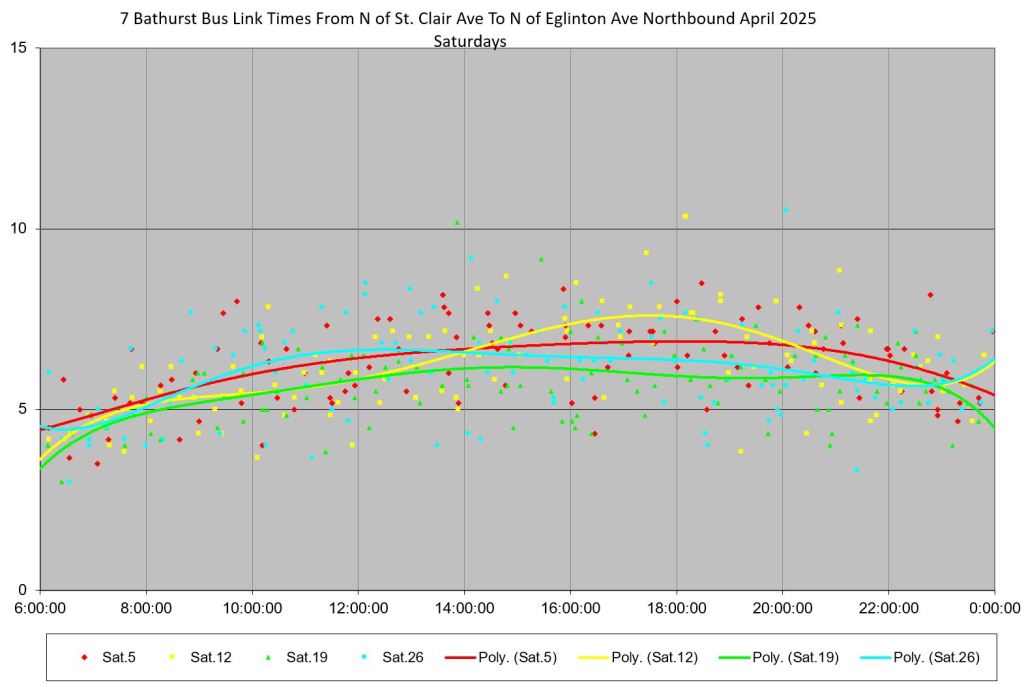
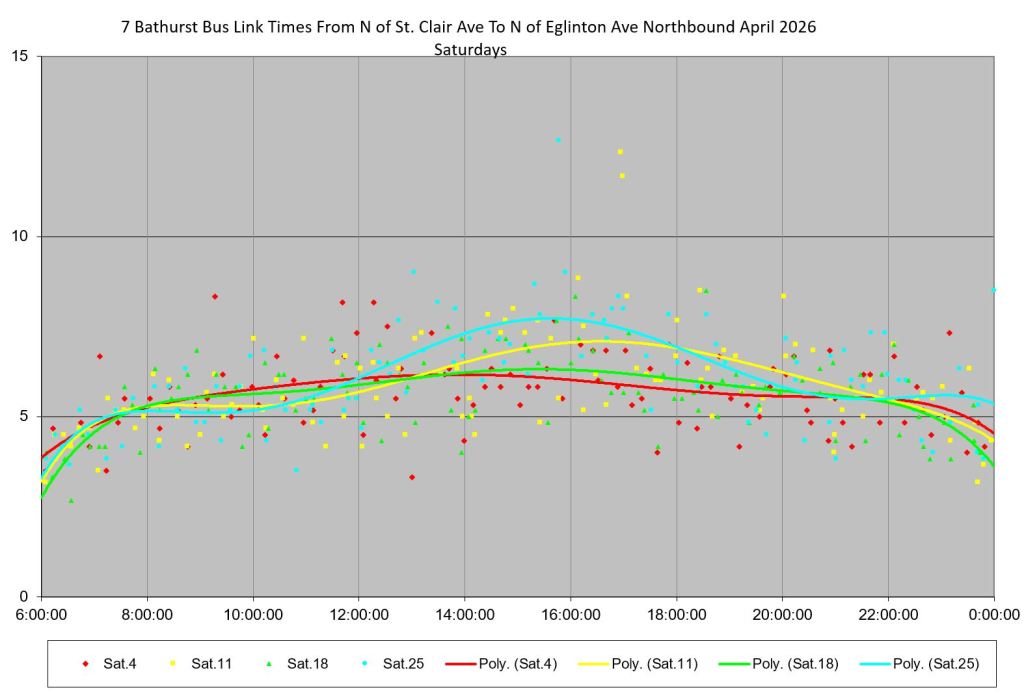
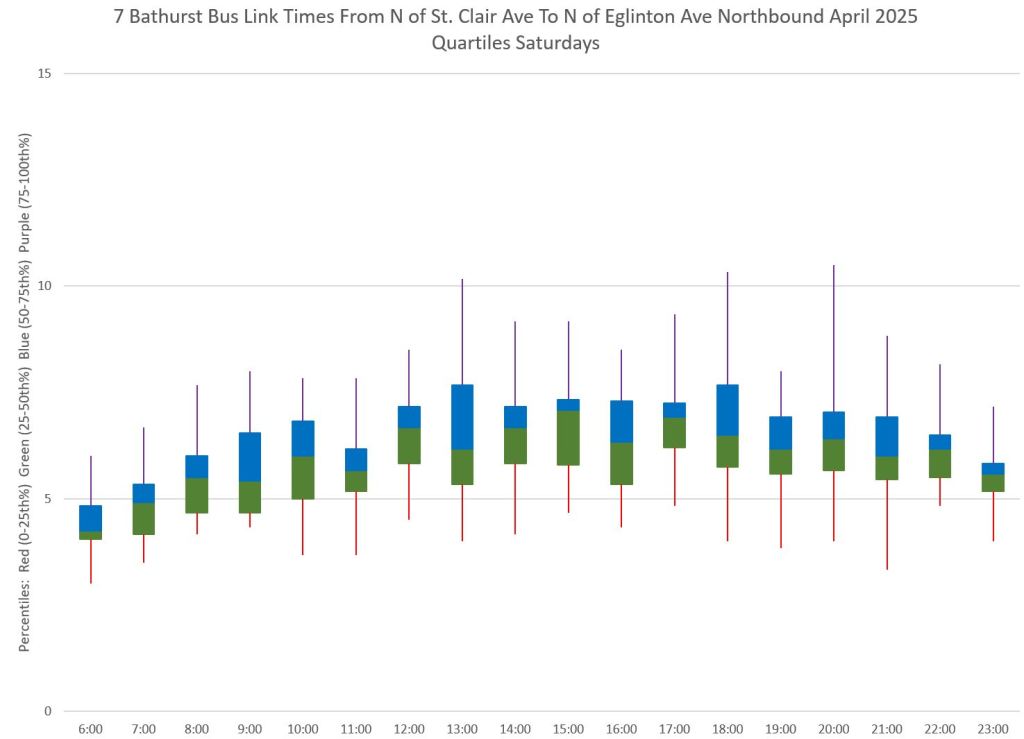
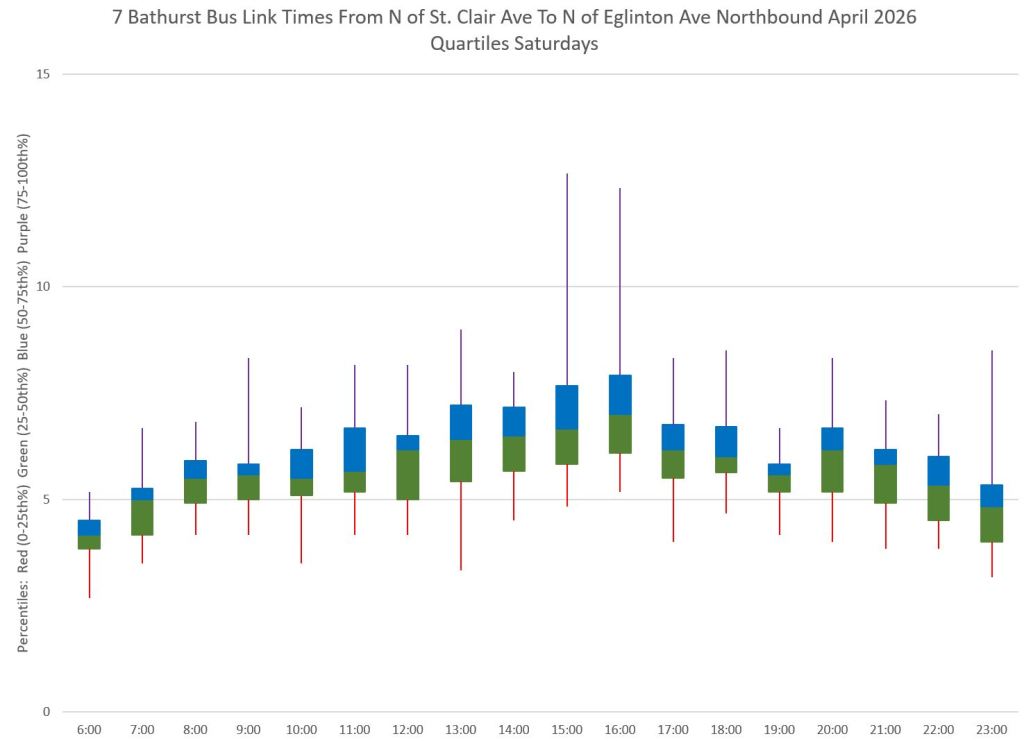
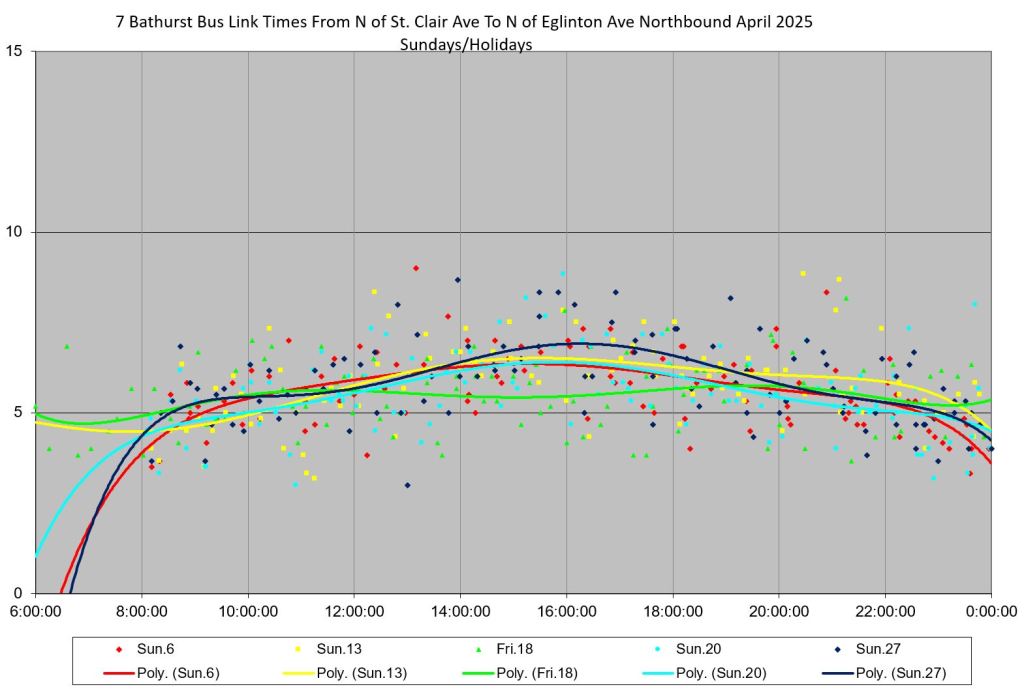
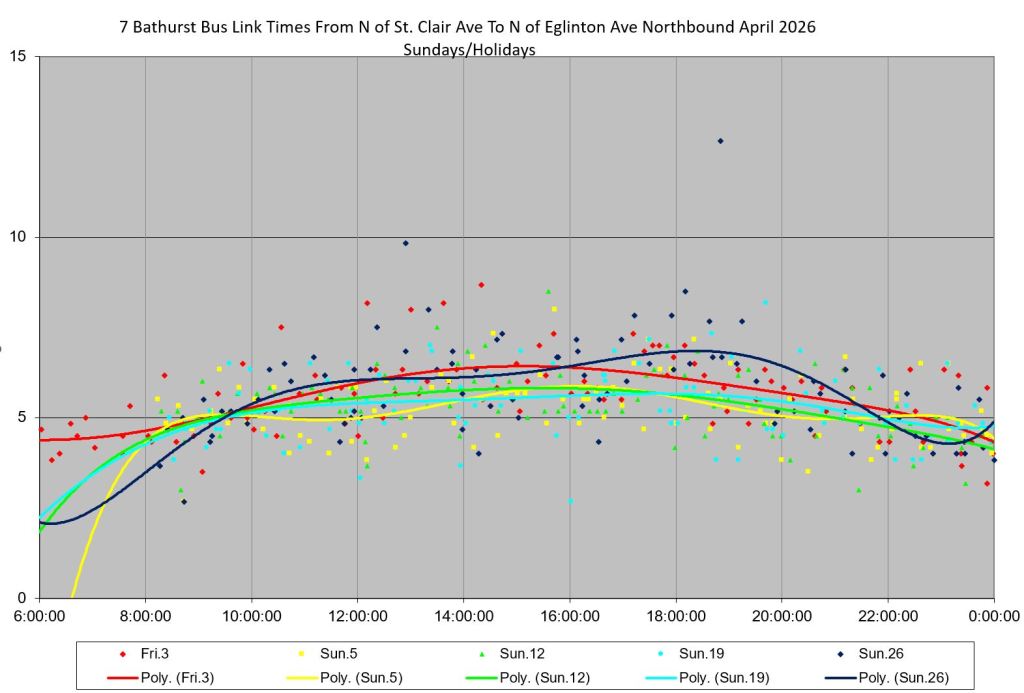
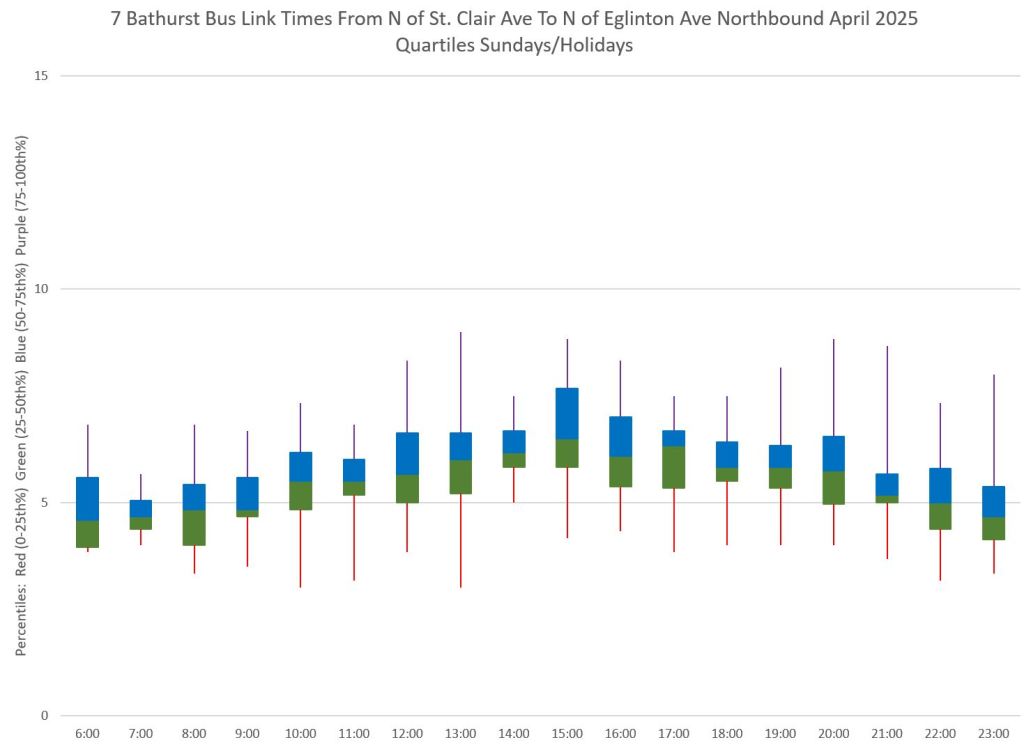
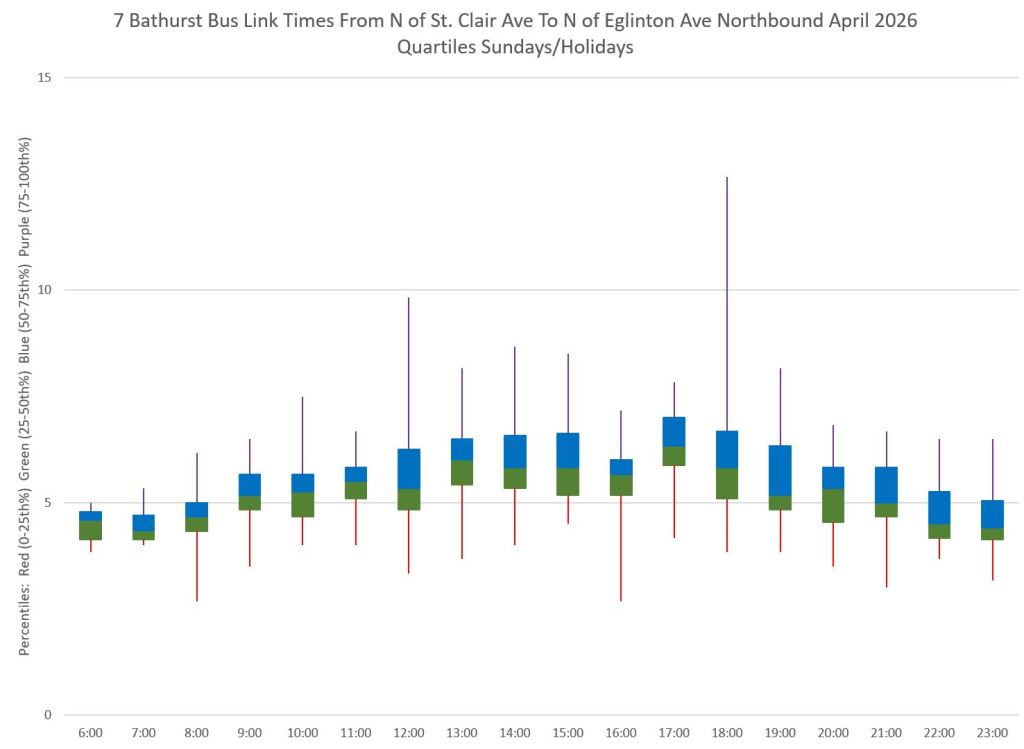
For Saturdays and Sundays, the charts below show the individual data values along with trend lines tracking their behaviour. There is little difference between 2025 and 2026 data, but one notable point in both years is that the values are scattered widely on some days. (Note that in both years, Good Friday is included with the Sunday data.)
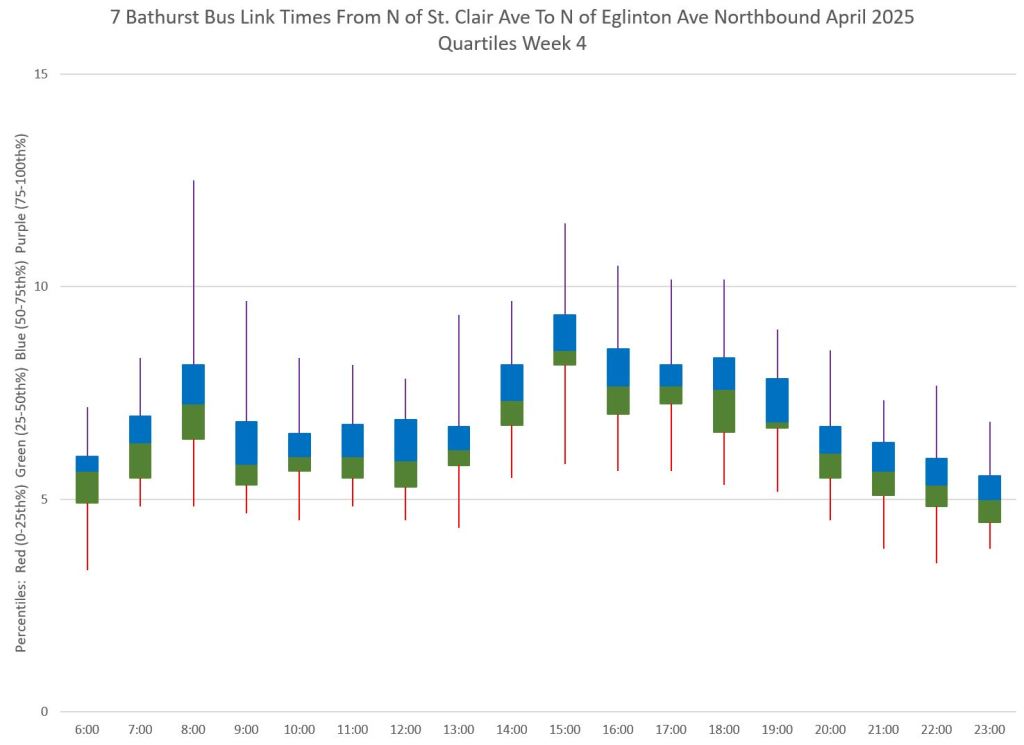
The top four charts show individual data points, and the bottom four show the corresponding quartiles. Ideally the central blue/green blocks should be narrow indicating that at least half of the service had a consistent travel time. The upper and lower tails are 4th and 1st quartiles. Where they are not short, this shows that travel times vary a lot. The values by time of day peak in the afternoons but with little difference from 2025 to 2026. Note that Saturday/Sunday April 4/5, 2026, are Easter weekend.
Northbound from Dupont to St. Clair
For trips between Dupont and St. Clair, the 3pm peak in 2025 is shaved off in 2026 likely by the extension of the “no stopping” period. This is an aspect of “transit priority” that is often overlooked: there can be conditions on the shoulders of peak periods that are worse that the formally “PM peak”. If service is in poor condition coming into the peak, the problems will slop over into the period of heaviest demand.
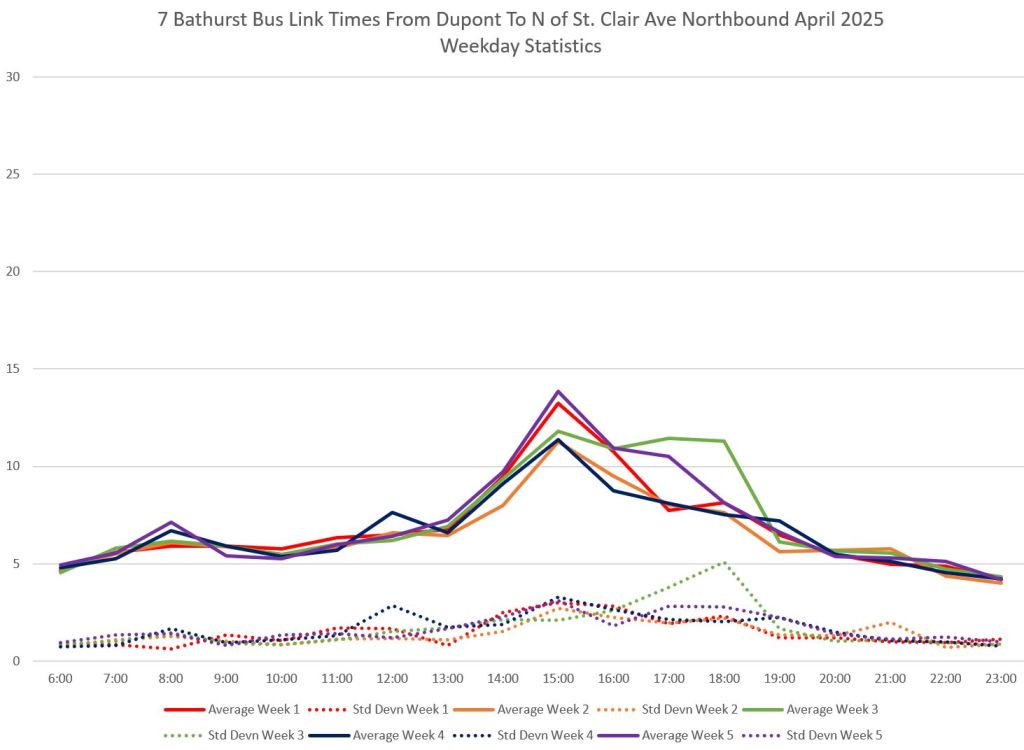

Week 4 data are similar for both years, although there is an improvement in 2026. Note that Monday, April 21, 2025 was Eastern Monday and hence demand and congestion were lower (purple line, left chart).
Weekend data show an improvement in 2026, but it is not clear that the change in parking limits was responsible. In 2025, Easter Saturday (April 18) saw considerably longer travel times, but by contrast in 2026, Easter Saturday (April 4) had lower than usual travel times.
Northbound from St. Clair to Eglinton
Hourly averages and standard deviations for 2025 and 2026 are similar, and if anything the longer travel times for the PM peak begin later in 2026. This suggests that something other than a clear curb lane and the absence of three stops is the controlling factor
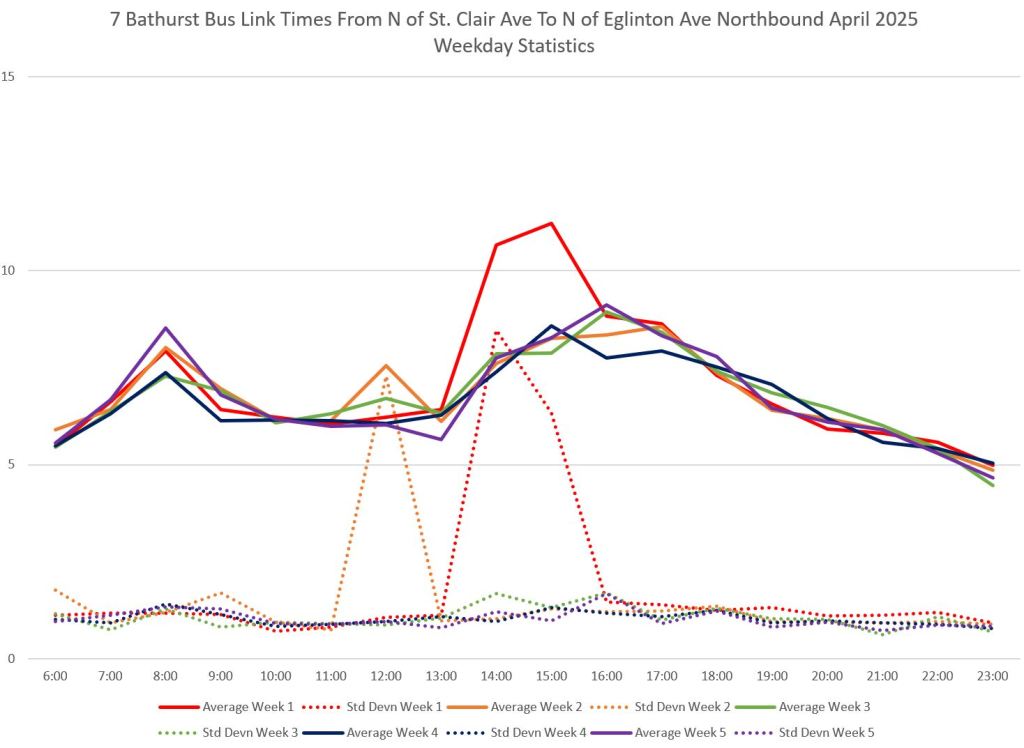
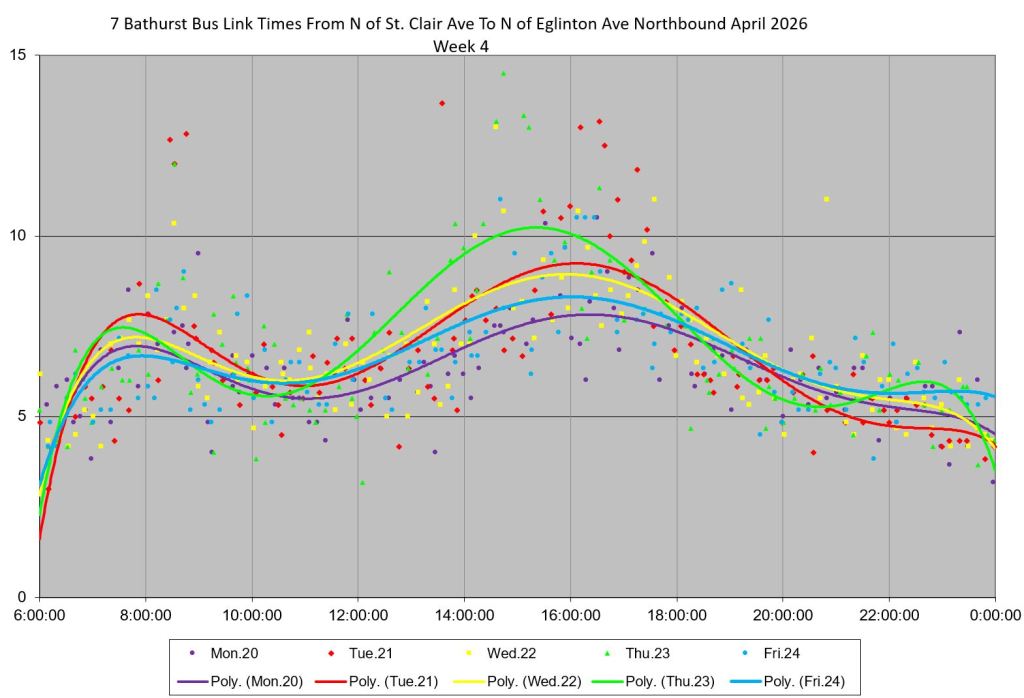
Week 4 data show a wider scatter of travel times during the peak in 2026 than in 2025. This is visible both in the raw data (top) and the quartiles (below) where in particular the central band of 2nd and 3rd quartiles is wider in 2026 through the PM peak.
Weekends show similar patterns in 2025 and 2026
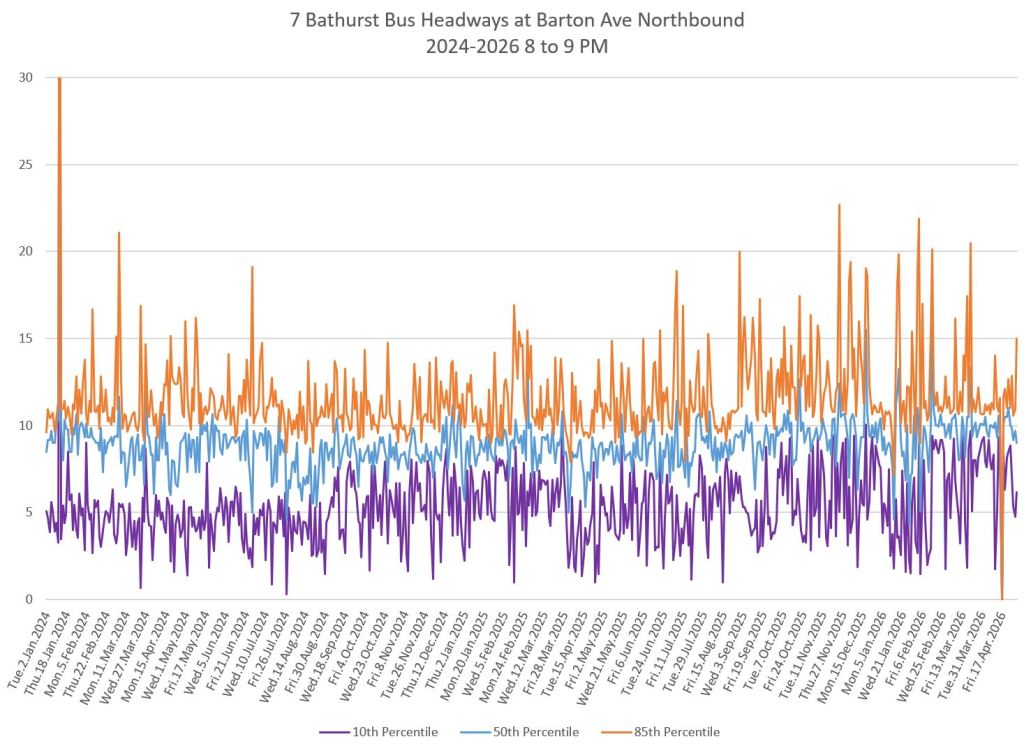
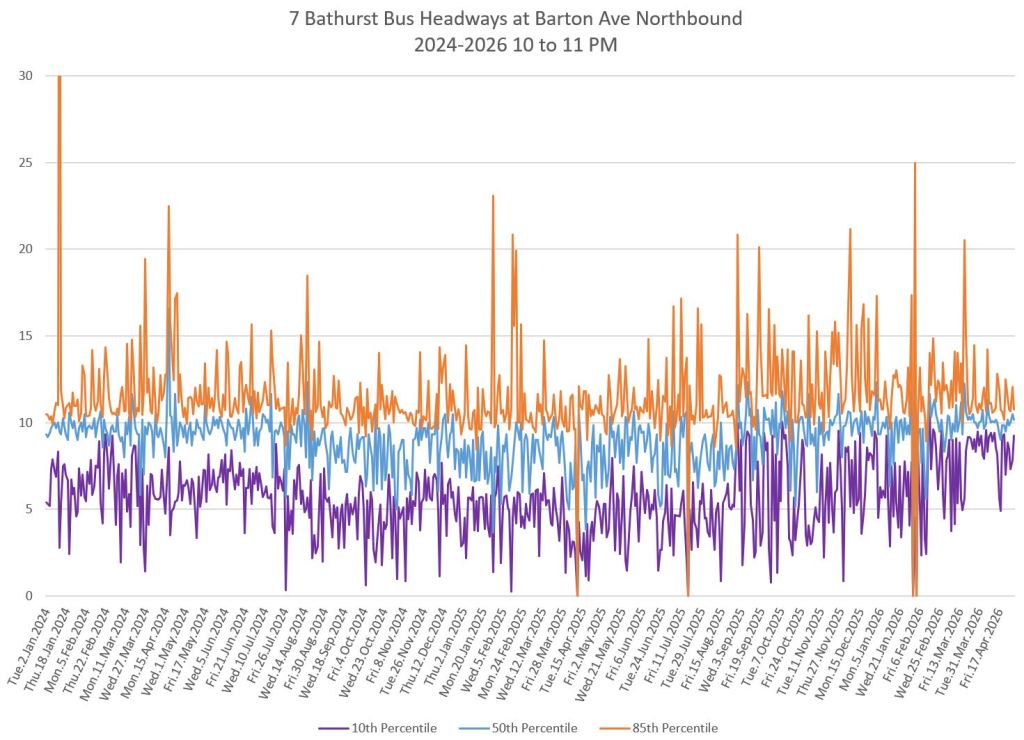
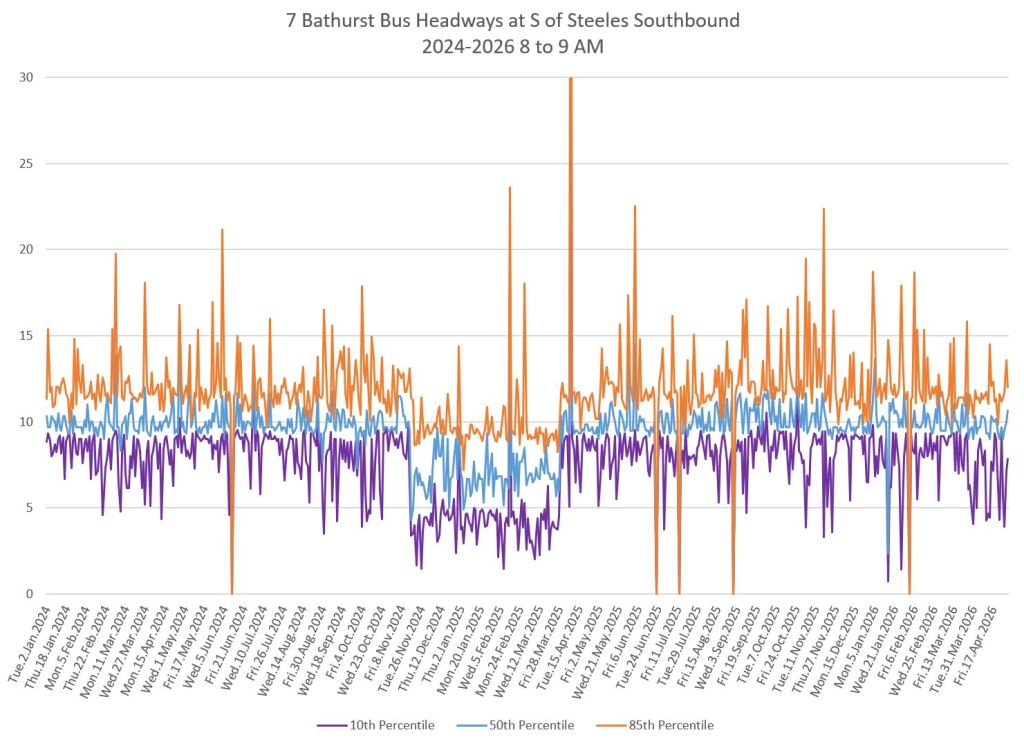
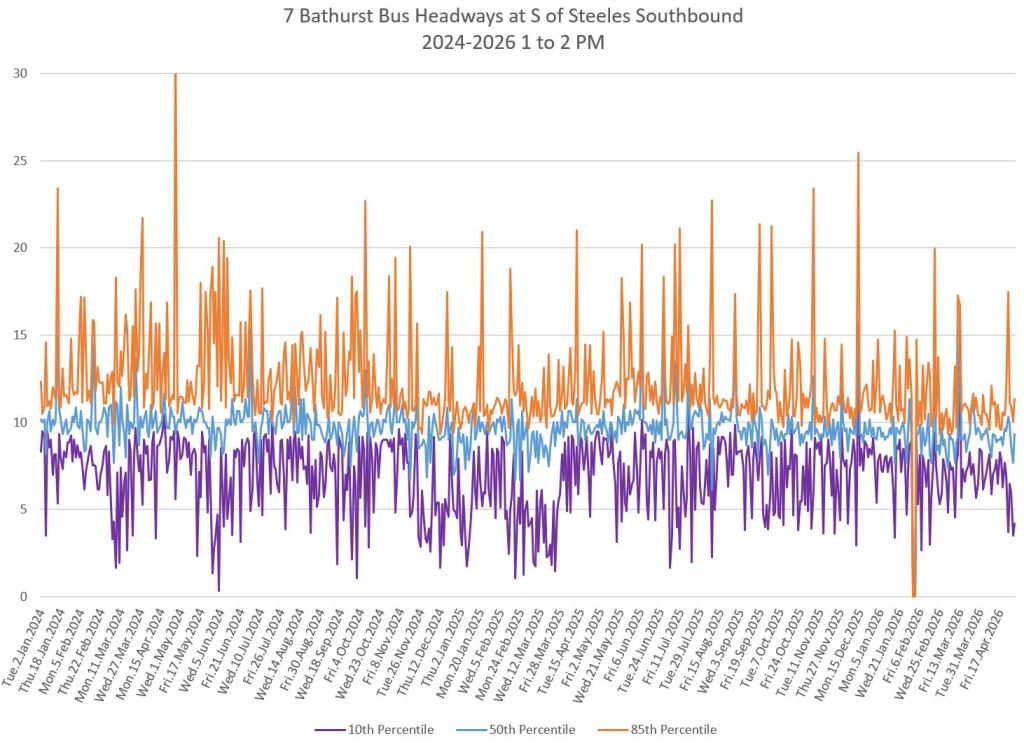
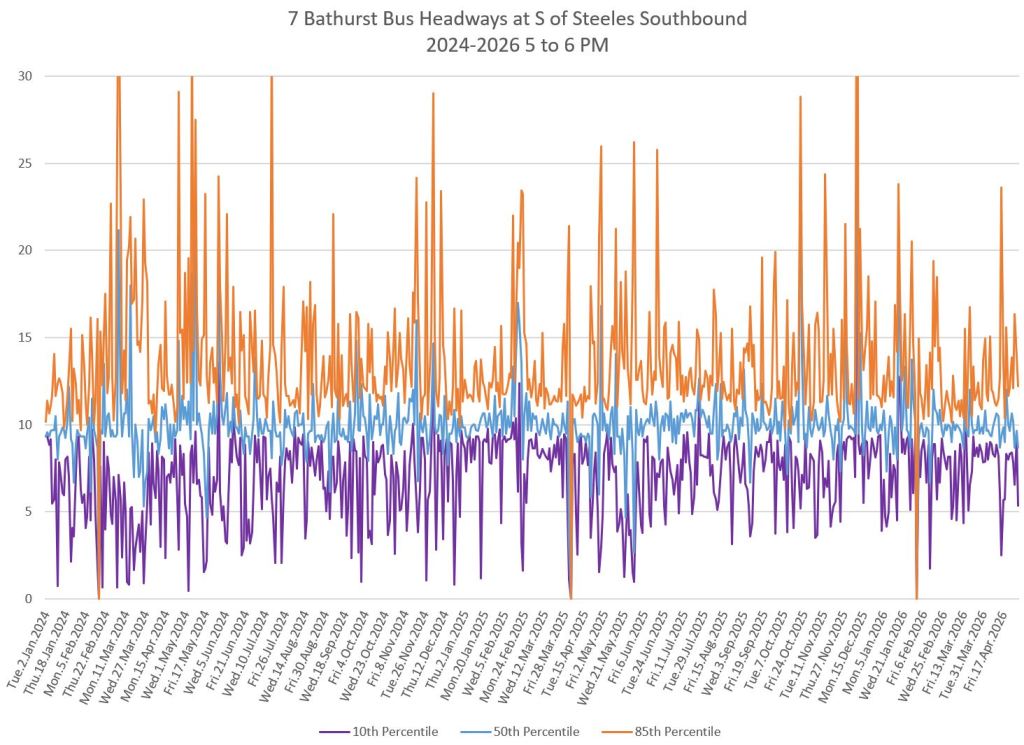
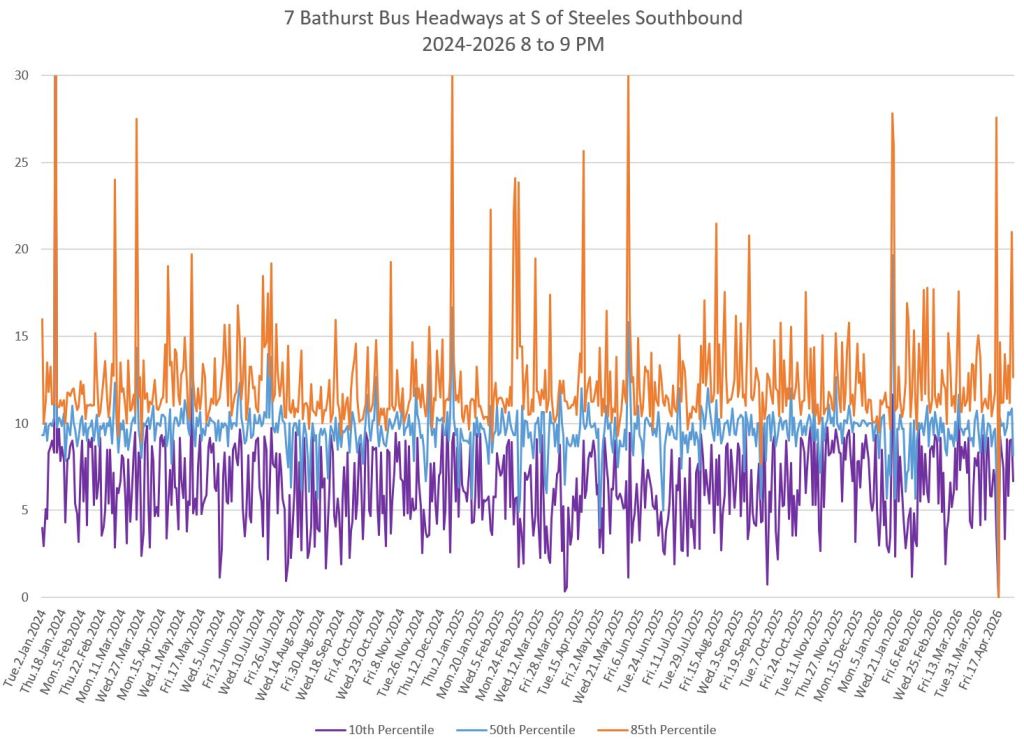
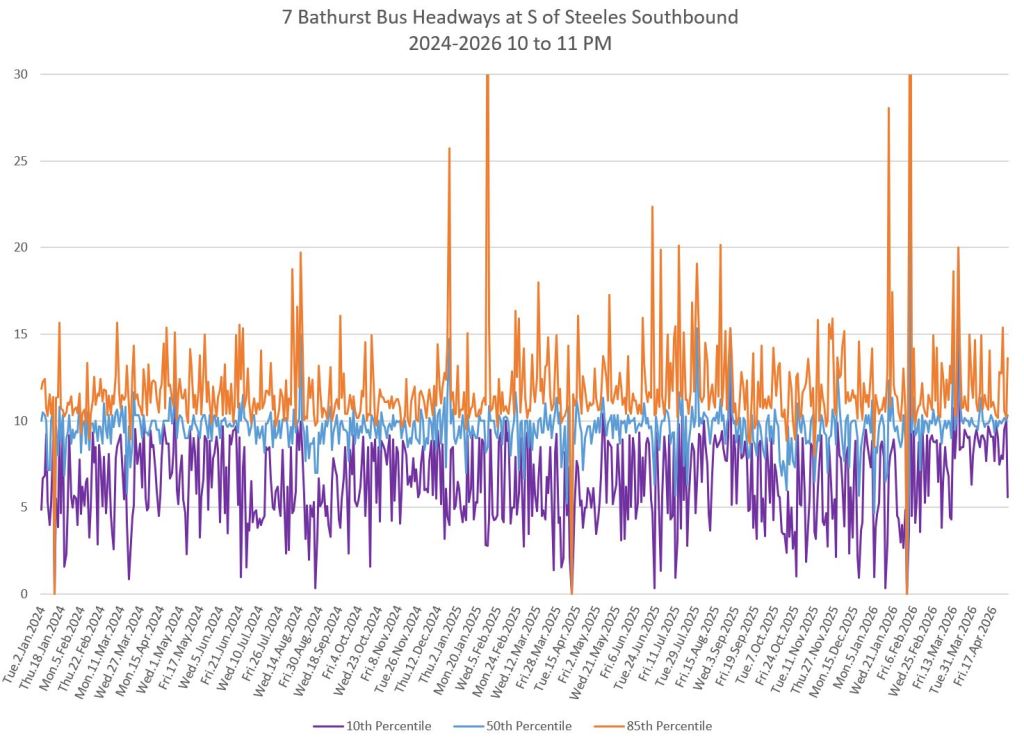
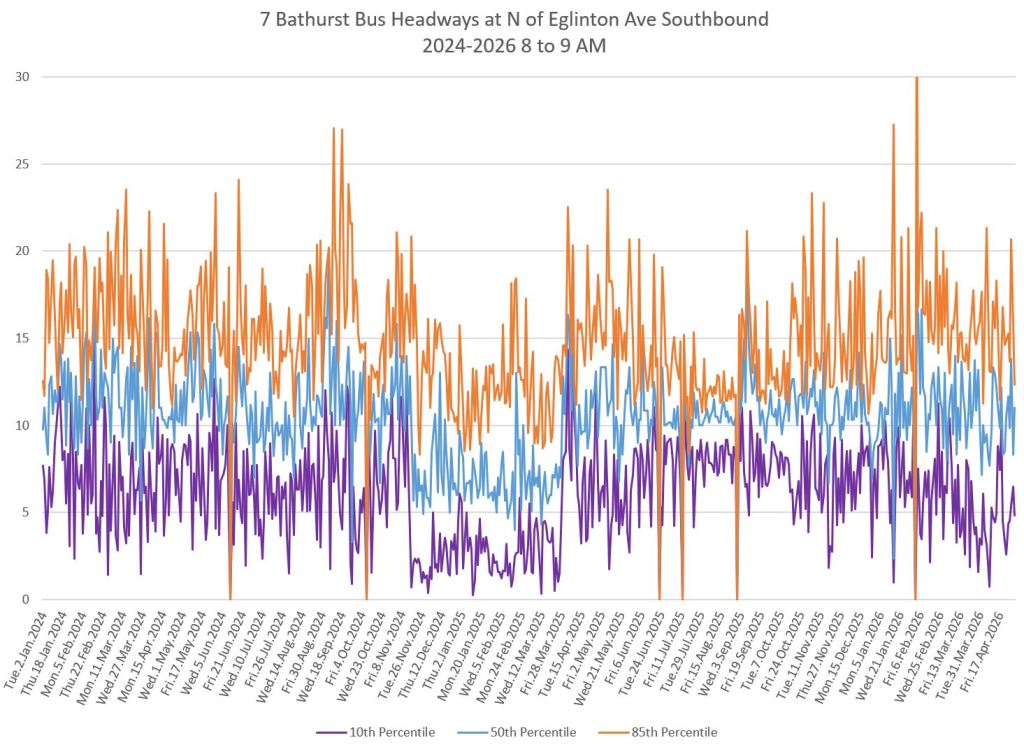
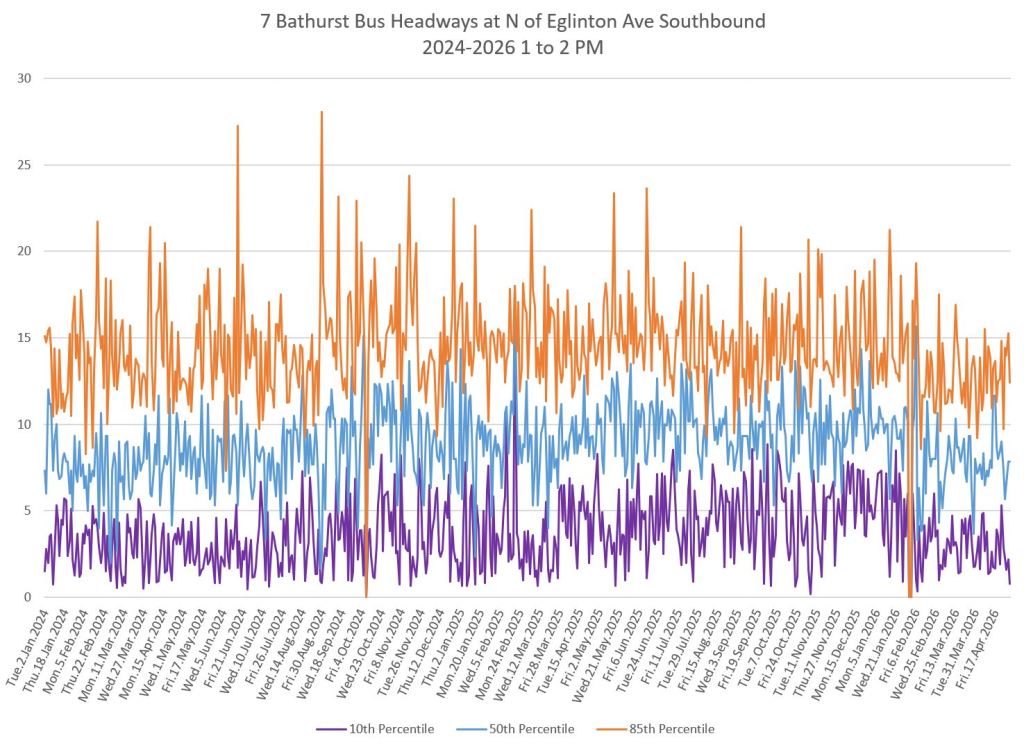
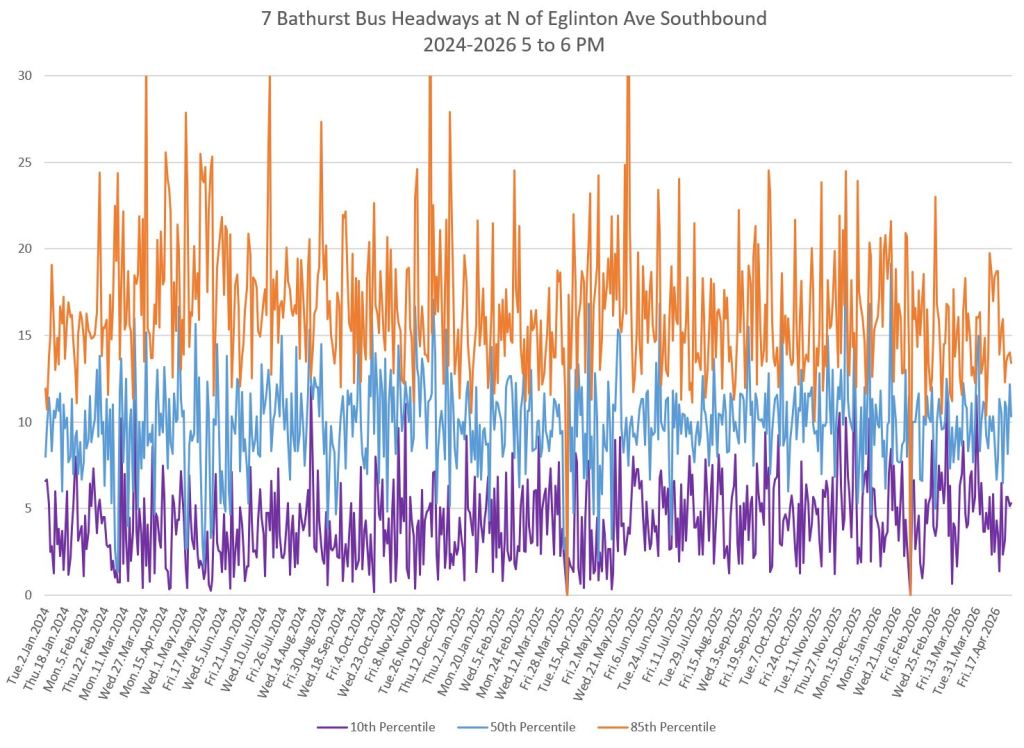
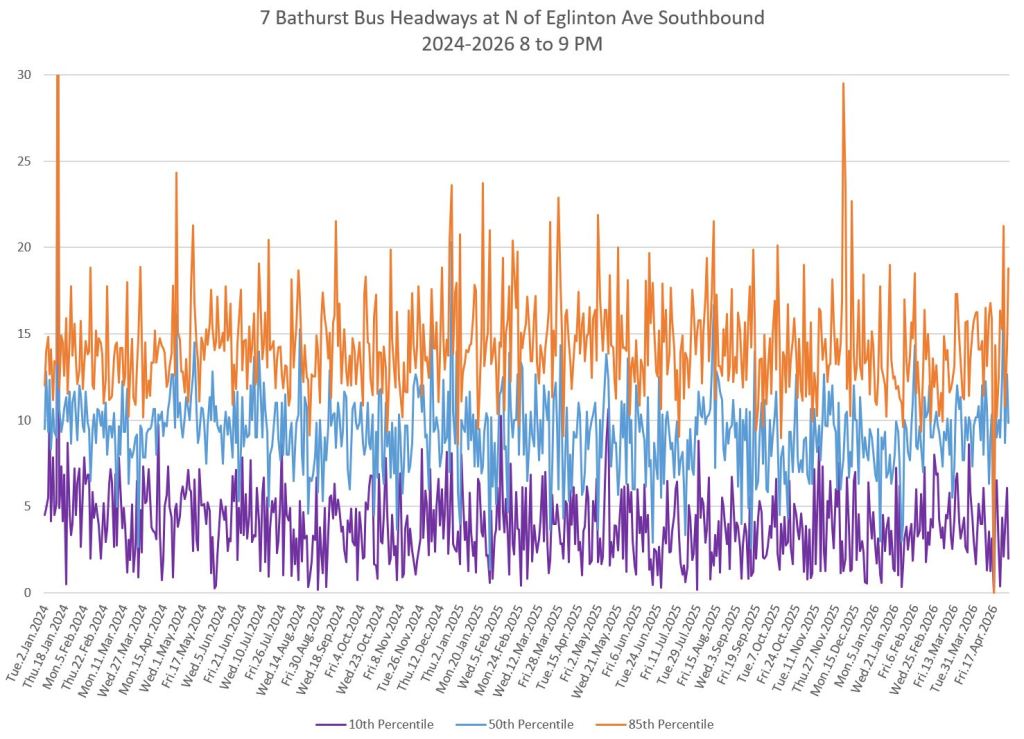
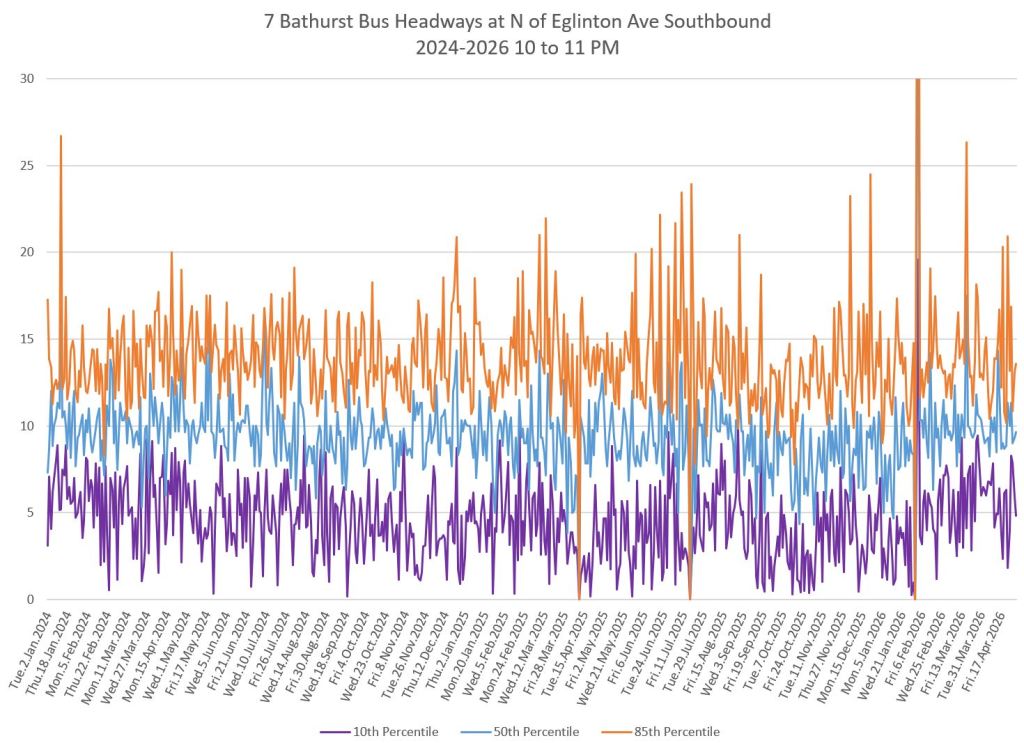
Headways on 7 Bathurst
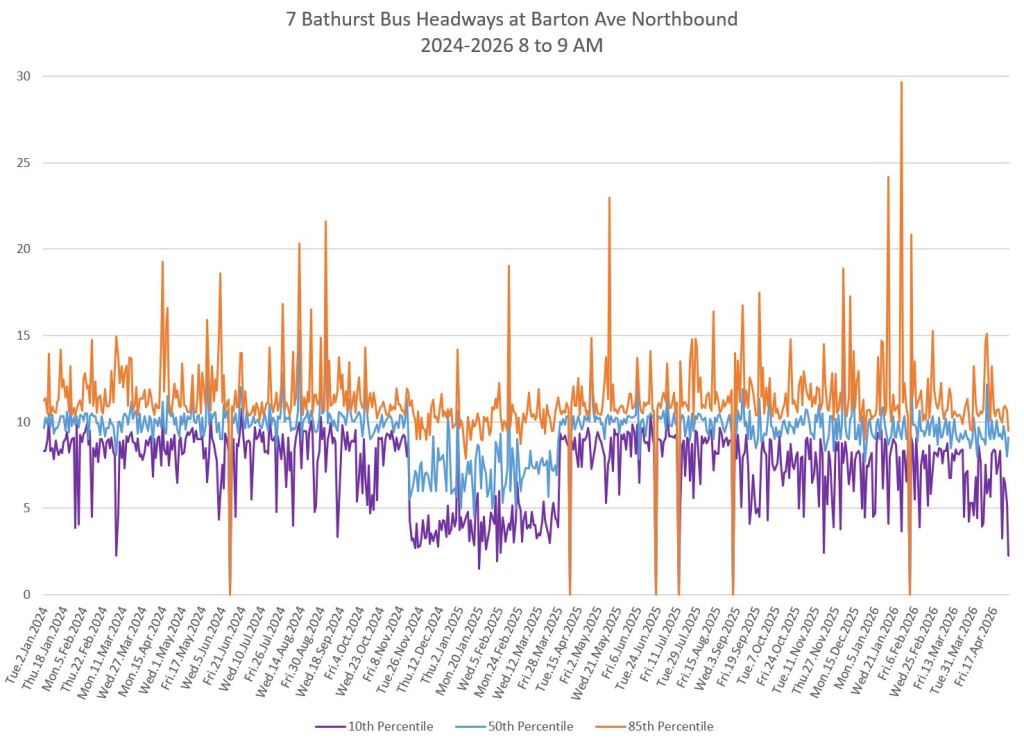
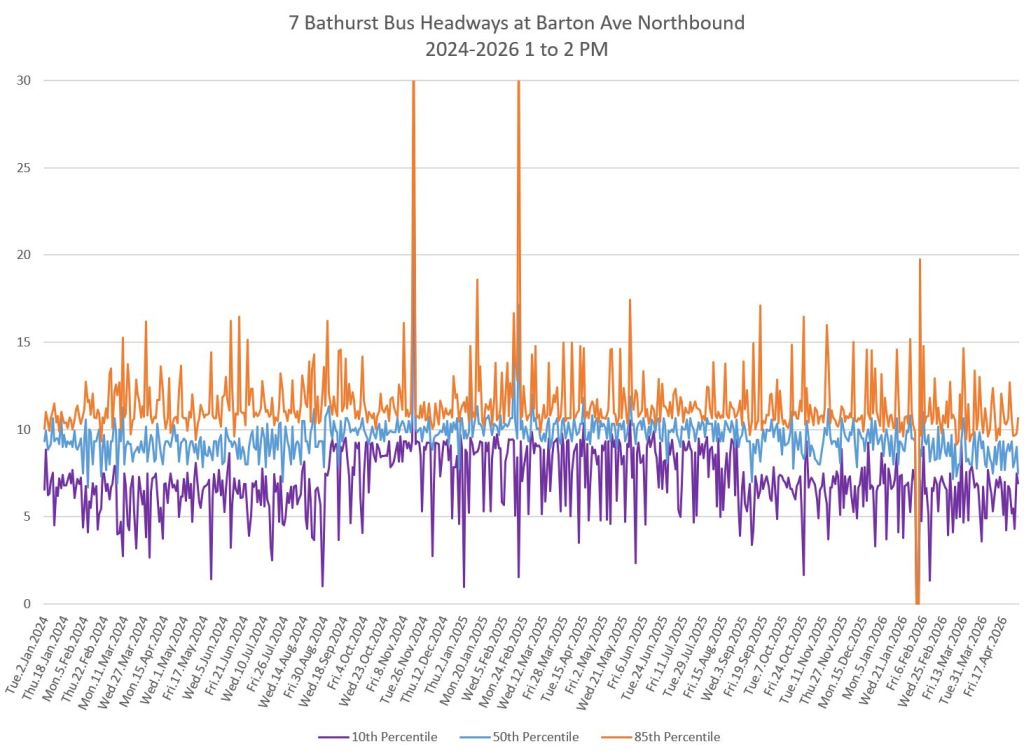
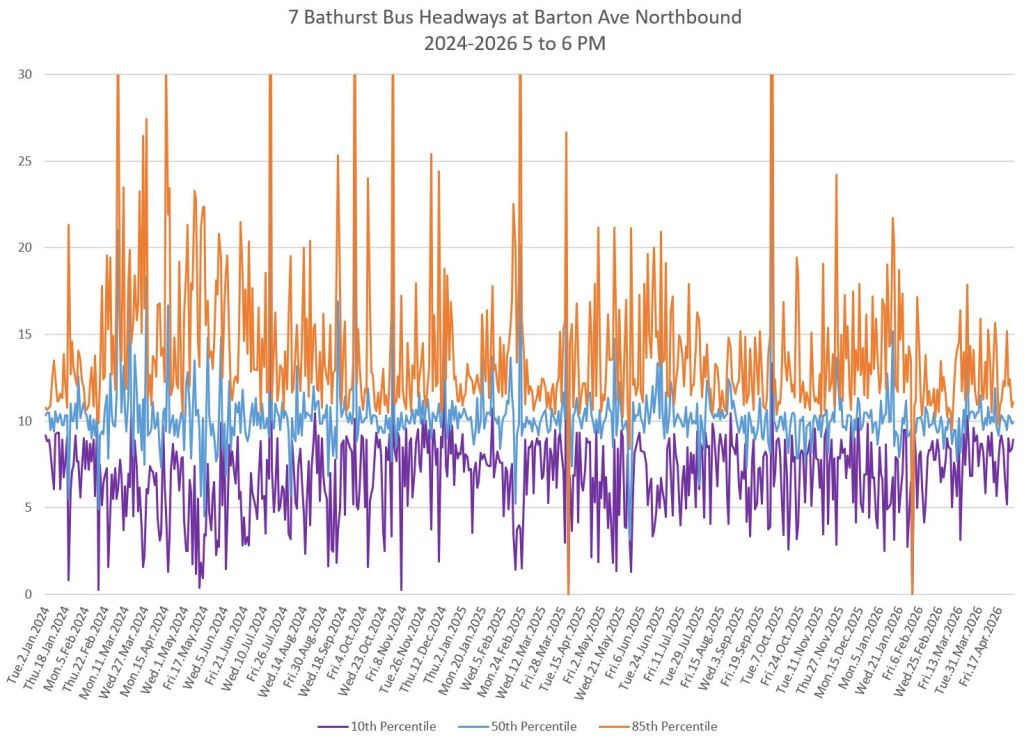
A major issue with the Bathurst bus is that it does not arrive predictably, and this is an issue for the whole route, not just the segment from Bloor to Eglinton.
The charts in this section show the range of headways at a point on each weekday with separate charts for various time periods. The blue (median) and orange (85th percentile) lines work the same way as in the travel time charts above. The purple line shows the 10th percentile line. Between them, the orange and purple lines contain 75% of the trips. The remaining 25% lie outside of this range, either above or below.
Generally speaking, the median values stay close to the scheduled headway, and sometimes are better when extras are operated. However, the range between the 85th and 10th percentiles widen as the day goes on showing a range of values well beyond the Service Standards.
Standards for headways between 5 and 10 minutes:
- Terminal departures must not be early, and should be no more than 5 minutes late.
- 90% of departures should be “on time” by this metric.
- Along the route, the headway deviation should be less than 50% of the scheduled value.
- 60% of trips should lie within this goal.
The enroute metric is quite generous and allows bunched service to be considered “on time” On a ten minute headway, buses could be anywhere from 5-to-15 minutes apart. Moreover, they only have to achieve this 60% of the time. In practice this allows highly irregular service within the standard once buses leave terminals.
Northbound from Bathurst Station
The spread of headways in the AM peak and midday clearly includes many that are lower than the scheduled value (bunched) not to mention above it. The +0/-5 standard only allows for a five minute range, and it is clear that at most times of the day, this is routinely violated.
Southbound from Steeles
The situation southbound from Steeles is similar with the range of headways being considerably over 5 minutes (thereby making the -5 “on time” target impossible). This continues into the evening period and only slightly improves by late evening.
Southbound at Eglinton
By the time the service reaches Eglinton southbound, the range of headways is quite wide (and remember that 25% of the service lies outside the bounds of these charts). The variation in headway is much, much greater than the time saved, if any from transit “priority” measures.

One of the reasons it would be helpful to have light timing configuration and priority configuration details is for these types of analysis.
The reality is that these types of changes likely have improvements per block that are measured in seconds, and without timing updates and priority updates it’s very likely that all the improvements get lost at each light along the route.
One measurement that could help in this is total dwell time per run, which again would require much more detailed data (essentially accuracy would need to improve to 1-5 seconds from 30) to be useful.
Total dwell time would identify when on-street improvements are getting swallowed up at the lights or stations/stops.
An interesting question is whether these changes have resulted in higher speeds when moving…which would be an indicator as well…although I’m not convinced that this data can be easily or accurately returned from the existing data.
Without these details it’s quite possible we have actually accomplished changes, but they fall below the threshold that would show up in the stats that can be generated with the current datasets.
Steve: Although some specific effects at single locations might be hard to pin down with the existing data, the cumulative effect would be quite clear. If we are not seeing a big change in travel times over longer segments, that’s a metric riders will relate to.
LikeLike
I may have missed it, but I didn’t see a specific implementation date for the “before and after” comparison. And while I could Google it, I thought it would be more interesting as a test to see if I could tell from looking at the headway and link time graphs showing 2+ years of data. And no I couldn’t. The only readily apparent difference is the AM peak headway graphs between November 2024 and April 2025 when the 50th percentile headway temporarily drops from 10 to 7ish minutes (with similar changes to the other percentiles).
Can you believe 20 years ago they scheduled this route to run every 6 minutes during the middle of the day, every day…
Steve: The changes happened in fall 2025 but not all at once. The scale was relatively small and only involved extending the no stopping restriction outside of the peak. It is no surprise there is nothing to mark a big change (unlike what happened when the original King Street project made a huge visible difference).
This is not a very impressive outcome.
LikeLike