The TTC’s Strategic Planning Committee will meet on March 31, 2026 at 9:30am in the boardroom at TTC headquarters, 1900 Yonge Street. There are three items on the agenda. Two of them deal with financial plans, and I will turn to them in a separate article. The third is an updated Ridership Growth Strategy, although it is really a rehash of current plans with little attention to actually achieving growth.
Previous iterations of the RGS, especially the original in 2003, were built on the premise of showing what actions to gain riders might be possible and at what cost. This is repeated in the current report, but with no new initiatives beyond those already in the TTC’s Five Year Plan.
The report begins by noting that ridership growth has stagnated and sits at a level well below pre-pandemic figures. Travel declined generally in Toronto from 2024 to 2025, and the change (-3.1%) lies in the middle of the range of declines seen by TTC in various periods. The report notes:
The shift in ridership and customer boarding patterns suggests that the surface network is serving fewer long-distance bus riders, discretionary trips, and shift workers at manufacturing and warehousing areas, as well as work commutes to businesses in the educational services, administrative and support, real estate and rental and leasing, and retail trade sectors.
Overall, the decline in surface boardings is system-wide and not tied to particular corridors, though outer parts of the city are most affected with boarding losses strongest in suburban and outer urban areas.
[…] the most significant opportunity for ridership growth comes not from creating new travel where it no longer exists, but from ensuring the TTC is the most attractive, reliable and competitive option for the trips people are still making. [Report at pp 1-2]
| Comparison to 2019 | |
| Ridership | 80% to 83% |
| Revenue | 92% |
| Expenses | 137% |
| Cost Recovery | Down from 65-70% to 46% |
| Ridership decline since February 2025 | |
| Midday and evening | 4% to 6% |
| Peak periods | 1% |
| Weekends | 4% to 7% |
| Toronto Travel by All Modes | |
| Q4 2024 | 6.6 million trips |
| Q4 2025 | 6.4 million trips |
The decline in offpeak travel is troubling because this segment showed stronger growth while the peak period recovery was hampered by changes in work and commuter patterns.
The perception of transit as an option is declining, but this is a refreshing, if not welcome, view of customer satisfaction stats. In past reports, TTC tended to pump every increase in values, no matter how small, without considering the overall trend as context.
Customer satisfaction declined in 2025 and is lower among priority groups: Gen Z, shift workers, women and customers with low income. Customers generally feel safe on the TTC, with 89% of customers reporting they feel safe on vehicles and 77% at stops, though there is room to improve. [p. 3]
The TTC recognizes the need to be more attractive to existing and would-be riders, but the challenge is how this could be achieved.
By improving speed, safety, affordability and making the experience seamless, the TTC can divert trips from other modes, most notably private vehicles and rideshare, and increase its overall mode share while retaining our existing customers. In a constrained travel market, growth depends on being the better choice: making transit the mode people prefer when they do need to travel and capturing a larger share of trips across all segments. [pp 3-4]
“Affordable, Fast, Safe and Seamless” are the plan’s four focus areas. Unfortunately, the detailed descriptions leave key questions unanswered.
- What is “affordable”? The report notes that riders care more about speed than “minor” fare changes, but what are the implications for fare and revenue growth? Are fares frozen forever or will they start to rise to cover part of transit’s growing cost?
- “Speed is not a luxury feature, it is a core performance requirement. Makes Transit Competitive with Driving. Travel time is the top factor in mode choice.” These statements imply an attempt to compete with auto speeds using transit, but this is simply not possible especially when access and waiting times, not just in-vehicle travel, are considered.
- The Safety bullet concentrates on perceived and actual safety and security for passengers, a factor that depends not just on the TTC but a wider group of social agencies and policies to address a variety of economic and mental health issues.
- The Seamless bullet talks about access to trip planning information, a positive experience on vehicles and in stations, and “confidence that they can predict and complete their trip”. This is not just a question of a better website or new ways to access information, but that transit operations reliably provide the advertised service. The Plan is utterly silent on the need for better service management and standards.
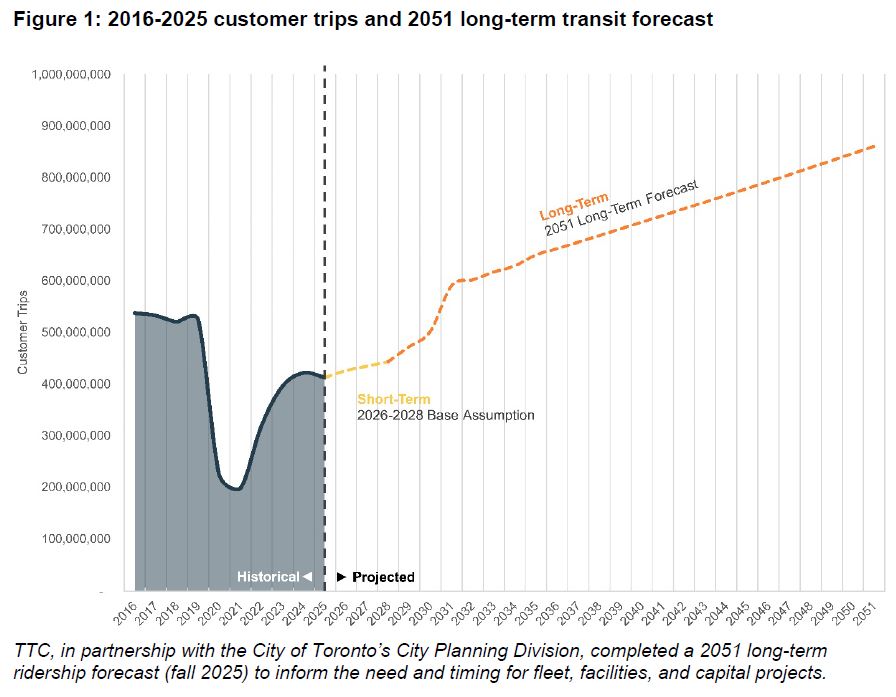
Ridership History and Projection
Together with City Planning, the TTC presents a chart showing ridership over the past decade and projections out to 2051.
In the prepandemic period, ridership had already plateaued by 2016 and began a show decline. At the time this was ascribed basically to the system being “full” and all of its spare capacity, especially off-peak where growth had been stronger, being used up or tuned out of the service.
Next comes the huge drop in the early 2020s followed by recovery, but not to the 2016 level.
Short term modest growth is projected out to 2028, followed by a strong upturn especially post 2030 where the effect of new and extended subways comes into play, and then strong sustained growth out to 2051.
However, the post-2030 growth is not explained as to where it will come from, what parts of the network will be most affected and the type of trip this growth represents. The 2051 value doubles current ridership, but it is not clear what will bring so much additional demand to transit.
The City’s TransformTO plan (not yet fully endorsed by Council) contemplated doubling transit ridership by 2050 in its original form, although this was shifted back ten years to 2040 by Council’s embrace of a more aggressive target for a Net Zero city. That forecast line looks much more like the wishful thinking of TransformTO than a considered opinion on the likelihood of such growth over the period.
Because the current report only takes us out to 2028, there is no discussion of the fleet, infrastructure and staffing implications of such growth, nor of the financial implications. Moreover, this growth rate is not reflected in the financial reports on the same Strategic Planning agenda.
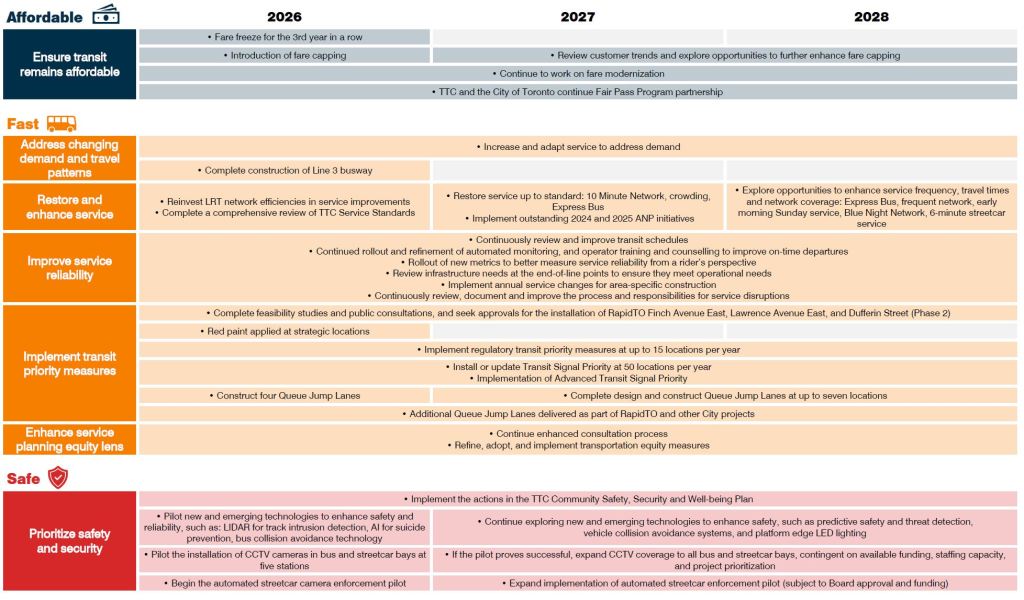
The Short Term Plan
The plan for 2026 is modest and includes only a few provisions directly related to service quality. The basic problem is that each year’s budget looks only at what can be afforded, not what might be done. Planning ahead has too often been left to “next year’s budget”, but seems to be forgotten when that opportunity comes around.
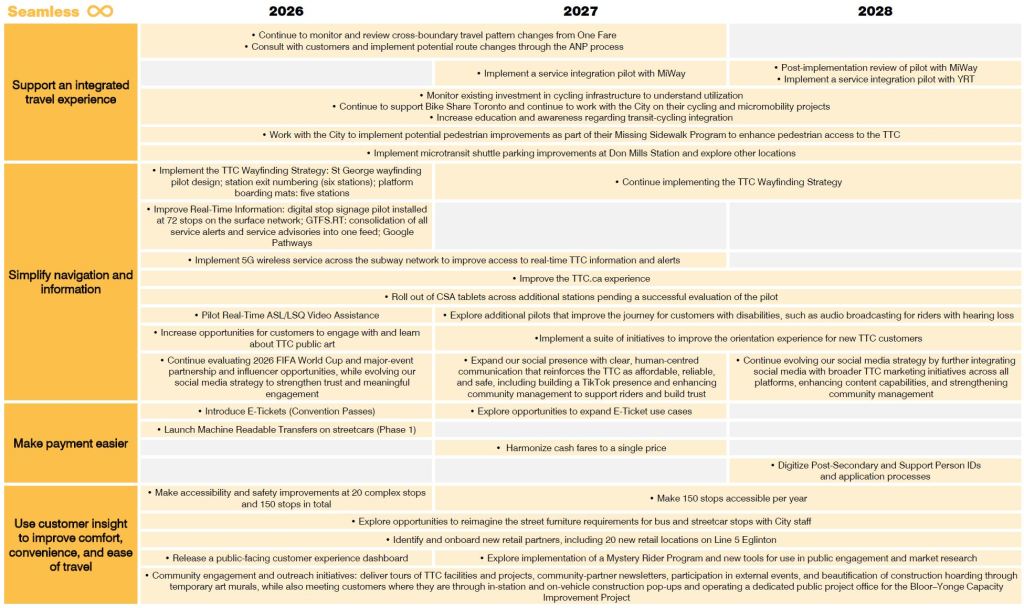
Table 1: 2026 Key Ridership Growth Strategy initiatives
- Freeze fares and introduce fare capping, set at 47 trips for all TTC customers
- Deploy Neighbourhood Community Officers on the subway network
- Pilot new and emerging technologies to enhance safety and reliability, such as: LIDAR for track intrusion detection, AI for suicide prevention, bus collision avoidance technology
- Implement station exit numbering at six stations
- Improve real-time information by piloting digital signage at 72 stops
- Expand 5G wireless service across the subway network to improve digital access to real‑time TTC information and alerts
- Introduce E-Ticket Convention Passes and launch Machine Readable Transfers on streetcars
- Reinvest LRT network efficiencies in service improvements
- RapidTO: Complete feasibility studies for Finch Avenue East and Lawrence Avenue East
- Install or update transit signal priority at 50 locations, and install regulatory transit priority measures at up to 15 locations
- Construct four queue jump lanes
- Make 150 stops accessible
- Pilot Real-Time ASL/LSQ Video Assistance
Consolidated 2026-2028 Action Plan
The next three years include some provision for service growth and, notably, include a recognition that some services are already not running at the TTC’s crowding standard. The specifics are not listed, but should be along with future tracking to ensure these are corrected. Nothing here addresses a shift to an aggressive growth rate shown in Figure 1 above because this lies beyond 2028. However, planning and policy decisions are required now to either embrace this level of growth or to consciously aim lower.
Note that there are far more items in this table than are shown in the estimated cost of improvements beyond a business as usual level. These improvements are shown in the next section.
Proposed Service-Related Improvements
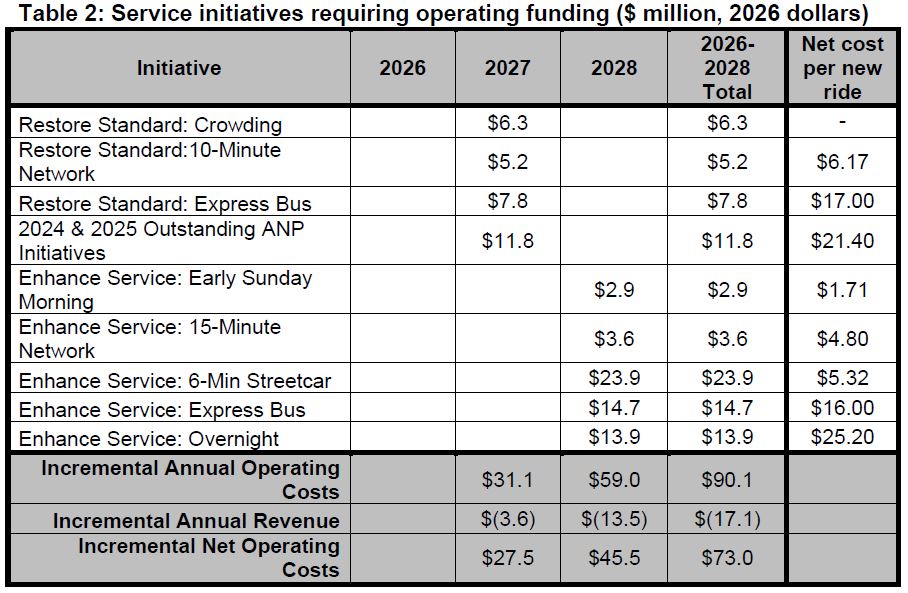
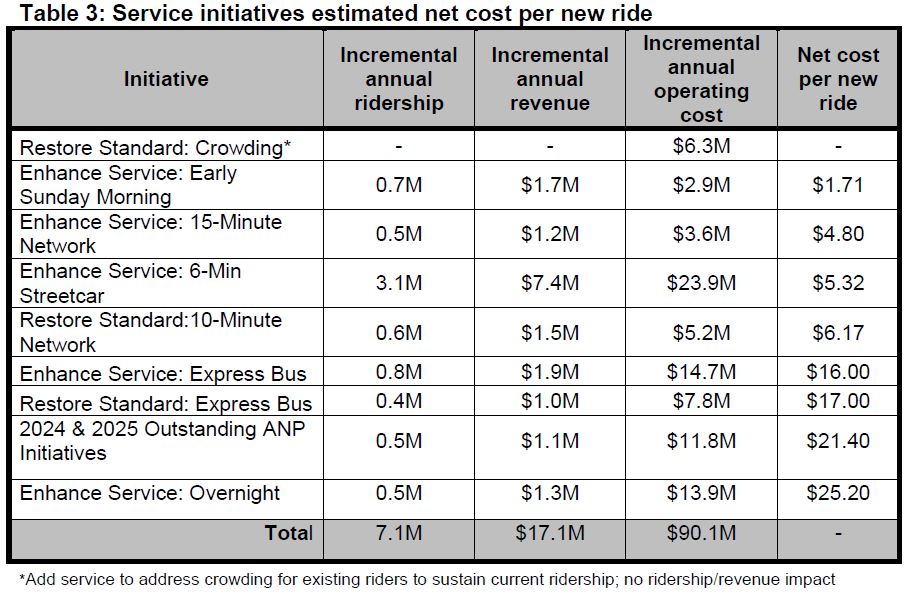
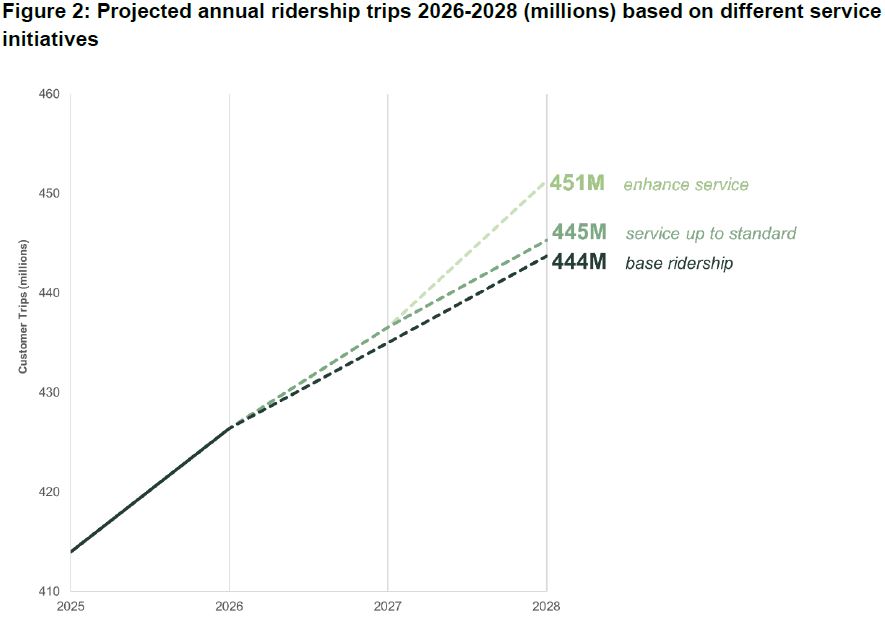
The anticipated effect, depending on how much service is improved, is growth to 451 million rides by 2028, 7 million or 1.6% over the “business as usual” value of 444 million. The cost of the changes above current budget is $90.1-million annually partly offset by $17.1-million in new revenue. The tables below show the proposed rollout by budget year, and also by net cost/rider. It is not hard to guess which of these would be cut to fit available funding.
Discussion of these options would be aided by an actual description of what is proposed for each item to put the cost and benefit in context.
Also, because there is no discussion of longer term growth requirements, options and costs, we do not know what other plans and priorities might dislodge some of these. For example, is better local daytime service more important than more express buses or night service? Which of these also has a social benefit component, such as night service, that justifies the investment?
Travel patterns have shifted, customer expectations have not. Ridership growth will not occur by default. It requires deliberate, sustained investment in the fundamentals that make transit the mode of choice. [p. 7]
The plan observes the need for ongoing investment, but gives no indication of the components nor their magnitude to achieve a strong growth rate beyond 2028. The strategy will be presented to the April 16 Board Meeting, but it is unclear whether it will contain any more than what is shown in this report.
In particular, there is no discussion of scaling the projected growth and investment to lower targets and what this would imply. Is the sustained growth to over 800-million rides actually possible? Is that growth the result of real planning work supported by anticipated population and job growth, or is it a notional value to satisfy the TransformTO goals? Is the actual target 2050 or 2040? Will Council and other governments invest at the level to make this happen, and how will this be funded in an environment where every promised dollar is already over-subscribed by high priority projects?
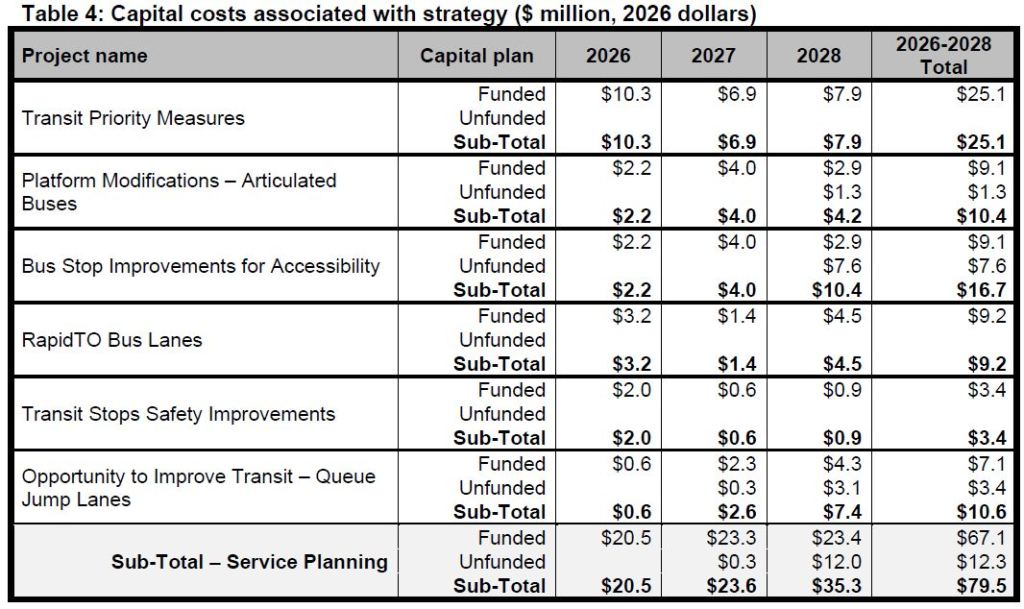
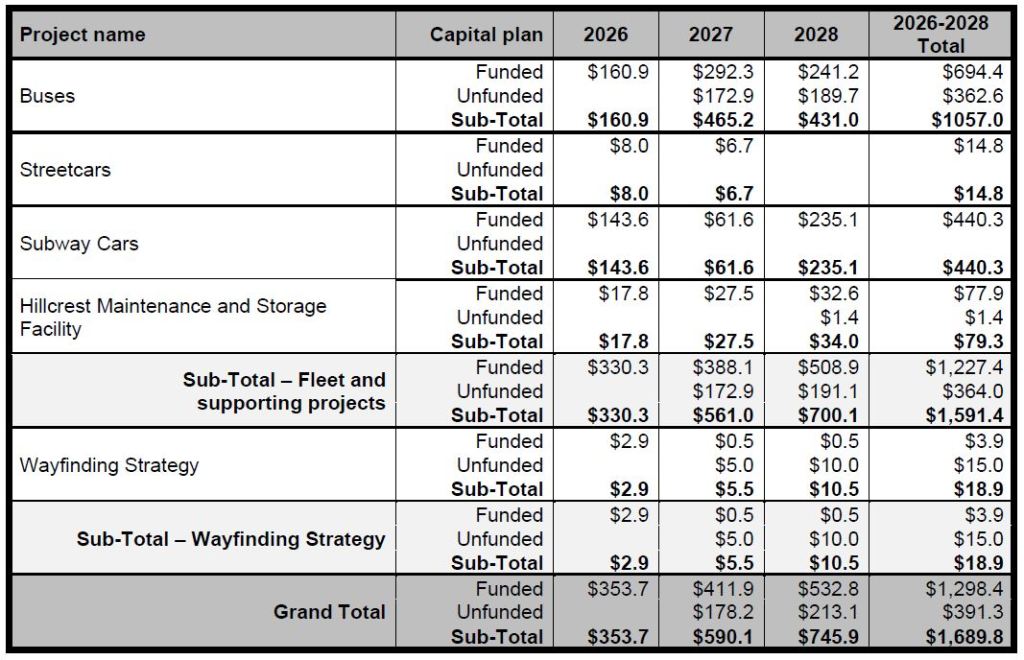
Capital Shortfalls
The report lists various capital projects and their funding status for 2026-2028. Roughly two-thirds of the total is for new buses. Most of these are replacements for existing aging vehicles with only a small provision for service growth. Another quarter is for subway cars, partly for overhauls and partly the early costs of replacements for the Line 2 fleet.
The streetcar cost shown here, $94.1-million, are the tag end of the fleet expansion and carhouse renewal/conversion to accommodate the new cars.
Note that there are many other lines in the Capital Plan and a huge shortfall in funding. There is no capital projection for the aggressive growth projected out to 2050 nor any discussion of whether spending on growth will be overwhelmed by other plans.