This is an update from previous articles about the 511 Bathurst Streetcar showing the effect of operational changes in recent months. These include:
- A shift from 10-minute to 6-minute headways for daytime service effective mid-November 2025.
- Implementation of red transit-only lanes on Bathurst south from Dundas in Fall 2025.
- Increased headway supervision to reduce bunching and gaps.
These effects took place concurrently, and it is difficult to tease apart the individual effects especially as seen by riders. For example, bunching produces wide gaps in service, but these can be reduced both by better headway regulation and by more frequent scheduled service. Reserved lanes can reduce fluctuations in travel times leading to less irregularity in headways. Some of these effects were seen years ago with the implementation of the King Street transit corridor. This is not a transit epiphany, but rather a rediscovery of what is needed to ensure reliable service.
The first part of this article reviews travel times over various parts of the route from January 2024 to February 2026. Between November 2024 and June 2025, the south end of the streetcar route was diverted for construction. Data for this period is included in the charts only for locations north of King which had streetcar service through the entire 2+ year period.
The second part of the article reviews headways (the interval between cars) at key locations. There is a consistent degradation in headway reliability between the southern terminal at Exhibition and Richmond Street northbound, and this exists even after reserved lanes were in place over the entire distance.
The time saving of transit priority schemes can be undone by unevenly spaced service and the extra wait times this causes. Moreover, because a “gap car” typically has heavier than average loads, more riders experience waits and crowding than would be shown in average counts that the TTC typically publishes.
Another important point is that delays and irregularity are not just a peak period issues, but can affect service at midday and through the evening. (This can also affect weekends, but I have not included them here.) On 511 Bathurst, there is a quite striking “heartbeat” pattern with extended travel times almost always on Friday evenings on the south end of the route due to congestion in the Entertainment District. This substantially disappeared after the implementation of red lanes in the area.
Buckets of red paint alone will not solve reliability issues without a culture of regularly spaced service. Note that this is quite different from “on time performance” where staying “on time” can actually lead to erratic spacing when what is needed is headway regulation. Moreover, TTC standards allow some variation in departures giving a window up to five minutes late while still being “on time”. With cars scheduled every six minutes, bunched service does not ring any alarm bells.
This article is the first in the series of review of routes where transit priority measures have been implemented.
After the red lanes are extended north to Bloor Street, I will publish an update to this article.
Chart Format
The charts here are in a format familiar to regular readers. They plot the travel times and headways for four hourly periods representing weekday service: AM peak (8-9am), midday (1-2pm), PM peak (5-7pm) and early evening (8-9pm). In some cases the late evening service (10-11pm) is also included to show effects that lie well outside of the conventional peaks. Each day’s data are plotted separately to show the variation that occurs day-to-day, while the percentile lines (see below) show the range of values on individual days.
There are two lines on all charts:
- Blue: The median value. 50% of the underlying data points lie above this value, 50% below.
- Orange: The 85th percentile. This line filters out occasional data points that are well beyond the typical range. Roughly 1 in 7 values lie above this line.
A third line appears only on headway charts:
- Dark purple: The 10th percentile. This line filters out occasional data points well below the typical range. Roughly 1 in 10 values lie below this line.
On the headway charts, the space between the orange (85th) and purple (10th) percentile lines accounts for roughly 3/4 of the service.
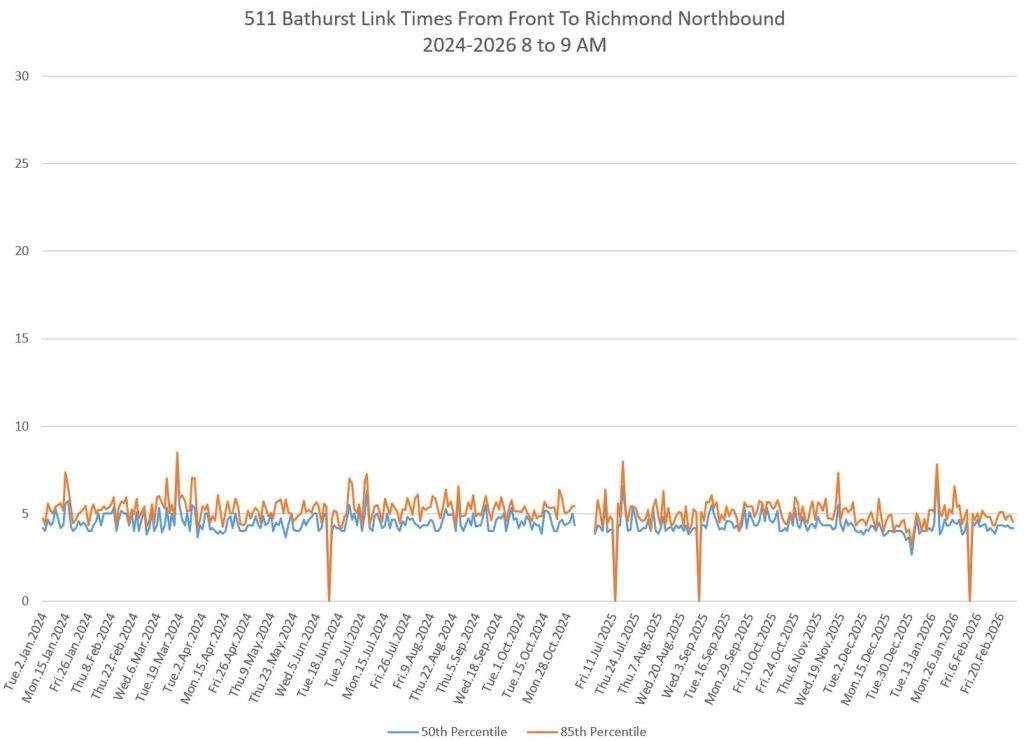
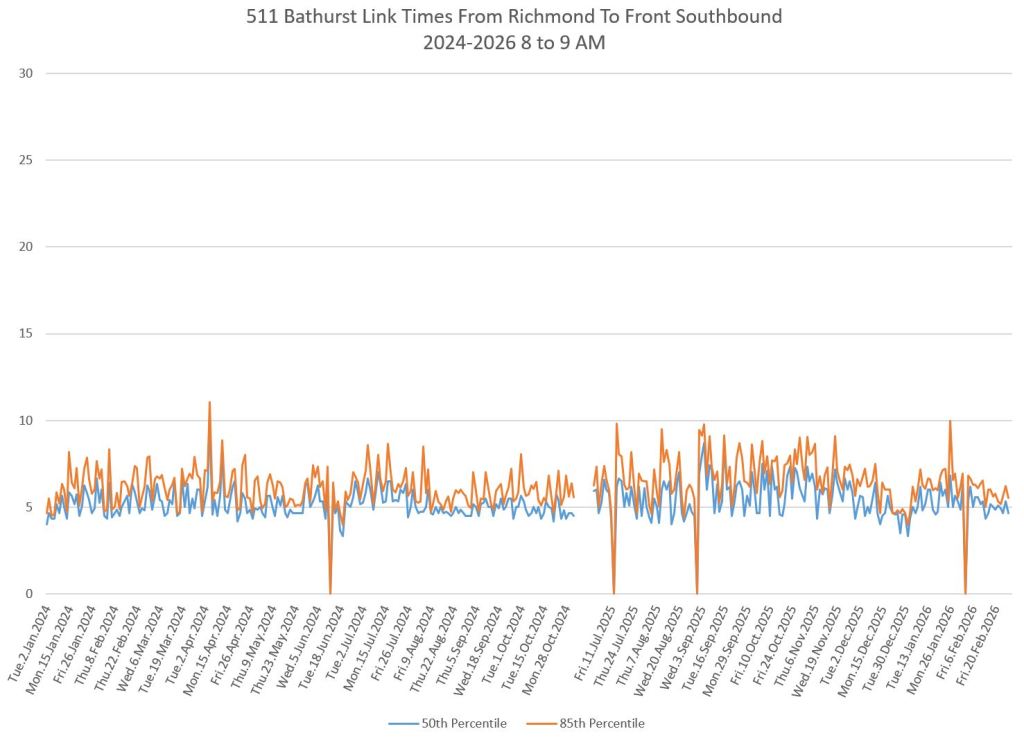
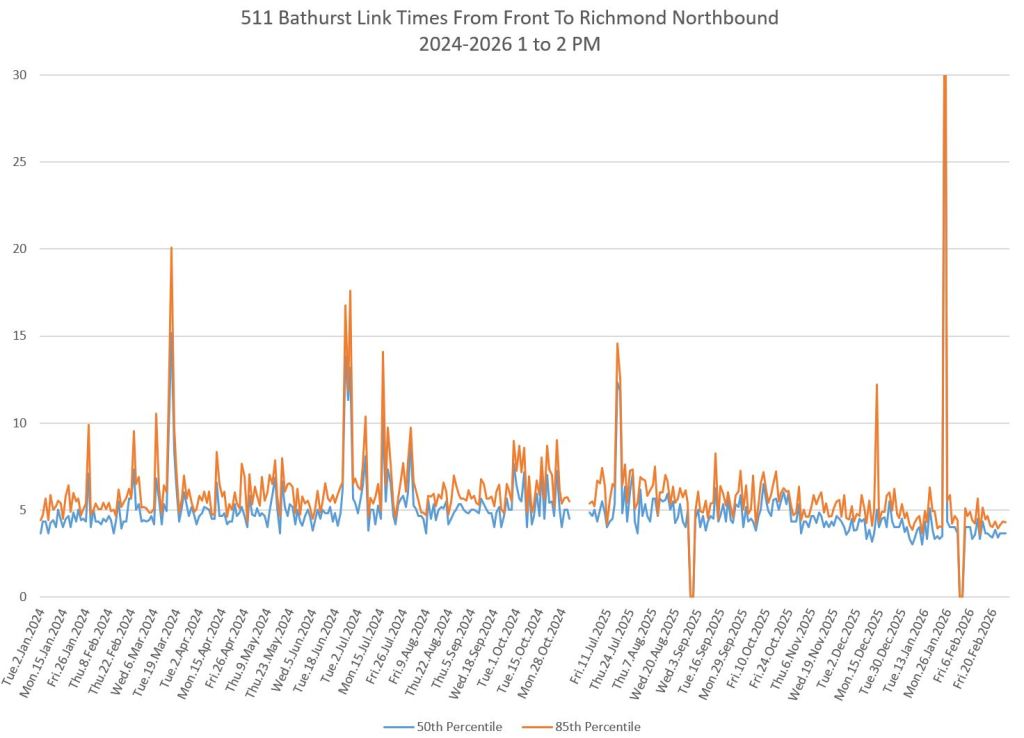
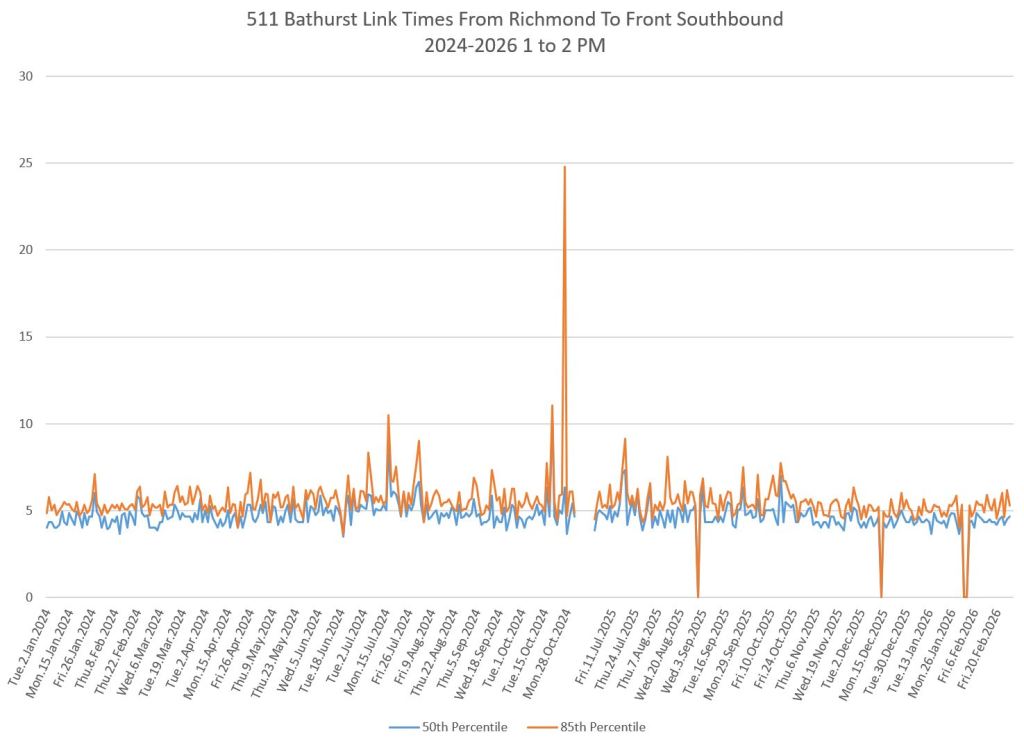
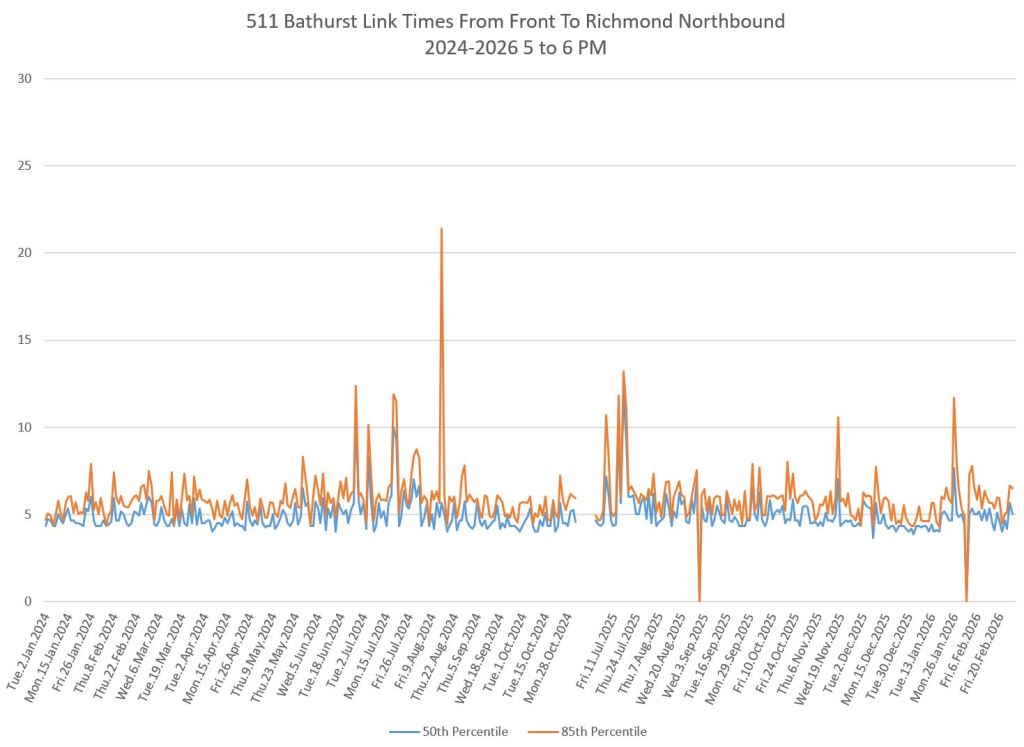
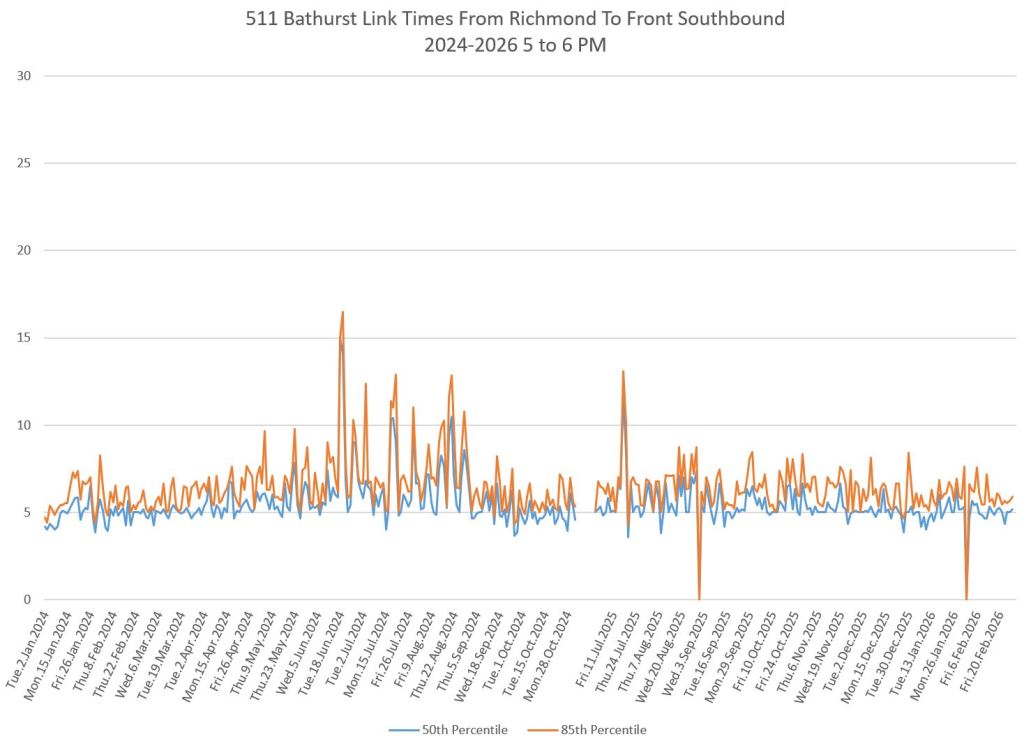
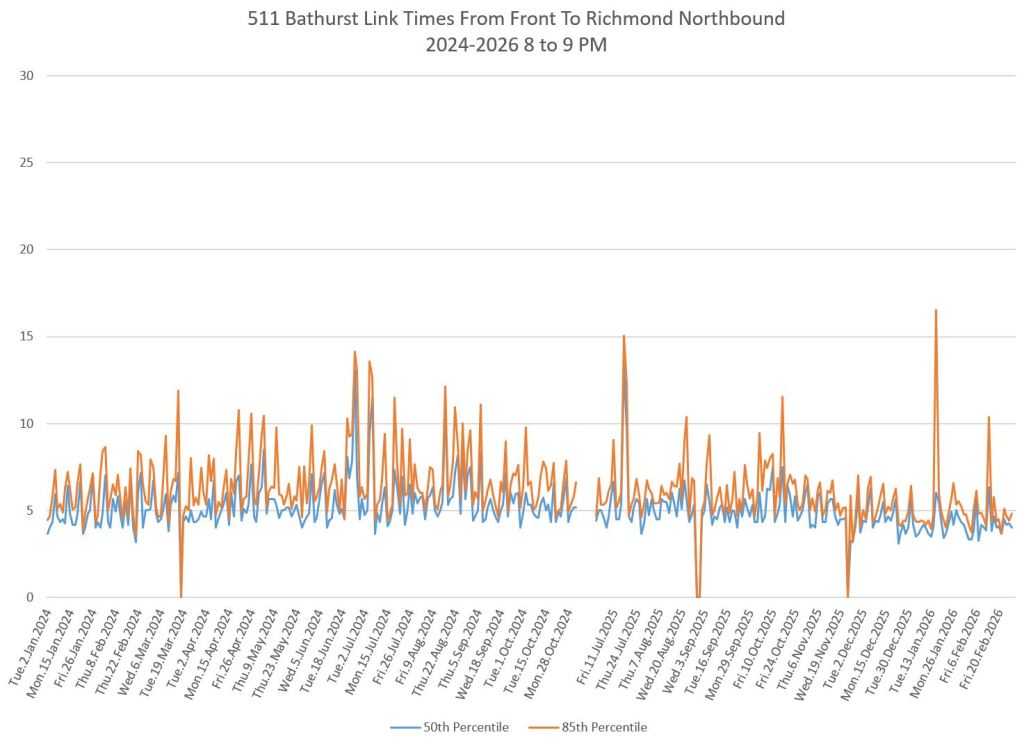
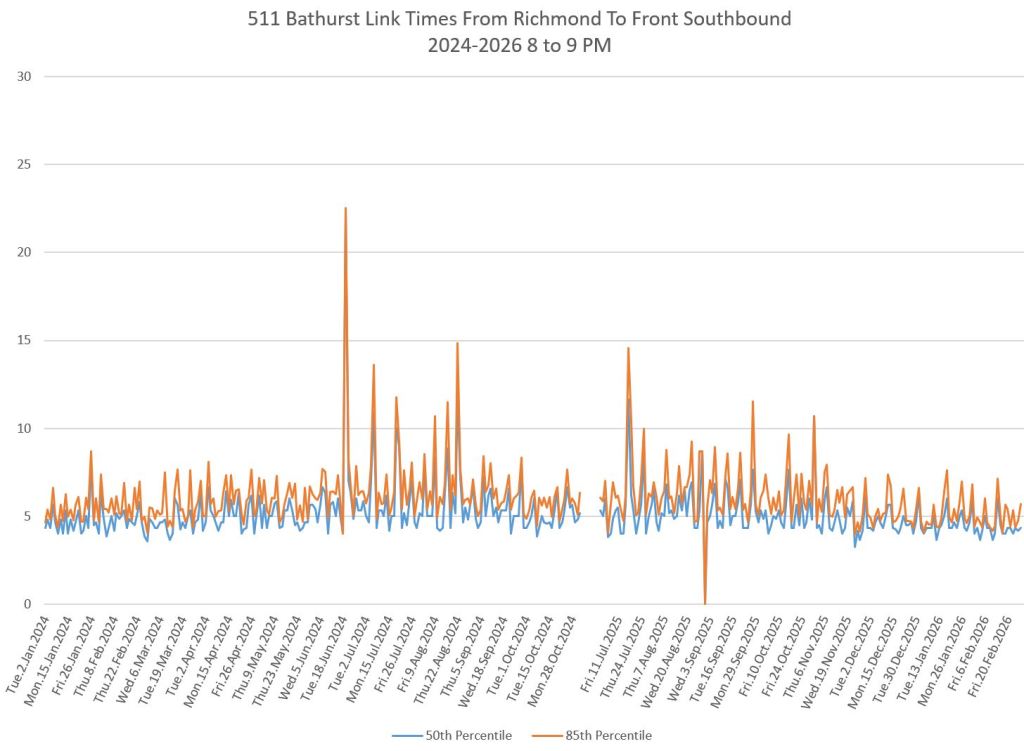
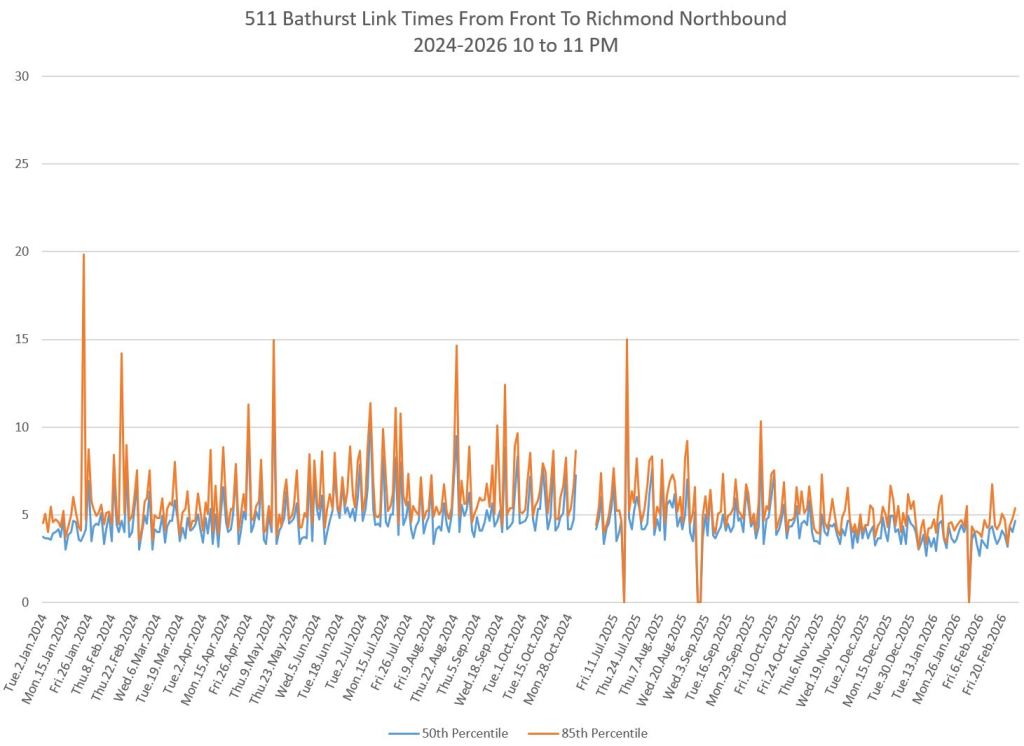
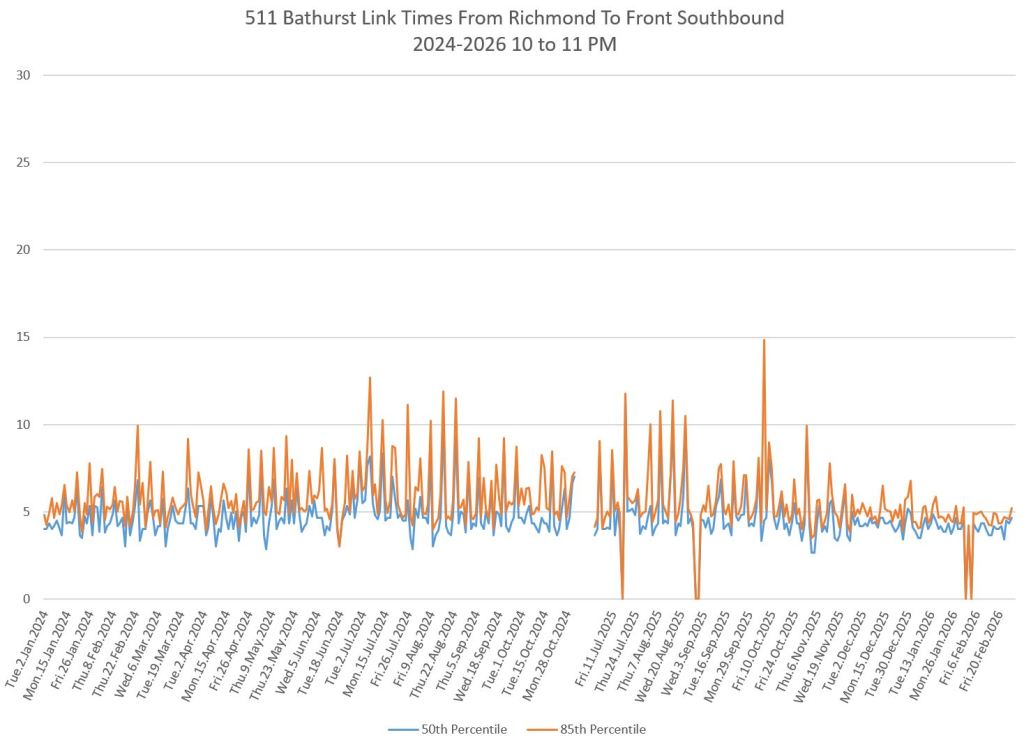
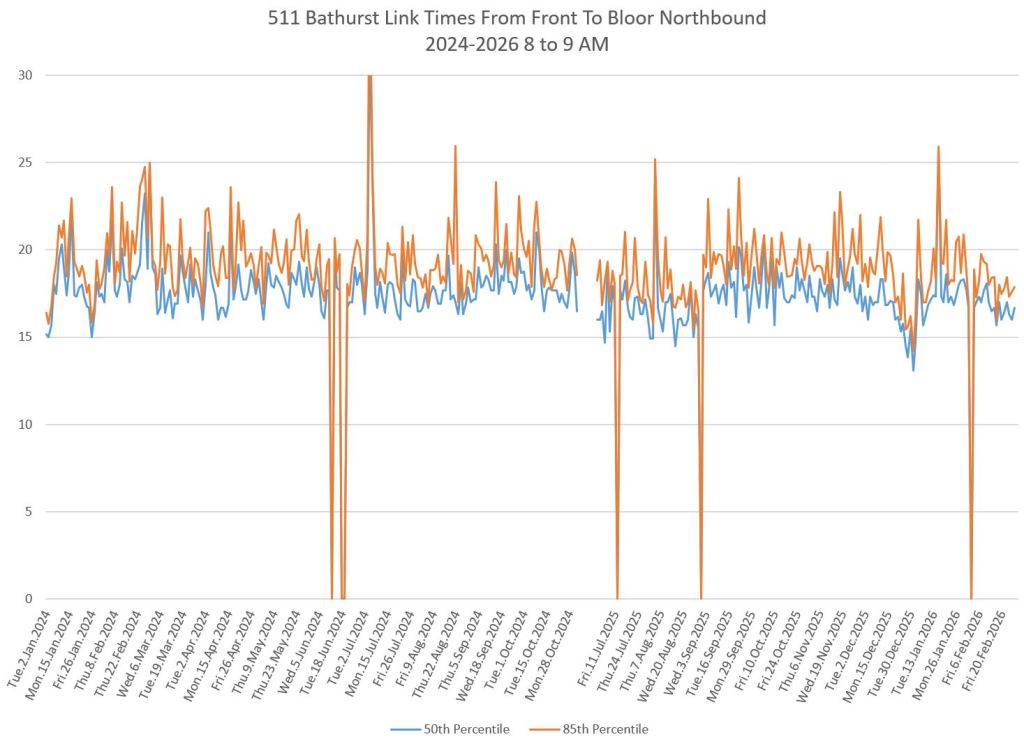
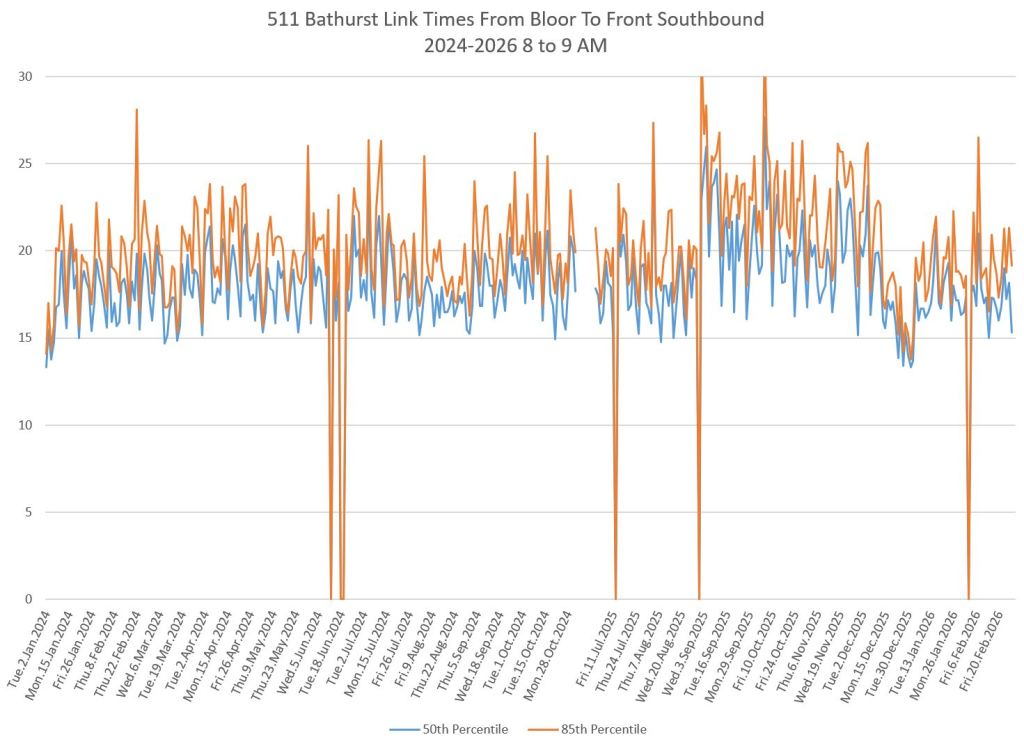
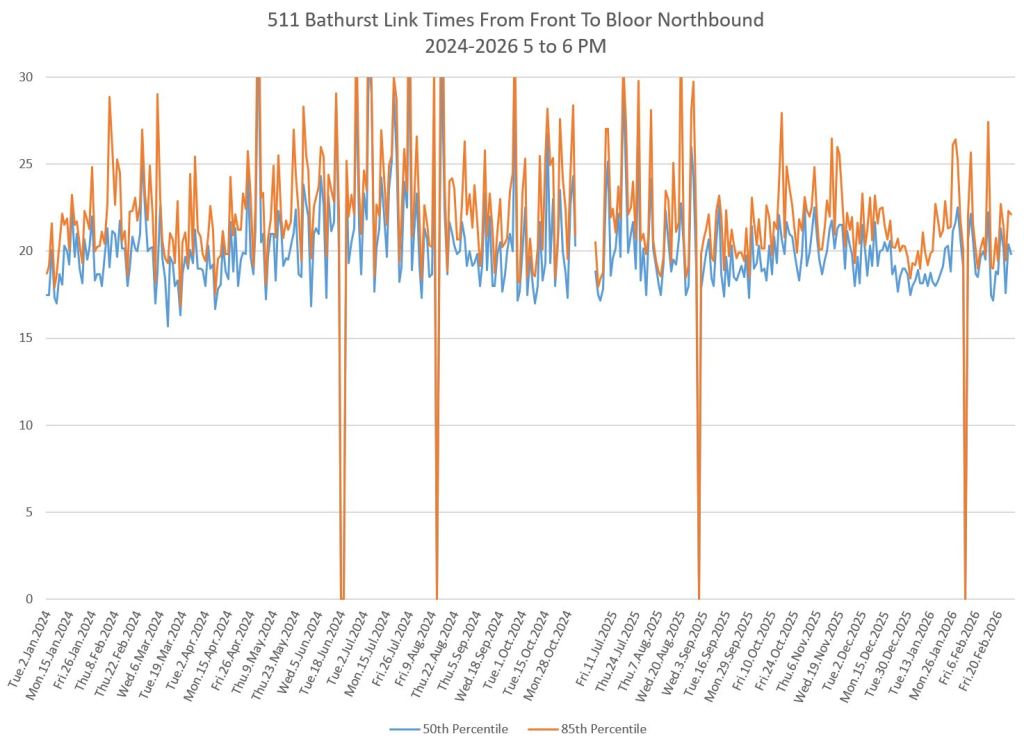
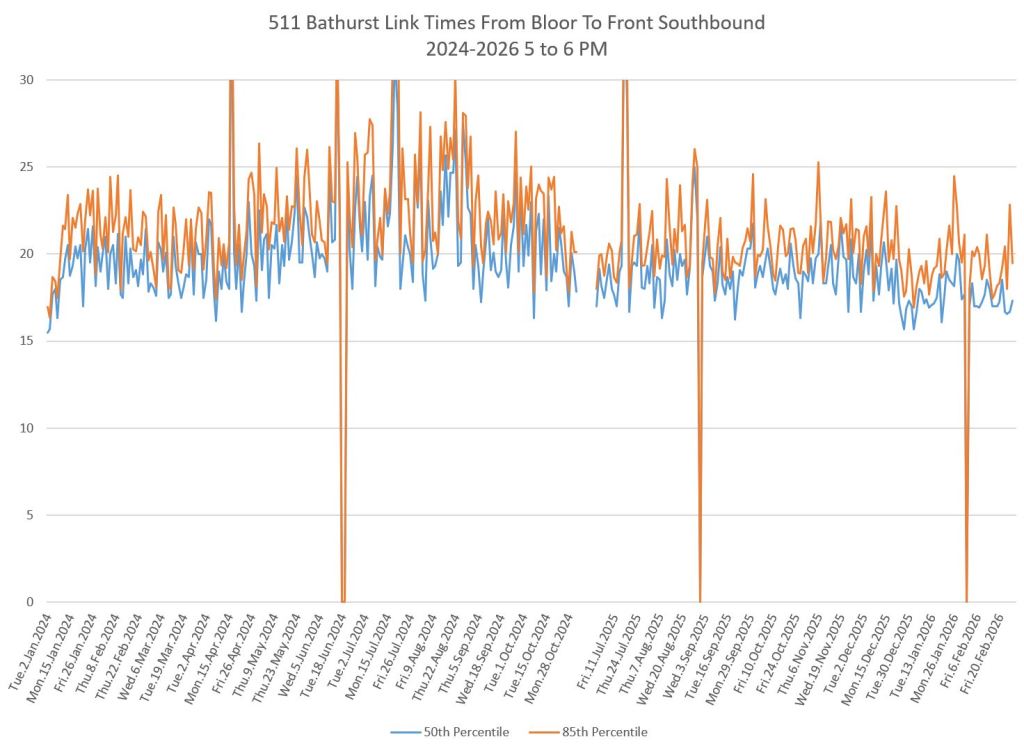
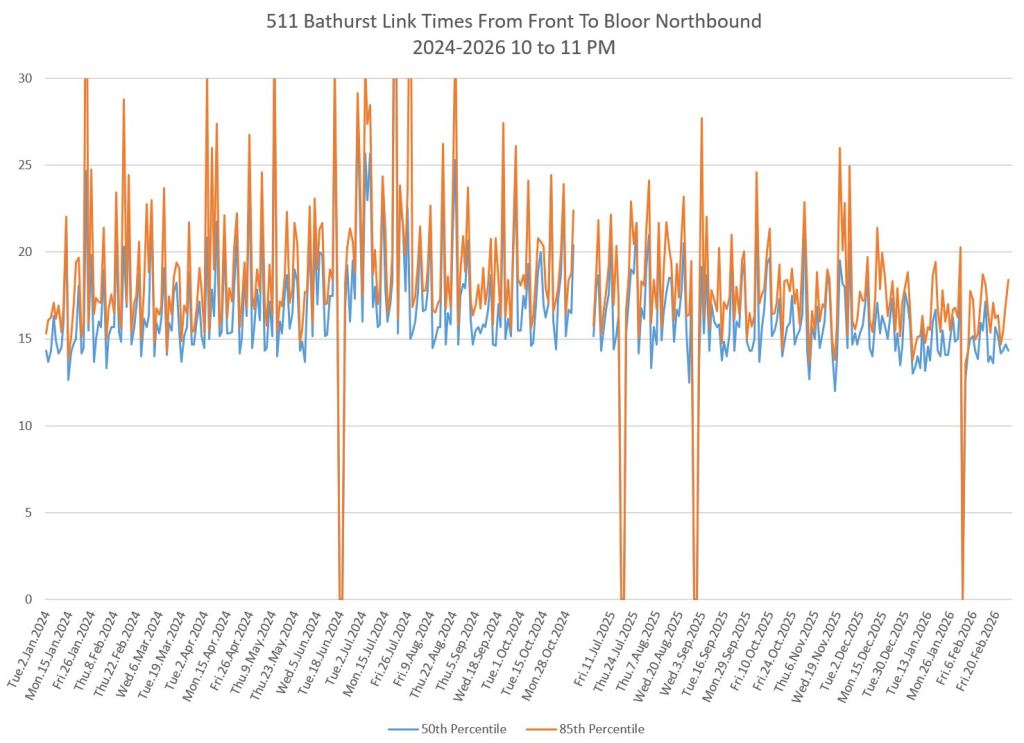
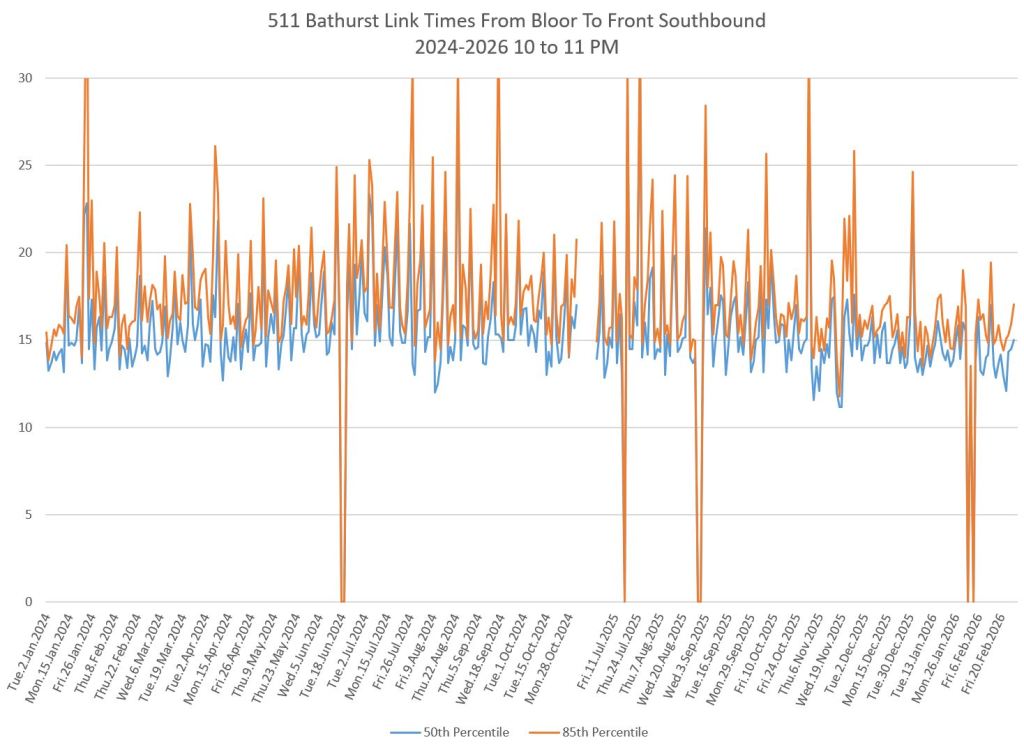
Travel Times Between Front and Richmond
The charts on the left show northbound travel times, on the right southbound. The screenlines for these measurements are in the middle of each intersection, and the times measure from crossing which are common to both directions.
The period from November 2024 to June 2025, when streetcars were diverted for construction, is omitted.
The median travel times, blue, are quite consistent over two years, but the values, especially the 85th percentiles (orange) are “spikier” by direction, time of day, and day to day. In the early and late evening, a “heartbeat” pattern emerges with consistently longer times, roughly double, mostly on Fridays when the Entertainment District is busy. This is much less pronounced starting in Fall 2025 with the introduction of reserved lanes. At other times of the day, there is a slight reduction in travel time, but not much.
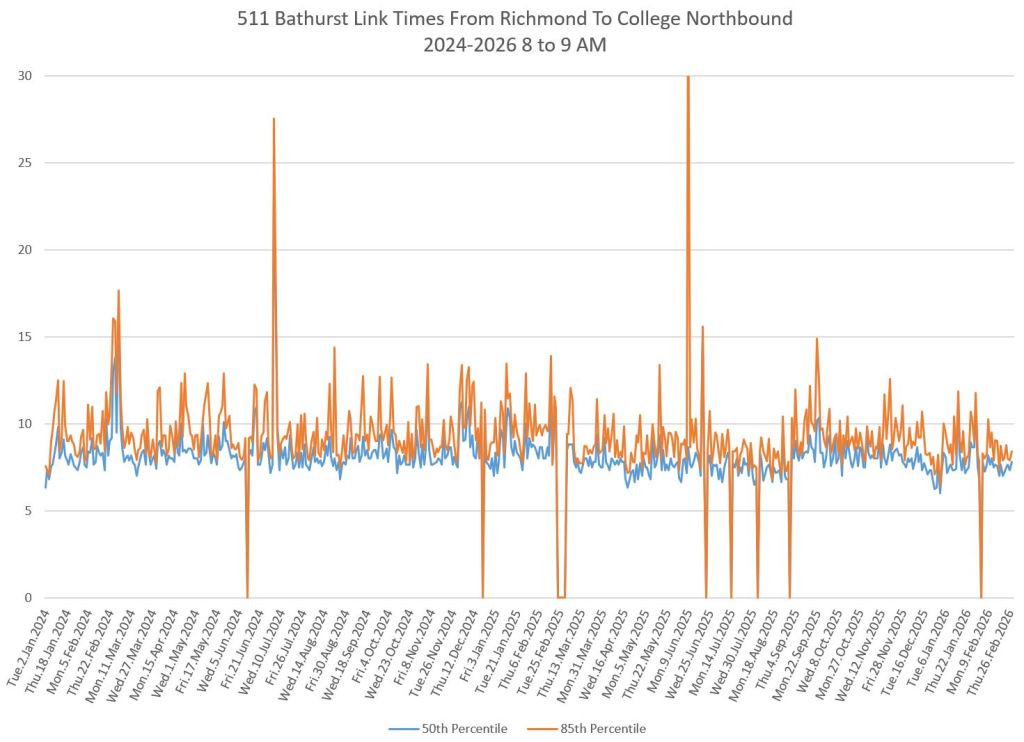
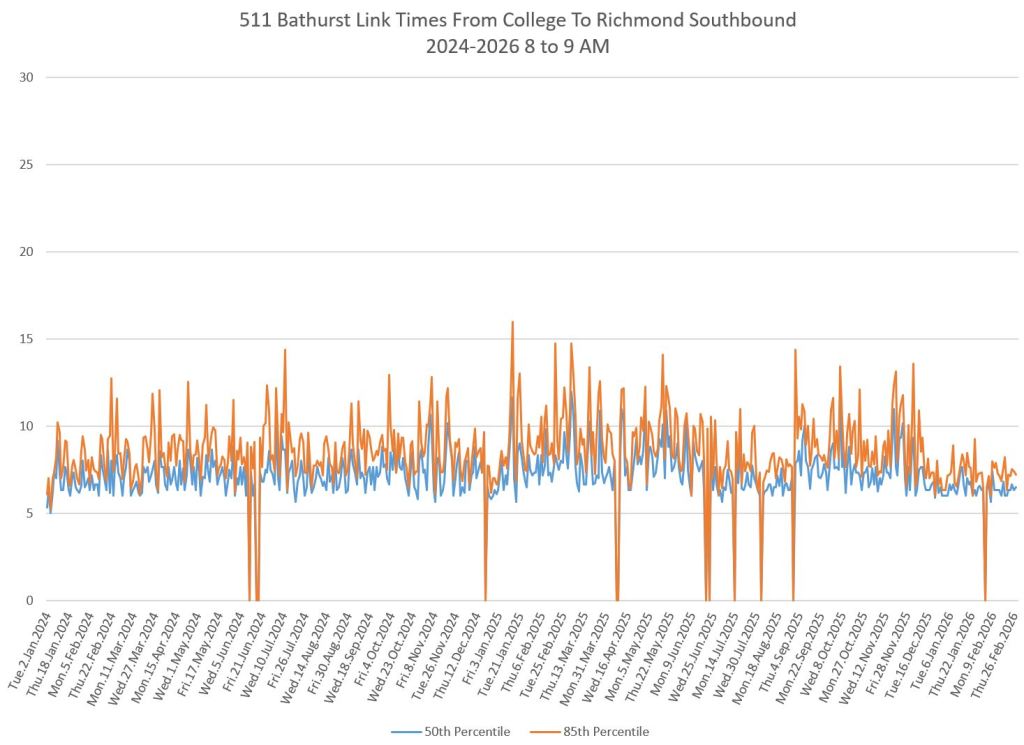
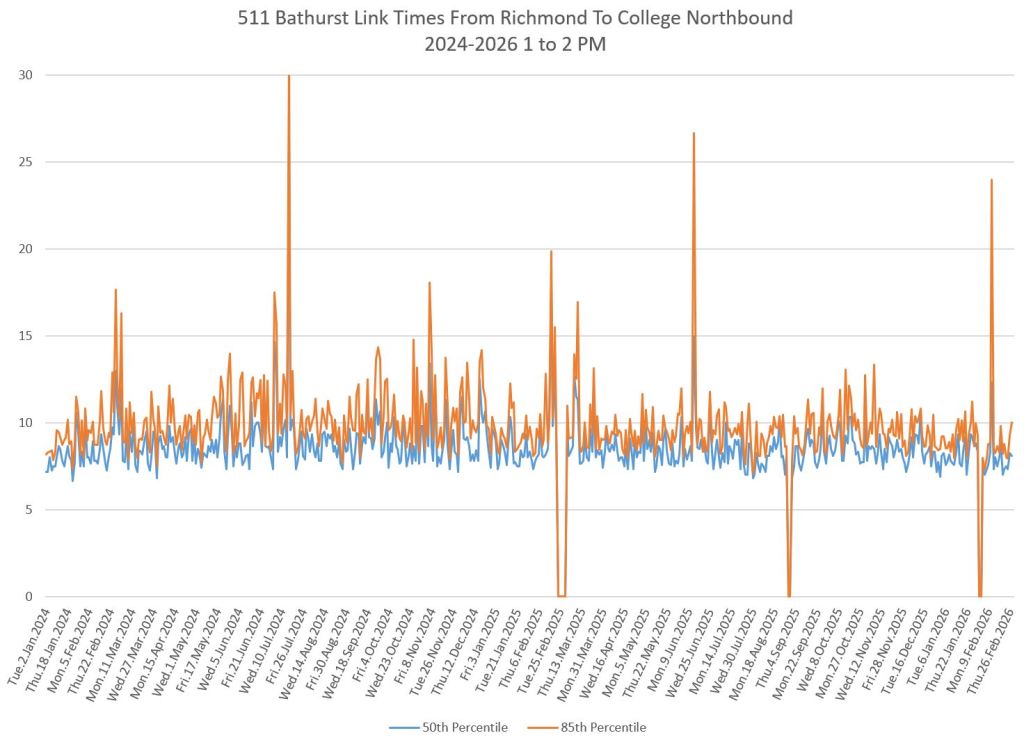
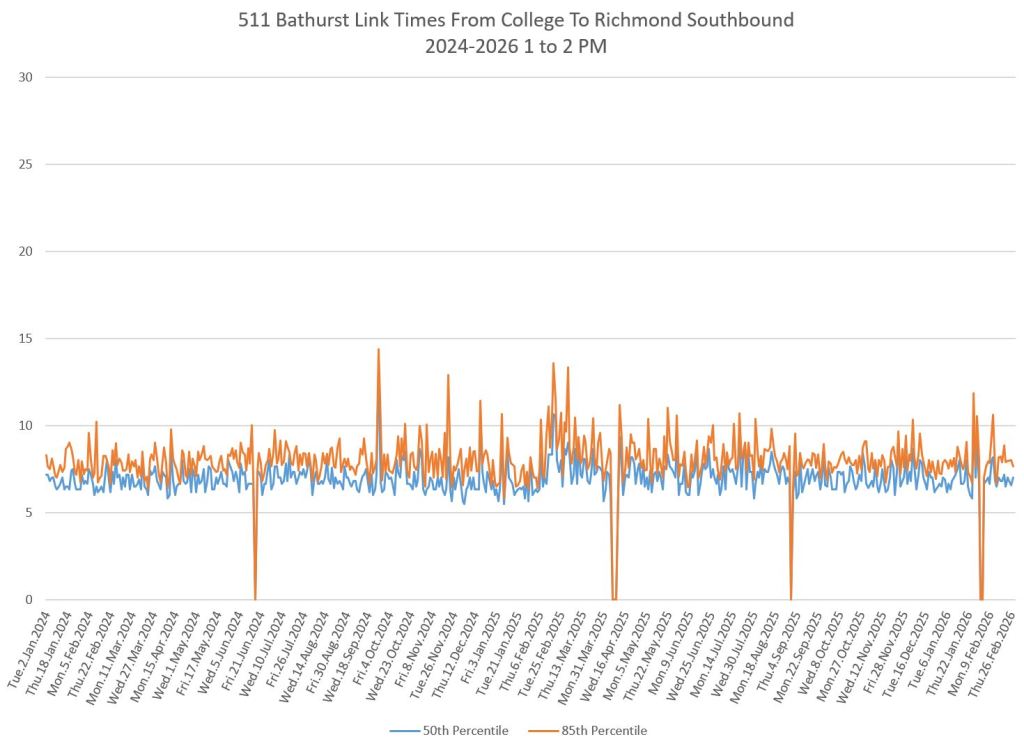
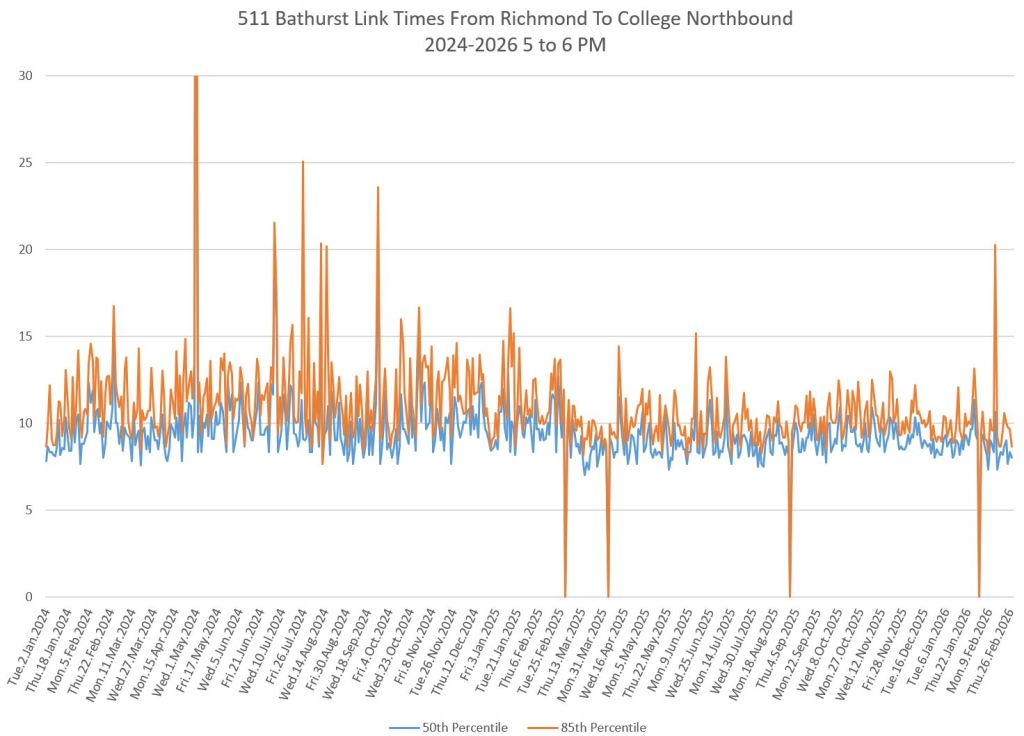
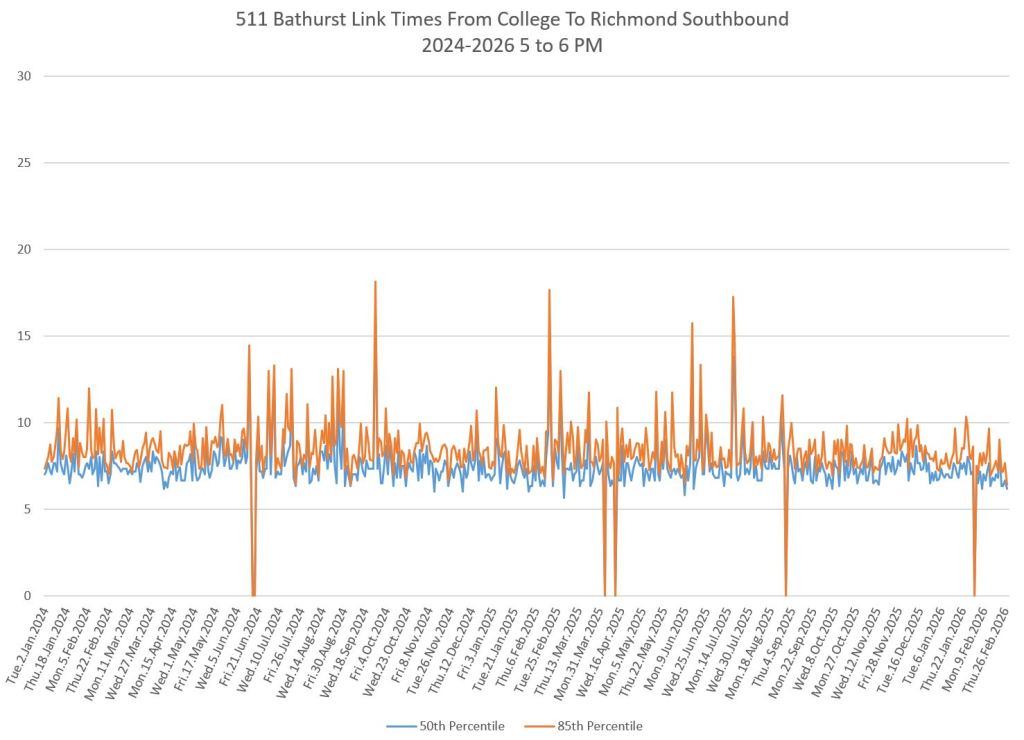
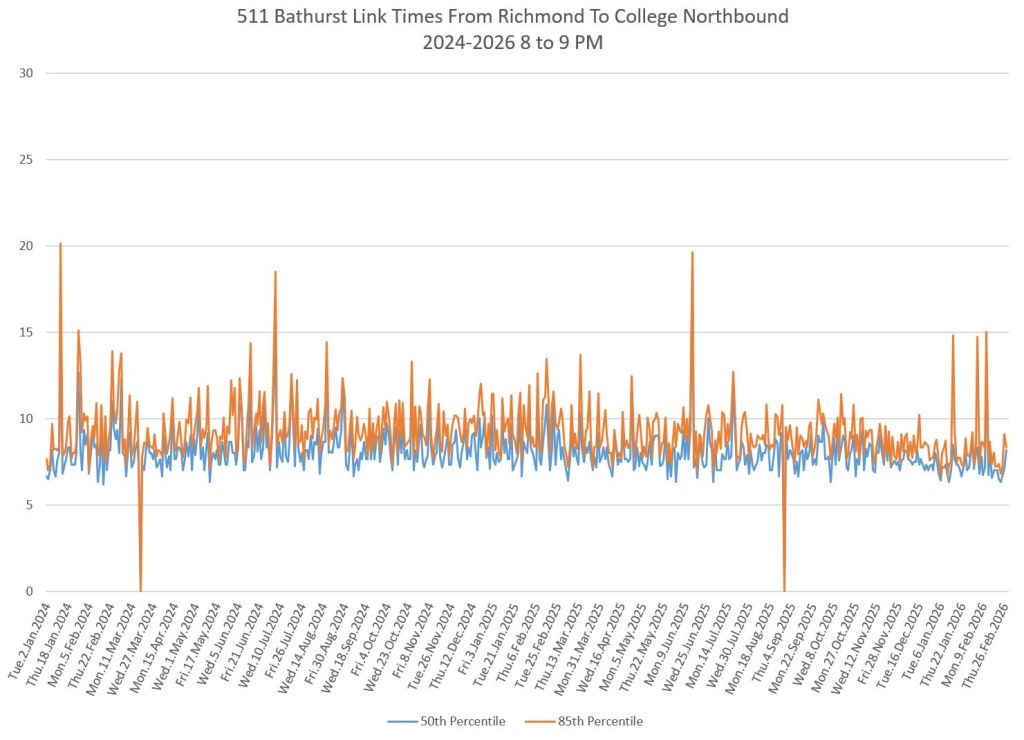
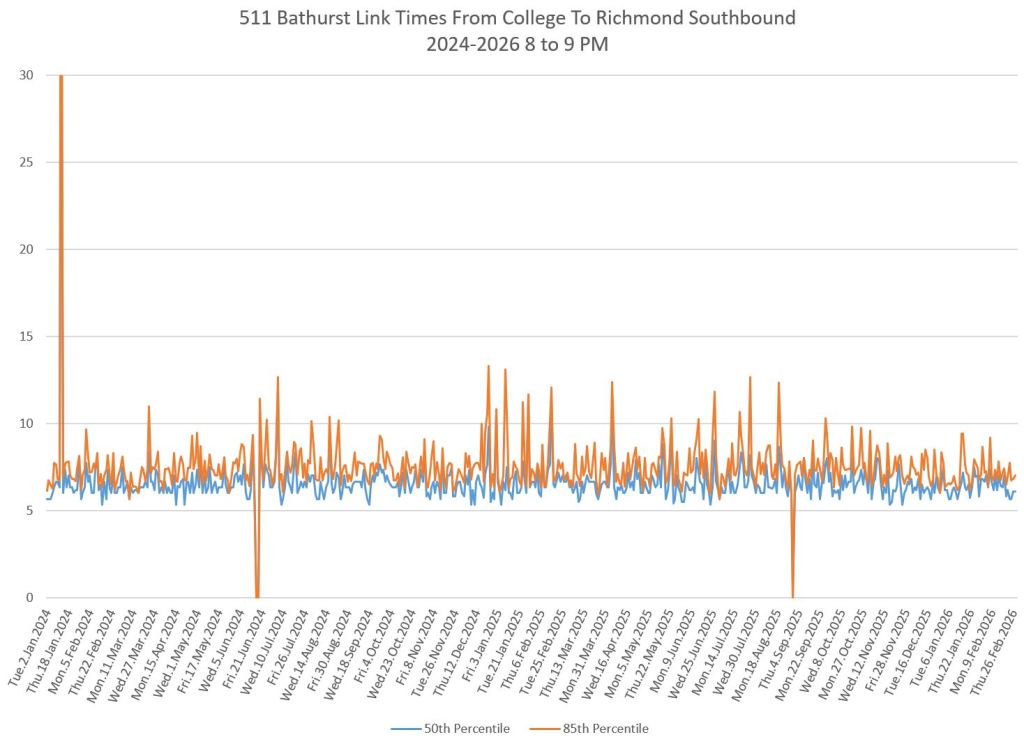
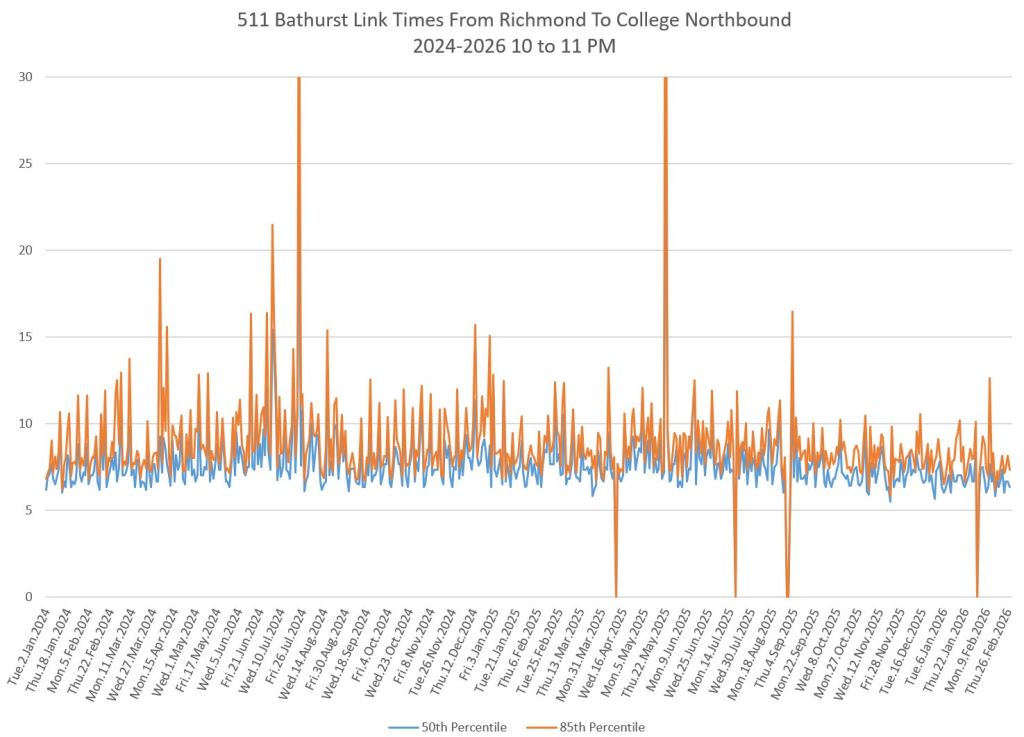
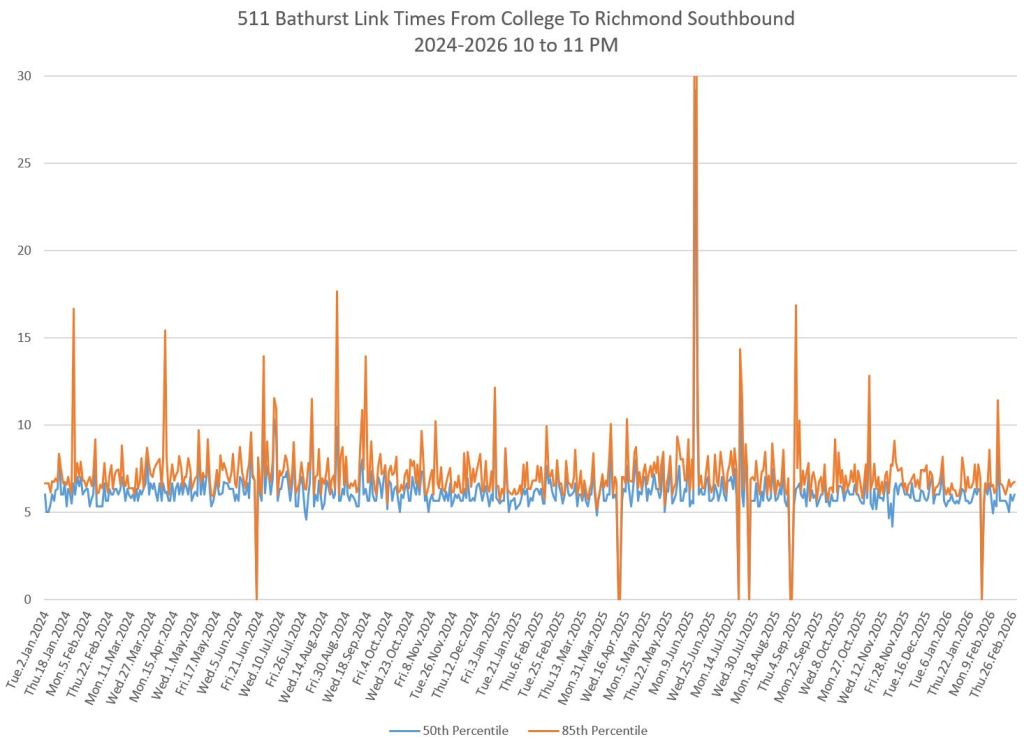
Travel Times Between Richmond and College
Between Richmond and College, northbound travel times are slightly longer than southbound, and there is more variation northbound too. The Friday heartbeat pattern appears here too in northbound data.
Note that from just south of Dundas northward there are no reserved lanes. These will be added in coming months.
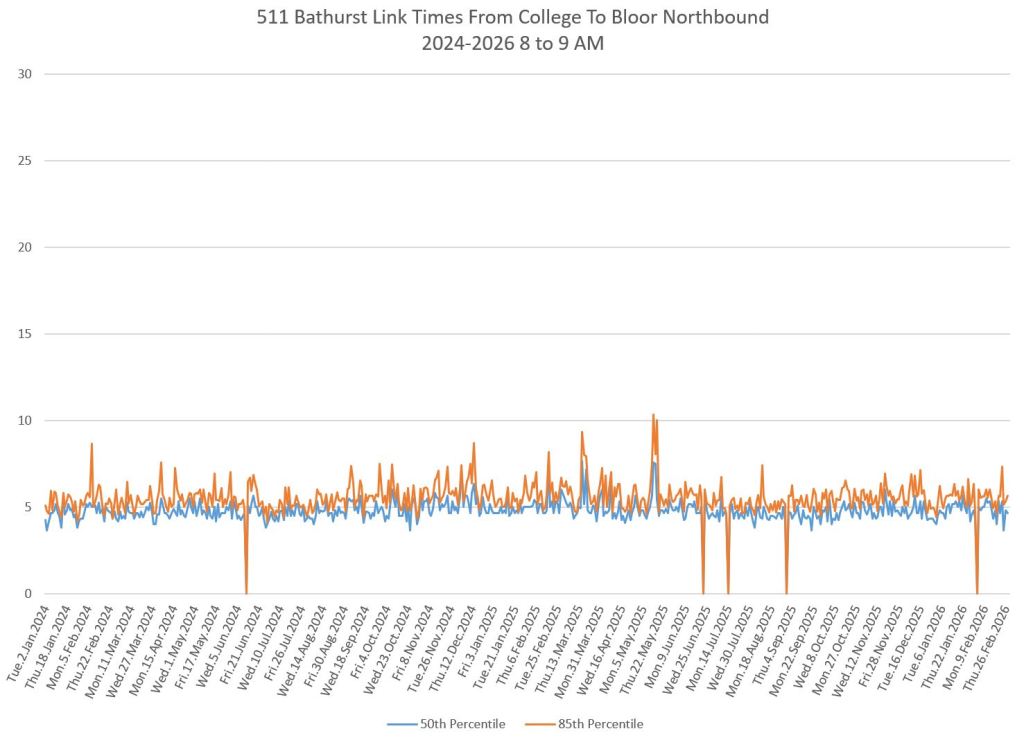
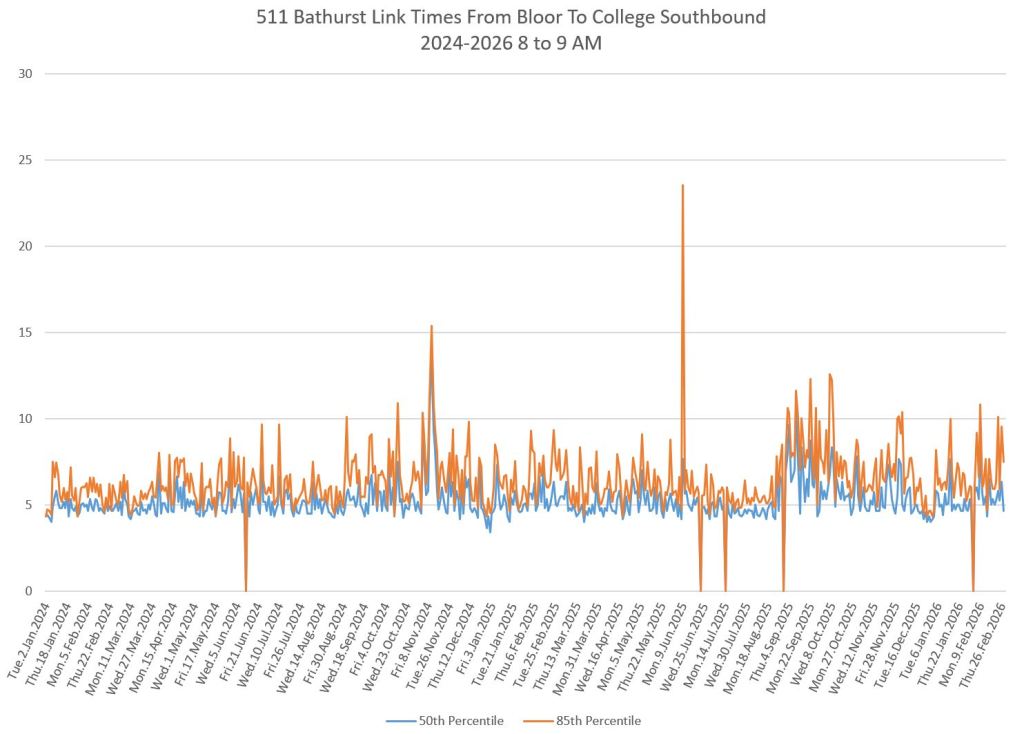
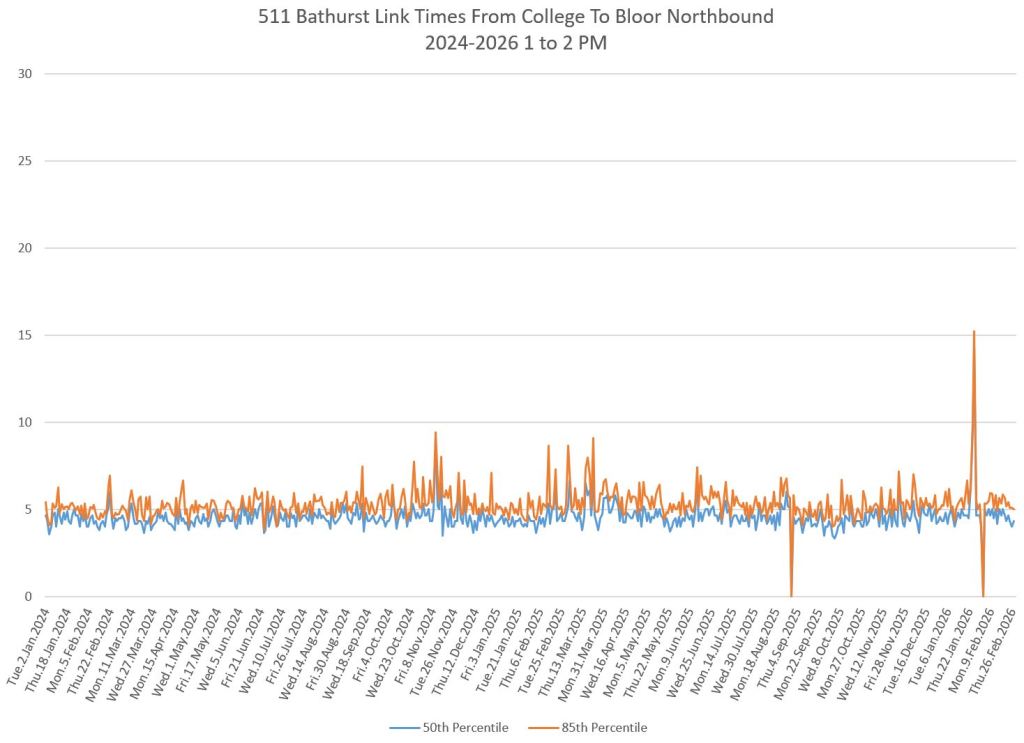
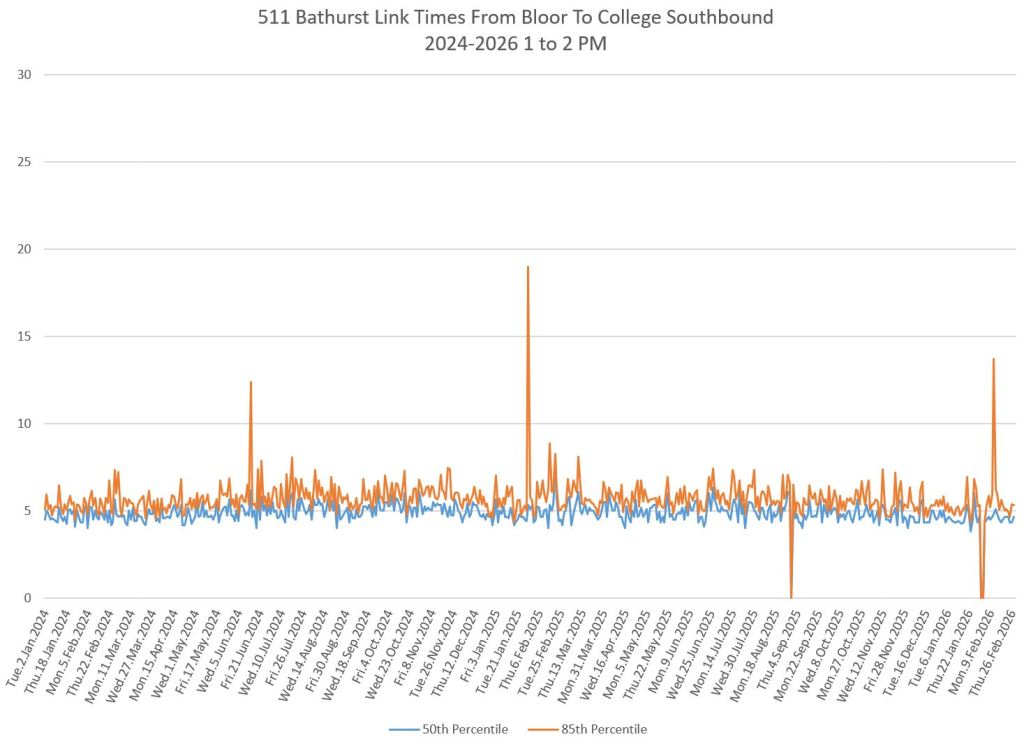
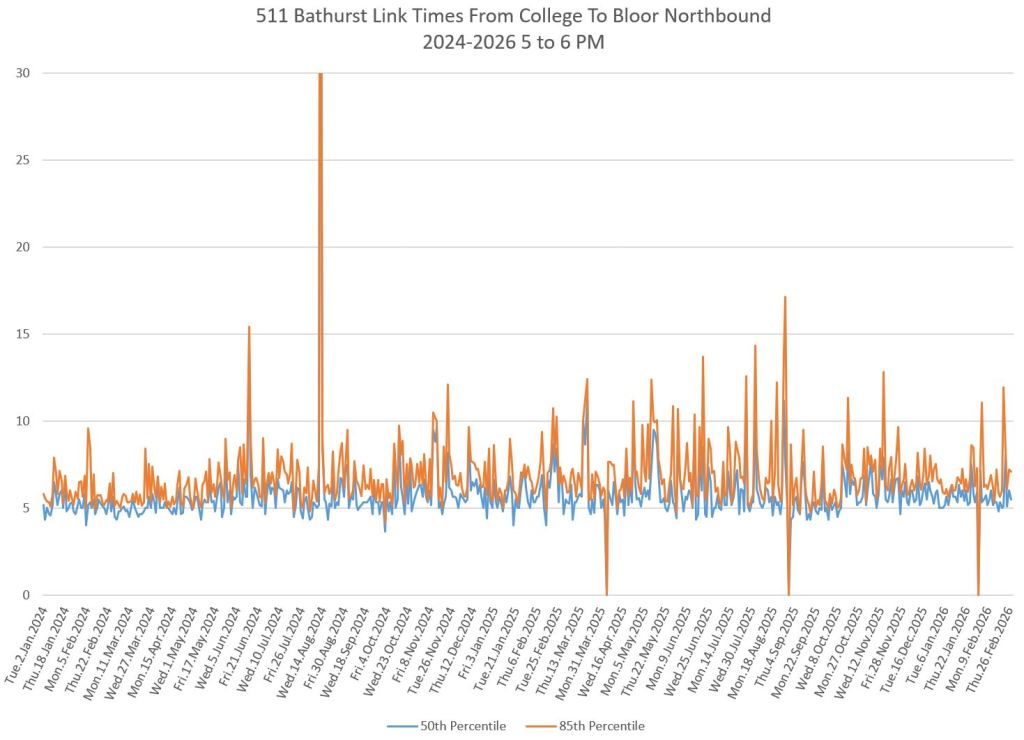
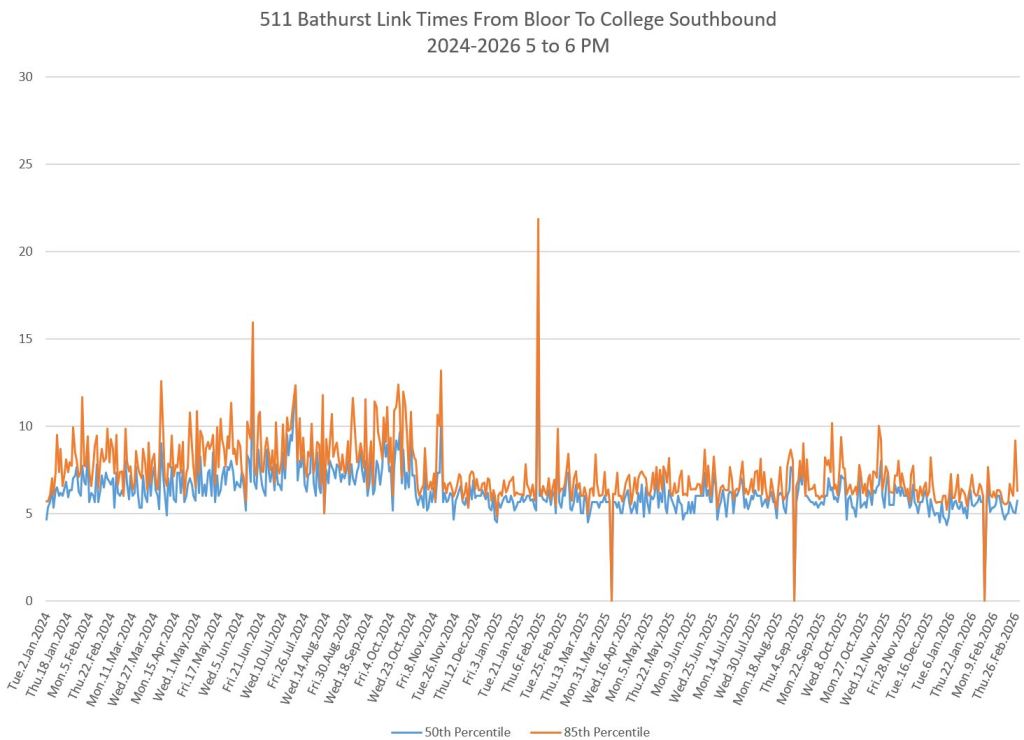
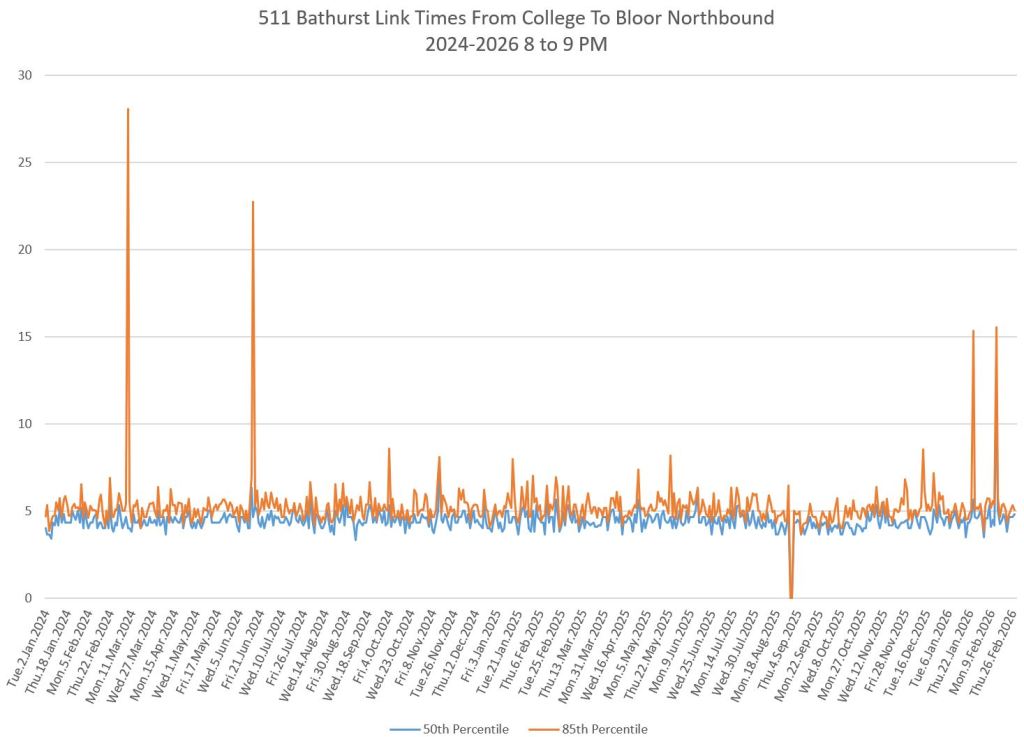
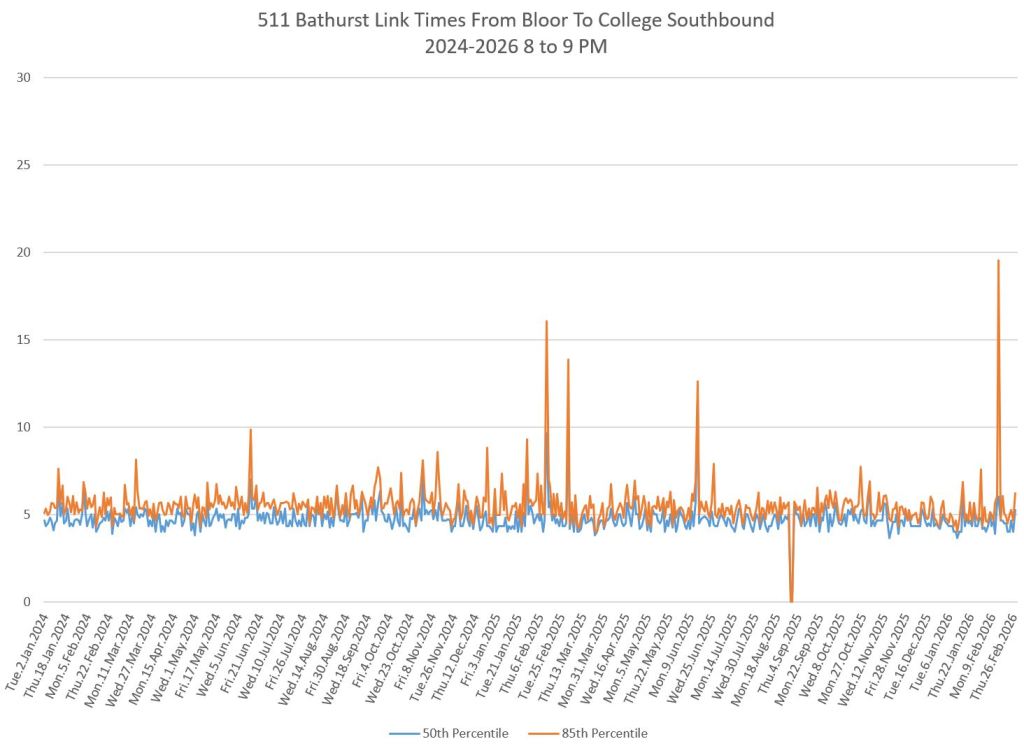
Travel Times Between College and Bloor
Between College and Bloor, the reserved lanes have not yet been installed. Travel times are quite consistent during most periods, but vary by time of day and direction.
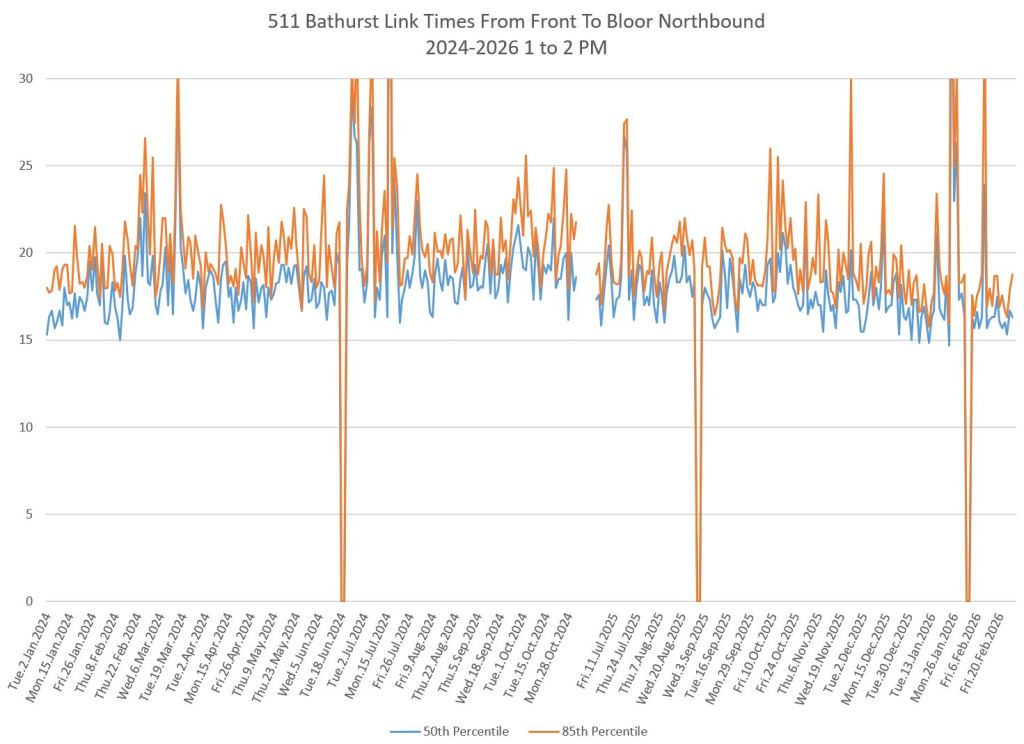
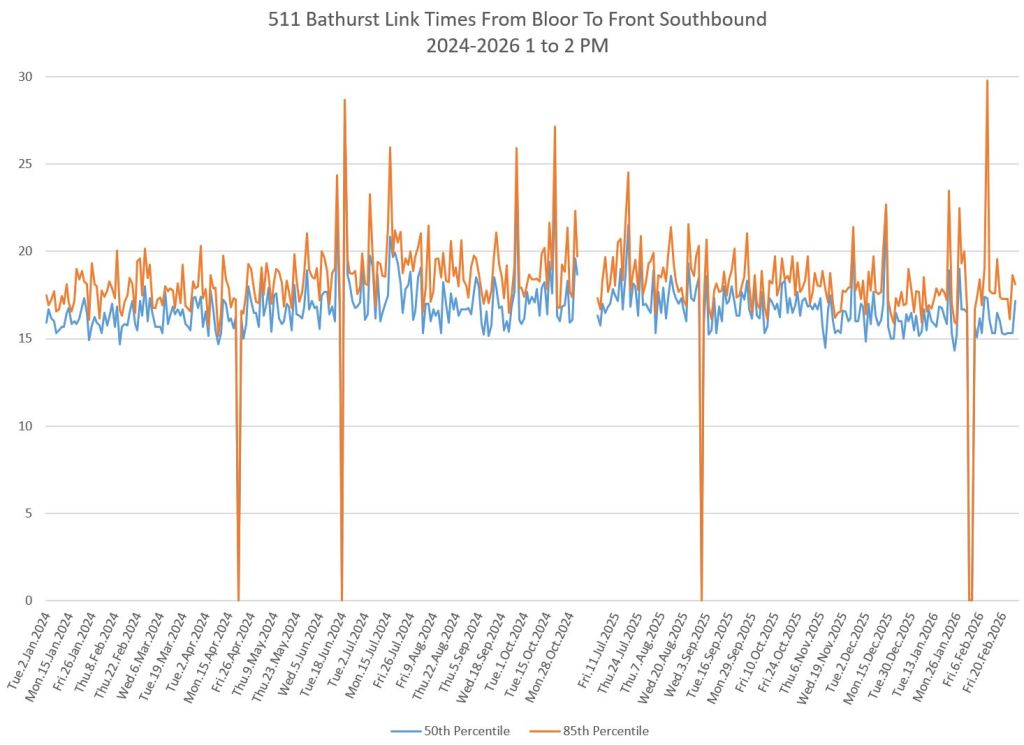
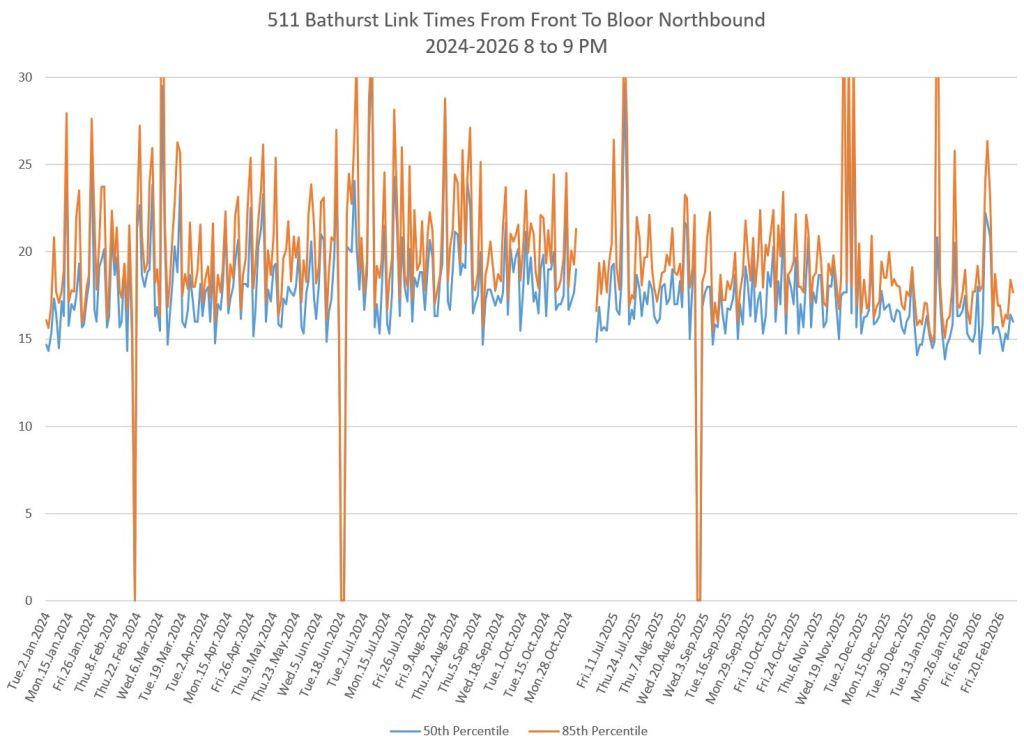
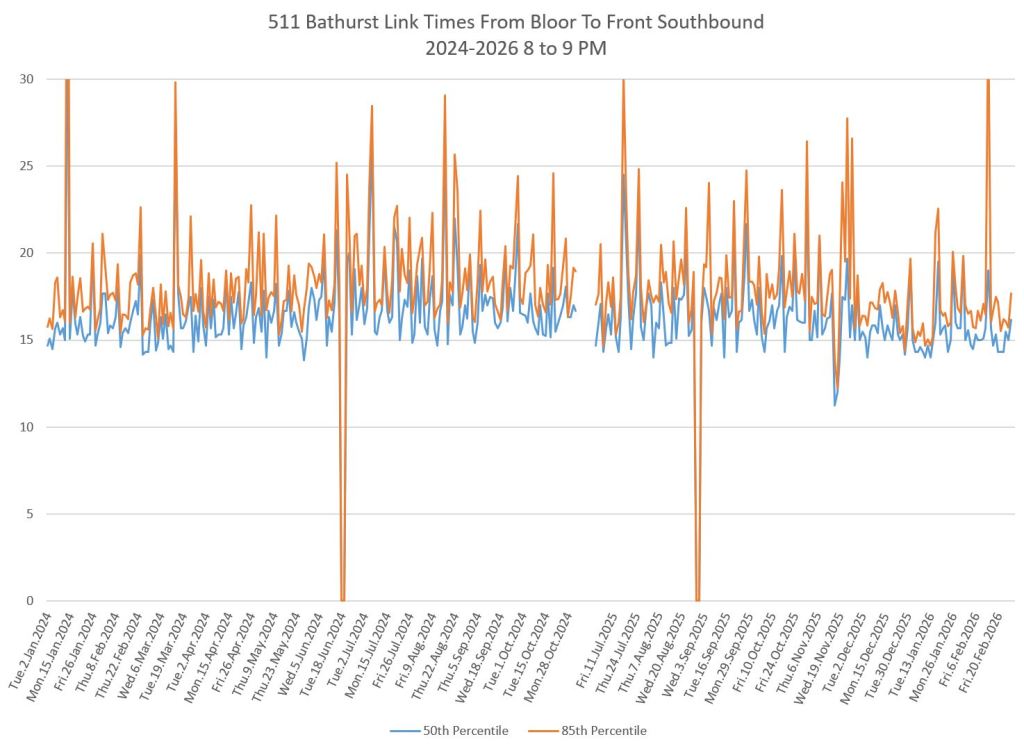
Travel Times Between Front and Bloor
These charts show the overall times between Front and Bloor where the cumulative effect, if any, over the smaller segments should show up. The period from November 2024 to June 2025 is omitted because there was no continuous service between these points during that period. Some reduction is visible in late 2025 in the median values, but not much. The greater effect is in trimming the peaks, although this could partly be masked by weather-related delays.
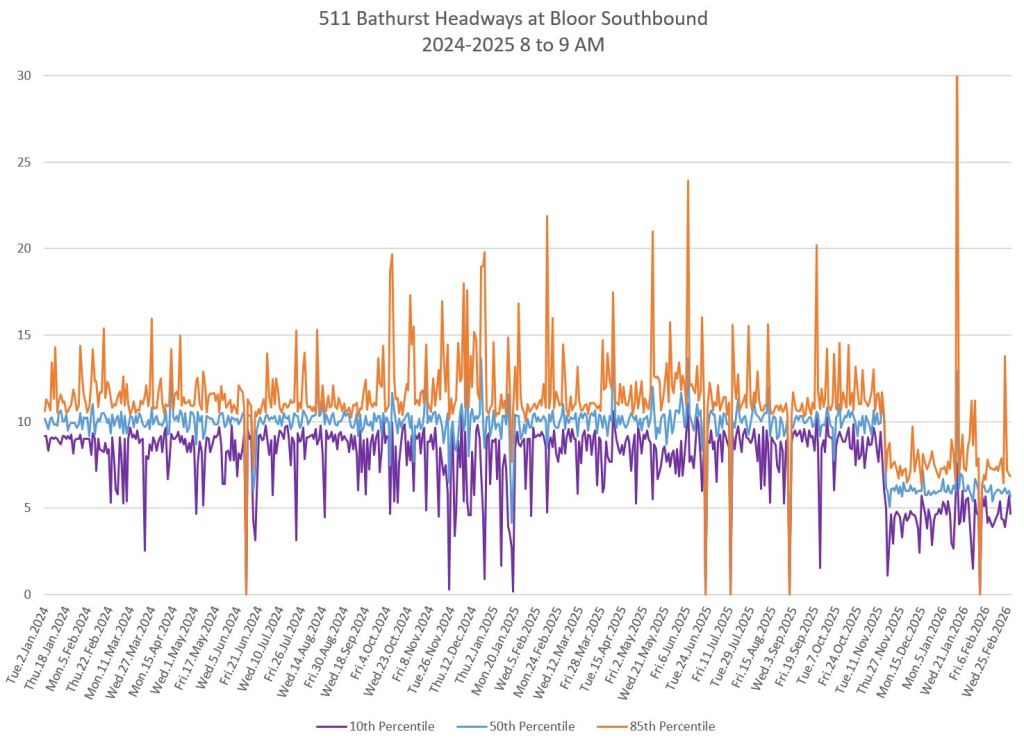
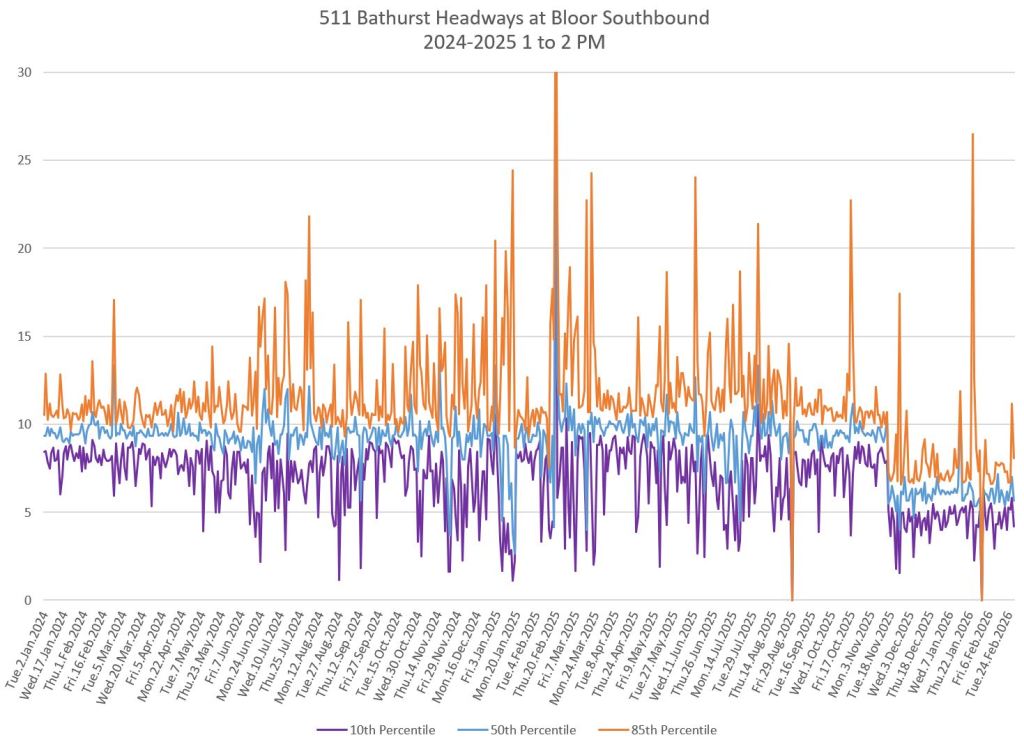
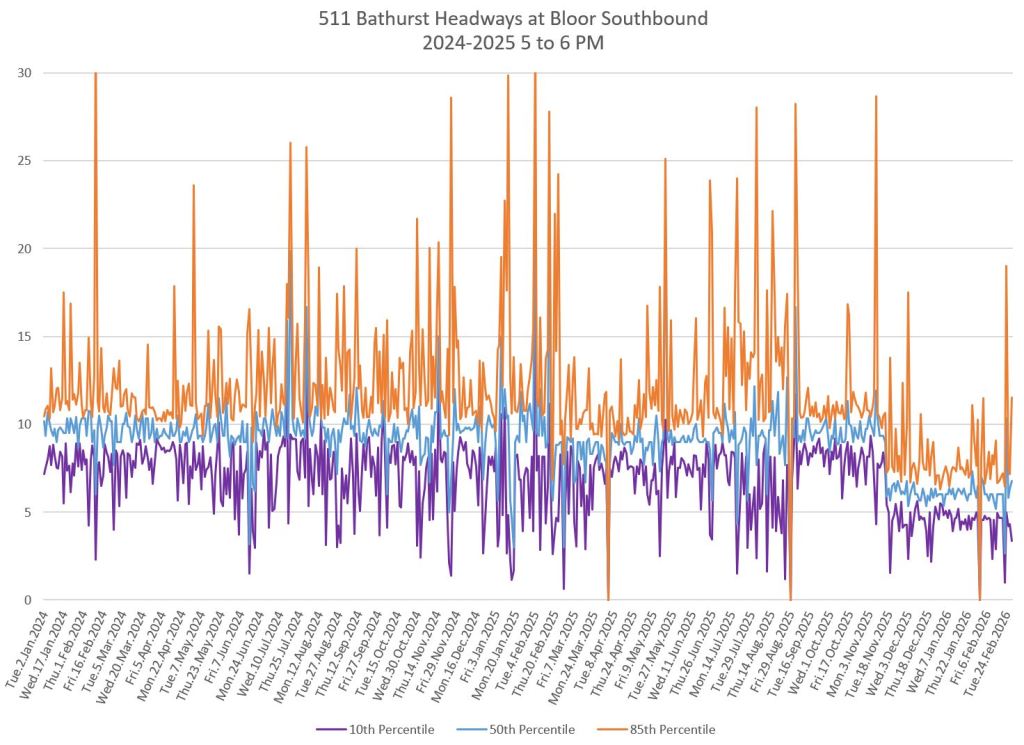
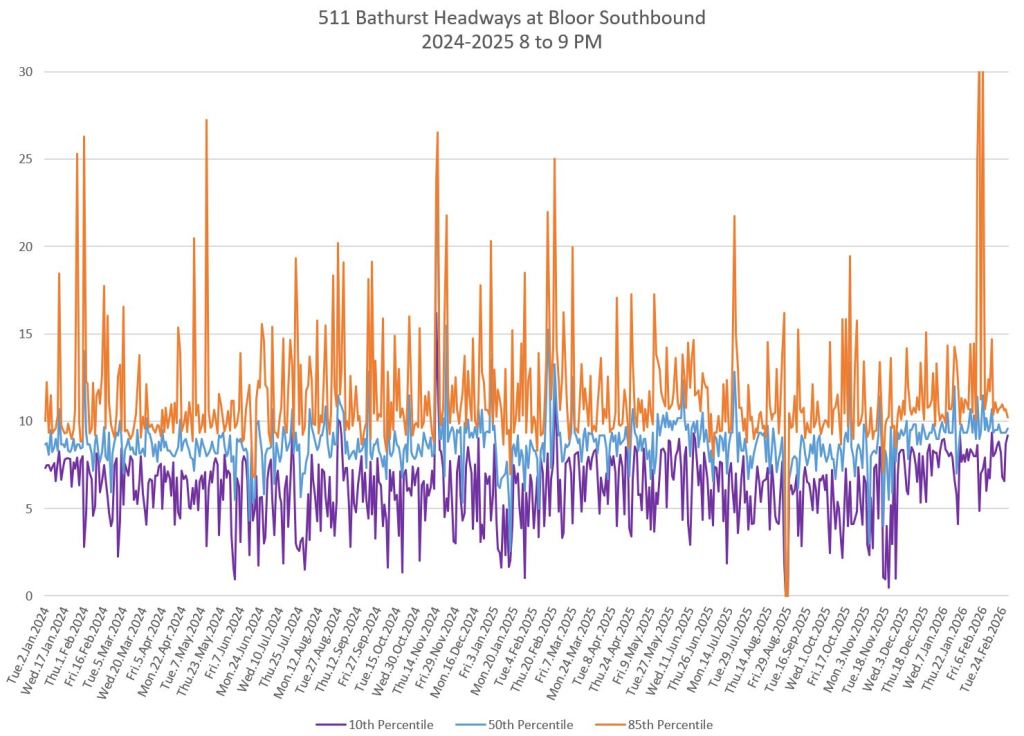
Headways Southbound from Bloor
The charts below show the headways measured crossing Bloor Street southbound. Note that the scheduled service improved to every 6 minutes in November 2025 during the peaks and midday. The stats fall to a lower level at that point.
The range of headways is shown by the spread of the 85th percentile (orange) and 10th percentile (purple) around the median (blue) which stays close to the scheduled value. The spread varies by time of day and is particularly bad in the PM peak. TTC Service Standards call for no car to leave early, but the 10th percentile runs persistently below the scheduled headway. This would be technically within standards if service were always late and departures were not regulated, but it is hard to believe that is the situation over such an extended period.
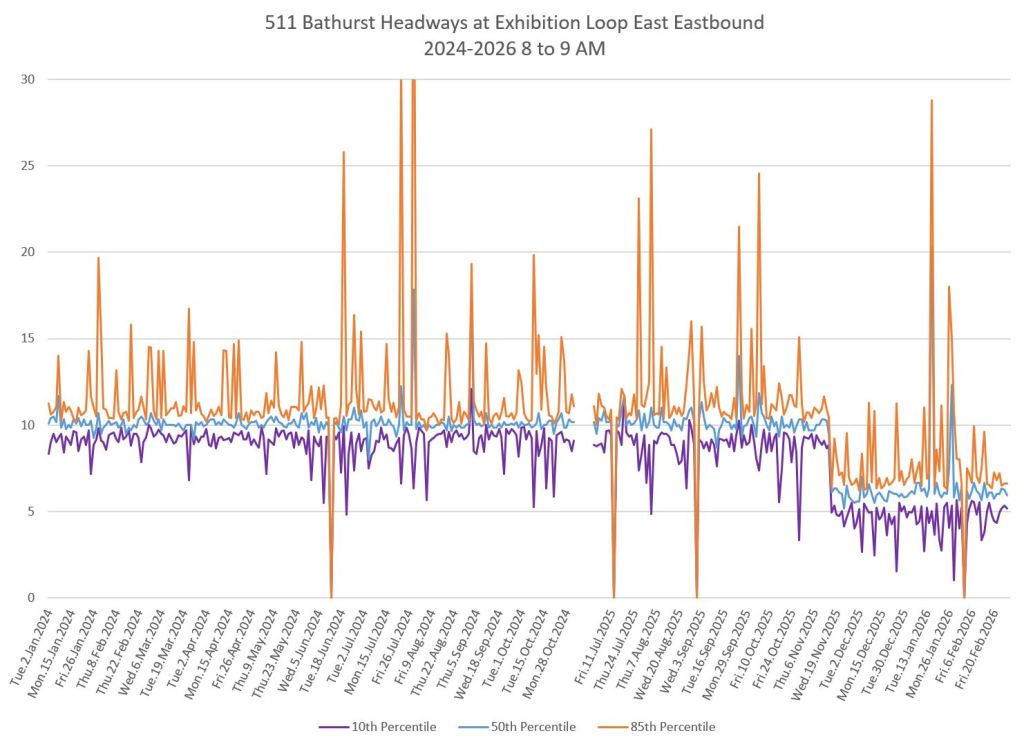
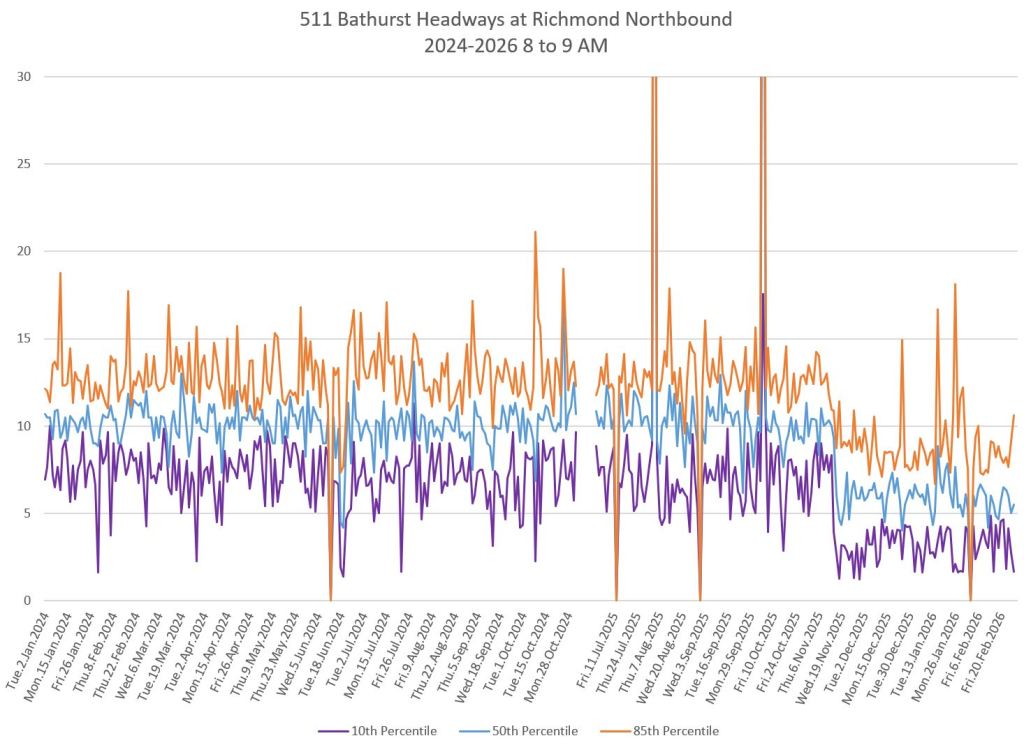
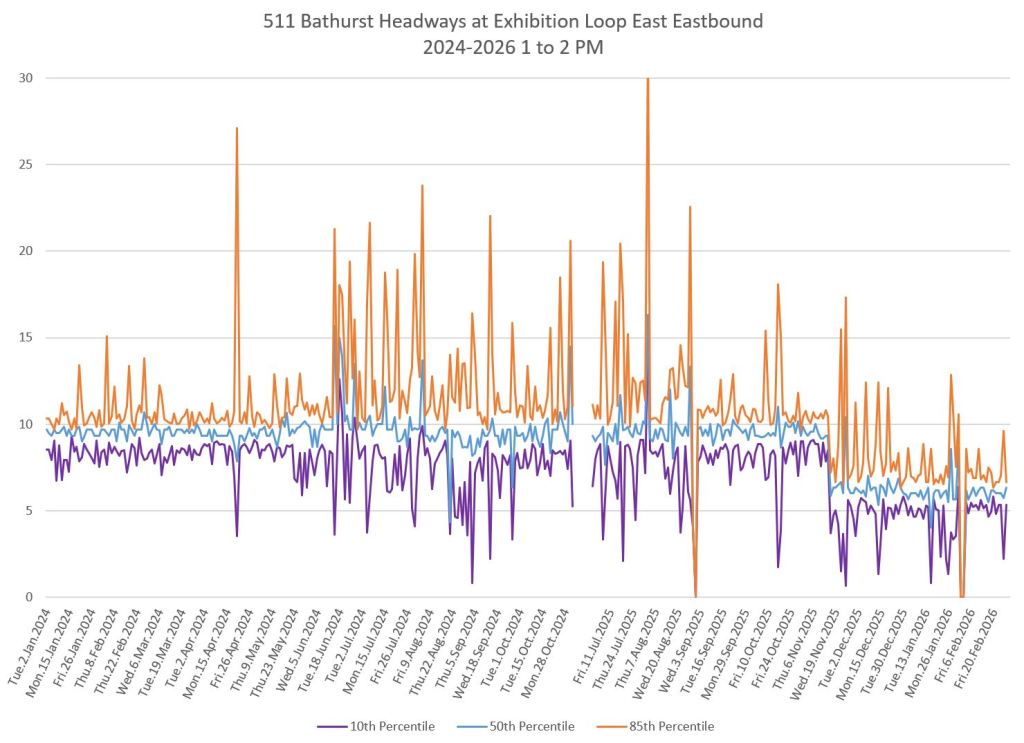
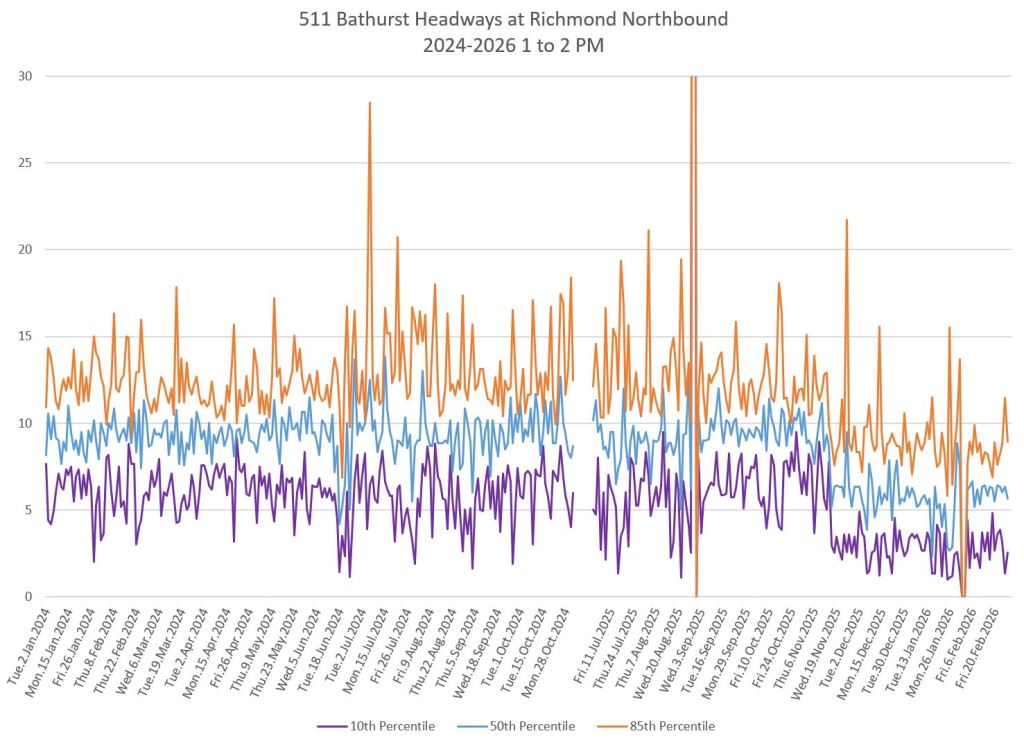
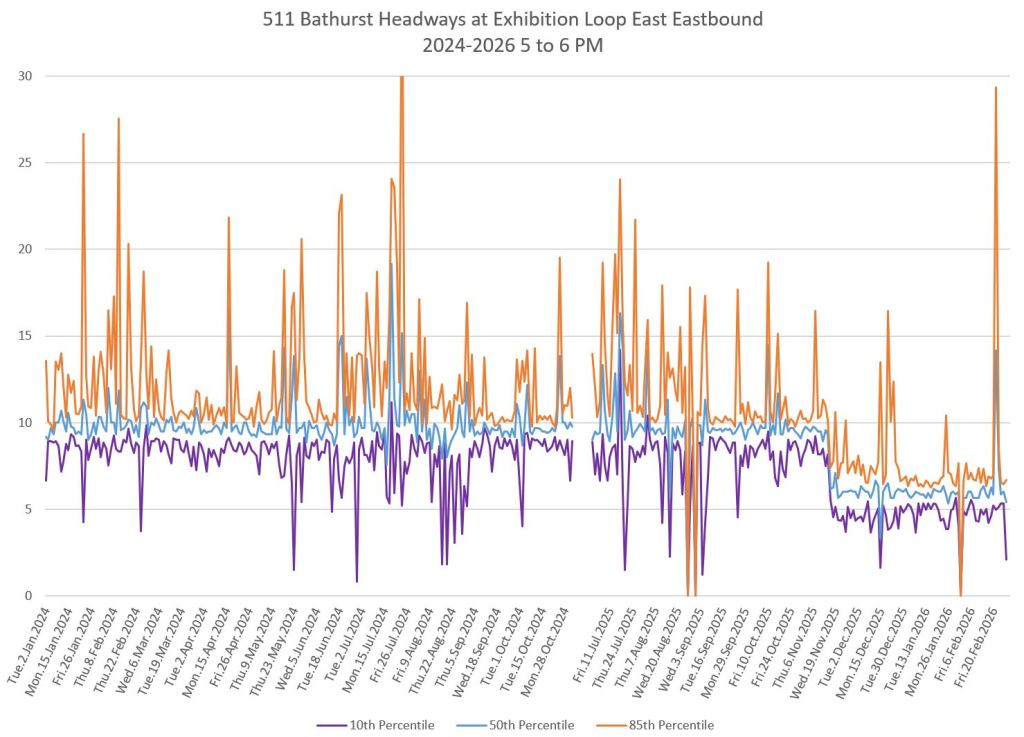
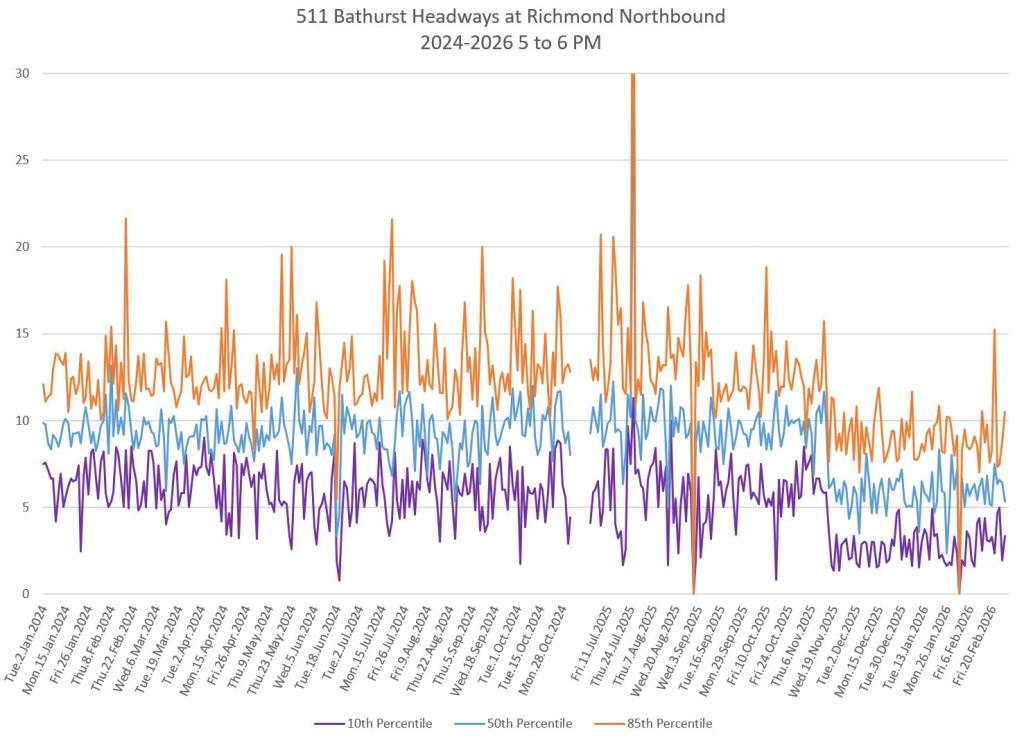
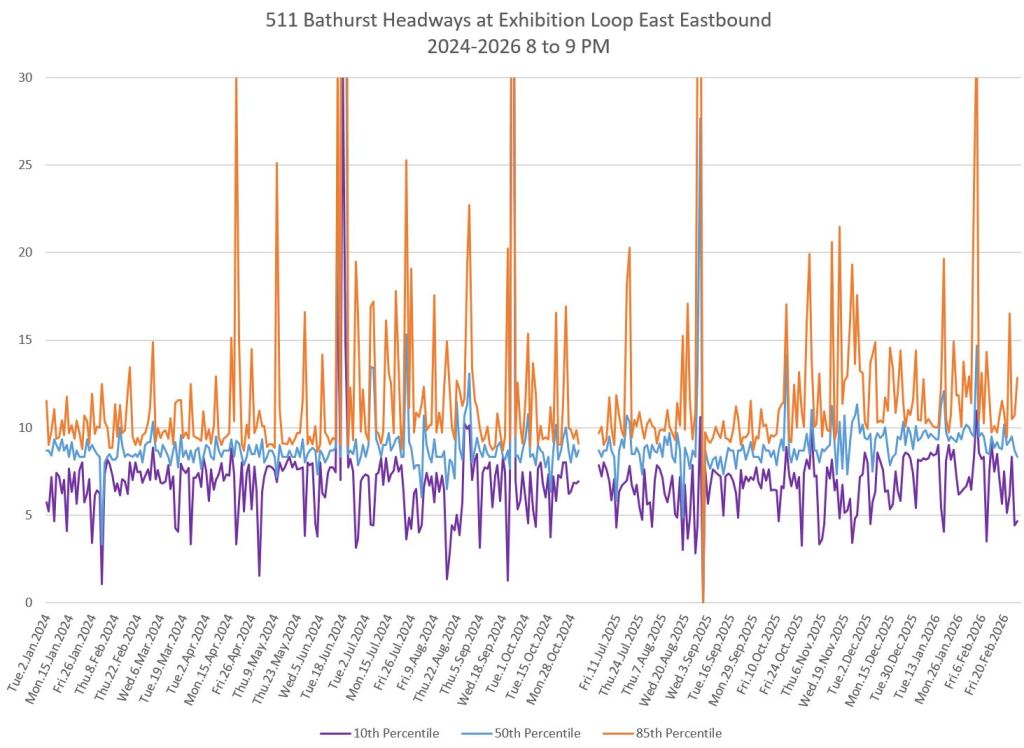
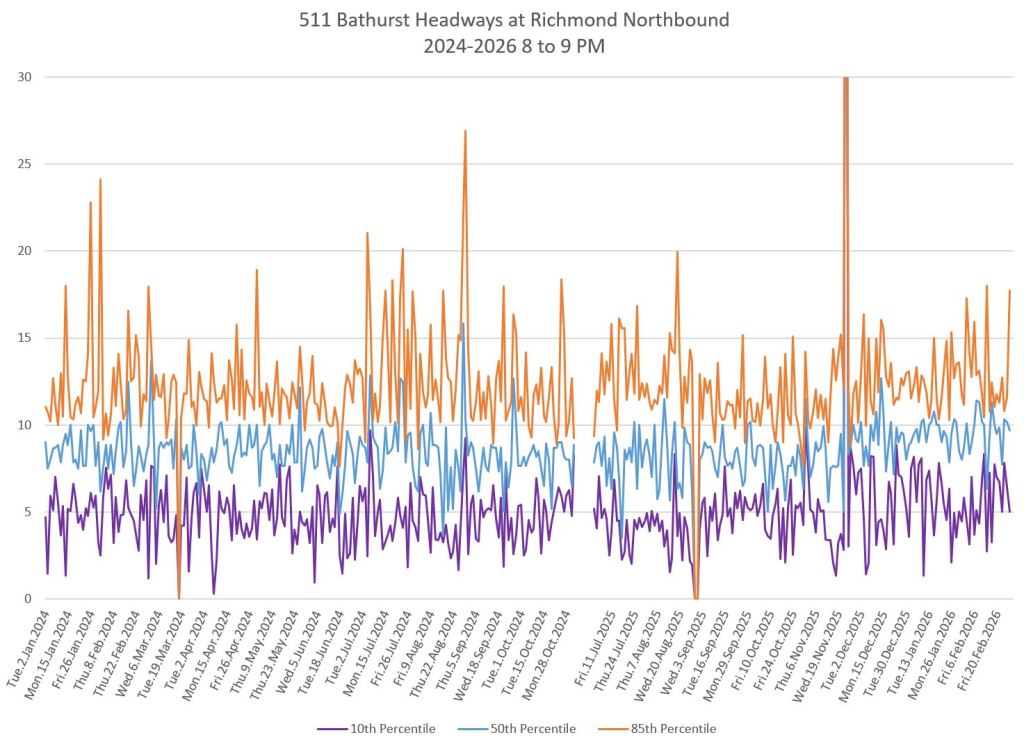
Headways Northbound from Exhibition and at Richmond
The charts here show headways leaving Exhibition Loop eastbound (left) and the corresponding time periods northbound at Richmond (right). Note that in this comparatively small distance, the spread in values grows substantially showing that closely spaced departures from the terminal do not last long. Even with a six minute scheduled headway and reserved lanes over much of the distance, the data from November 2025 onward show that service is much less reliable at Richmond than it was leaving Exhibition.