
Readers with long memories might recall the early days of plans for a new streetcar order including discussions about how large a vehicle should be purchased. A major concern at the time was the possibility that the TTC would change schedules and run less frequent service with the larger cars just as they had when the articulated version of the CLRV (the previous generation of cars) arrived in the late 1980s.
That concern was softened by a TTC claim that service would actually improve. Peak periods would see slightly less frequent service, but a net increase in capacity, while off-peak periods would see little change in frequency effectively doubling the capacity of service. At the time, crowding was a big issue and this persisted right up to the pandemic in 2020, by which time all of the old cars had been retired. The management proposal was approved in July 2013.
As the CLRV/ALRV fleet aged, there were problems with reliability of older cars and the need to operate buses on some lines thanks to a shortage of working vehicles. Some repairs were done at considerable cost, but these were more cosmetic than a true life extension.
Moving forward to 2026, there has been a lot of talk of restoring pre-pandemic service levels. TTC fudges the numbers on this in many cases citing vehicle hours operated, not actual service frequencies which have been degraded by longer travel times.
(For example, if a round trip, including terminal layovers, takes two hours or 120 minutes, then 20 cars will provide a 6-minute service. If the round trip gets longer but no cars are added, the service is less frequent, but the number of vehicle hours stays the same. From a rider’s point of view, service is worse, but from a budget outlook, there is no change. This is at the heart of the discrepancy between TTC service claims and rider experience.)
After years of changing service levels and demand, the TTC’s Five Year Plan foresees a return to six minute headways, at most, as a new standard for daytime service. This has been rolled out on some routes over the past year, but not all.
- Already at 6 minutes or better: 504 King, 510 Spadina
- Improved to 6 minutes: 512 St. Clair (Sept/25), 511 Bathurst (Nov/25), 505 Dundas (Nov/25)
- Pending, but with no committed date: 501 Queen, 503 Kingston Road, 506 Carlton, 507 Long Branch.
The Five Year Plan (at p. 4) includes provision for extra spending in 2027 and 2028, but this is not tied to specific routes. There is nothing in the Plan for 2026.
A related issue is the size of the streetcar fleet. Leading up to 2020, the issue was how many cars were actually available, and some service cuts flowed directly from this. With the recent delivery of 60 additional cars, fleet availability should not be an issue although service can still be limited by a lack of operators. The TTC currently schedules 163 cars at peak out of a fleet of 264. If services now operating with buses due to construction were also using streetcars (503 Kingston Road and the Broadview branch of 504 King), the peak requirement would rise to 178. Allowing for maintenance spares this would drive the total requirement to 214 leaving 42 surplus for service improvements (allowing for 8 spares).
| February 2026 Schedule PM Peak | Full Streetcar Service | Possible Service | |
|---|---|---|---|
| Peak Requirement | 163 | 178 | 220 |
| Spares at 20% | 33 | 36 | 44 |
| Total Requirement | 196 | 214 | 264 |
| Fleet | 264 | 264 | 264 |
| Surplus | 68 | 50 | 0 |
The problem, of course, is that the TTC barely has budget headroom to operate existing services let alone increases.
In theory, some of the surplus cars will eventually operate the Waterfront East LRT extension, but that service is at least 8 years away even assuming Toronto finds the money to build it. In any event this will not require anywhere near all of the current surplus fleet. Another issue is that the “streetcar network” has not operated with 100% streetcar service for a few decades thanks to various construction projects and vehicle shortages.
There are parallel issues with the bus network, but they are complicated by issues of vehicle reliability and the need for a spare pool to cover the unreliable LRT service primarily on Line 6 Finch West. I will turn to the bus fleet in a separate article.
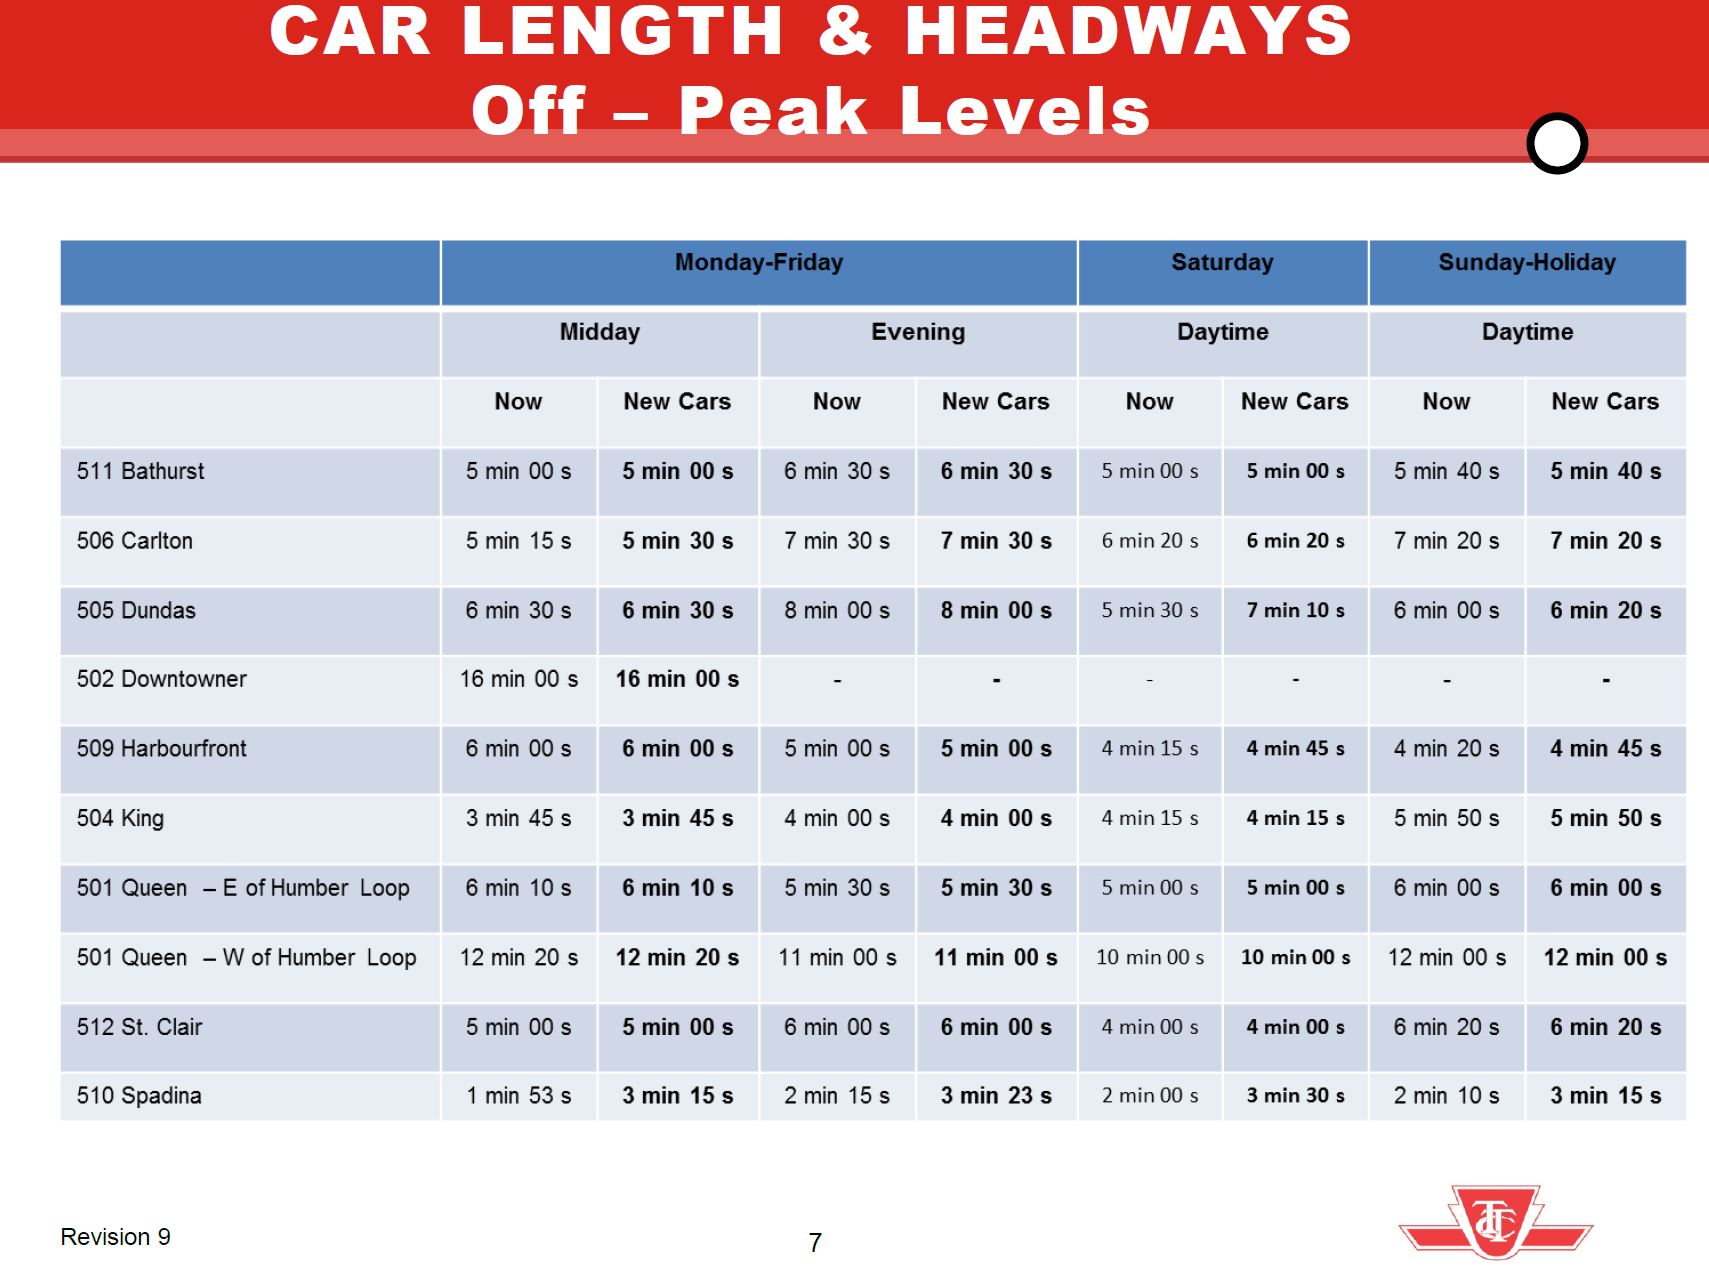
Back in 2013, the TTC proposed how it would operate with the new streetcar fleet. During peak periods, headways would widen particularly where existing service was very frequent. Notably on 501 Queen, there would only be a slight widening of the time between cars in the AM peak and no change in the PM peak. This reflected the fact that Queen was already running with the 75-foot long ALRVs and needed more capacity.
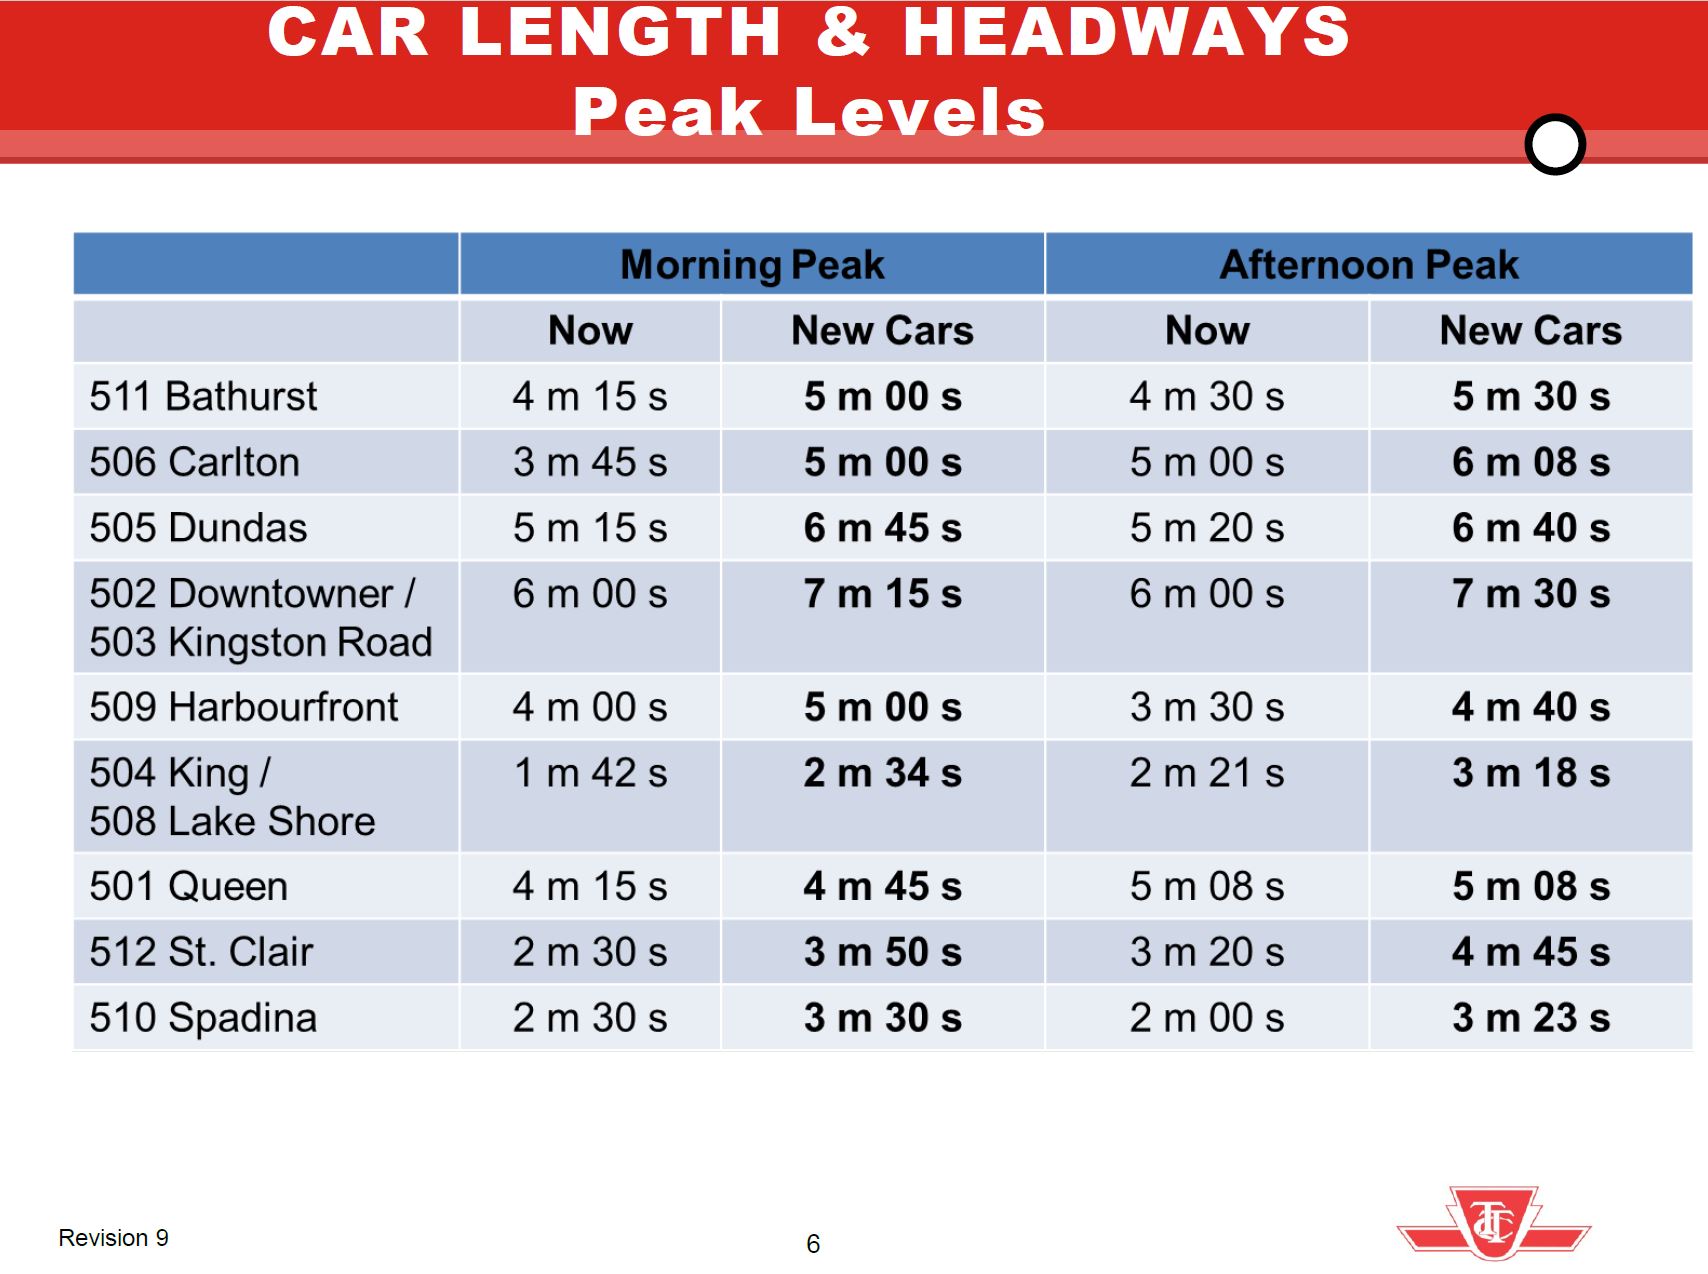
In the off peak, most routes would see no change in service level except for 510 Spadina due to its already frequent service of 50-foot CLRVs that could not be sustained at terminals with the larger new cars.
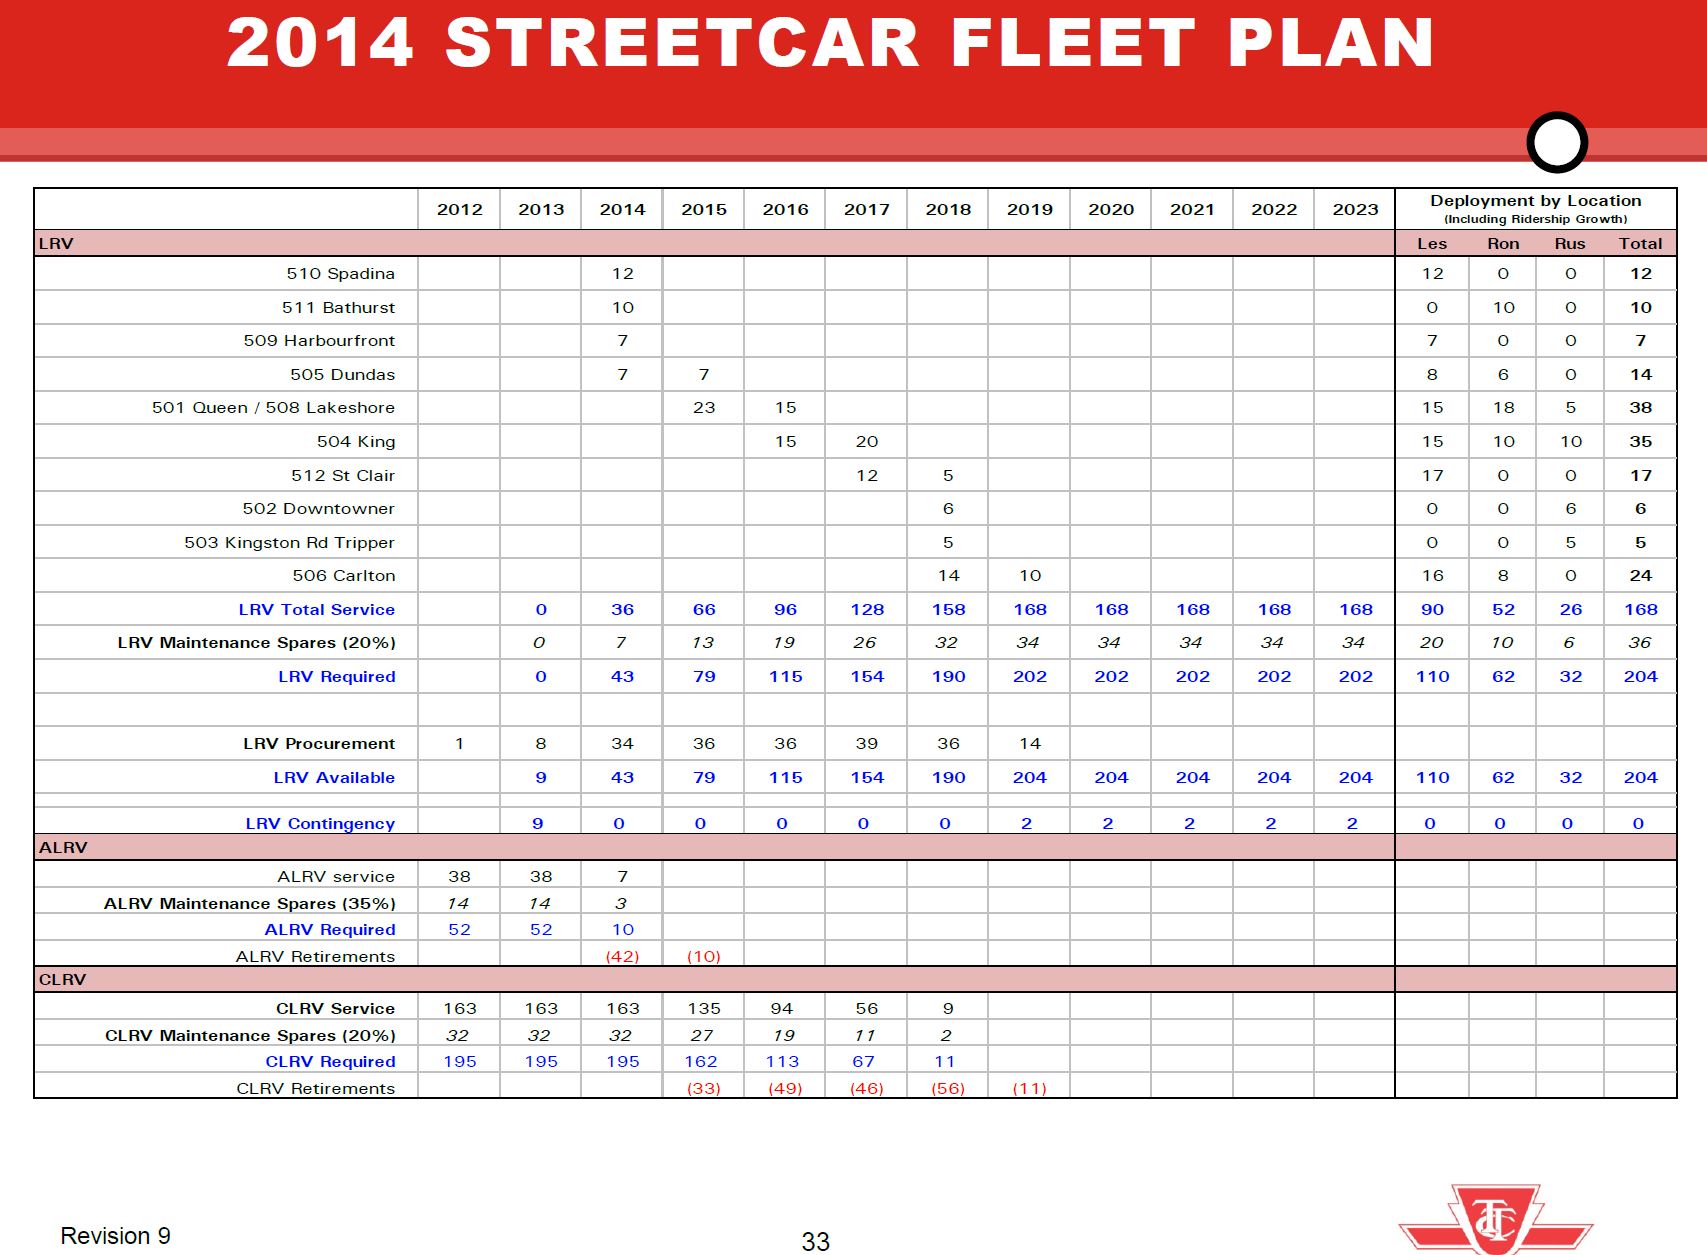
The overall fleet plan showed a buildup to a peak requirement of 168 cars plus 20% spares.
This plan gave a bright future for streetcar service and capacity growth, but things did not work out that way. Service today is generally lower than originally projected for the new fleet, and part of this reduction is due to slower operating speeds and greater provision for terminal recovery time even on routes with reserved lanes.
A related question is the effect that less frequent service has had on ridership. There is a post-pandemic slump on the streetcar system in part due to work-from-home for office jobs and remote learning for post-secondary students. However, even allowing for the pandemic era drop, the problem remains in attracting riders back to transit when streetcars are less frequent and slower, compounded by chronic problems with service reliability. Charts tracking streetcar ridership from 1976 to 2024, the last year published by TTC, are at the end of the article.
These routes are in the part of Toronto where transit riders should be easy to win, but a long decline in service frequency discourages those who have the option to use another mode including private autos, ride hailing or cycling. Service cuts during economic downturns do not magically get reversed as times improve, and ridership that might be wooed back to transit instead faces less reliable service and a political attitude that favours big spending on subway projects, not surface transit.
The remainder of this article looks at each route in detail to see how the actual service changed from the 2014 plan through the 2020s to today comparing:
- The 2014 headways for AM Peak, Midday and PM Peak in the management proposal.
- The proposed headways after routes converted to Flexity streetcars.
- The actual scheduled service in January 2014, January 2020 (just before the pandemic) and February 2026. Driving times are shown separate from terminal recovery times to illustrate how each component has evolved.
Quite notable on many routes is the growth in both scheduled driving and terminal times. Although it is common in the mid-2020s to regard extended travel times and traffic delays as a recent, post-pandemic phenomenon, this pattern started earlier and is evident in 2014:2020 comparisons. Surplus time, it was argued, would prevent short turns, a claim that is demonstrably false as most riders know on a daily basis, but it slows service, wastes resources and forces wider headways.
501 Queen
The 501 Queen car is a poster child for how transit demand can be driven away by service changes. The corridor suffered the effects of larger vehicles and wider headways earlier than most when it converted to ALRV operation in the late 1980s. Not only were cars less frequent, but the substitution of shorter CLRVs for longer, less-reliable ALRVs made for crowding during the latter years that fleet still operated. Even with a pre-pandemic rebound shared with other routes, and a partial rebound in 2022 from the depths of 2020’s losses, the 501 in 2024 carried less than half its pre-pandemic demand.
One might argue that this is a chicken-and-egg situation with service levels following demand. However, 504 King by contrast did not see a post 2020 fall-off and its ridership grew strongly through 2024. Have riders simply given up on the Queen car even before its further disruption with Ontario Line construction diversions? Until (and if) the TTC moves to six-minute service on the 501, we will not know whether riders can be lured back.
Some Ontario Line boosters argue that it will replace the function of 501 Queen, but this ignores the fact that most riders on Queen originate well away from future OL stations. (I cannot help remembering a short-lived 50% service cut on the King car when the Bloor-Danforth subway opened in 1966 premised on the idea that many riders would shift to the faster new line. This did not happen, and most of the service was restored a few months later.)
Scheduled AM peak running times on 501 Queen (Neville-Humber) rose from 135 minute round trips in 2014 to 210 in 2024. The PM peak is worse with growth from 144 to 250 minutes. This greatly dilutes the expected service from the 2014 plan because far more cars are needed to achieve the same headway, or as happened on 501 Queen, the headway widened to compensate for the extra running time.
| 2014 Service Plan | New Car Service Plan | Jan 2014 Actual | Jan 2020 Actual | Feb 2026 Actual | |
|---|---|---|---|---|---|
| AM Peak Headway | 4’15” | 4’45” | 5’10” | 6’30” | 10’00” |
| Vehicles | 31A + 5C | 27F + 6B | 22F | ||
| Round Trip Time | 130D + 5T | 164D + 12T | 198D + 12T | ||
| Midday Headway | 6’10” | 6’10” | 6’00” | 7’30” | 10’00” |
| Vehicles | 28A | 26F | 23F | ||
| Round Trip Time | 136D + 12T | 182D + 13T | 204D + 26T | ||
| PM Peak Headway | 5’08” | 5’08” | 5’08” | 6’50” | 10’00” |
| Vehicles | 28A | 30F | 25F | ||
| Round Trip Time | 138D + 6T | 192D + 13T | 226D + 24T |
502/503 Downtowner/Kingston Road
Historically, service on Kingston Road was provided by two routes. The Kingston Road car operated from Bingham Loop at Victoria Park to McCaul Loop on Queen weekdays until the end of the PM peak. At other times it was replaced by an extended Coxwell bus service mirroring the former Kingston Road-Coxwell streetcar service that ran before the Danforth subway opened.
A separate peak-only service called the Kingston Road Tripper ran downtown via King rather than Queen with various western destinations, but in the timeframe of this review it went to York & Wellington Streets.
The routes were renamed as 502 Downtowner (a failed marketing ploy for a poorly used extension to Bathurst Station) and 503 Kingston Road. The surviving 503 service runs to York Street with buses looping via University Avenue. This runs at all hours providing supplementary service on parts of the King and Queen lines, although it suffers from the usual problems of branched routes with uneven integration where routes merge.
Until the recent change to bus operation due to construction west of Broadview on Queen, the 503 ran on a 10 minute headway at all times, but with no effort to blend 501 and 503 services westbound from Kingston Road. There is some debate within the TTC about whether streetcar service will be restored, and if so whether it will revert to the daytime-only service design of past years. Ridership numbers grew from 2020 to 2024, although part of that is due to the longer hours of service.
| 2014 Service Plan | New Car Service Plan | Jan 2014 Actual | Jan 2020 Actual | Feb 2026 Actual | |
|---|---|---|---|---|---|
| AM Peak Headway | 6’00” | 7’15” | 6’00” | 6’30” | 6’00” |
| Vehicles | 31A + 5C | 17B | 17B | ||
| Round Trip Time | McCaul: 84D York: 72D | York: 100D+11T | York: 95D+5T | ||
| Midday Headway | 16’00” | 16’00” | 16’00” | 10’00” | 10’00” |
| Vehicles | 5C | 11B | 11B | ||
| Round Trip Time | McCaul: 80D | York: 100D+10T | York: 98D+12T | ||
| PM Peak Headway | 6’00” | 7’30” | 6’00” | 7’40” | 6’00” |
| Vehicles | 13C | 17B | 20B | ||
| Round Trip Time | McCaul: 84D York: 72D | York: 119D+11T | York: 111D+9T |
504/508 King/Lake Shore
King Street hosts various services over its length making comparisons more complex than other routes.
- Originally the King car ran between Broadview and Dundas West stations, a route over a century old between former Erindale and Vincent Loops.
- This was overlaid by Kingston Road Tripper service that once ran west to Roncesvalles, but more recently only to York Street (see above).
- In June 2016, route 514 Cherry was added between Distillery Loop and Dufferin Loop.
- In October 2018, routes 504 and 514 were merged with the 504A (Distillery/Dundas West) and 504B (Broadview/Dufferin) services we have today.
- Route 508 Lake Shore from Long Branch overlays King in the peak period, peak direction with various eastern termini, currently Distillery Loop.
The 2014 plan showed a 2’34” service of new cars, but actual service in 2014 was a base every four minutes overlaid by trippers that reduced the AM peak service to a two minute “wave” during the peak time and direction. This was a scheme to save on equipment.
By 2020, the combined service operated every 2’37” on the common segment from Sumach to Dufferin, roughly the same as the projected 2014 level. By 2026, this has dropped back to 4’00” on the common segment with 8’00” on the outer ends of the line.
Ridership on King spiked with the introduction of the transit priority corridor through downtown, fell in 2020, but has climbed back consistently since.
Comparing the nearby King and Queen corridors shows a marked difference both in service and ridership evolution.
The September 2025 schedules are shown here because the eastern end of the route is currently restructured thanks to construction on Queen west of Broadview.
| 2014 Service Plan | New Car Service Plan | Jan 2014 Actual | Jan 2020 Actual | Sept 2025 Actual | |
|---|---|---|---|---|---|
| AM Peak Headway | 1’42” | 2’34” | 4’00” + Trippers | 504A: 5’15” 504B: 5’15” | 504A: 8’00” 504B: 8’00” |
| Vehicles | 42C + 7A | 45F | 31F | ||
| Round Trip Time | 112D+8T | 504A:110D+11T 504B:104D+11T | 504A:132D+2T 504B:94D+10T | ||
| 508 Lake Shore Trips | 3 EB | 5 EB | 5 EB | ||
| Midday Headway | 3’45” | 3’45” | 3’45” | 504A: 7’15” 504B: 7’15” | 504A: 10’00” 504B: 10’00” |
| Vehicles | 30C | 32F | 26F | ||
| Round Trip Time | 106D+7T | 504A:111D+12T 504B:101D+8T | 504A: 132D+18T 504B: 94D+16T | ||
| PM Peak Headway | 2’21” | 3’18” | 2’50” | 504A: 6’00” 504B: 6’00” | 504A: 10’00” 504B: 10’00” |
| Vehicles | 45C | 42F | 27F | ||
| Round Trip Time | 120D+8T | 504A:119D+13T 504B:109D+11T | 504A: 43D+17T 504B:102D+8T | ||
| 508 Lake Shore Trips | 6 WB | 5 WB | 5 WB |
505 Dundas
The 505 Dundas car has operated between Broadview and Dundas West stations since the Bloor-Danforth subway opened in 1966. (The western leg to Runnymede was replaced by the 40 Junction trolley bus in 1968.) The line operated with buses for an extended period before the pandemic due to a shortage of streetcars and construction projects.
The table below shows the current six-minute headways implemented late in 2025, but streetcar service before then ran every ten minutes during most time periods. This was considerably less than foreseen in the 2014 plan. The TTC has not yet reported on the effect of the improved service. Travel times today are considerably higher than they were with streetcar service in 2014.
| 2014 Service Plan | New Car Service Plan | Jan 2014 Actual | Jan 2020 Actual | Feb 2026 Actual | |
|---|---|---|---|---|---|
| AM Peak Headway | 5’15” | 6’45” | 5’15” | 3’45” | 6’00” |
| Vehicles | 19C | 27B | 22F | ||
| Round Trip Time | 94D+6T | 95D+6T | 121D+11T | ||
| Midday Headway | 6’30” | 6’30” | 6’30” | 4’00” | 6’00” |
| Vehicles | 16C | 26B | 23F | ||
| Round Trip Time | 96D+8T | 96D+8T | 128D+10T | ||
| PM Peak Headway | 5’20” | 6’40” | 5’20” | 3’30” | 6’00” |
| Vehicles | 14F | 20C | 32B | 25F | |
| Round Trip Time | 100D+7T | 105D+7T | 142D+8T |
506 Carlton
The 506 Carlton car has operated between Main & Danforth and High Park Loop for decades. The original plan for service with new cars called for a five minute headway in the AM peak, but today it operates at half that level.
Between 2014 and 2020, travel times rose quite substantially, and this contributed to stretching out the available fleet into less frequent service. Ridership in 2024 was well below the level seen before the pandemic.
| 2014 Service Plan | New Car Service Plan | Jan 2014 Actual | Jan 2020 Actual | Feb 2026 Actual | |
|---|---|---|---|---|---|
| AM Peak Headway | 3’45” | 5’00” | 3’45” | 7’50” + Trippers | 10’00” |
| Vehicles | 32C | 27F + 8B | 16F | ||
| Round Trip Time | 117D+3T | 150D+23T | 152D+8T | ||
| Midday Headway | 5’15” | 5’30” | 5’15” | 7’50” | 10’00” |
| Vehicles | 25C | 22F | 17F | ||
| Round Trip Time | 124D+8T | 156D+17T | 164D+6T | ||
| PM Peak Headway | 5’00” | 6’08” | 5’00” | 8’30” | 10’00” |
| Vehicles | 24F | 27C | 22F | 19F | |
| Round Trip Time | 127D+8T | 176D+11T | 182D+8T |
507 Long Branch
The Long Branch car is the only surviving remnant of the suburban “radial” network predating the TTC’s creation in 1921. It has operated between Humber and Long Branch Loops for many decades, except for a period when an ill-considered plan to “save money” consolidated it with the Queen car. Every other Queen car ran through from Humber to Long Branch, but service was extremely unreliable thanks to a combination of congestion on Queen and short turns.
The route has strong local demand along Lake Shore Boulevard, especially outside the peak periods.
The 2014 service shown below slices off the western portion of what was then the amalgamated route for comparison with later years when the 507 was restored. Today it operated independently of 501 Queen until about 9pm when all 501 service extends through to Long Branch. Note that this undercounts demand west of Humber Loop because through riders are not counted as new trips in the stats.
By 2024, ridership on the Long Branch car had recovered roughly to the 1990 level, before that decade’s recession.
Travel times grew between 2014 and 2020, and with the round trip time now sitting at 80 minutes compared to 50-60 a decade ago. Note that Lake Shore Boulevard is a wide street not subject to the same severe, all-day congestion affecting downtown routes.
| 2014 Service Plan | New Car Service Plan | Jan 2014 Actual | Jan 2020 Actual | Feb 2026 Actual | |
|---|---|---|---|---|---|
| AM Peak Headway | Included with 501 Queen | 10’20” | 10’00” | 10’00” | |
| Vehicles | 5A | 8F | 8F | ||
| Round Trip Time | 50D + 1T | 71D + 9T | 71D + 9T | ||
| Midday Headway | 12’20” | 10’00” | 10’00” | ||
| Vehicles | 4A | 8F | 8F | ||
| Round Trip Time | 49D | 64D + 16T | 64D + 16T | ||
| PM Peak Headway | 10’15” | 10’00” | 10’00” | ||
| Vehicles | 6A | 8F | 8F | ||
| Round Trip Time | 52D + 9T | 68D + 12T | 68D + 12T |
509 Harbourfront
The 509 Harbourfront car operates between Union Station and Exhibition Loop in reserved lanes and a tunnel under Bay Street. In 2014, major reconstruction was underway, and so the 2014 service shown here is with buses that did not have the protected corridor. Service from 2012 operating with streetcars is shown for comparison.
In 2026, service is considerably less frequent than projected in the 2014 plan, and travel times are about one-third longer even though the route has its own right-of-way.
Because the route overlaps 510 Spadina, ridership figures are consolidated for the two routes.
| 2014 Service Plan | New Car Service Plan | Jan 2012 Actual | Jan 2014 Actual | Jan 2020 Actual | Feb 2026 Actual | |
|---|---|---|---|---|---|---|
| AM Peak Headway | 4’00” | 5’00” | 5’15” | 2’45” | 6’15” | 9’00” |
| Vehicles | 7C | 19B | 8F | 6F | ||
| Round Trip Time | 34D+3T | 50D+2T | 44D+6T | 46D+8T | ||
| Midday Headway | 6’00” | 6’00” | 7’15” | 4’00” | 8’00” | 9’00” |
| Vehicles | 5C | 13B | 6F | 6F | ||
| Round Trip Time | 32D+4T | 50D+2T | 43D+5T | 46D+8T | ||
| PM Peak Headway | 3’30” | 4’40” | 4’45” | 2’30” | 8’00” | 9’30” |
| Vehicles | 8C | 21B | 6F | 6F | ||
| Round Trip Time | 34D+4T | 50D+3T | 43D+5T | 48D+9T |
510 Spadina
The 510 Spadina car operates between Spadina and Union Stations, although there are scheduled short turns at Queens Quay Loop. In 2014, Queens Quay itself was under construction and Spadina cars ran only south to King Street. The route runs entirely on its own right-of-way, although has perennial problems with cross traffic and signal delays.
(In earlier years, the short turn occurred at King Street, but was extended to Queens Quay to serve the growing population in the waterfront. Unscheduled short turns still occur regularly at King.)
510 Spadina is unusual in having very strong off-peak demand with more frequent service on weekends than weekdays during daytime periods. Scheduled peak service in 2026 is much less frequent than foreseen in the 2014 plan.
| 2014 Service Plan | New Car Service Plan | Jan 2014 Actual Bloor-King | Jan 2020 Actual Bloor-QQuay | Feb 2026 Actual Bloor-QQuay | |
|---|---|---|---|---|---|
| AM Peak Headway | 2’30” | 3’30” | 2’30” | 4’23” | 5’00” |
| Vehicles | 12C | 12F | 12F | ||
| Round Trip Time | 28D+2T | 48D+5T | 49D+11T | ||
| Midday Headway | 6’10” | 6’10” | 1’56” | 4’52” | 5’00” |
| Vehicles | 16C | 11F | 12F | ||
| Round Trip Time | 28D+3T | 49D+10T | 48D+12T | ||
| PM Peak Headway | 2’00” | 3’23” | 2’00” | 4’50” | 5’00” |
| Vehicles | 18C | 12F | 13F | ||
| Round Trip Time | 31D+5T | 53D+5T | 53D+12T |
511 Bathurst
The 511 Bathurst car runs from Bathurst Station to Exhibition Loop. It is in mixed traffic except at the southern end of the line where it shares reserved lanes on Fleet Street with 509 Harbourfront.
Until it recently joined the “six minute network”, service operated every 8-10 minutes, considerably less often than foreseen in the 2014 plan. Even in the “high season” for traffic to Exhibition Place, the scheduled service did not change, but was supplemented with extras as needed.
Scheduled travel time increased substantially between 2014 and 2020, although it has been trimmed recently.
| 2014 Service Plan | New Car Service Plan | Jan 2014 Actual | Jan 2020 Actual | Feb 2026 Actual | |
|---|---|---|---|---|---|
| AM Peak Headway | 4’15” | 5’00” | 4’00” | 7’15” | 6’00” |
| Vehicles | 13C | 11F | 12F | ||
| Round Trip Time | 46D+6T | 67D+13T | 59D+13T | ||
| Midday Headway | 5’00” | 5’00” | 4’00” | 7’00” | 6’00” |
| Vehicles | 13C | 11F | 12F | ||
| Round Trip Time | 48D+4T | 65D+12T | 59D+13T | ||
| PM Peak Headway | 4’30” | 5’30” | 4’00” | 7’45” | 6’00” |
| Vehicles | 14C | 11F | 14F | ||
| Round Trip Time | 48D+8T | 73D+12T | 67D+17T |
512 St. Clair
The 512 St. Clair route operates between St. Clair Station and Gunn’s Loop west of Keele Street. At one time there was a short-turn service with half of the cars turning back at Lansdowne in peak periods, but this has not operated for many years.
The route is in reserved lanes except for a short stretch east of Yonge Street and west of Old Weston Road.
Until the 512 joined the six-minute network, service operated every 8-10 minutes at all times. This is less than 50% of the service foreseen in the 2014 plan, and even the current 6 minute frequency provides only two-thirds of the originally planned service.
The original round trip times when St. Clair re-opened with its reserved lanes in June 2010 were in the 64-66 minute range, and this was still the case in 2014. By 2020, travel times had expanded by about 25% even though the route had its own right-of-way. Round trip times today are about 84 minutes. How much of this is padding added before 2020 and how much is due to operating conditions including longer stop dwell times and a lack of working signal priority is not known.
| 2014 Service Plan | New Car Service Plan | Jan 2014 Actual | Jan 2020 Actual | Feb 2026 Actual | |
|---|---|---|---|---|---|
| AM Peak Headway | 2’30” | 3’50” | 2’36” | 4’00” | 6’00” |
| Vehicles | 25C | 20F | 14F | ||
| Round Trip Time | 56D+9T | 69D+11T | 69D+15T | ||
| Midday Headway | 5’00” | 5’00” | 5’05” | 5’10” | 6’00” |
| Vehicles | 13C | 15F | 14F | ||
| Round Trip Time | 56D+10T | 67D+11T | 68D+16T | ||
| PM Peak Headway | 3’20” | 4’45” | 3’20” | 4’30” | 6’00” |
| Vehicles | 20C | 18F | 14F | ||
| Round Trip Time | 58D+9T | 69D+12T | 69D+15T |
Streetcar Route Ridership from 1976 to 2024
These charts consolidate ridership data published by the TTC annually from 1976 to 2024. Recent data are available on the Planning page on their website.
Historical events of note:
- 1980: First Gulf war related recession.
- 1990-95: Major business recession. Overall TTC ridership dropped by 20%.
- 2008: Banking crisis.
- 2020: Covid pandemic.
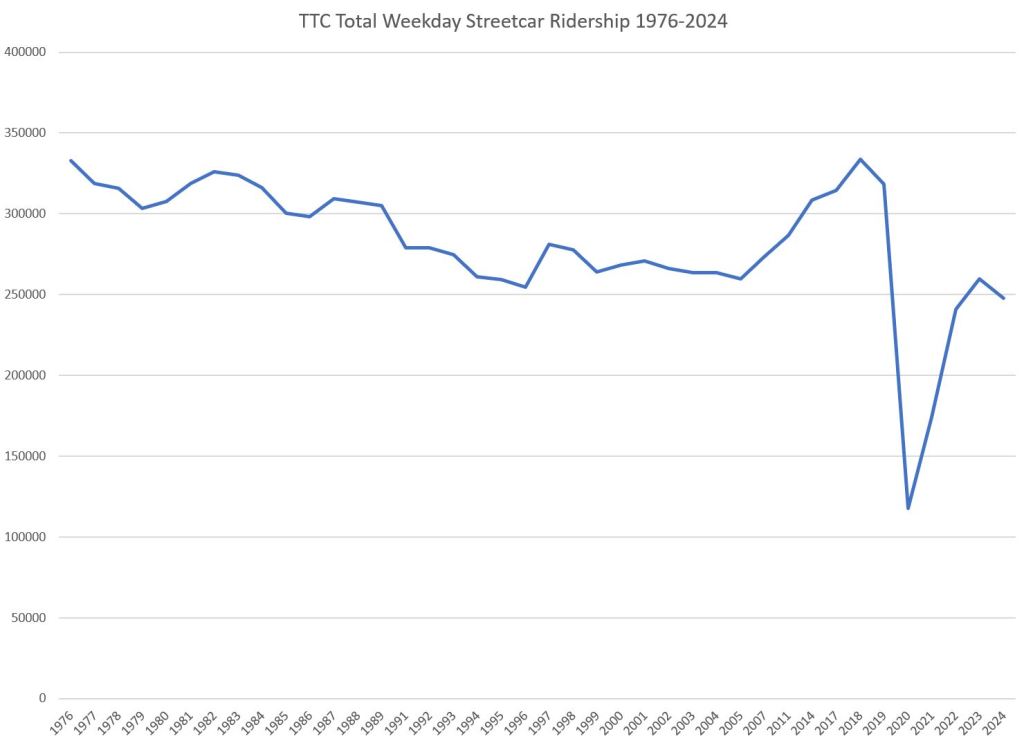
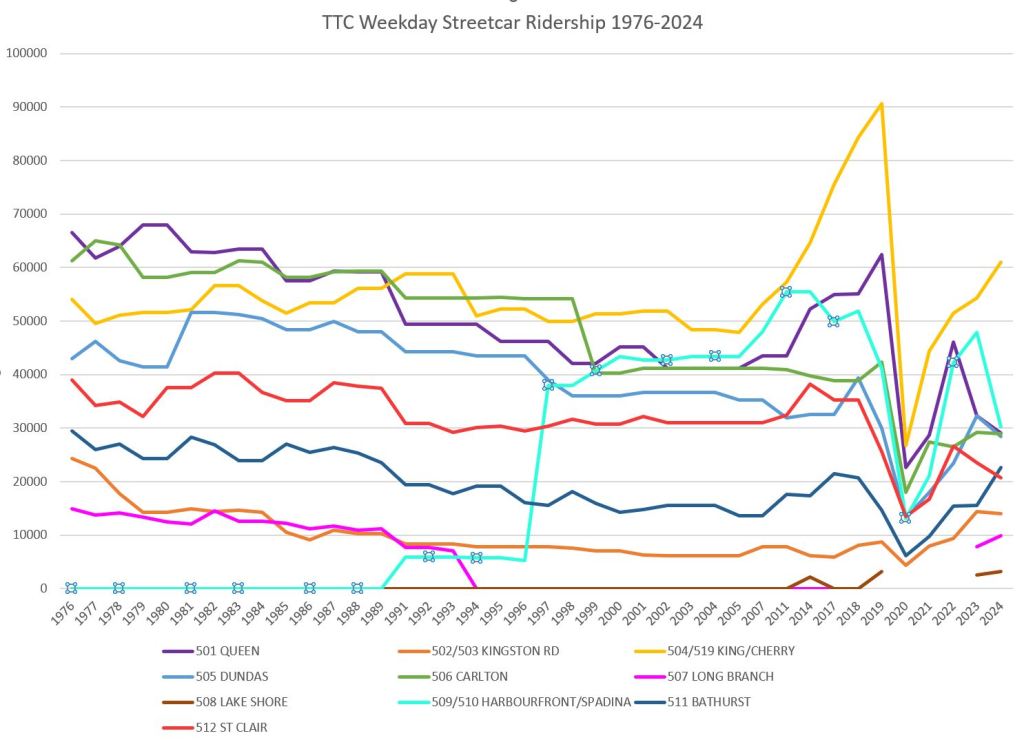
The chart of ridership by route was updated on March 10 to provide more distinction between colours for some routes. There is no change in the underlying data.

Very detailed article Steve I do feel certain routes in the TTC should look at keeping buses out for an extra trip like if a route was supposed to go back to the garage at like 7:30 keep that run out for another trip or two. Also it doesn’t make sense how many routes have worse service now. Thanks for the article very well said.
Steve: You’re welcome!
LikeLike
As always, thanks for all your detailed work on this, Steve!
LikeLike
While the lack of commitment dates for 6 minute headway on the 501, 503, & 506 makes some sense due to the construction of the Ontario Line, having the 507 on that list makes me wonder if the TTC is thinking about extending the 507 to Exhibition once the Ontario Line is finished as sort of a precursor for the Waterfront West.
Steve: I included 507 on that list simply because it has not been explicitly excluded by TTC, but suspect it’s not a high priority. As for connecting with the Ontario Line, the whole issue of a Dufferin Gate extension into Exhibition Place is on hold to avoid conflict with a potential OL western extension.
LikeLike
The TTC should take advantage (sort of) of the increase in gasoline and diesel prices by increasing the headway on all bus, streetcar, light rail, and subway routes. Help people save money by providing an increase in TTC service.
Steve: I suspect you mean “reducing” headways, i.e. having cars come more frequently.
The City of Toronto can also help by increasing the Green P rates to approach other city rates in North America, like New York City and San Francisco. City of Toronto parking rates are currently some of the lowest. That should include banning on-street parking along bus and streetcar routes, which would help route efficiency, and increasing no parking fines, no standing fines, and no stopping fines.
LikeLike
There is a noticeable improvement on the 511 since they made the changes and the dedicated lanes. I live closer to Spadina than Bathurst. Bathurst is the best option.
Steve: A review of travel times on 511 Bathurst is coming soon.
LikeLike
Hi Steve, long time reader, and maybe unrelated to this article, but what in your opinion can be done about actually speeding up the speed of the streetcar system in terms of speed? Or are we stuck with what we got?
Steve: It’s a complex issue because it is the compound effect of many changes and practices that have evolved for years, coupled with a deeply risk-averse organization that will trot out lots of reasons to change nothing s[ecially if they can hang it on “safety” somehow.
Track conditions at intersections are an issue of maintenance, and it will take time to catch up with them, although some really bad ones were finally replaced recently (King/Church). However operating practices do not distinguish between good and bad track nor between driving through curves and straight through running. Then there’s the speed between stops. Schedules have been padded for years and some operators are content to dawdle along lest they be accused of running early. This is also tied to the growth in terminal recovery time. That problem won’t be fixed without a fundamental change in crewing so that operators get decent breaks without cars piling up at terminals. The situation varies from route to route de[ending on the creature comforts available. I am not sure there is a will to tackle all of this at the management or political level. Some of the same problems affect bus routes too.
LikeLike
I was looking back at your July 16, 2016 article on TTC Service in 1928 at for comparison to streetcar service today.
In 1928, there were very, very, very few signalized intersections. Once a streetcar was loaded, back then, it would just go. No waiting for a red light. Also, 1928 was just SIX years after the Township of North York broke away from the Township of York because “the southern part of York, bordering the old City of Toronto had become increasingly urbanized while the northern portion remained rural farmland”. North York remained largely rural and agrarian until World War II, after which an increase in automobile traffic and congestion would result.
Back then, they didn’t replace streetcars with buses during track reconstruction, but used sidetracks or closely spaced detours. Noticed as well, the use of trailers on many of the streetcar routes. The use of trailers would continue until the early 1950’s.
But the main difference was that “downtown” was much smaller. Eglinton & Yonge was almost in the outskirts of the city, but today it’s part of “downtown” Toronto. That means more traffic congestion caused by the single-occupant automobile by folks who live in former farmland.
Steve: I grew up at Mt. Pleasant & Eglinton and remember when there were farms not far from where I lived. Sunnybrook Plaza (recently demolished) at Bayview & Eglinton in Leaside just outside of the old City was the first strip mall in what would become Toronto. Lots of parking for cars of course.
LikeLike
I wonder how much capacity there actually is to provide shorter headways on the 510 when considering layover time and the limited platform space at Spadina station. You could run a 2-minute headway on Spadina in the days of the CLRVs when layover times were short and you could fit two cars on the platform. Now you end up getting stuck in the tunnel for 5 minutes waiting for the car in front of you to finish its layover. I’m sure there are other routes with similar constraints (I remember one day a couple months ago being stuck south of Bloor in a 511 because there was no room in the loop).
Steve: The platform at Spadina Station is to be extended east so that two cars can be on it at once.
LikeLike
This comment has been moved from another unrelated thread.
Stu wrote:
We’re never seeing streetcars on Kingston Road again, are we? Are those tracks going to become Rogers Road-style “ghost” tracks to be torn up at some point?
Steve: Weekday daytimes, but I’m not sure about the evening and weekend service.
LikeLike
For 507 LONG BRANCH, there are a couple of reasons travel times would increase since 2014.
First, there have been a lot of condo towers built in the Park Lawn/Lake Shore area and automobile traffic gets worse and worse. Eastbound Lake Shore left turns to Park Lawn can hold up streetcars. Westbound Lake Shore left turns to the various new condos east of Park Lawn can also hold up streetcars. It would not be surprising if several minutes are added to travel times in AM and PM rush hours.
At the Long Branch loop end, dedicated transit signals have been added. They activate only once in the entire light cycle if a streetcar is waiting to enter the loop or to leave it. Both directions can move on the same signal. Waiting for the streetcar signal might add, on average, 20-30 seconds. In theory, it makes it a lot safer for streetcars to enter or leave the loop. In practice, it mostly does, unless a westbound car just looks at the green transit signal and proceeds. It’s rare, but it happened just a few days ago (much honking and clanging from the streetcar).
If you put the two new problem areas together, you might think that the travel time should be raised by up to five minutes. That’s much short of what it’s been raised to.
Steve: Note also that the changes in travel and terminal times happened before 2020.
LikeLiked by 1 person
The ~50 year chart is … interesting. WTH happened to car lines that don’t run on King??? The other lines are hauling fewer passengers than they were half a century before. The King car being a notable exception – is the post-2005 *nearly doubling* of ridership on that line real? WTH?! And that’s with the crappy service so well-defined on this site.
Weird.
Steve: Compared to other routes, King lost the least amount of service, and also benefitted from adjacent development east and particularly west of downtown.
LikeLike
More are springing up every day. They seem to be the traffic engineer nerd’s default choice for “safety” in much the same way the TTC defaults to slow.
Does anyone maintain a database of new signalized intersections added since 2013? Some merely replace crosswalks while others are outright new.
Some off the top of my head: Broadview @ Millbrook, Carlton @ Maple Leaf Gardens parking lot, Carlton @ Allan Gardens mid-block, Dundas @ Regent Park Blvd, Queen @ Sackville, King @ River, Dundas @ Sterling.
Steve: These would be less of a problem if there were aggressive transit priority that held them green for streetcars. The current system has many intersections with no detection, or detection too close by to intercept a change-to-red in progress.
LikeLiked by 1 person
It was just a short while ago that College//Carlton cars diverted along Bay to Dundas and then up Spadina back to College, and return. It was fun riding the streetcar on Bay, my first time since childhood! Now the intersection of College and Bay is completely closed to all traffic including pedestrians for major water main work, the streetcar tracks and foundations have all been removed. While the eastward tracks were there, I cannot remember, were there westward curves also? It has been the case a few times that missing curves were not installed when they had the chance.
Steve: All four curves have always been at College & Bay. There is nothing to be added.
Btw, I have noticed an overall improvement on many routes: the subways, St. Clair, Wellesley, Sherbourne. Do we thank Mayor Olivia Chow for this?
Steve: St. Clair has increased service, but as for Wellesley and Sherbourne it’s the same old schedule. Wellesley does benefit this year compared to last because the now-and-forever reconstruction from Queen’s Park to Ossington isn’t screwing up the line.
LikeLike
“traffic engineer nerds” want traffic to *flow* not stop. If an intersection grows automatic signals, then it’s because whatever was there previously was not working, likely traffic on the intersecting street was stopped more than it was “go’ed”. But the object is to keep things moving. Lately, there has been a lot of movement towards reducing the speed of that flow (you know, so that hitting people on foot or cycle didn’t *always* mean death) but the object is still to move things. A signal that replaces the silly “look point” crosswalks means fewer people on foot get killed, which is a fine thing.
None of that means that there should not be priority signal for things like emergency vehicles and transit vehicles …
LikeLike
It seems like even after all the construction is done there will be more streetcars than needed for the existing routes. Will we ever see a resumed discussion of converting Dufferin, Ossington, Parliament, or Coxwell to streetcars from the subway to the lake?
Steve: The only one that is even vaguely possible is Dufferin given its geography, and I would not hold my breath. Coxwell and Parliament are non starters both due to demand levels and the complexity of conecting to the Danforth subway.
LikeLike
They are traffic engineering nerds. I seem to recall another commentator on this blog claiming the way we do things here is different from other jurisdictions in Europe. It lines up well with our bureaucratic penchant for excessively wordy road signage.
LikeLike
I’ve often wondered if the TTC has looked at the potential ridership numbers with a Main station-Woodbine Beach loop “506 east” in part to solve the reliability issues the 506 has in the east end.
LikeLike
Sigh – too many decades of unwise to stupid over-spending in less-smart places, so the inherent flaws in the too-narrow core road system clog it all up, and we didn’t begin a Front St. transitway from beyond the pinch point at High Park to the core, so we could have sub-regional/semi-express fast transit not on somewhat inflexible King nor Queen. Yes, we should have a subway on either of these east-west corridors, which would also enable a higher degree of bike safety too, since biking from Parkdale to core is easy and quick, but too dangerous from tracks defining lane positions, not just the tracks and margins themselves.
I don’t know if it’s possible to do any Front St. transitway any more, since very high odds we’ve built the options shut because private interests consistently trump public interest of faster mobilities. (The Ontario Line is an excessive squandering despite the high need for some Relief, as it wanders too much in the old core, and thus is too deep and costly, and also doesn’t go to serve the west end and its very high travel demand, and including a fast trip in to commpete with Gardiner/Lakeshore. Carservative transit would never allow for the chance that higher order transit might allow for tolling of the Gardiner right?)
And yes, I’ve some ideas as to how to help King/Queen transit, but the Fail on the Front transitway and then the epic fails of the Ford transit schemes and other larger projects eg. Sorbara subway extension etc., make a why bother?
Tho I’ve been having thoughts of a Dufferin St. subway from the TTC yard and Yorkdale Mall to Bloor and the Dufferin Mall, as that seems to be the main reason for subways, regrettably. But there’s also a need for faster TTC to the Liberty Village area, but the better route for a subway involves jogging east from Dufferin/Bloor east side over to Ossington, but more likely further south at Dundas St. and with a sharper diagonal. Ossington is aligned with the Ex and Ontario Place (or its remnants), and it’s not too occluded with so many buildings and tiebacks it seems, so it may be an easier and shallow and thus cheaper tunnel under the railtracks.
And maybe is there a need for another trainyard on the south end of a line, as there’s a larger parking lot at the Ex.
We likely need resiliency in our transit system so we have a faster and different way to bring thousands of folks in to the core in case of other N/S Line 1 disruptions.
We do have to improve transit somehow, ahead of charging cars or any other measure to reduce presence in the core, not that the majority of the politicians at Queen’s Park want to be doing that, and it wouldn’t only be the dominant Cons that would be hesitant, right?
LikeLike
Steve wrote: “a political attitude that favours big spending on subway projects, not surface transit. ” And maybe that should have been ‘big spending on subway projects in the less-good to wrong places’, etc. thanks.
LikeLike
Many days late on account of I don’t live in Toronto anymore and don’t follow things as closely anymore.
But I bring up the same question I have had: When the TTC was bringing in the new Flexities, was there any thought given to replacing the old CLRVs and ALRVs on a 1-to-1 basis?
I forget the numbers exactly, so let’s just say for the sake of argument there were 50 ALRVs and 200 CLVRs. In total: 250 vehicles. That means, again for simplicity, 250 operators.
So, buy 250 new Flexities. You maintain headways and increase capacity all at once. Seems like the rational choice to me.
Steve: It wasn’t a 1:1 replacement, and 250 cars would not have fit into the available space. For the 264 car fleet, they are converting part of Harvey Shops at Hillcrest to a carhouse for a few dozen cars. But, yes, the original intent was to run better service as the article describes than what we wound up getting.
LikeLike