
Updated December 30, 2025 at 10:45pm: The description of proposed service changes on the subway has been amended to reflect that the headway changes on Lines 1 and 2 are already in place. They show up as “new” in the 2026 budget because they were not included in 2025.
The Toronto Transit Commission’s Operating and Capital Budgets will be considered by the TTC Board on January 7, 2026, and will go from there to City Council for final approval. This article discusses the Operating Budget, and my next one will deal with the Capital Budget and Plans for 2026-2040.
Through a combination of belt-tightening and accounting magic, some of which cannot be repeated in future years, the TTC manages to freeze fares for a third year, introduce fare capping, retain and improve overall service levels, and stay close to the City’s target of $91-million in added subsidy for the new year. This is roughly equal to the $90.8-million rise in Provincial subsidy for the operation of Lines 5 and 6.
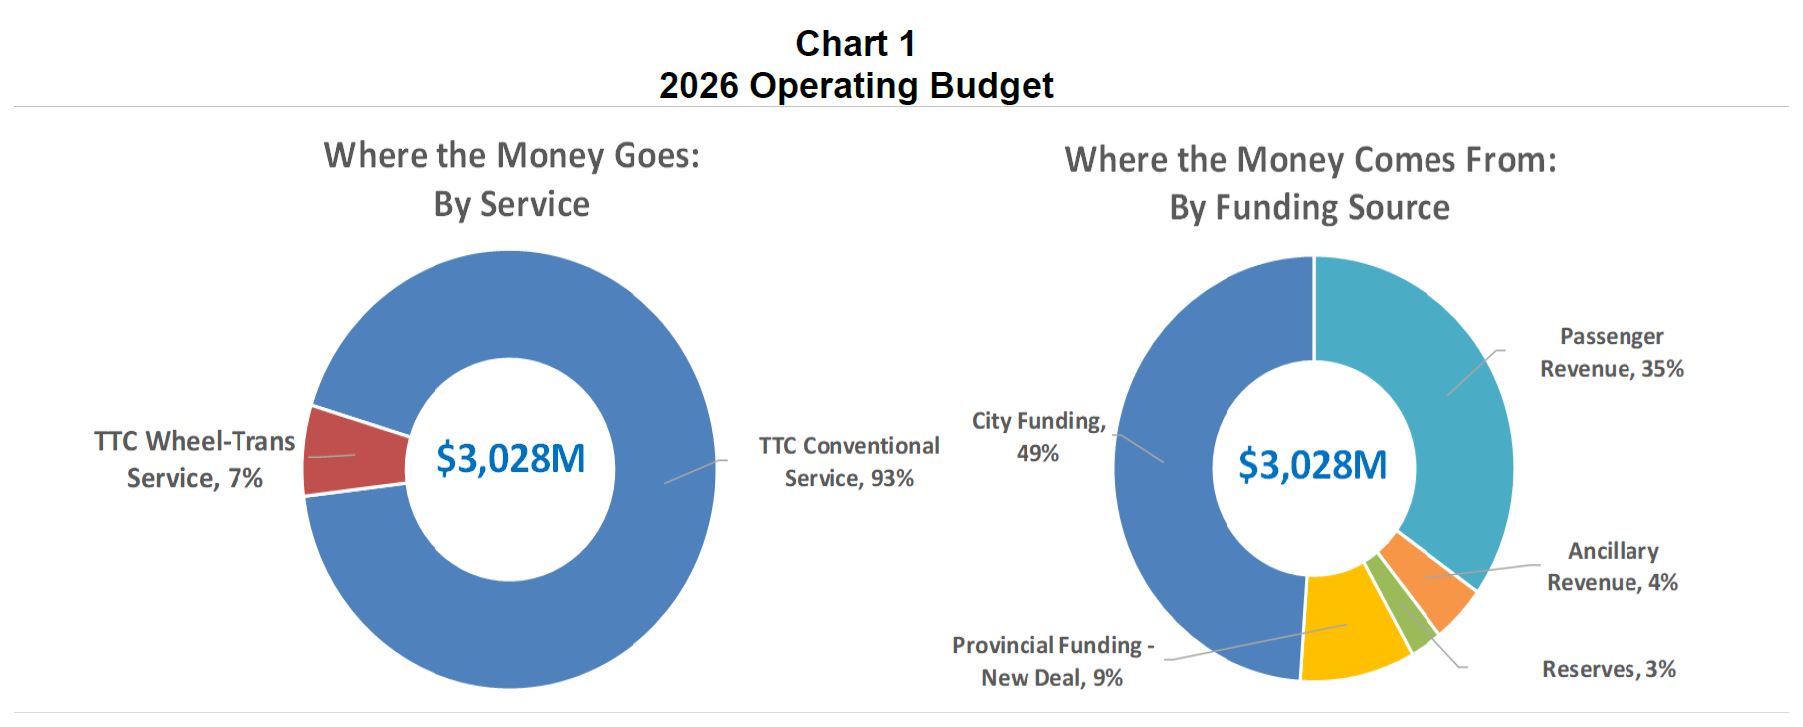
The pie charts below give a high level view of the budget. Note that passenger and ancillary revenues (fares, parking lots, shop rentals, advertising) account for only 39% of the total, and City subsidy is almost half. This is a huge change from the days when the City and Province each paid one sixth of the total, and the lion’s share of the remainder came from fares.
Fare Changes
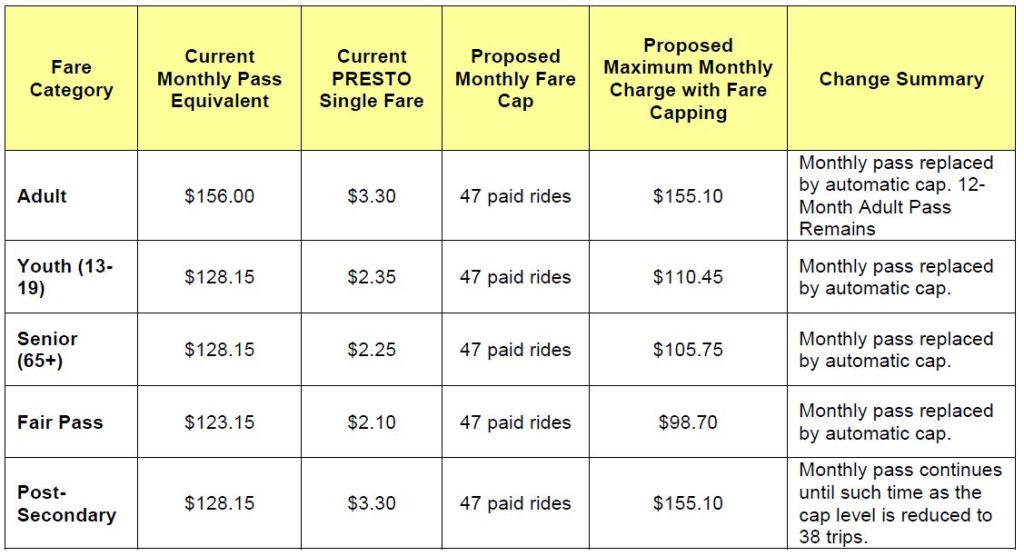
For riders, the biggest news is the fare freeze and capping, to be introduced in September 2026 with a view to further improvement in September 2027. The Adult fare cap is close to the price of a monthly pass, and so riders who already buy passes will see only a small change in their cost. However, the benefit of a capped price will be available to all riders without an upfront payment for a pass.
Youth, Senior and Fair Pass fares will be capped at the same ratio, 47 rides, and this is an improvement over the current higher multiples of 54.5, 57 and 58.6 respectively. Frequent TTC riders in these classes will see reduced costs.
The odd group out here are Post Secondary students whose pass is priced at the same rate as Youth and Seniors, but who pay the full Adult fare if they do not have a pass. This creates a situation where a pass is cheaper than capped single fares. The policy issue here is whether the Post Secondary single fare should be reduced to the Youth level and the monthly pass eliminated.
If the fare cap is reduced to 40 in September 2027 (a decision subject to the 2027 TTC Board and City Council), this will be equivalent to a 15% reduction in the monthly pass cost.
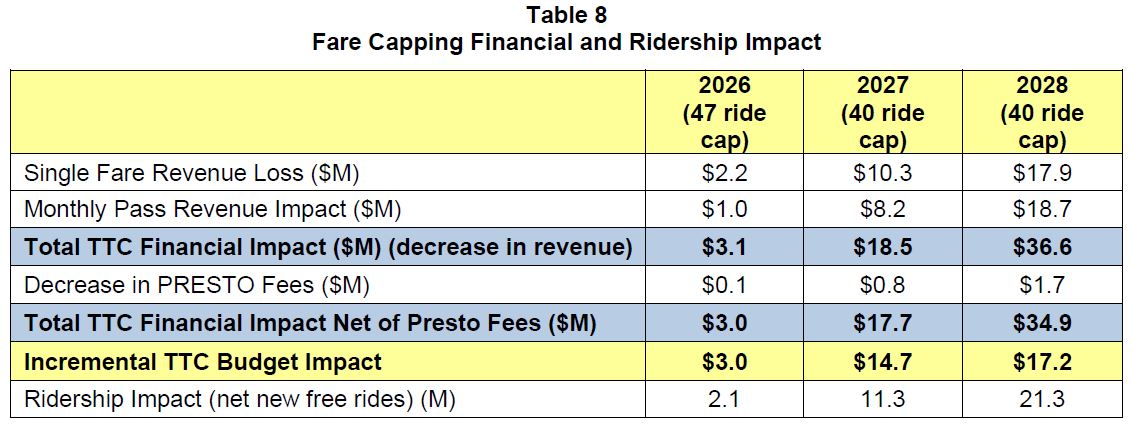
The anticipated cost of fare capping in foregone revenue is $3.1-million in 2026, $18.5-million in 2027 and $36.6-million in 2028 assuming that the 40 fare cap is implemented in September 2027.
All of this occurs with the hoped-for greater riding and extending the benefits of fixed transit costs to more riders. However, fare freezes and reductions cannot go on forever without also discussing the TTC’s ability to retain and improve transit service. A large “SALE” sign attracts few customers if the shop window is half-empty.
Service Changes
The service budget increases by 2% measured in service hours “to address congestion, adapt to changing travel patterns, deliver world-class service during the FIFA World Cup” with an expected ridership of 426.4-million in 2026 compared to a projected 414.0-million in 2025. Note that this is still lower than the original 2025 projection of 439.4-million. The budget does not explain how much of this increase will show up in more frequent service as opposed to congestion adjustments and the one-time bump for FIFA.
One specific change mentioned in the budget is the restoration of peak service on Lines 1 and 2. For reference, here are the current peak service levels and the levels operated in January 2020. Line 2 is already operating at the 2020 level, and Line 1 would only improve by 6% (measured as trains/hour) in the AM peak. The controlling factors in peak service levels are the signal systems and the fleet sizes which prevent service improvements beyond the 2020 levels.
Updated December 30, 2025 at 10:45pm: The “restoration” of peak subway service appears here because it is a budget-to-budget change even though it was actually implemented in late 2025. This does not represent net new service compared to year-end 2025.
| Line | AM Dec 2025 | AM Jan 2020 | PM Dec 2025 | PM Jan 2020 |
|---|---|---|---|---|
| 1 Yonge University | 2’30” | 2’21” | 2’30” | 2’36” |
| 2 Bloor Danforth | 2’20” | 2’21” | 2’30” | 2’31” |
Ridership
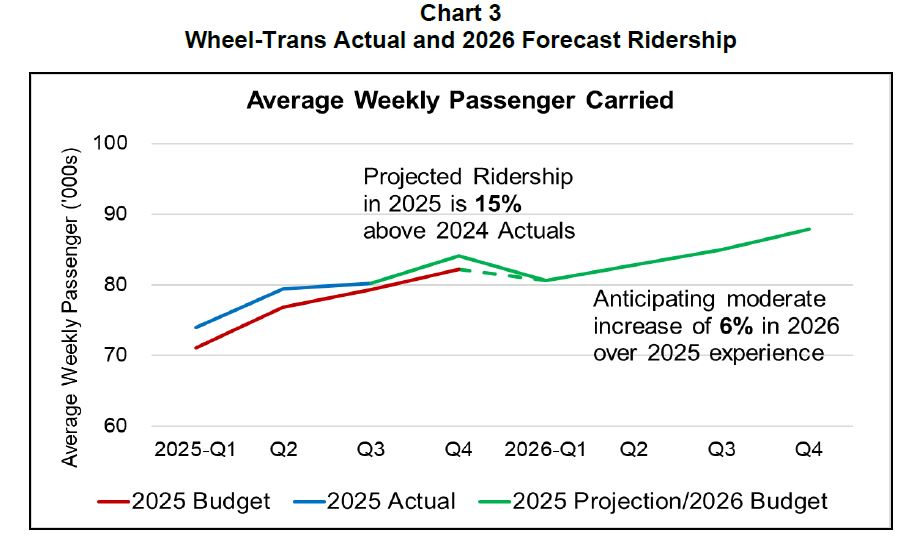
Conventional system ridership has not done well against budget projections in 2025. The budgeted value (top line, red in the chart below) has been consistently above actual counts (blue at the bottom). 2025 numbers closely tracked 2024 values (green) until the Fall when they fell lower. The shortfalls are attributed to a combination of undue optimism about the effect of return-to-work commuting and the loss late in the year of foreign students.
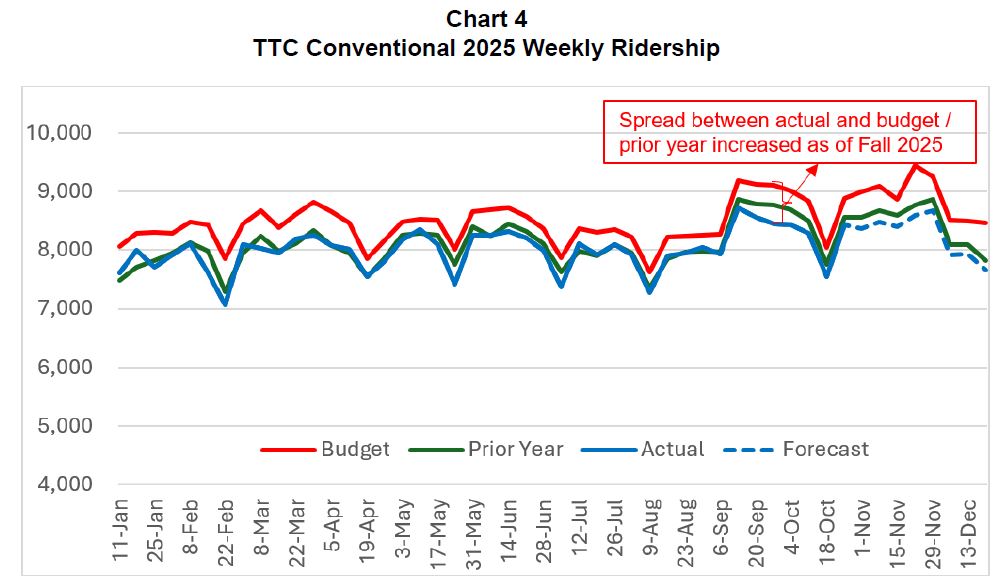
Projections for 2026 are less aggressive and, for budget and service planning, the “medium” increase will be used.

Wheel-Trans demand is strong and more growth is expected there in 2026.
The issue of future demand affects both the operating and capital budget planning process, and there have been conflicting indications of where the TTC thinks this is headed. In the short term, they expect little growth, but a recent Major Projects Update claims that current projections will accelerate the need for extra capacity on Lines 1 and 2.
Line 1 – Capacity Enhancement Program:
- This program provides for the expansion of Line 1 capacity by achieving headways of up to 100 seconds, enabling the movement of up to 39,600 passengers per hour at peak hours. […] Headways of 100 seconds by 2037 were based on pre-pandemic projections. The updated ridership demand forecasts will require headways to be achieved earlier (2035). Full schedule and scope impacts are currently being evaluated. [p. 23]
Line 2 – Capacity Enhancement Program:
- The ridership demand forecasts have been updated and are under review, extending to 2051, and will require the target headways to be achieved earlier than previously planned (135 seconds by 2028, 130 seconds by 2029, 125 seconds by 2030, and 120 seconds by 2037). Full impacts are currently being evaluated and will be outlined in a detailed report to the Board. [pp 20-21]
How this fits with overall system demand, fleet and service needs is not explored in the budget. As the chart below shows, TTC riding has not yet returned to 2019 levels. The “flip side” of that observation is that the pre-pandemic era was noted for overcrowding on many routes and spawned expansion plans such as the Bloor-Yonge project. Toronto should not wait to be back at 2019 and its capacity problems before planning for growth.
Metrics and Targets
The TTC has several metrics to track their operation and associated targets. Notable among these are Customer Satisfaction and On-Time Performance. Although the TTC is working internally on new metrics, these have not yet appeared. A major problem with the concept of “on time” is that it has more meaning for internal purposes than to riders on most routes where service is frequent, but erratic. It is reliability, not the schedule, that matters especially when considerable variation is allowed by TTC standards.

Year-Over-Year Changes
An important factor in reviewing numbers at the budget level is that the changes are budget-to-budget, not actual-to-budget. For example, in 2025 ridership and fare revenue were lower than expected. This means that the budget numbers coming into 2026 will be lower, to be offset partly by a hoped-for gain of riders over the year. However, in 2026 riders will pay slightly less on average thanks to fare capping and a frozen fare tariff, and so revenue will go down unless growth compensates for this.
Major changes in revenue and expenses are summarized below.
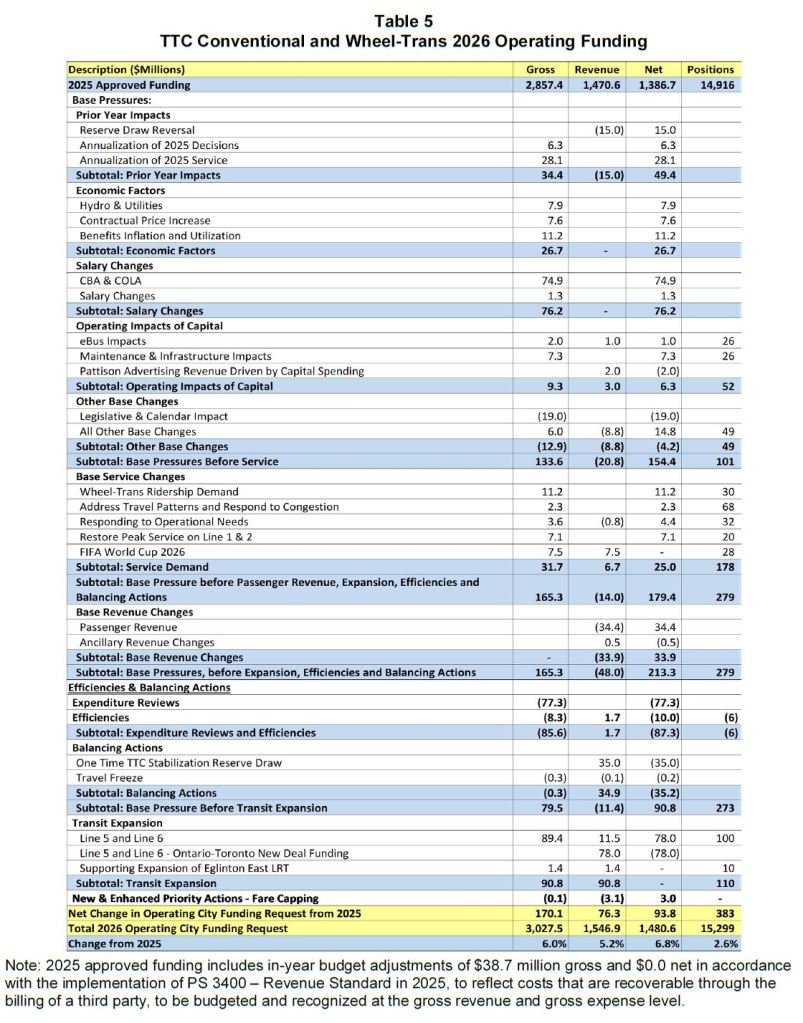
A large component of this is unavoidable from the combined effects of inflation and already-contracted increases for labour and third-party providers. This produces a net pressure of $154.4-million before any discussion of new services or “efficiencies”.
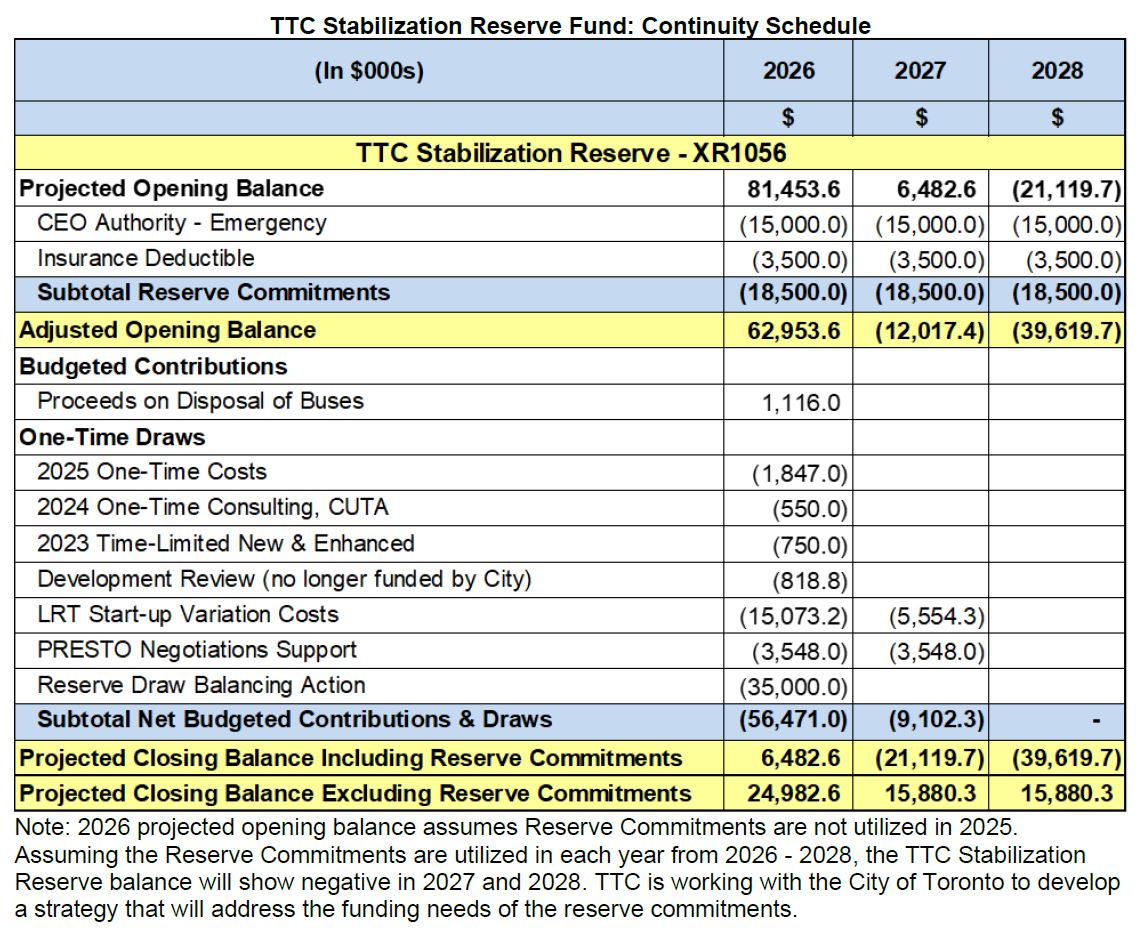
Note that included here is the revenue loss from the reversal of a $15-million reserve draw in 2025 which is replaced by a $35-million draw under expenses in 2026. These draws are treated as one-time events and so the year-to-year comparison shows their full values, not as a $20-million delta. The fundamental problem is that the stabilization reserve is finite. (Reserves are shown in a later section in this article.)
Also, the TTC will lose $8.1-million in rent revenue on their building at 800 Kipling Avenue that will be converted for their own use, and “the reversal of anticipated funding for the General Body Repairperson apprenticeship program after the Skills Development Fund provincial funding application was unsuccessful”. [p. 13] Presumably, the TTC is not deemed as worthy for “skills development” as some of the Premier’s business buddies.
Service demand shows a net requirement of $25-million. Note that extra service for FIFA is expected to be self-financing through fare revenue (2 million rides, $5-million revenue) and a special City subsidy included in its FIFA budget ($2.5-million).
Passenger revenue (fares) are expected to drop by about $34-million, but the lion’s share of this is a budget-to-budget change where fare revenue in 2025 was well below expectations. No additional revenue is expected from changes in fare enforcement programs. Fare capping will cost an additional $3.1-million in reduced 2026 revenue if it is approved by Council.
The average fare rose from $2.43 in 2024 to $2.47 in 2025 because more riders paid at the single fare level. It is expected to drop slightly to $2.45 in 2026 because of the effect of capping.
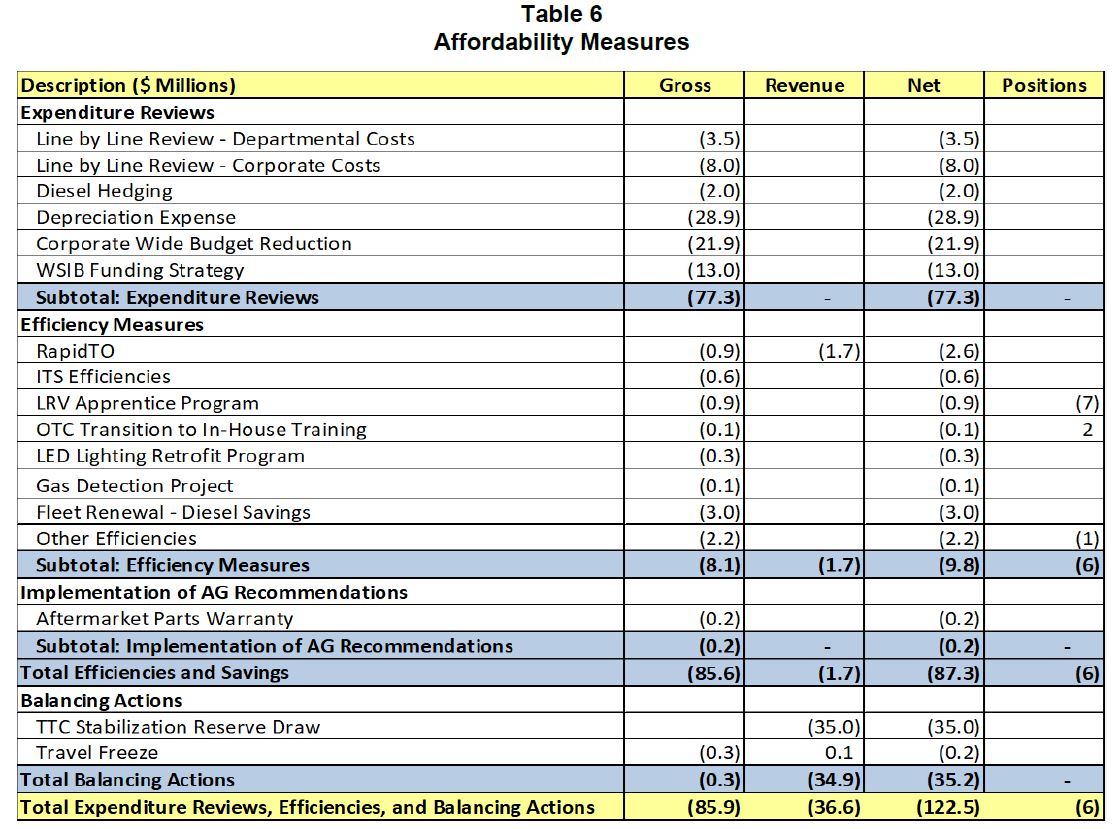
Expense reviews and “efficiencies” shave $87.3-million. The largest changes here are:
- Shifting Depreciation from the Operating to the Capital budget. This is not a real saving, only a shift in funding source and accounting.
- WSIB Funding Strategy changes to book only current year charges, rather than a provision for future year costs, in the current year’s budget. This change brings treatment of WSIB costs in line with payments of post-retirement medical and dental benefits.
- Sundry corporate-wide reductions. It is not clear what is lost in these changes, although part will come from underspending in 2025 actuals versus budgeted amounts.
The common factor here is that these are one-time changes that cannot be repeated to produce additional savings in 2027 and beyond.
The RapidTO program on Bathurst and Dufferin is expected to reduce operating costs by $0.9-million and bring additional revenue of $1.7-million. There have been no schedule changes yet for these routes, and so the effect of RapidTO on scheduled trip times and vehicle requirements is not yet known.
Finally there is a $35-million planned draw from reserves.
TTC Reserves
There are two reserves supporting TTC operations.
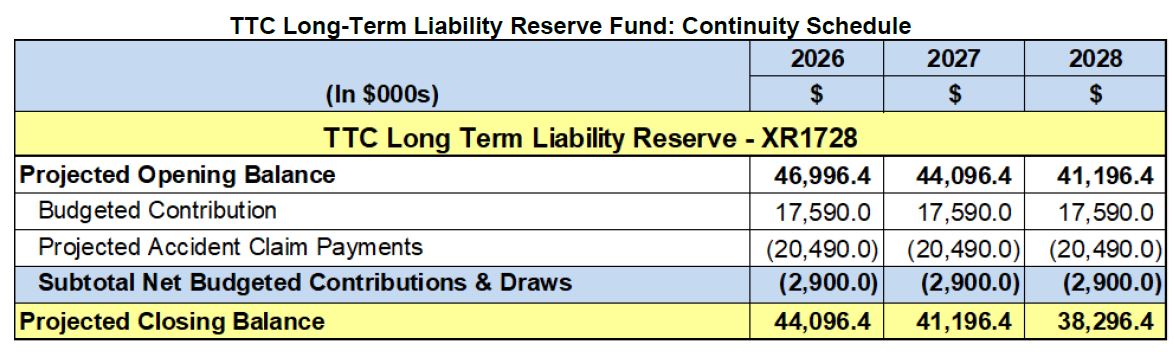
The Long Term Liability Reserve funds accident claims payments as the TTC is self-insured except for major disaster coverage. The table below shows the expected contributions and payouts for 2026-2028. The contributions are booked as an expense in the Operating Budget.
The Stabilization Reserve Fund is used to fund shortfalls in the Operating Budget as well as certain unexpected one-time costs . It also includes provision for emergency withdrawals that may or may not be used in any year. Contributions to the fund come from one-time TTC income such as asset sales, as well as from year-end City surpluses, if any.
Notable in the 2026 planned draw is $15-million for “LRT Start-up Variation Costs” that are not funded by the Province. This continues into 2027 at $5.6-million.
Combined with the planned $35-million draw to balance the 2026 budget, the reserve will be at a low level in 2027 and will not be available to backstop rising operating costs.
Staffing
Staffing for the conventional system is planned to rise from 14,216 in 2025 to 14,451 in 2026 (1.7%). On Wheel-Trans the increase will be from 617 to 675 (9.4%)
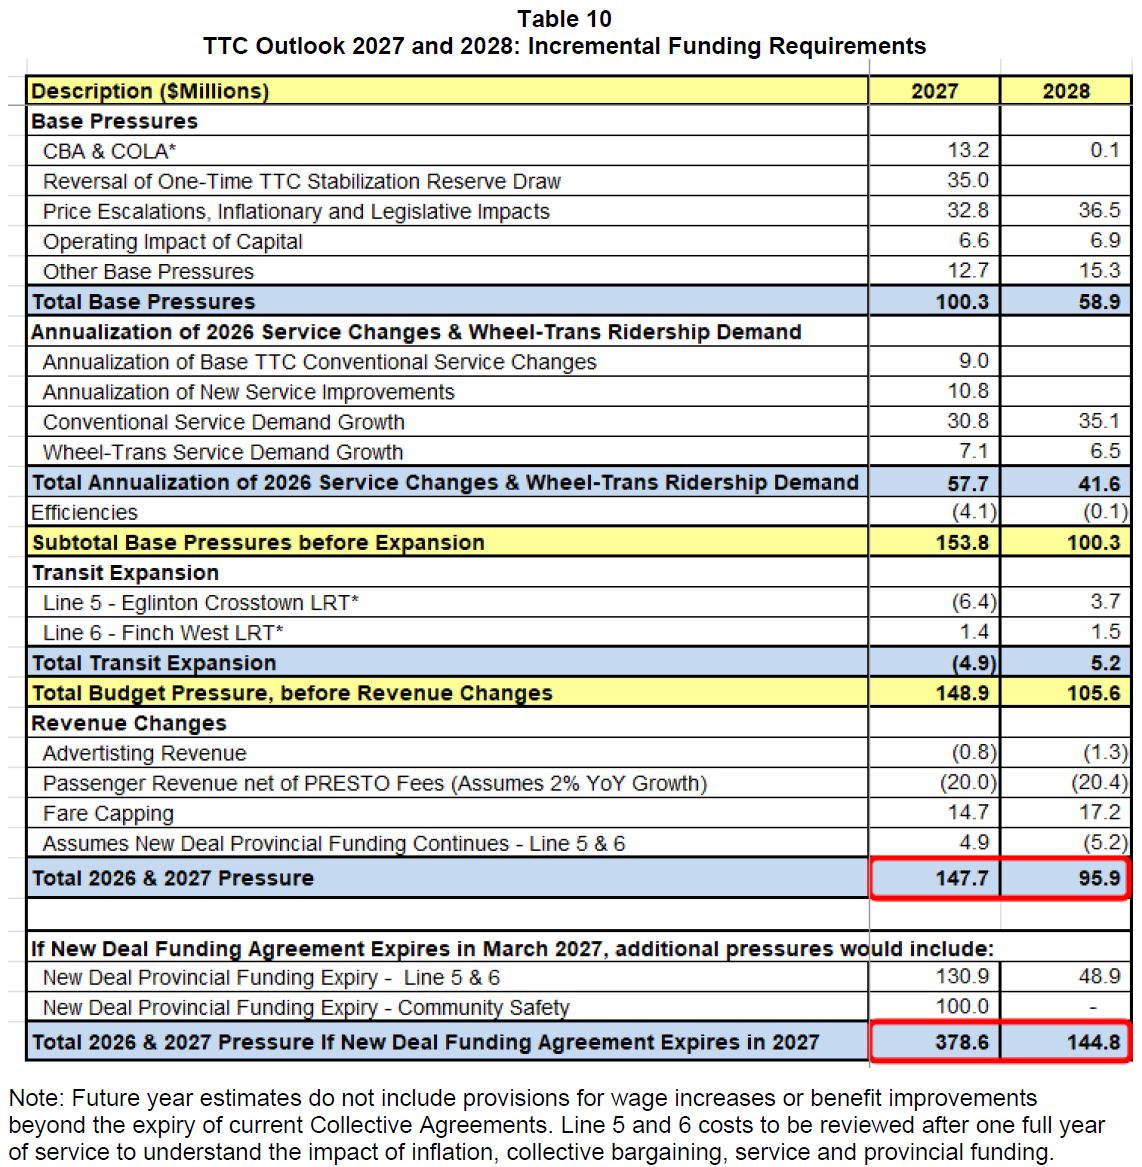
Looking Ahead to 2027 and 2028
The budget pressures for 2027 and 2028 are substantial, and they are outlined in the table below. A few key points here are:
- The loss of the Stabilization Reserve as a source of revenue adds $35-million to the 2027 shortfall.
- There appears to be no provision for service improvements beyond demand growth in 2027, nor for annualization of such changes in 2028.
- The cupboard is almost completely bare for savings from “efficiences” and the TTC has run out of accounting changes to shift costs off of the current year operating budgets.
- If the Provincial “New Deal” funding supporting safety enhancements and the operation of Lines 5 and 6 disappears, this will add $231-million to funding needs in 2027 and $49-million additional in 2028.

Is fare capping not applicable to day passes? With one fare, I find myself unable to calculate whether I should buy a day pass or not more often.
Steve: Day Passes are not mentioned anywhere in the budget. I have sent a query to TTC to clarify their status.
LikeLike
Would be interesting to see how the percentages compare with the pre-Mike Harris operating budgets. Especially with the red-Tory governments in charge, like with Bill Davis.
Steve: The Davis formula was 2/3 of revenue from passengers and ancillary sources (60% fares, 6% miscellaneous like parking), 1/6 from the City, 1/6 from the province. There were cases when the TTC budget was artificially constrained by the desired growth at the City of Province so that the shares would still work out, as opposed to seeing them drop because costs went up more than they were prepare to fund. Formulae have some built in problems like that.
LikeLike
Somewhat related.
Has it been official that the Province upload the DVP and Gardiner. I bring that up because both expressways haven’t been uploaded despite the promise it would. The point of the upload was to redirect funds from the expressways to help with TTCs expenses.
Also, because it’s that time of the year for operating and capital budgets. There really should be a forensic deep audit of TTC operations. Seeing as that’s the biggest expense at TTC. I’m curious if there’s been a 3rd party audit. I’m sure TTC self audits , but it doesn’t hurt to get an outside view of TTC operations.
Steve: Although the upload has not been formally concluded, the Province is carrying all of the City’s costs.
As for audits, the City Auditor does review aspects of the TTC’s operating and capital budgets from time to time, but not the whole thing. The tricky part is that an audit is intended to find poor spending choices, or even worse, cases where inapproprate spending occurs. However, an audit does not consider whether operating practices are appropriate, or if capital projects that might have a political reason for existing might be replaced. The TTC did get a “peer review” recently from UITP, but it had a “once over lightly” feel in some sections. There are also occasional peer reviews by APTA. The problem is the tradeoff between having “peers” familiar with transit operations and management, and the old boys’ club who will avoid hanging out too much dirty laundry.
LikeLike
The province should not be paying to operate local transit in Toronto, the province is paying to build world class LRT lines in Toronto and Toronto should pay to operate them.
Steve: The province is quite clearly not building “world class LRT” although the structures look like they should fit that name. Who pays to operate it is a matter for overall policy discussions about shares between governments. By paying full operating costs for specific lines, the province gets back into transit subsidies on a limited basis with no long-term commitments, nor the need to create a province-wide policy for all transit systems.
What is quite clear from Ottawa and Toronto is that the P3 development and operating model does not work, and this is complicated by the blanket of secrecy over everything the province does.
LikeLike
George stated:
In your opinion, George, should the province be subsidizing the operation of private motor vehicles in Toronto?
Is it OK for the province to provide a subsidy for motorists but not transit users?
What about the regional One Fare program?
If not provincially funded, from where should the $ flow?
LikeLiked by 3 people
Is there a budget allocation for upgrading streetcar switches or the installation of transit signal priority? (I understand the city charges the TTC for TSP installation)
Steve: Money for new switch electronics is included in the Signals capital budget. TSP installations are funded from Service Planning’s capital budget. At this point, there has been no decision about upgrading switches. The replacement of electronics has been dragging on for years and still has more to go.
LikeLiked by 1 person
Always detailed data break downs with precise explanations from Mr. Munro…well worth reading more than once….my only point on ridership being below expectations is security…people feel less safe on the system more now than in previous decades.
LikeLike
TTC is always short of money. They could use some ideas for attracting new riders, especially outside of rush hours. In my travels abroad I am often charged a city or tourist tax (on the order of $5 a day) and as a compensation I get a pass for free travel on all local public transport. Not sure why Toronto does not do that, for all visitors who stay in hotels, airbnb and such.
Steve: Toronto already has an “accommodation tax” of 8.5% that is intended to fund promotion of the city. An argument could be made that many hotels are not well-served by transit, and if their tax went to the TTC it would provide little benefit to their guests.
LikeLike
Seems pretty silly that they have 4 different concession fares…they should just unify them all at $2.10/47…would simplify marketing/branding/signage/website etc.
Keeping the concession rate below 100$ would make a lot of sense, and would likely poll better than 1$/beer…
Pretty much all reasonable concessions are covered now, and after we bring down the multiplier to 40, the next goal should be to push major employers to cover their employees transit costs as a benefit (with an upper bound of 1800$/47 and 1584$/40 and a chunk of employees likely never using it at all the cost would be low for most employers).
25% of Canadians are employed by the government, so this could be covered likely with around 200m$ (50-75m for each level). If you can bring employees of major companies into that system we’re likely left with <500m$ from fares and the rest from benefits. Fare Free transit starts to become in reach.
LikeLike
Thanks Steve, and most commenters. The ‘world-class’ aspect of Dickster’s claims – is that when the Guardian runs a story about how a runner goes faster than the multi-billion LRT? Providing a laugh to many is a good thing, but maybe the joke’s on ‘us’ – which isn’t the TTC/Toronto as much as the Cons, Mr. Ford and Metrolinx at Queen’s Park, where at least there is an effort to see if there’s value for the billions in the larger projects.
Maybe this is another way to ‘bankrupt the system’? Over-spend whilst claiming ‘investment’? – and most are too busy, or on treadmill to really discern what value is in a complex circumstance, oop$$, and what’s a few billion anyways, and it’s not necessarily the Cons that will get fingered as the money pits are in Toronto.
LikeLike
There used to be a time that the TTC published the operational revenue and costs of each streetcar, bus, and subway line. We no longer see that. It showed that the suburban bus lines were where the most expensive to run, because they tended to be longer. Shorter routes, like the 77 Spadina bus or 510 Spadina streetcar, tended to generate the revenue needed to subsidize the other routes.
Wonder if management has access to current numbers?
Steve: The stats for 2024 and other years are on the TTC’s Planning Page (scroll down to find them).
Revenue is a meaningless term at the route level because people do not “buy” transit at that level, but rather in two-hour or monthly increments. There have been attempts to produce a “profitability” value for routes in the past, but there is a fundamental flaw when revenue is allocated “per boarding”. For the sake of argument, assume that the total revenue divided by the total boardings is $1.50. If a rider only used the one route, their trip would allocate less revenue than they actually paid. Conversely, if they made several transfers contributing boarding to every route they used, the allocated revenue would be more than their actual payment.
If someone gets on the Coxwell bus, their trip cannot be longer than two kilometres, and so the cost of that trip will be very low. In any table where “profits” were calculated, the Coxwell bus always “made” a fortune because of the low cost per passenger carried. Conversely a route like Lawrence East has longer trips and so the cost per trip is higher and it always “loses” money. Longer routes, particularly those with strongly directional demand (i.e. a lot of empty space counter peak) will never be “profitable”. One can even have the nonsensical effect that if a route is split, or two routes are consolidated, their profitability will change even if ridership and service do not because new boardings arise from transfers, or they disappear because of one-seat trips. A good example is the 501/507 service where a through rider counts as two boarding until about 9pm, but then only one afterward because the transfer at Humber Loop is eliminated.
Another type of allocation attempted in the early days of the service standards was to estimate the actual mileage travelled by an average passenger on a route. Revenue was allocated per passenger kilometre, and this had the effect that a rider making a long trip could allocate far more revenue than the fare they actually paid. Conversely, short trip riders paid more than was allocated to their trip. This is obvious nonsense.
The TTC now looks at boardings per vehicle kilometre as a metric of route utilization. It is not perfect because route costs are affected both by the distance vehicles travel and by their speed with slower routes costing more because one operator hour covers less mileage. Fast routes require fewer boardings to produce the same boardings/hour value, and this works against slower routes in the inner city.
Nowhere in the methodology does the TTC account for the lack of “productivity” from padded schedules and recovery times. One could argue that these are part of the cost of doing business, but there is a huge variation from route to route with some having very long terminal “recovery” to make a blended schedule on the route work. If there were a standard factor such a x percent of the trip time then it would simply be a multiplier against the base cost of actual driving time, but that’s not how the schedules are built. TTC has resisted putting recovery time in the ATU contract for decades for fear it would become an entitled break rather than time to be used as-and-when conditions dictated.
Another complexity is infrastructure utilization. For example if the TTC has 2000 buses, but more are “spare” than industry standards would dictate, where does the cost of the extra buses go? If a subway line has less service than the network on average (e.g. 4 Sheppard), should it be charged with a higher operating cost/passenger because track, tunnels and stations have to be maintained and operated even though demand is lower?
For the record, the TTC treats the entire subway system as one “route” because breaking apart line-specific costs would be very difficult. Subway boardings count entire trips as “one” and do not include transfers between routes.
Changes in vehicle type can affect some factors. For example, replacing standard sized buses with artics reduces the vehicle mileage and operator hours needed to provide the service. However, the TTC does not distinguish between operating and maintenance costs for different vehicle types. The biggest such change occurred when the new 75-foot “M” and “H” trains replaced the old, shorter “G” trains. It was still the same service level, the same number of operators and guards, but only 3/4 of the vehicle mileage because 8-car trains were replaced by 6-car trains. If costs were calculated only on the basis of mileage rather than a mix of factors, the subway would have been much “cheaper” on paper to operate, at least until the formula was recalibrated and there was a sudden “jump” in the cost (measured relative to mileage) of running the Yonge subway. This is the sort of simplistic effect that politicians and some managers love to seize on without understanding how the formula is wrong.
The actual cost of a route is a combination of various factors including operator hours, vehicle mileage, peak vehicle requirements, route length (infrastructure costs), number and complexity of stations, supervision and administrative overhead.
It’s not a simple discussion.
LikeLike
Steve rightly commented:
And we’re lucky that Steve and others are able to give a background in the complexities, thanks.
It’s reminding me a bit of carbon/GHG accountings – which we’re pretty bad at in all levels of government. Yes, City of Toronto – doesn’t include concrete usages; Province of Ontario, which is tending to fan flames in pyrotization; and Canada as well, not doing well at including carbon from forest fires. And all of our consumptions and air travel/freight tend to not be put in.
So can we generalize about transit costs to the extent that the compact urban form tends to be revenue-generating, relative to costs, and the lower density/sprawl tends to be a drain? (Should check the Pamela Blais book Perverse Cities for her inputs).
See also Alon Levy’s fresh post as a window to complexities
https://pedestrianobservations.com/
LikeLike
75 Sherbourne uses 3 buses Saturday early evenings, Sunday afternoons/early evening.
The TTC chooses to maintain an even 20′ headway at all times so that ends up with a schedule that looks like 53’/7′, 51’/9′, and 43’/17′ (running time/terminal time). A lot of padding there on Sunday.
83 Jones uses 2 buses at all times during off peak periods. In contrast here the TTC varies the headways between 15′ and 22′ keeping the number of vehicles constant.
My favourite has to be the schedule for Saturday and Sunday early evening.
Both periods are given 27′ of running time but for some reason, they are given 13′ of terminal time on Saturday and only 5′ on Sunday.
This results in 20′ headway on Saturday (27’/13′) and 16′ on Sunday (27’/5′). Why not 16′ for both periods?
Steve: Bus route performance has been reviewed many times on this site. I agree that some of the scheduling is weird with ridiculously long recovery times rather than more frequent service. The TTC does not appear to have uniform standards for schedule design.
LikeLike
I didn’t even get to my favourite whipping boy 114 Queens Quay East. The route has insane amounts of schedule padding. Literally 1/3 of operator time during early morning and evening periods is terminal time. Sometimes it’s even more than that!
During some periods there’s more terminal time given for this route than city-spanning routes with 3-4 times the running time. It’s common to look at the tracking maps during the day and see more buses idling at the terminals than actually driving on the route. The waste is ridiculous.
LikeLike
Amidst the details surrounding monthly fare capping, I’ve not been able to find any reference to the annual pass (previously MDP). For those of us that consistently take 47+ trips/month, the replacement of that pass with monthly caps will amount to an additional ~$16/month in my case.
Steve: The annual pass will still be available. From the TTC 2026 Budget report:
LikeLike