
Many of the service analyses on this site concern larger, major routes like the streetcar lines and bus routes crossing substantial distances in the suburbs. The picture of service quality is not a pretty one. Starting with this article, I will review service on several of the shorter routes, many with infrequent service, to see how the TTC fares. Short routes get frequent stops at terminals where headways can be reset, but irregular service can mean long waits for riders.
Many of these routes show very irregular service and one cannot help asking how this affects ridership. The TTC talks about improving service on major routes with interventions such as reserved lanes, but seems incapable of managing headways on relatively minor routes. There is a parallel here with declining maintenance quality where issues with the “little things that don’t matter” start to bleed into the major services and the system drives away as many riders as new services might attract.
Common problems seen on most of the routes reviewed here are:
- Headways do not generally stay within a narrow band, but can be badly scattered especially for evening and weekend service.
- In spite of this scatter, it is quite possible that the routes meet the TTC’s service standards which merge performance over an entire day, and provide a wide margin for data points outside of the target range (40%).
- Review of the detailed tracking data (not included here in the interest of space) shows that some of the widest gaps occur because of missing buses. There is a metric in the service standards for missed trips with a goal to “minimize” them, albeit with no target. Trips can be missed because no operator or vehicle is available, or because of a short turn before a bus reaches the terminal, or because of such extreme lateness that it might as well not have operated. This statistic has never been reported in the monthly service quality metrics.
- Bus bunching occurs even on routes with scheduled headways of 20-30 minutes, and this can persist for multiple trips showing little effort to space out service. Where the quality metric is “on time performance”, spacing service to compensate for bunched or missing vehicles can actually work against a “good” score even though what riders see would be more reliable.
Routes included in this article are:
8 Broadview
15 Evans
19 Bay
22 Coxwell
23 Dawes
26 Dupont
31 Greenwood
49 Bloor West
50 Burnhamthorpe
62 Mortimer
64 Main
65 Parliament
An additional 13 routes will be included in Part II of this series.
65 Parliament
70 O’Connor
72 Pape
75 Sherbourne
83 Jones
88 South Leaside
91 Woodbine
92 Woodbine South
111 East Mall
112 West Mall
114 Queens Quay East
154 Curran Hall
168 Symington
After the “more” break, data for one route, 8 Broadview, are shown in detail as an introduction. Further routes are shown only in summary, but with links to PDFs containing all of the charts for readers interested in them.
General Notes
Re screenlines: The points at which headways are measured are generally set a short distance from loops so that the process will not confuse vehicles circling loops with those actually leaving. Measurements at intersections are at the midpoint of the cross-street except when specifically noted as “north of …” or similar.
8 Broadview
There is a common format to each route’s review that I will illustrate with the first example.
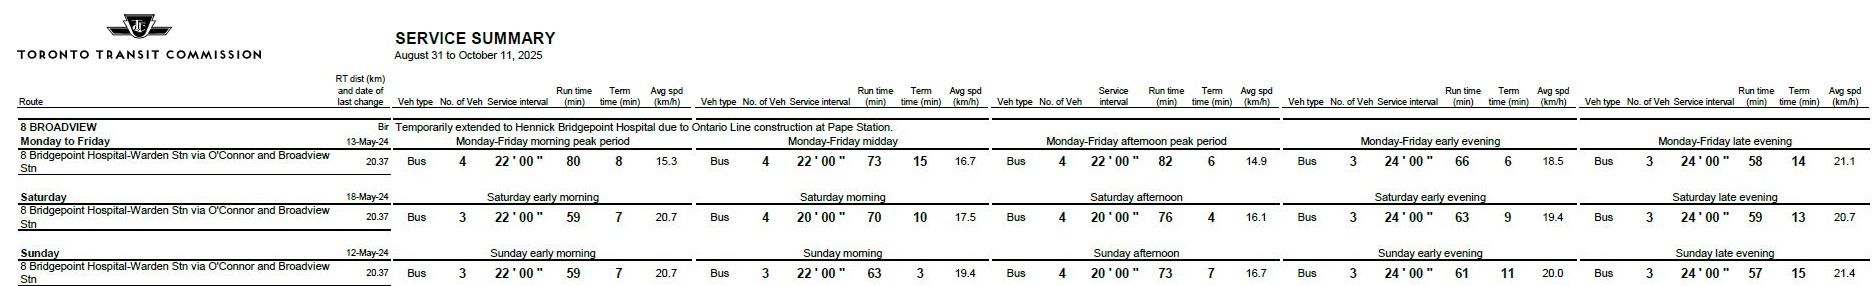
8 Broadview normally runs between Broadview and Warden Stations via Broadview, O’Connor and St. Clair. Temporarily, due to the relocation of 25/925 Don Mills from Pape Station to Broadview Station, the route is extended south to Gerrard looping near Bridgepoint Hospital.
Service is infrequent with headways ranging from 20-24 minutes provided by 3-4 buses at all hours.
Westbound from Warden Station
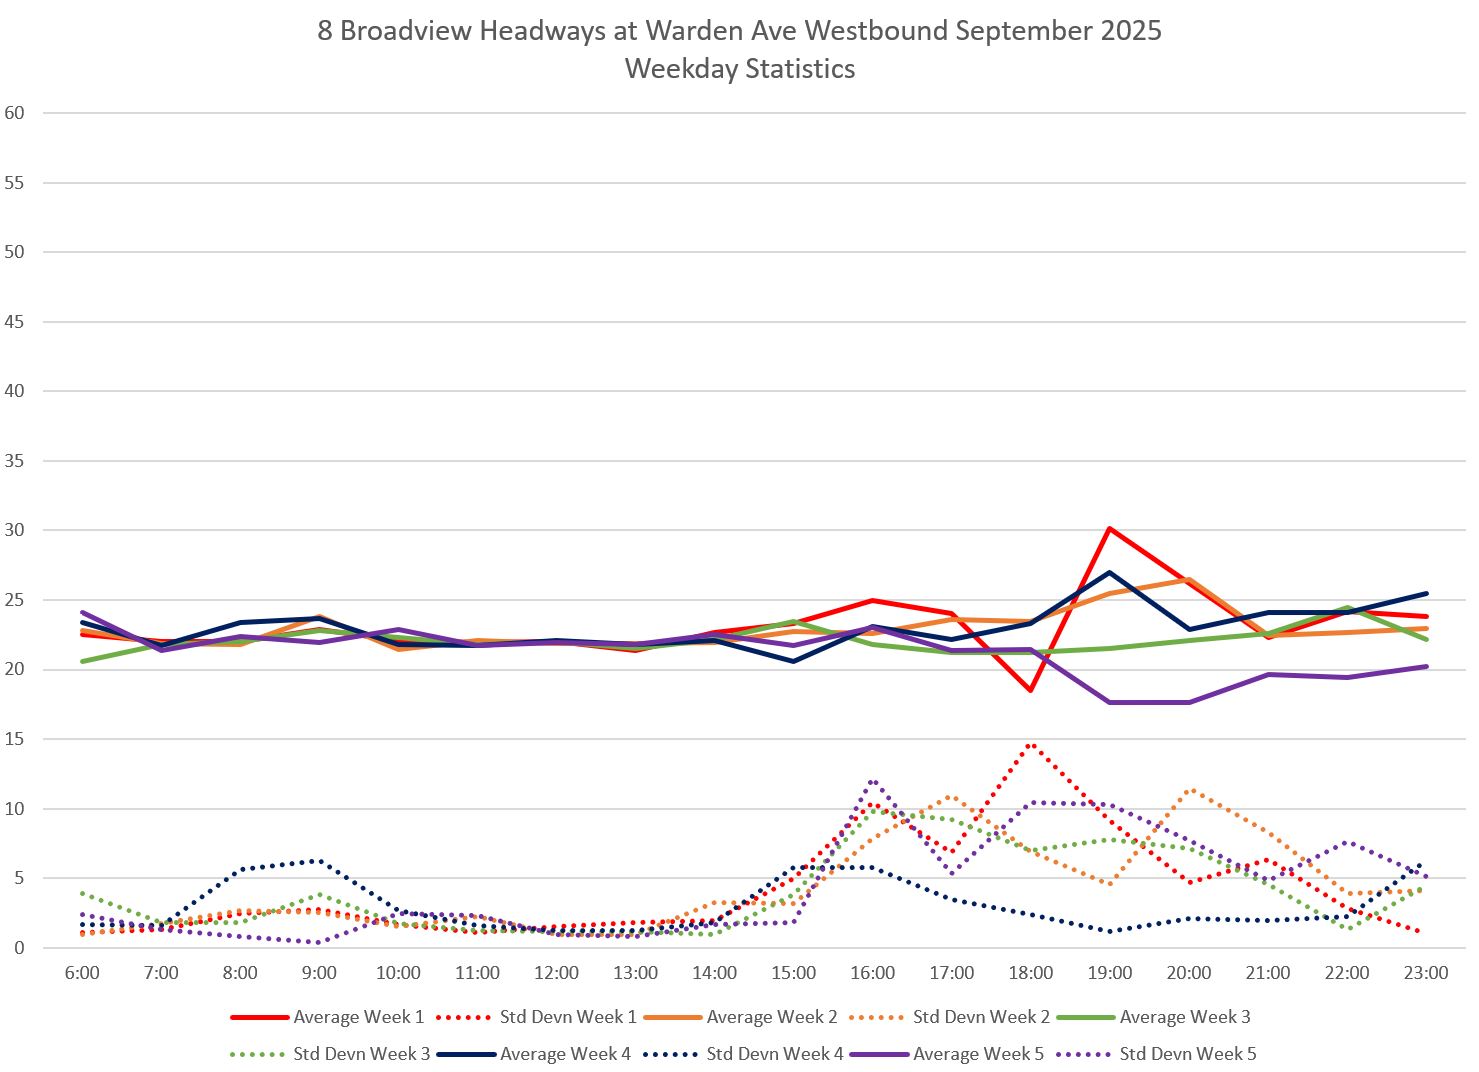
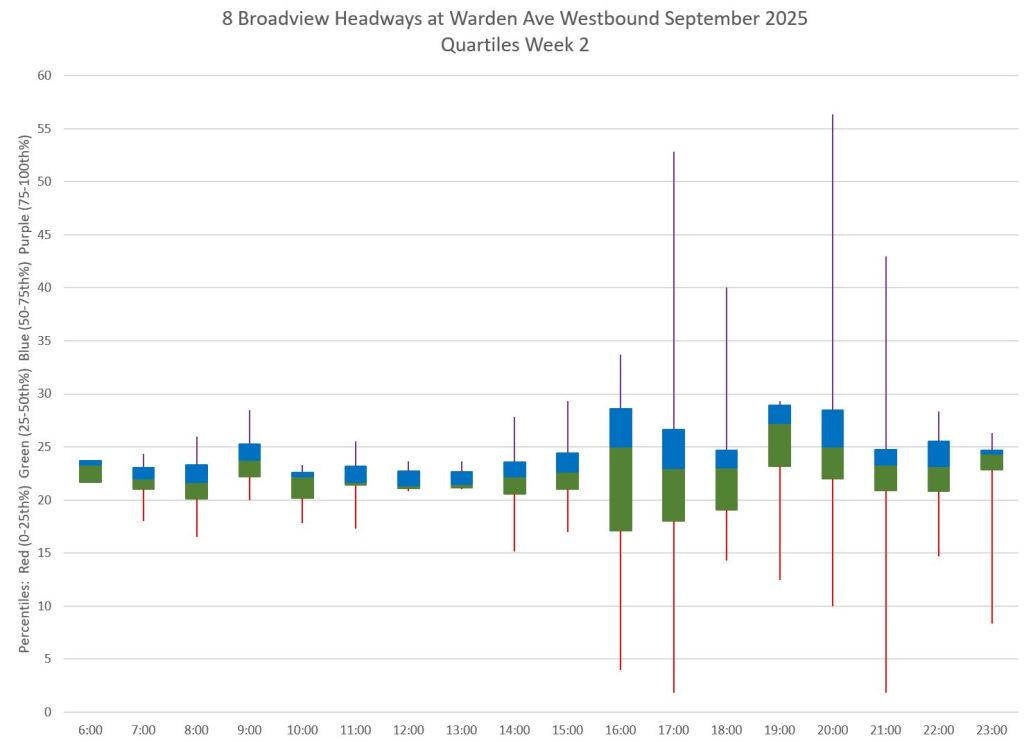
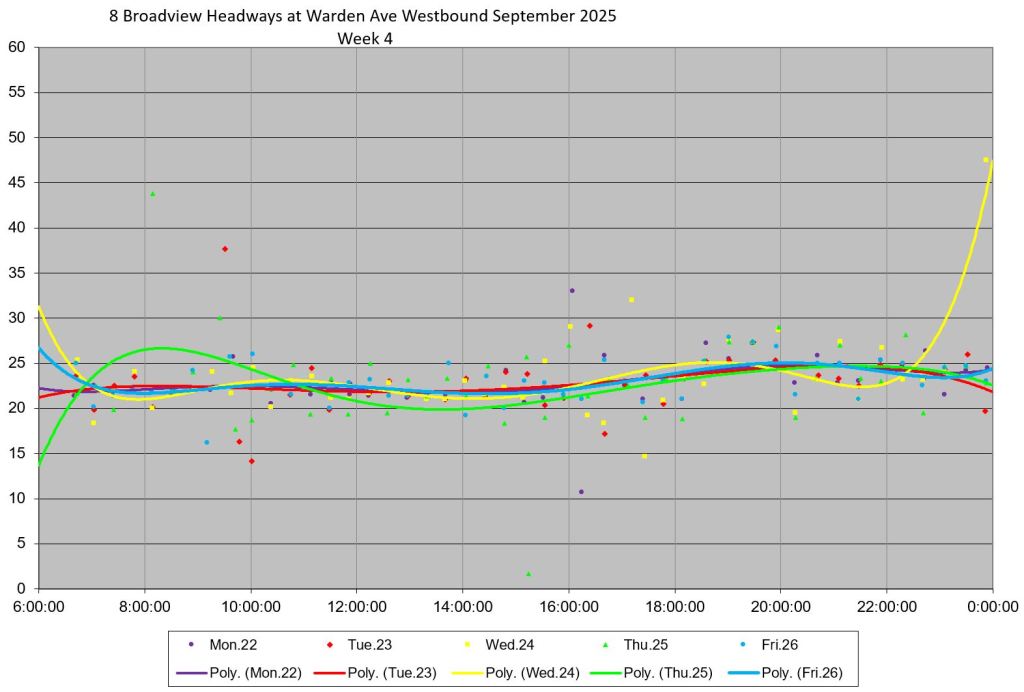
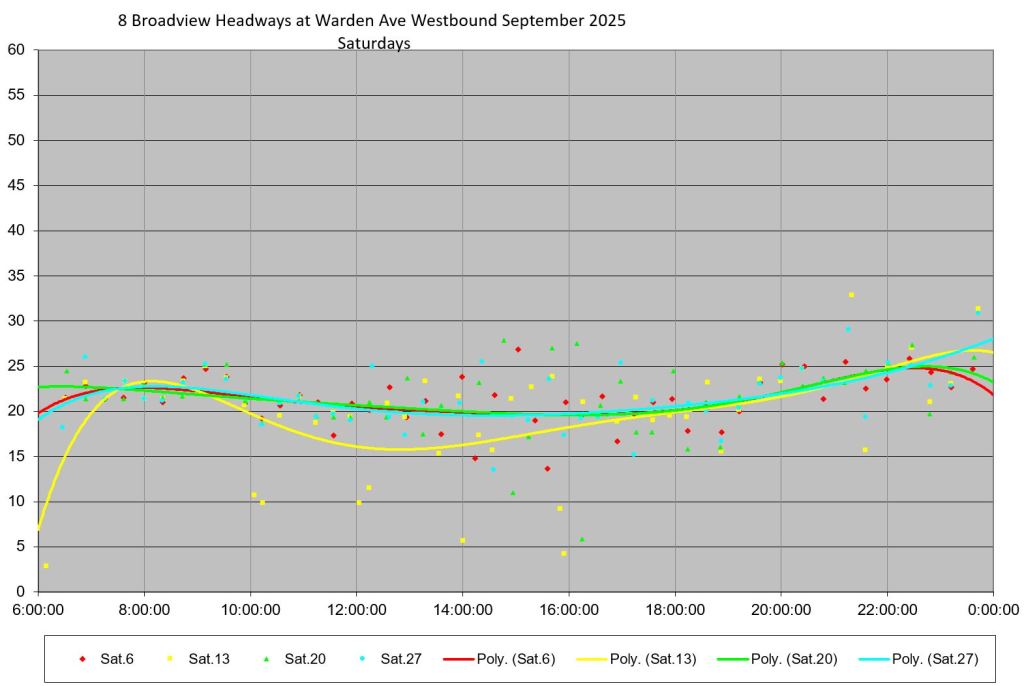
The weekday headways westbound from Warden Station (measured at a screenline just west of Warden and St. Clair) vary substantially, particularly in the evening. The chart below summarizes the statistics showing average headways by hour for each week and the standard deviation in values (a measure of scatter around the average). When the SD values are low, then the individual headways are close to the average, but when the SD value rises, the headways are widely scattered.
TTC service standards call for infrequent routes to stay within a six minute window of “on time” and this is simply not possible when headways have a range of 10 minutes or more. This is illustrated in the weekly charts that follow.
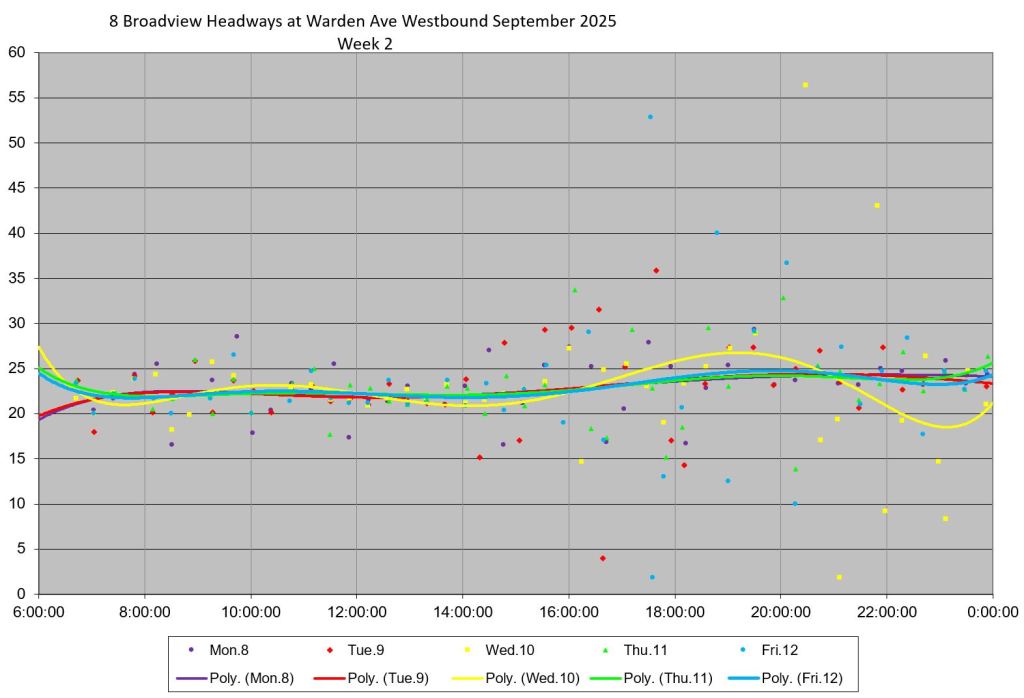
Although the maximum scheduled headway is only 24 minutes, I have set the maximum y-axis value to 60 minutes to fit in the outlying data points. Yes, riders can wait over 50 minutes for a bus to show up at their stop.
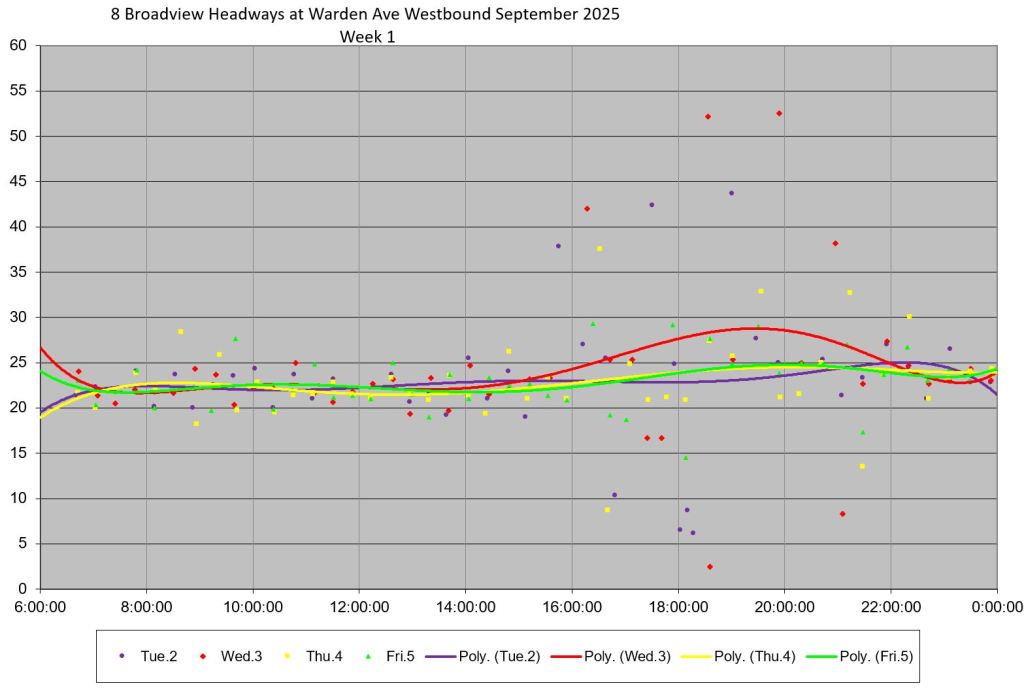
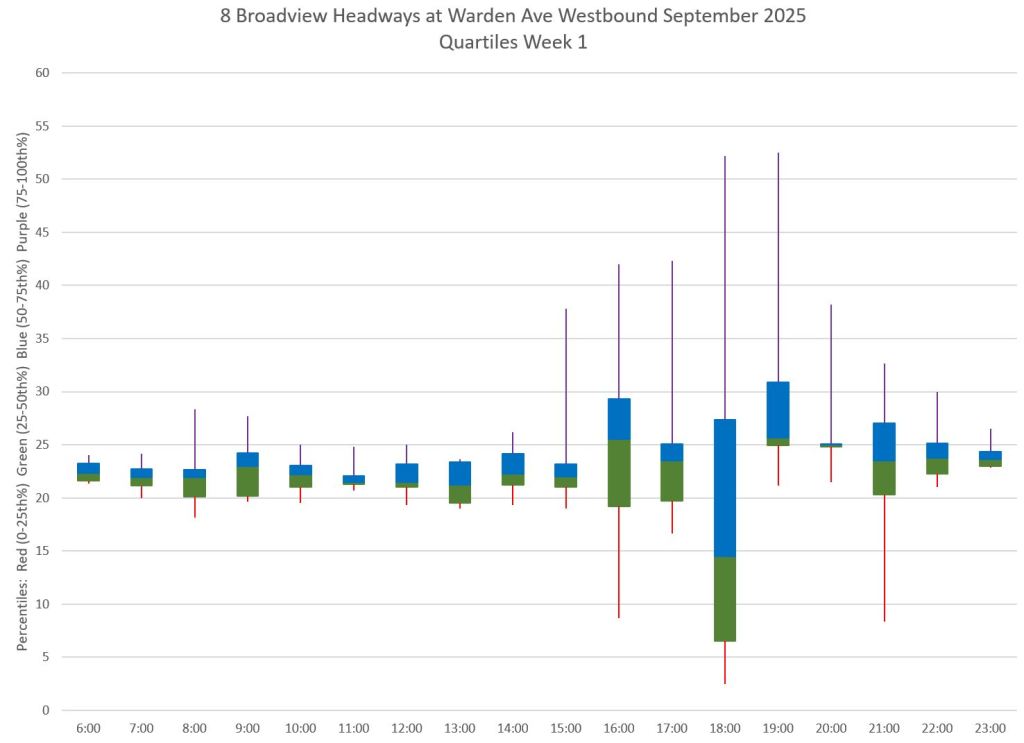
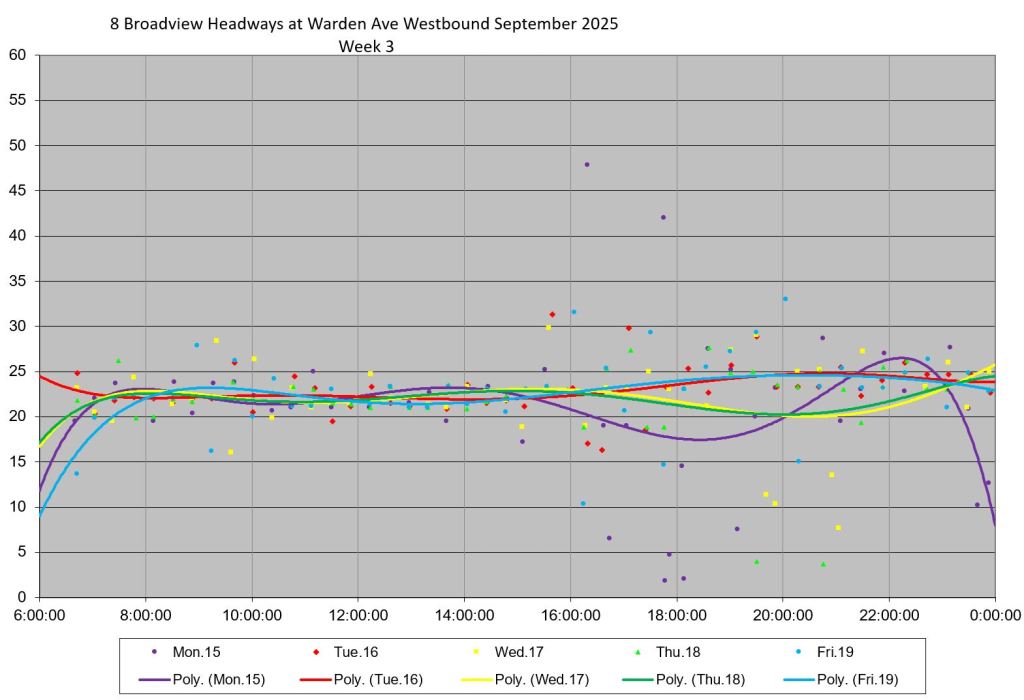
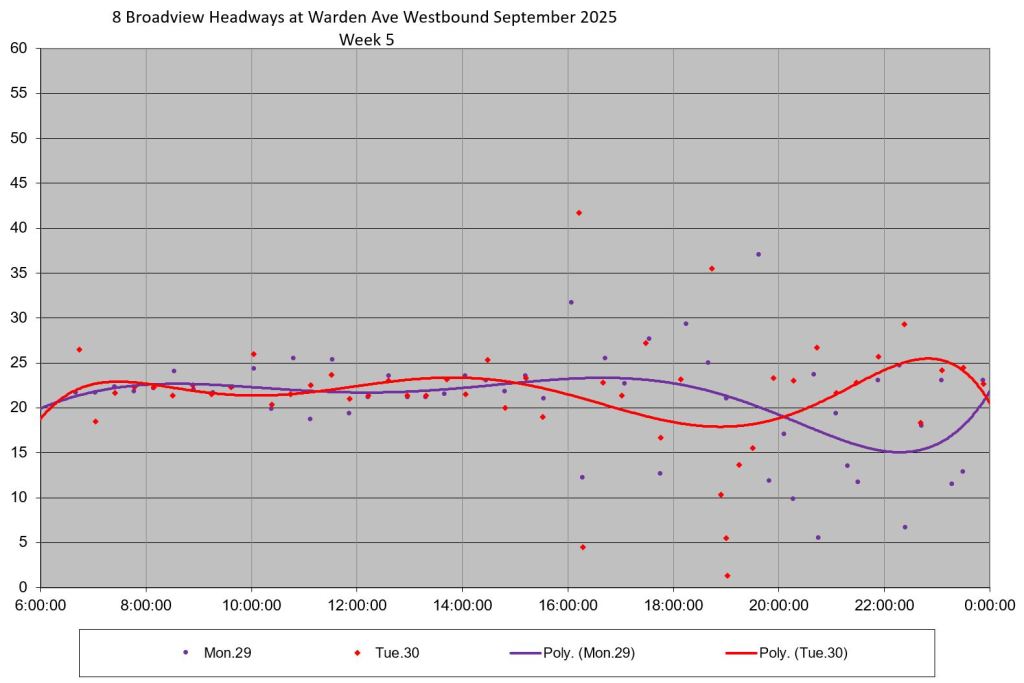
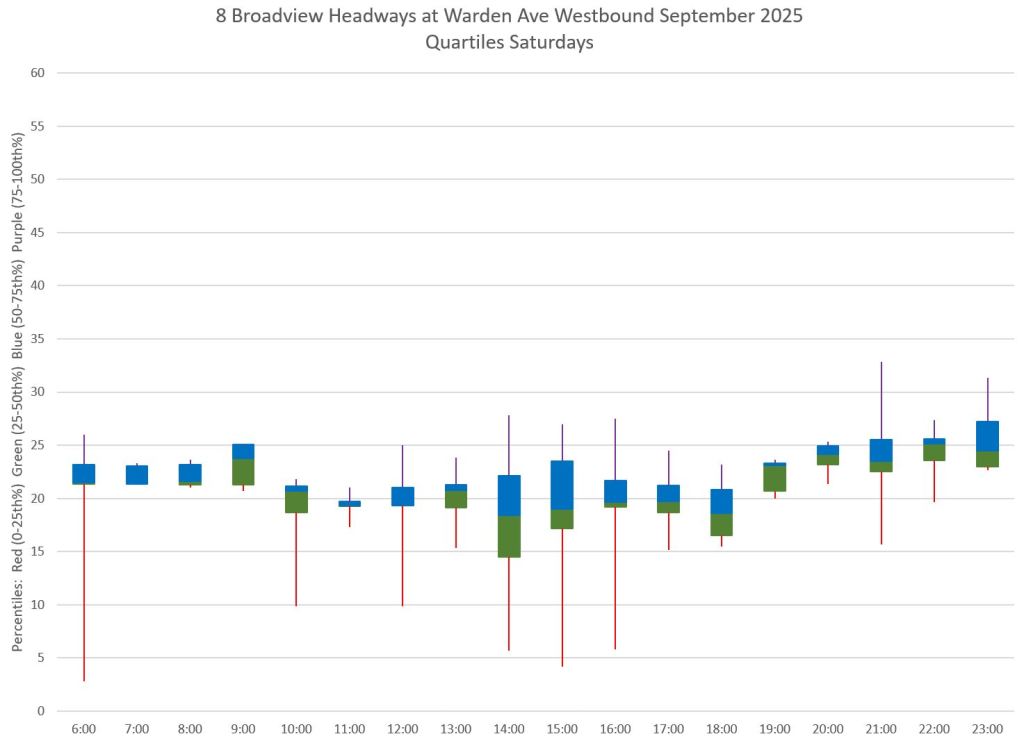
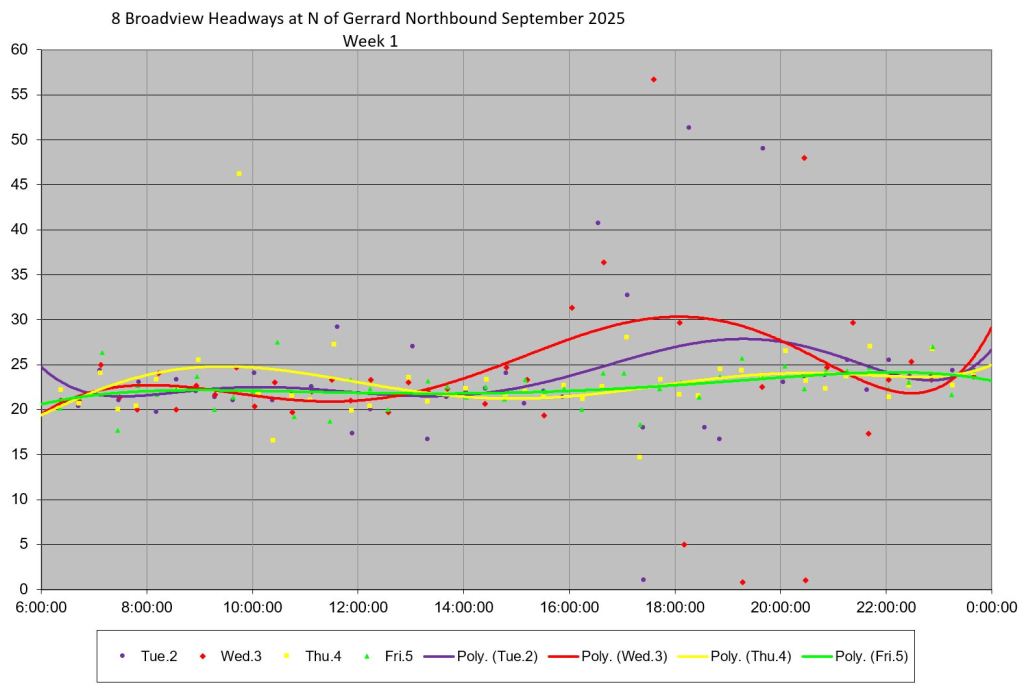
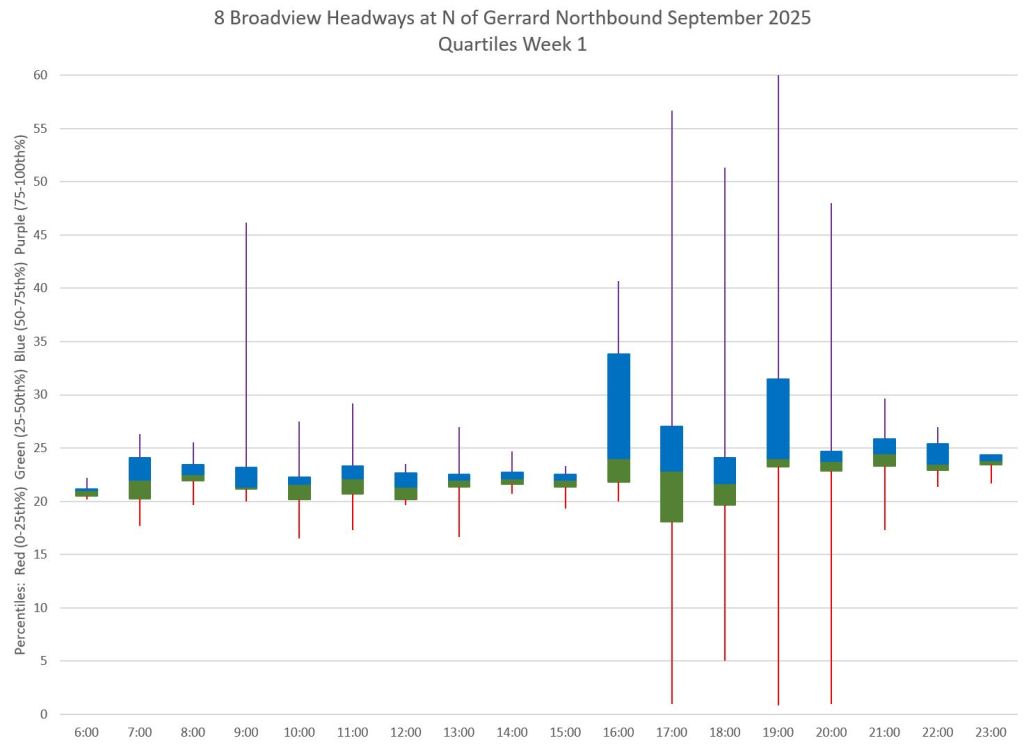
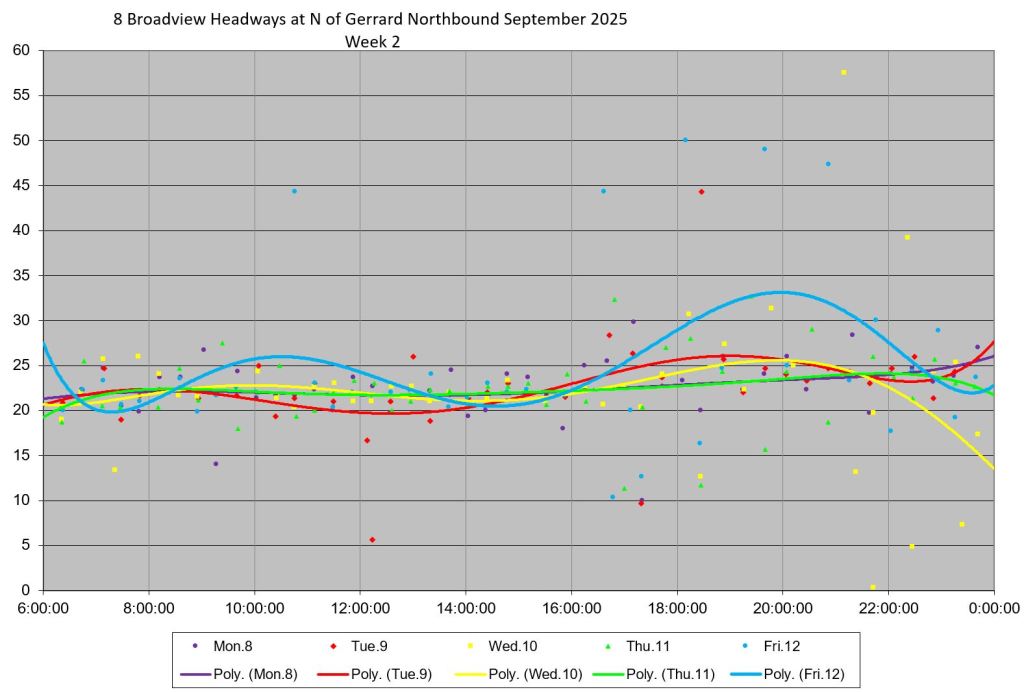
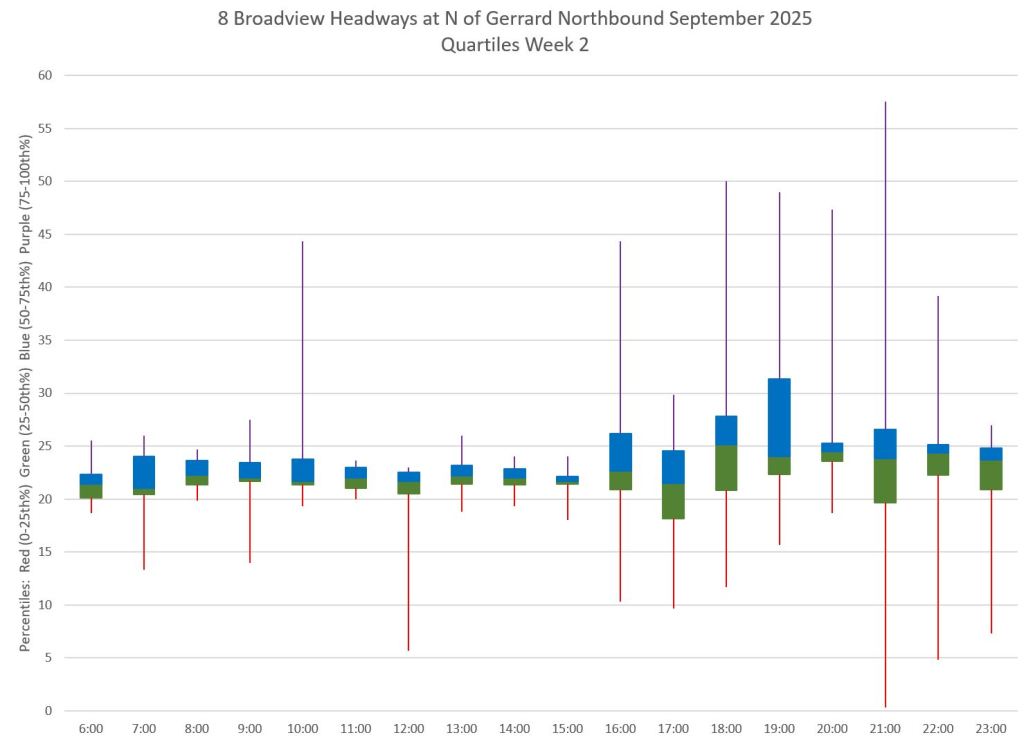
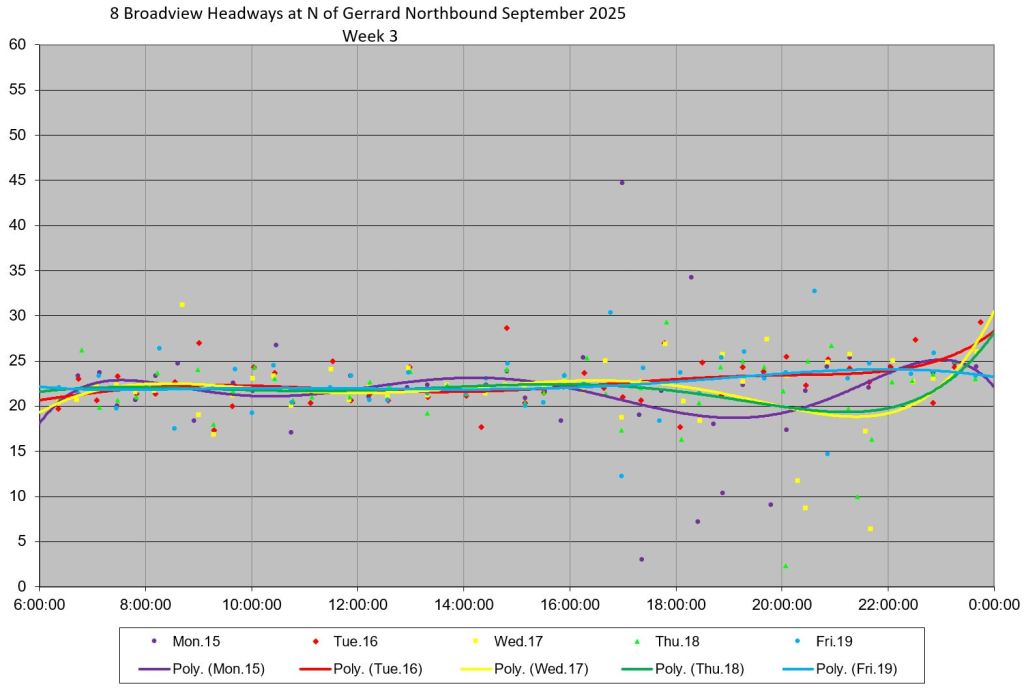
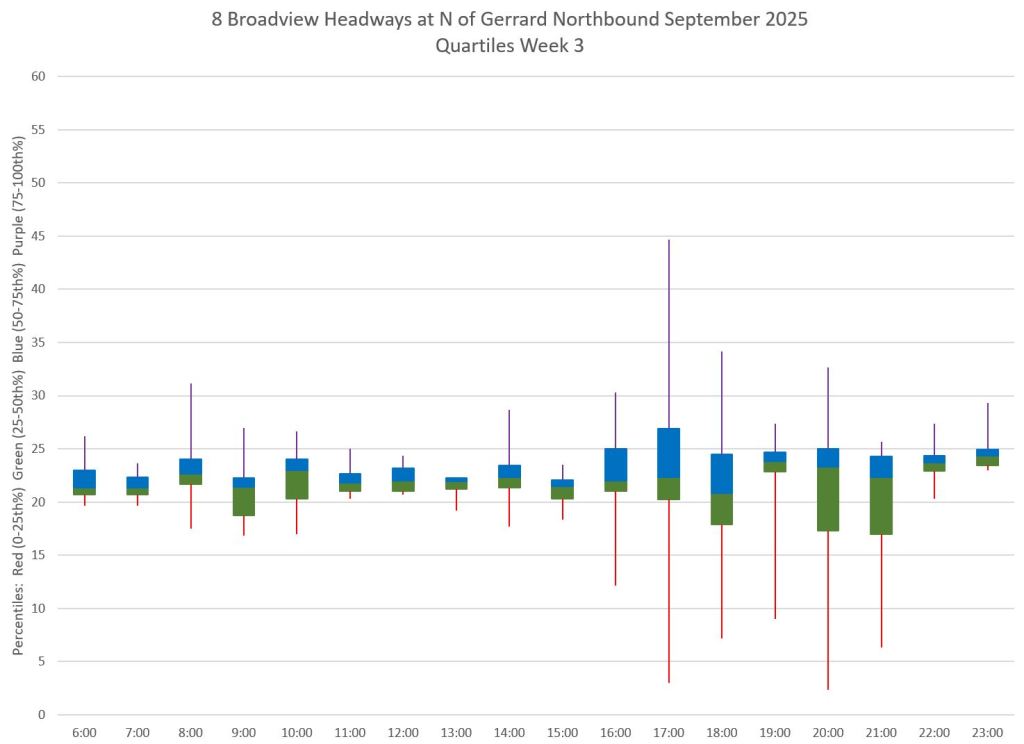
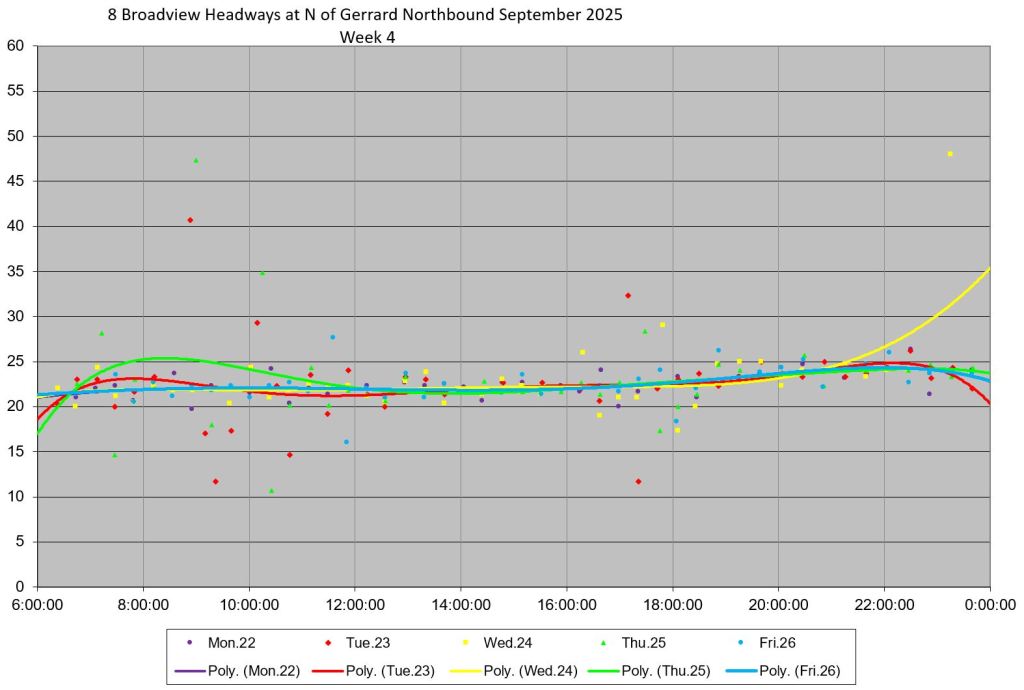
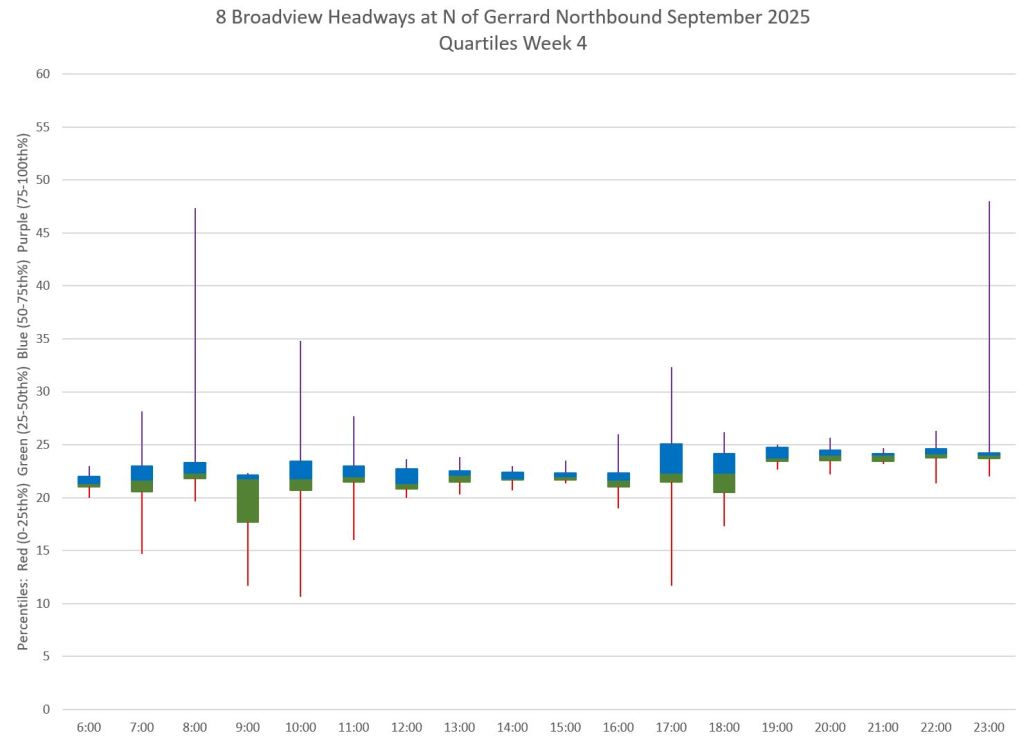
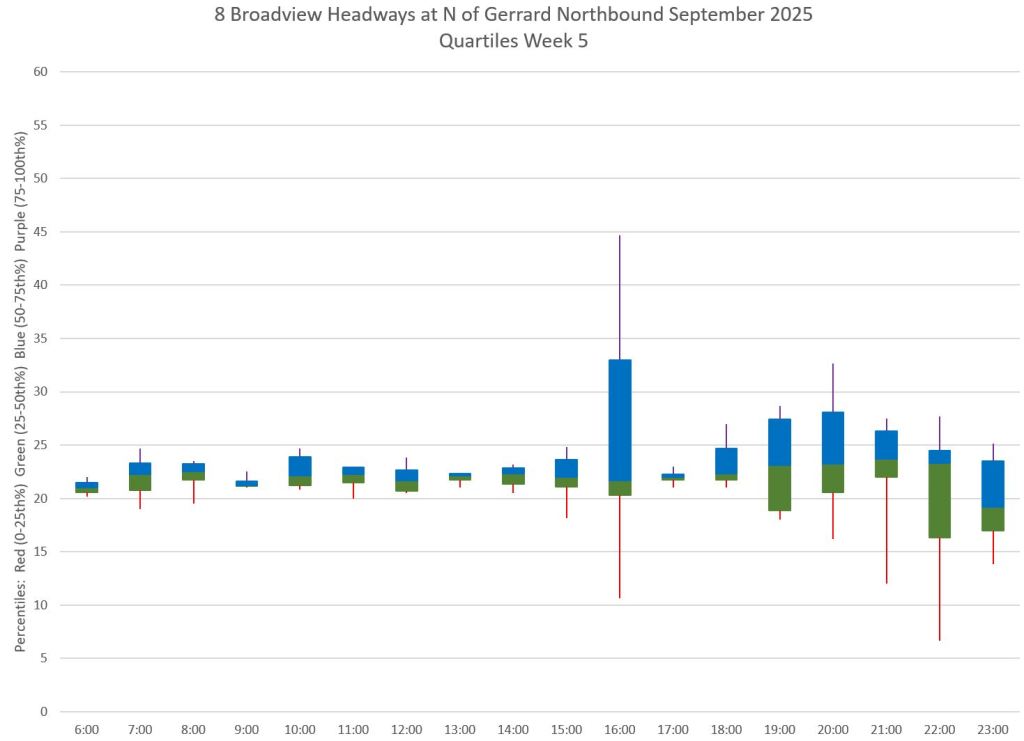
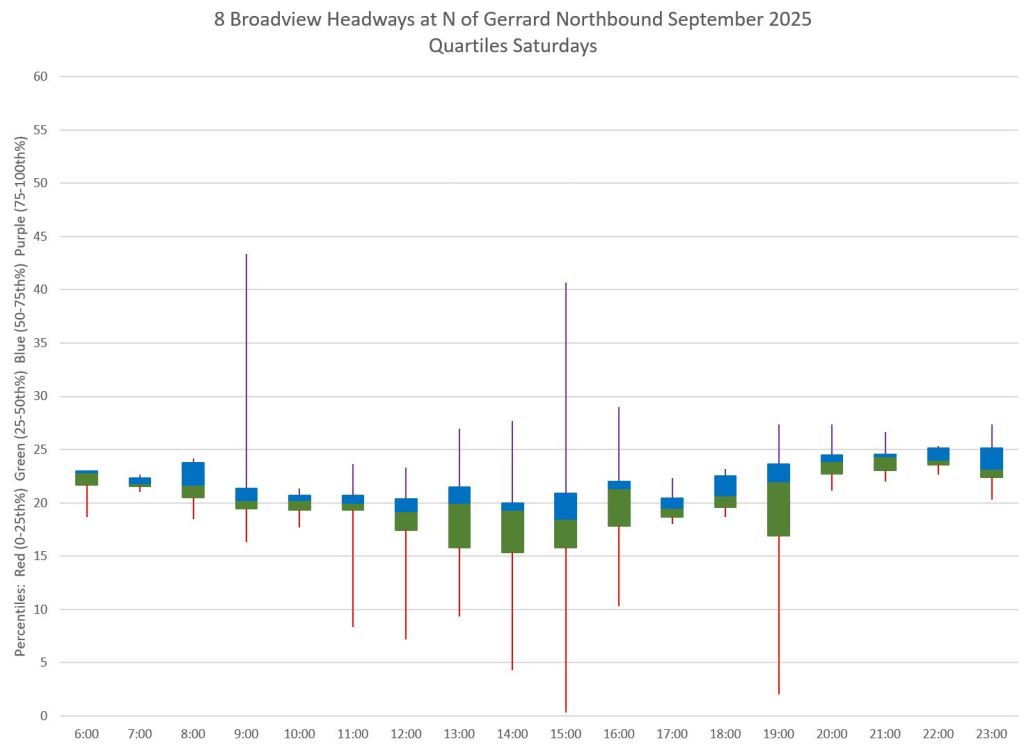
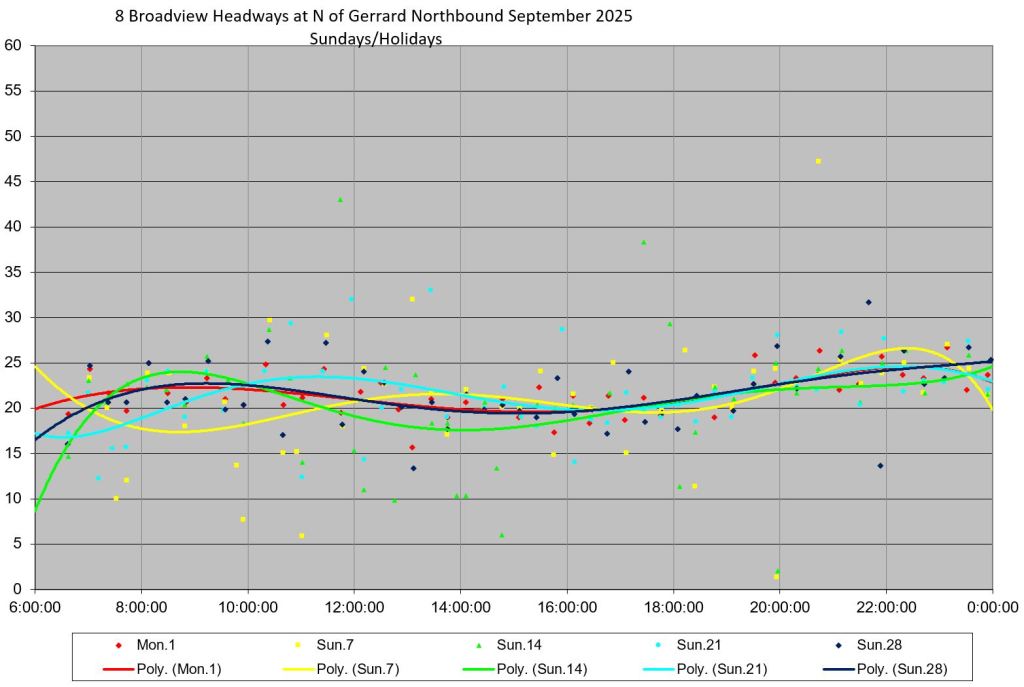
The charts below show values by week and day with the individual data points plotted on the left, and bar charts showing the quartiles of values on the right.
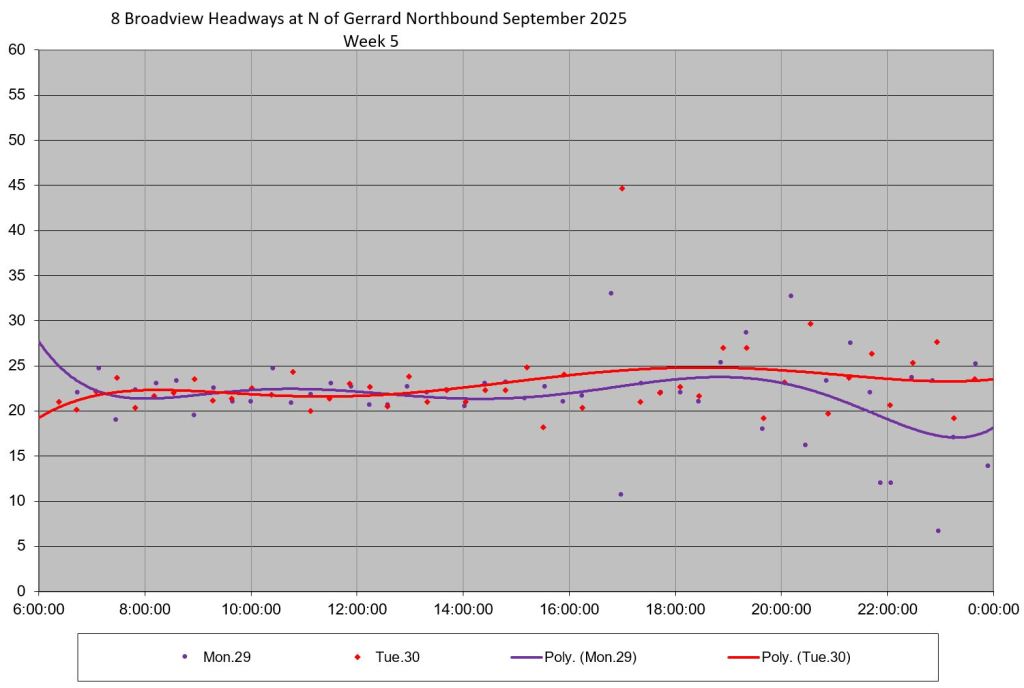
The lines on the charts with the data points are not moving averages, but are trend lines to show the overall distribution of the data. This avoids major short-term swings and a “choppy” look to the charts.
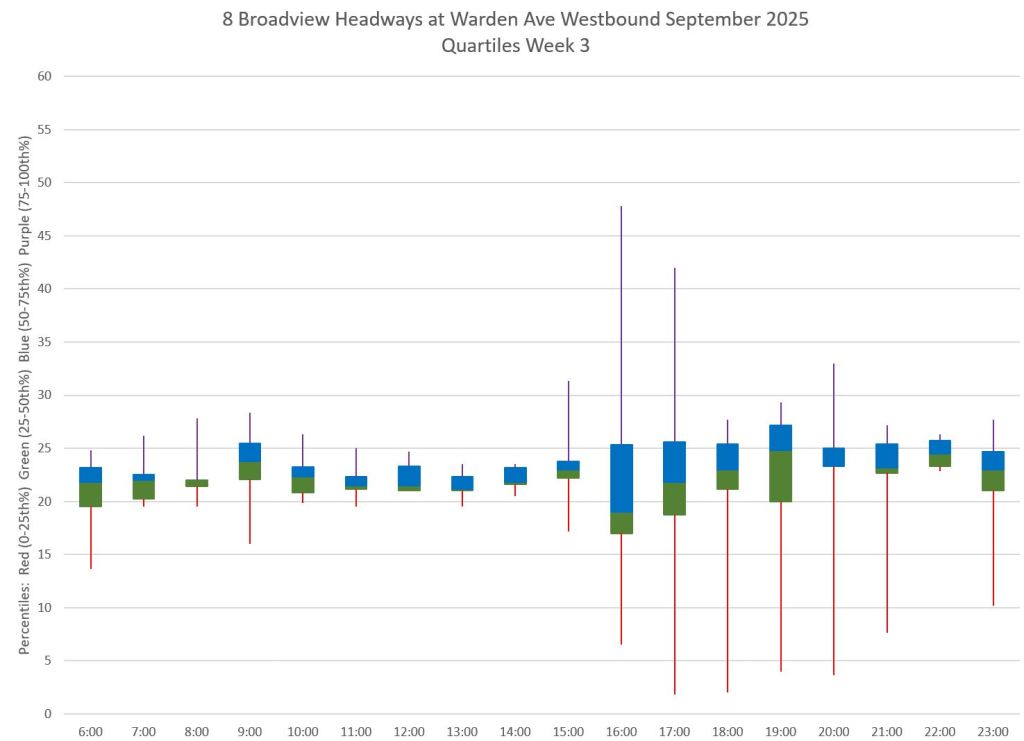
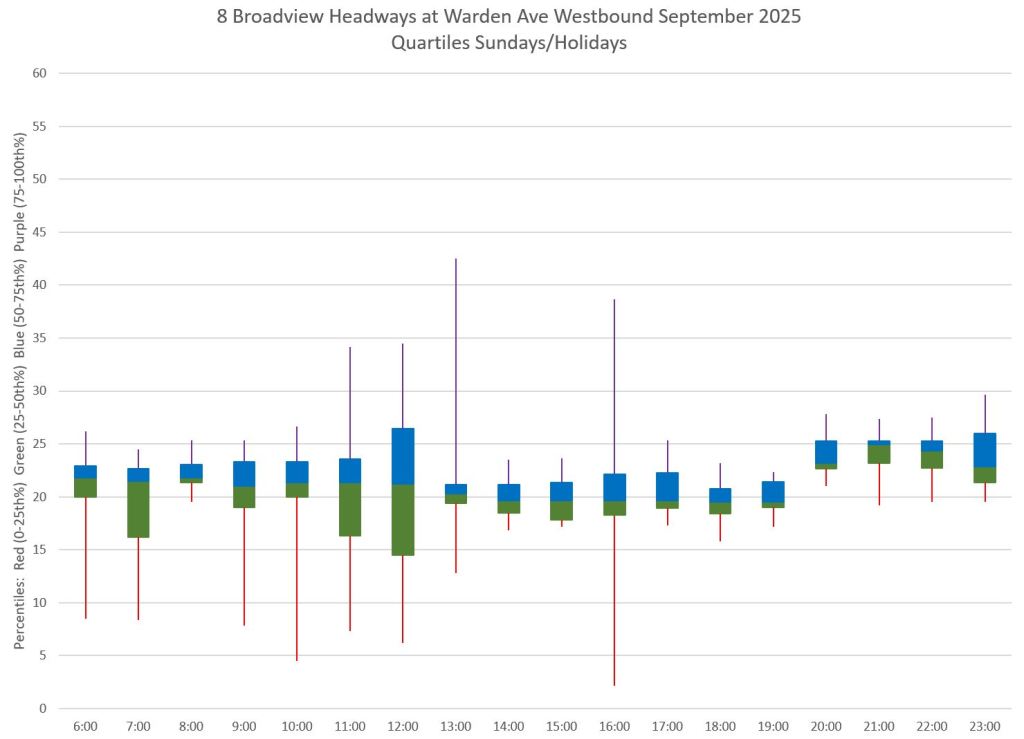
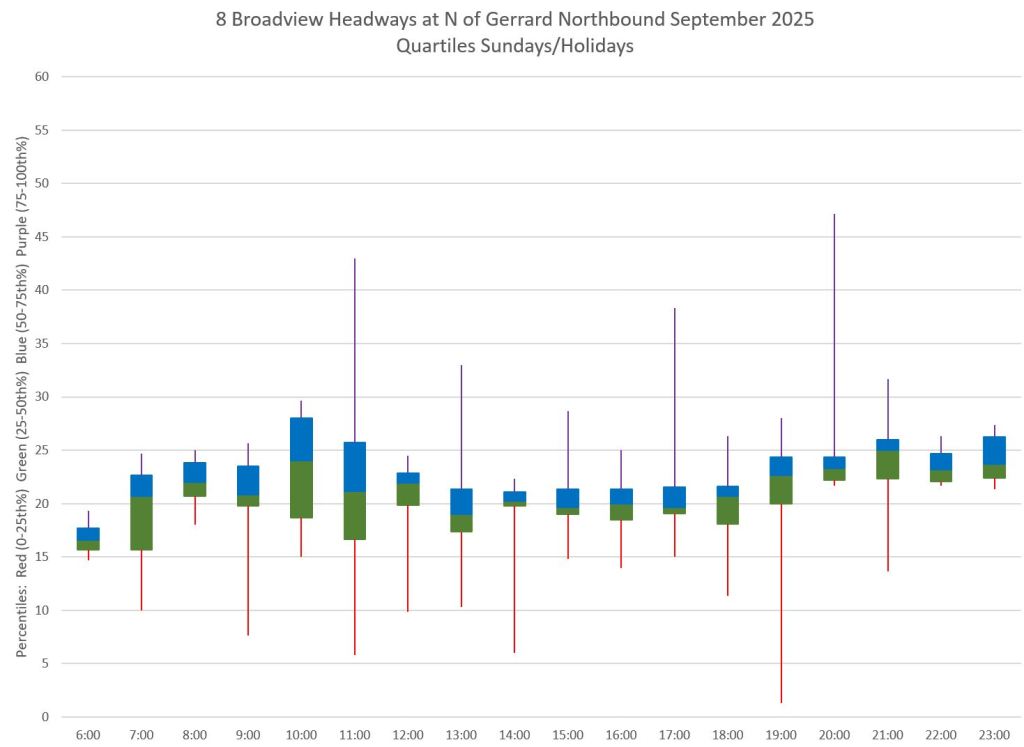
On the charts to the right, the median value is at the boundary between the 2nd and 3rd quartile at the 50th percentile. Where the tails of the quartiles are long stretching down to near zero and up well above the median, service includes a lot of bunching and wide gaps. Ideally, the central block (2nd and 3rd quartiles) should be small as should the tails should be short. This is seen for most daytime service during the month, but much less so at other times.
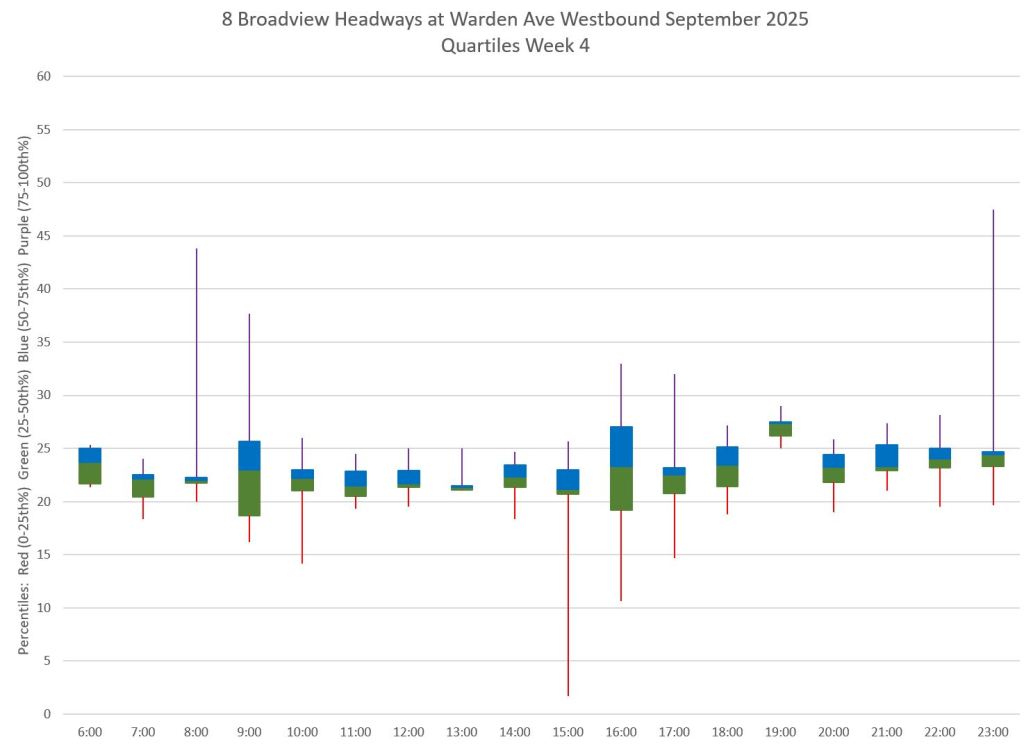
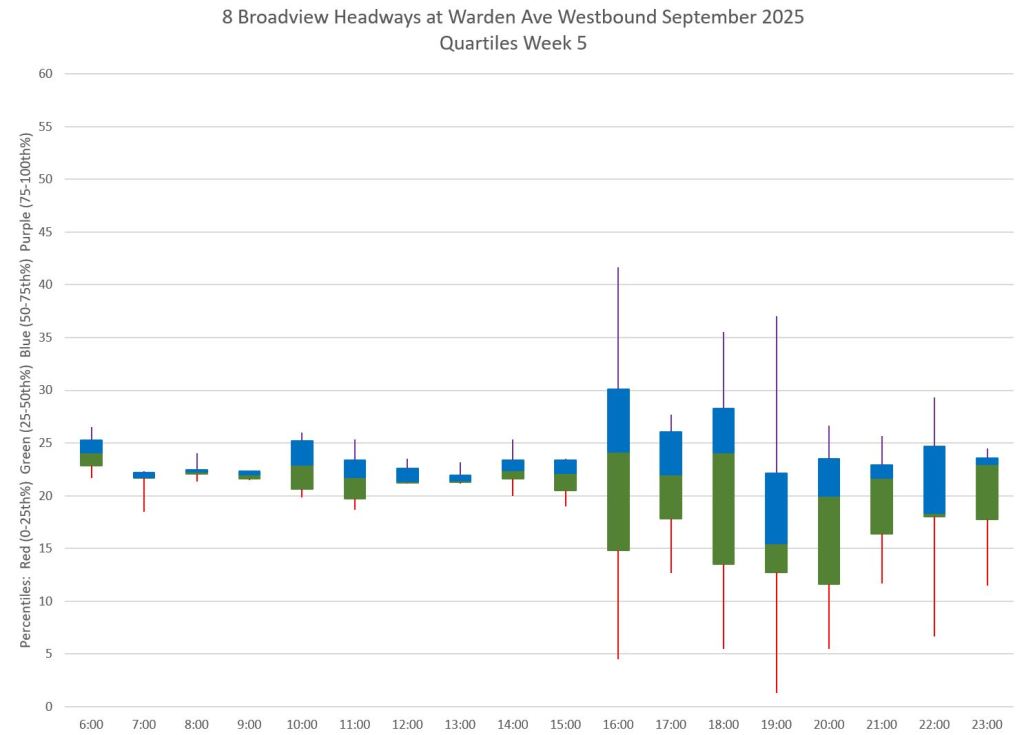
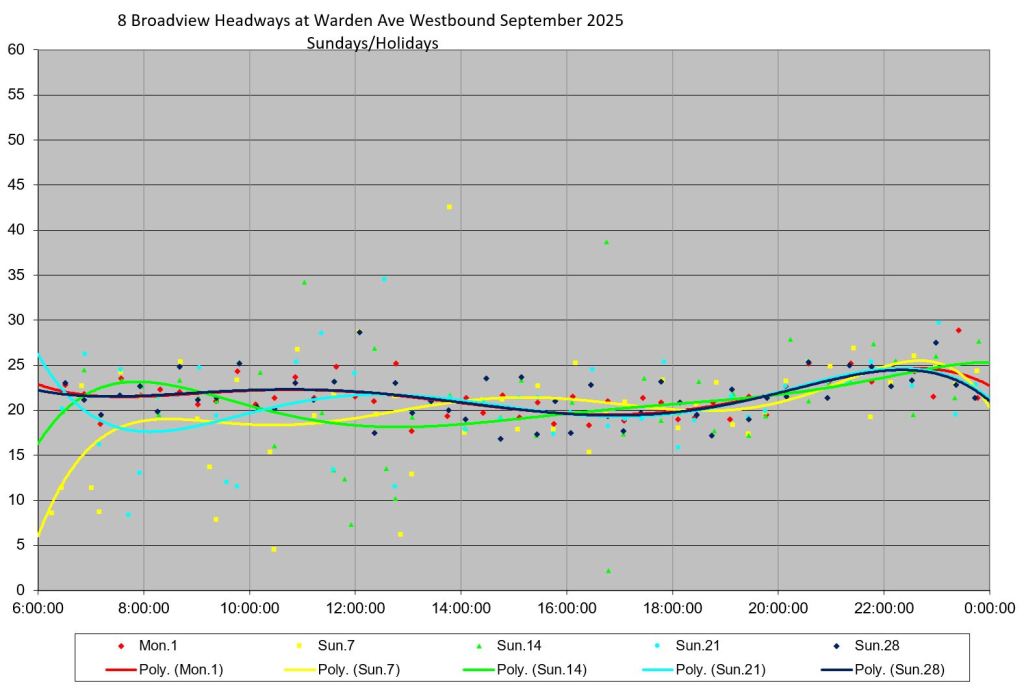
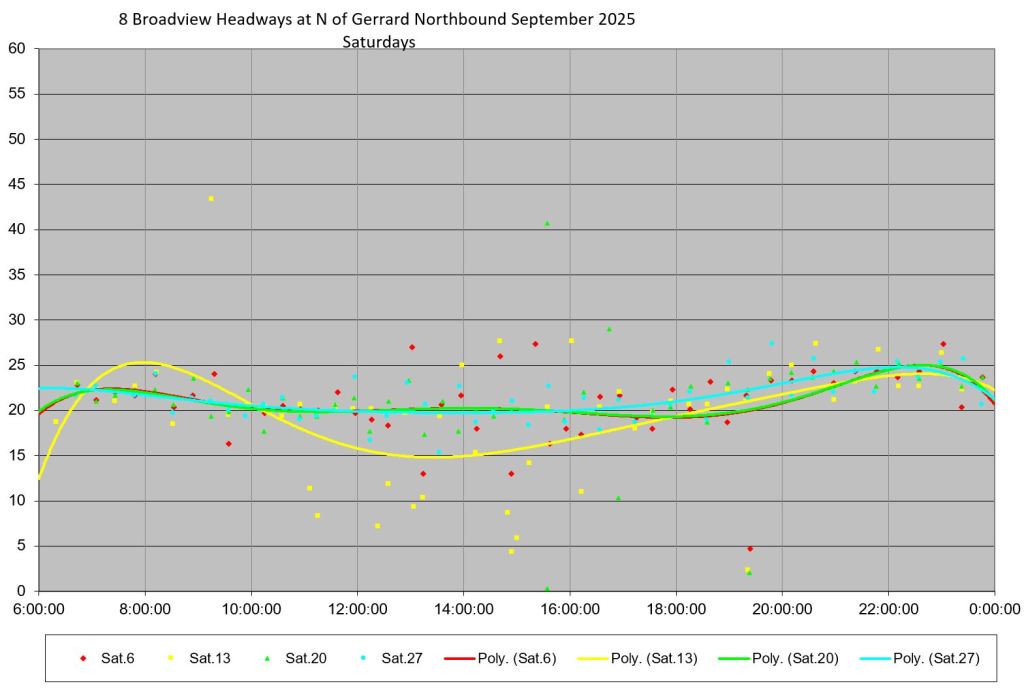
Weekend service shows a different pattern with somewhat more reliable service, but still with several headways well away from the target range.
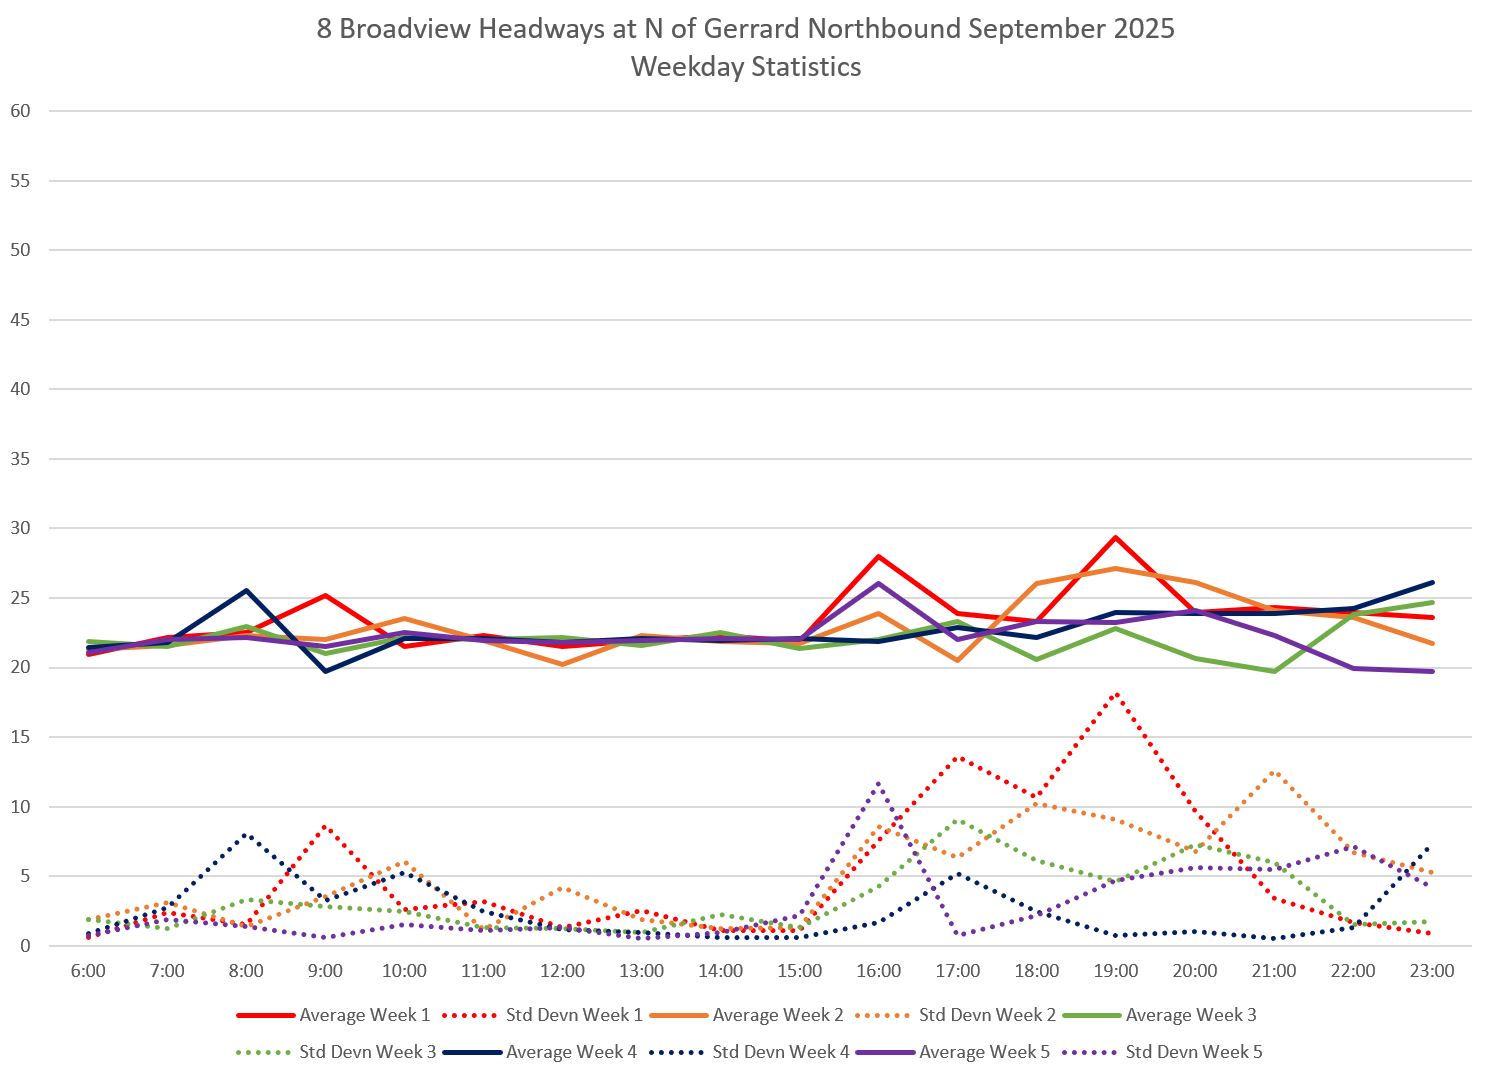
Northbound from Broadview & Gerrard
Service from Gerrard & Broadview (measured just north of Jack Layton Way) is similar to service at Warden. Weekday headways are particularly ragged in the evening.
The weekly summary shows very high standard deviation values in the evening, although this problem declined in week 4 and week 5 (which contains only Monday and Tuesday the 29th and 30th).
The week by week details showing the scatter of headways gives more detail to the range of headways riders encountered with double headways (over 45 minutes) common until week 4.
Weekend service was more reliable, but only in relative terms compared to weekdays.
The full sets of charts as PDFs are available here:
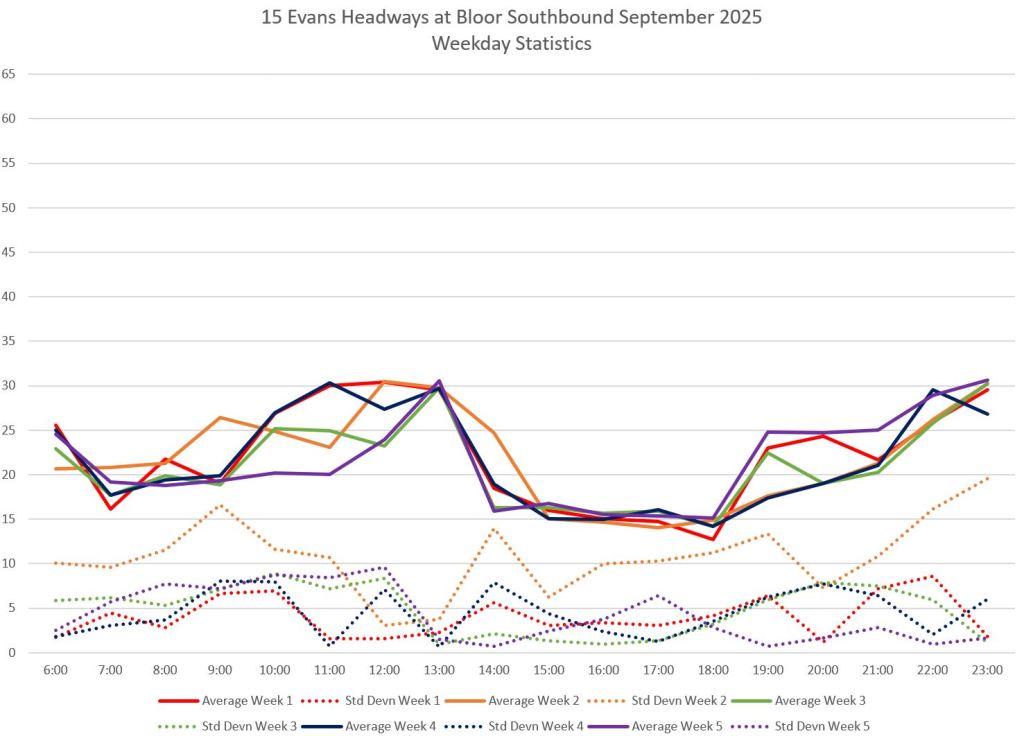
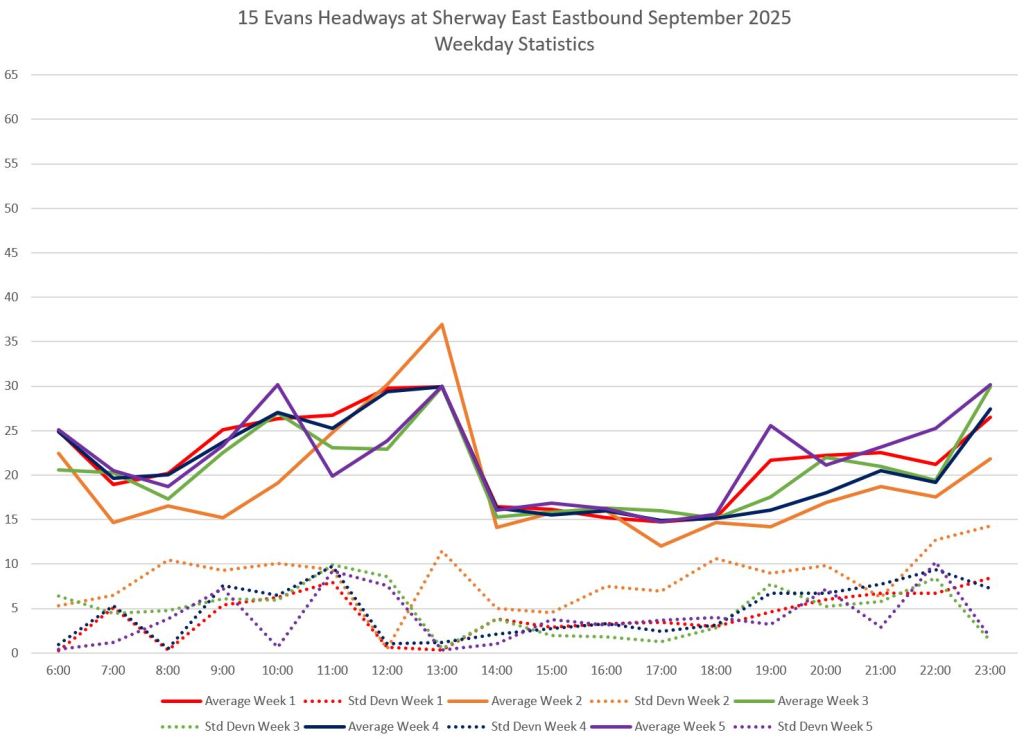
15 Evans
The 15 Evans bus runs between Royal York Station and Sherway Plaza generally on an infrequent headway.
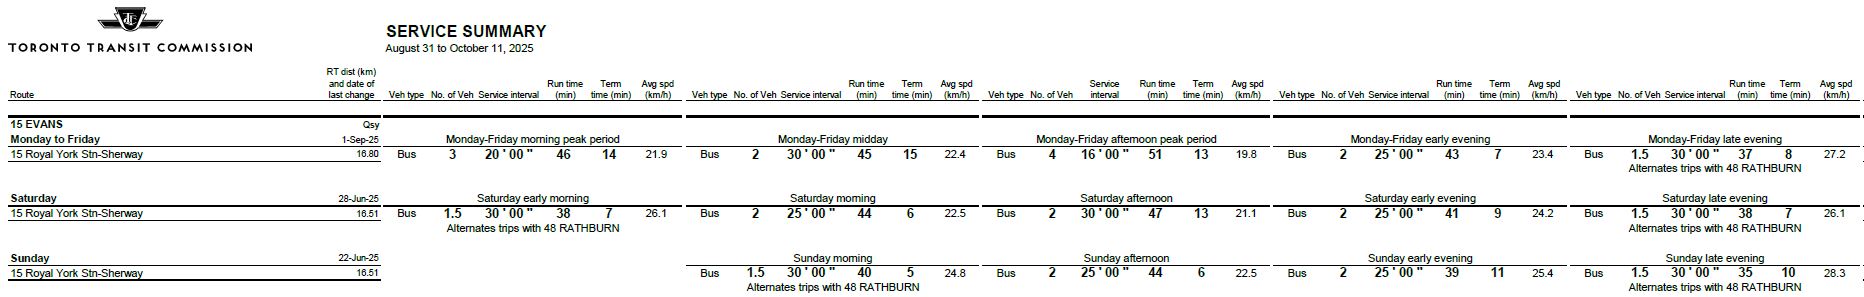
The weekday stats below show that the standard deviation values have a fairly wide range, and this shows that the service itself is erratic. If you review the detailed charts, you will see that the situation varies from week to week with some being particularly bad, notably week 2 (orange in the charts below) with a great deal of bunching and wide gaps. Weekends fare somewhat better.
The reason for a y-axis maximum of 65 minutes on these chart is that some days saw gaps of an hour or more. These were rare, but they show the effect whenever a bus is missing on a wide scheduled headway.
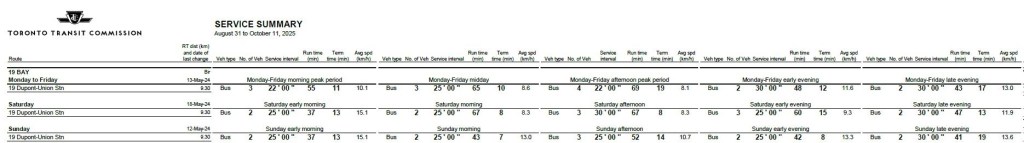
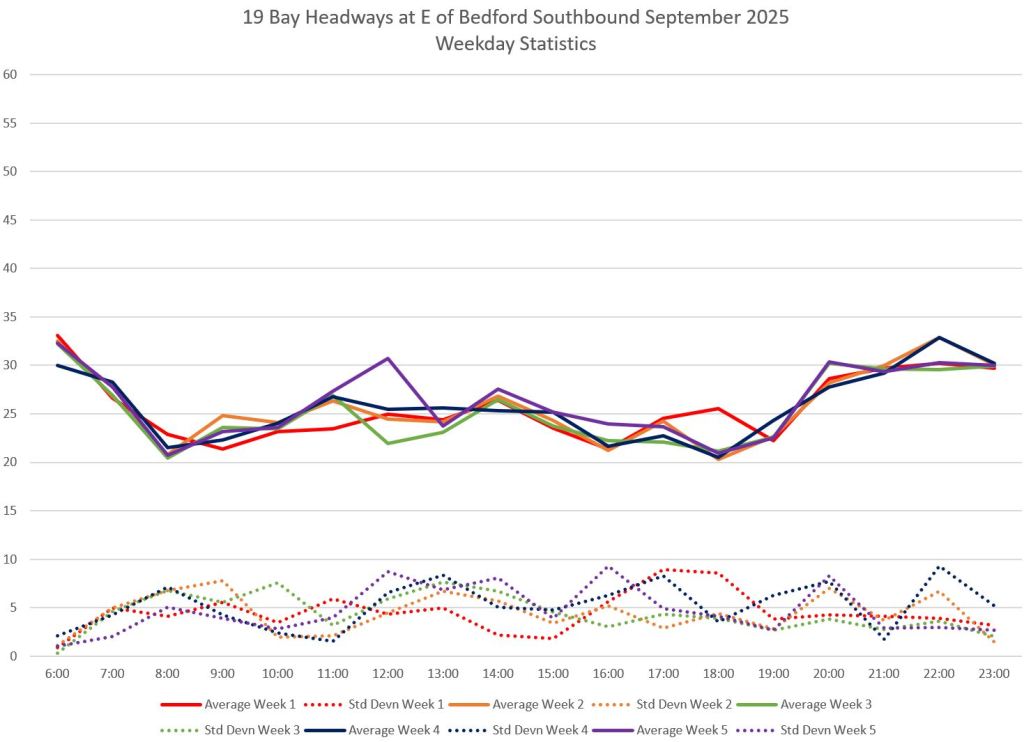
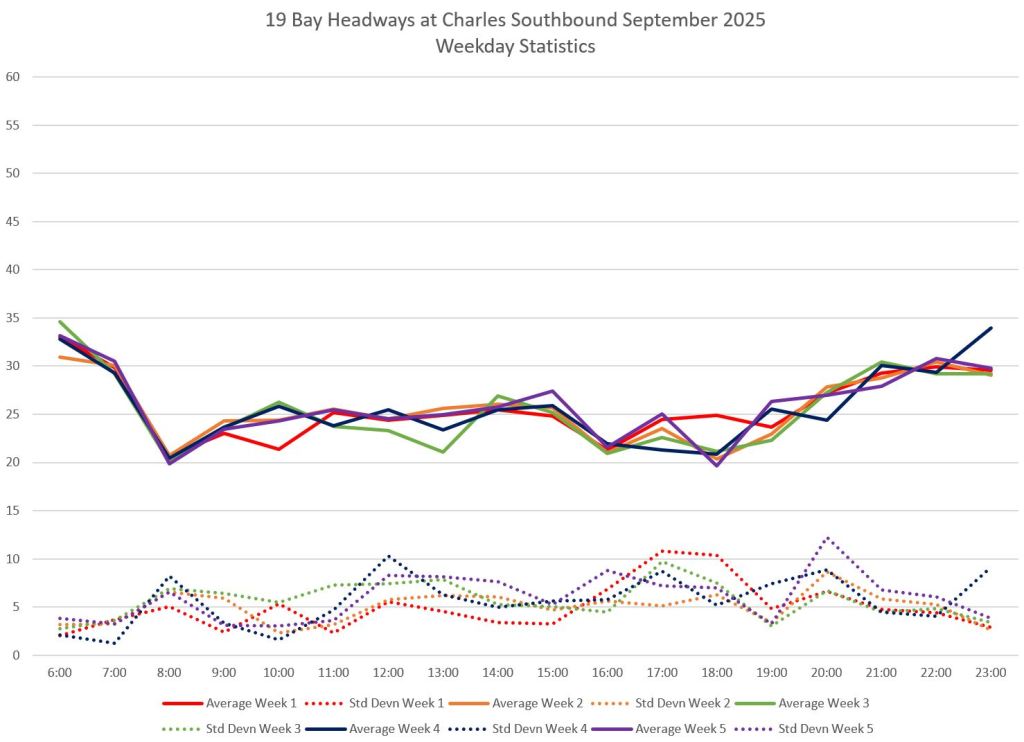
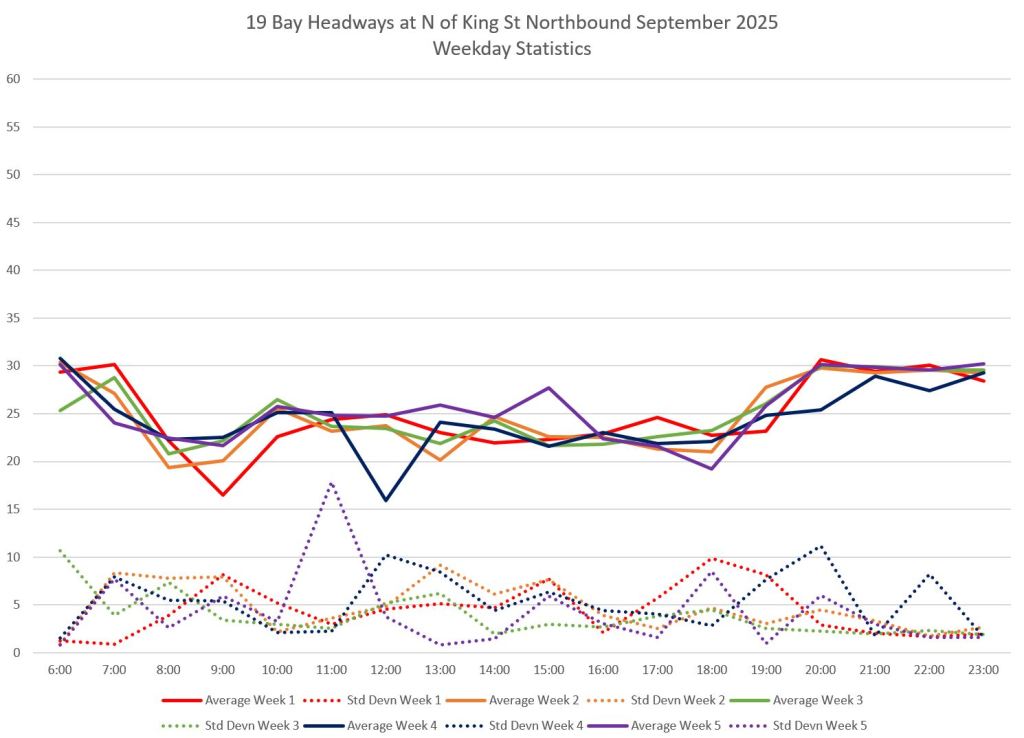
19 Bay
The 19 Bay bus operates from an on-street loop via Davenport, Dupont and Bedford at the north south via Davenport and Bay to Union Station looping via King, Yonge and Front. Service on this once-major route is “best” in the peak periods at 22 miutes, and 25-30 minutes at other times.
The screenlines used here are at Davenport east of Bedford on the northern loop, and on Bay north of King on the southern loop.
The standard deviation in headways lies mainly in the 5-10 minute range indicating a range of actual headways that provide even less reliable service than the schedule indicates. Weekend service suffer both from bunching and missing buses producing some very wide gaps.
Also included here are charts for southbound service at Charles Street, one block south of Bloor. 19 Bay is a route where, at times, operators will hold from scheduled departures from Bloor. This is fairly reliably observed in the AM peak, but less so as the day goes on as the gradual rise in standard deviation values shows.
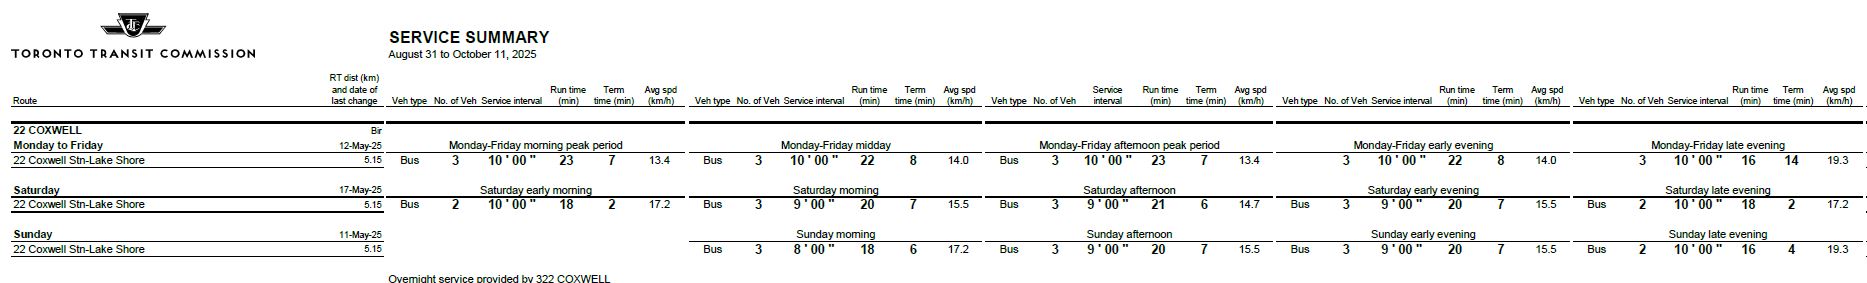
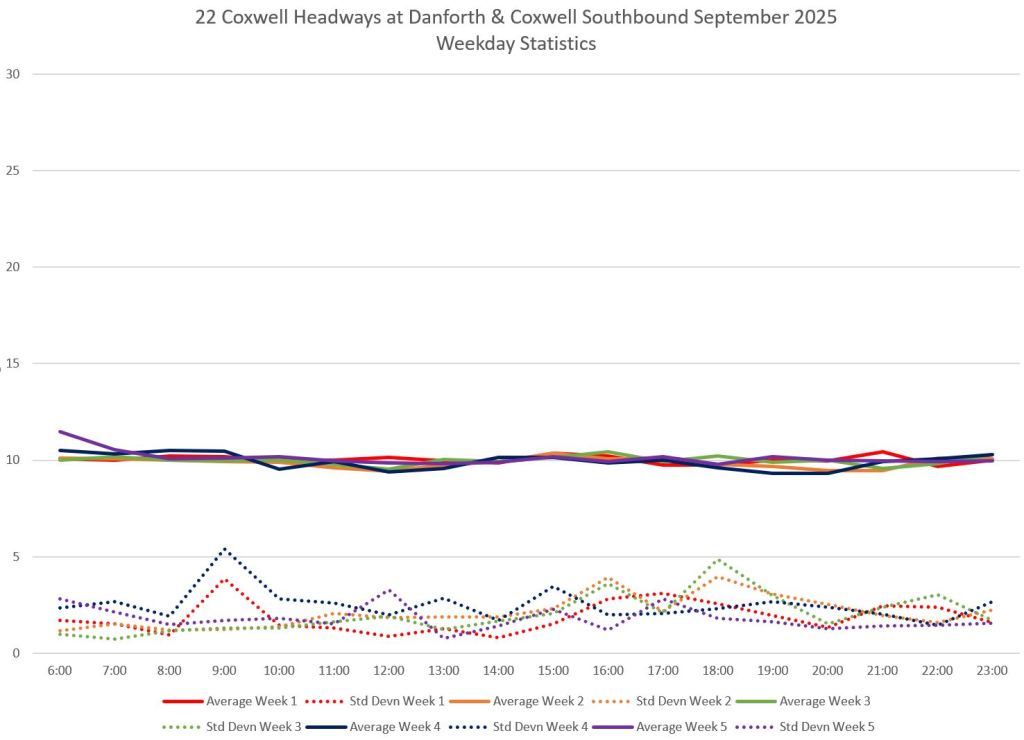
22 Coxwell
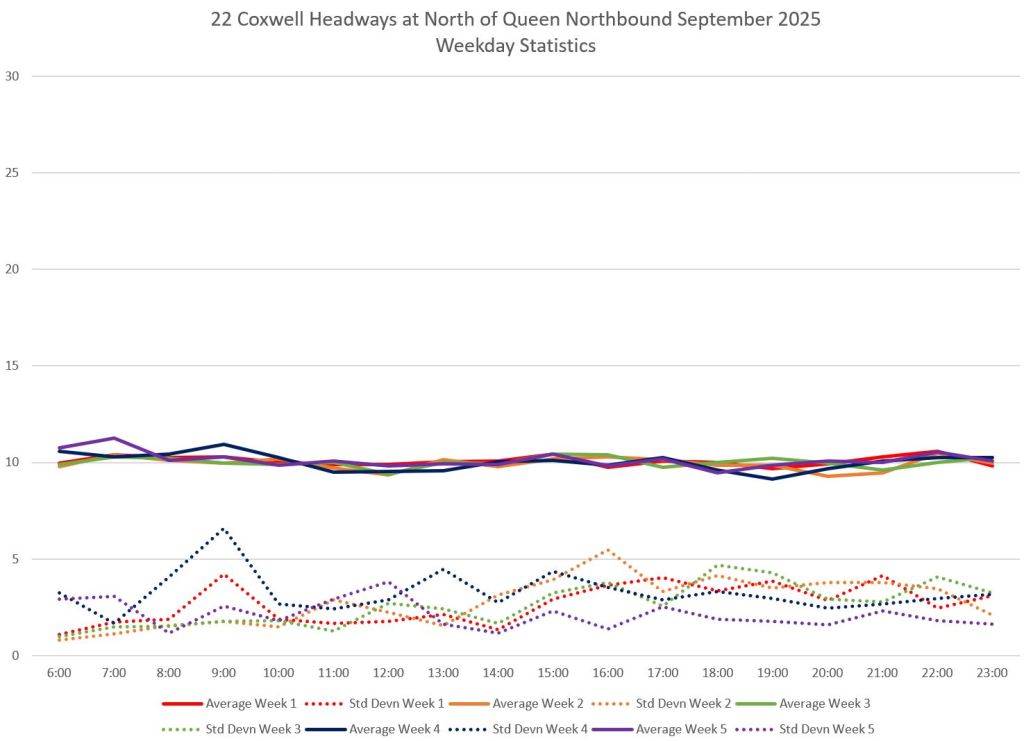
The 22 Coxwell bus operates from Coxwell Station south to Queen looping via Queen, Eastern Avenue and Emdaabiimok Avenue (formerly known as Coxwell south of Queen). This route is part of the 10 minute network with headways of 9-10 minutes, except when extra service is operated for extra demand to The Beach, as on Labour Day.
The standard deviation in weekday headways leaving Coxwell Station is low mot of the time showing fairly well-behaved service. Northbound at Queen service is slightly more erratic, but the SD stays under 5 minutes most of the time.
Weekend service is less disciplined, especially on Saturdays, when wide gaps and matching short headways show that bunching is a problem. (If there were only gaps, this would indicate missing buses.)
23 Dawes
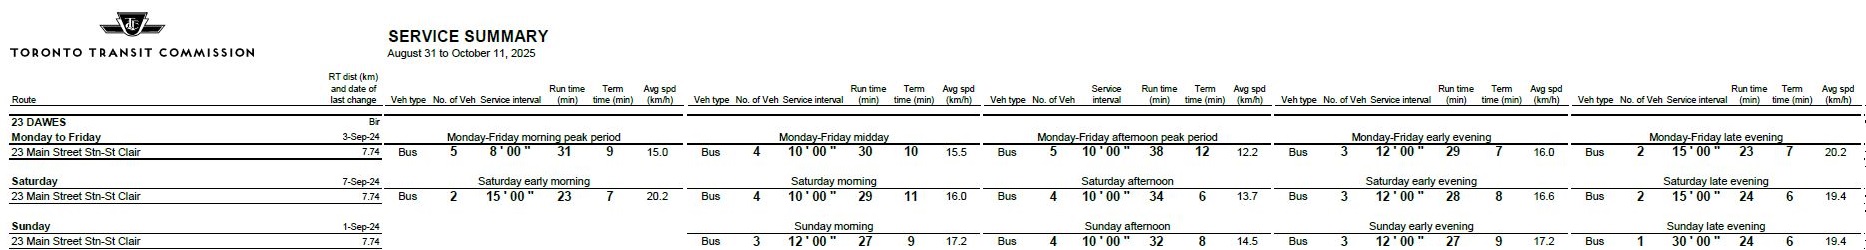
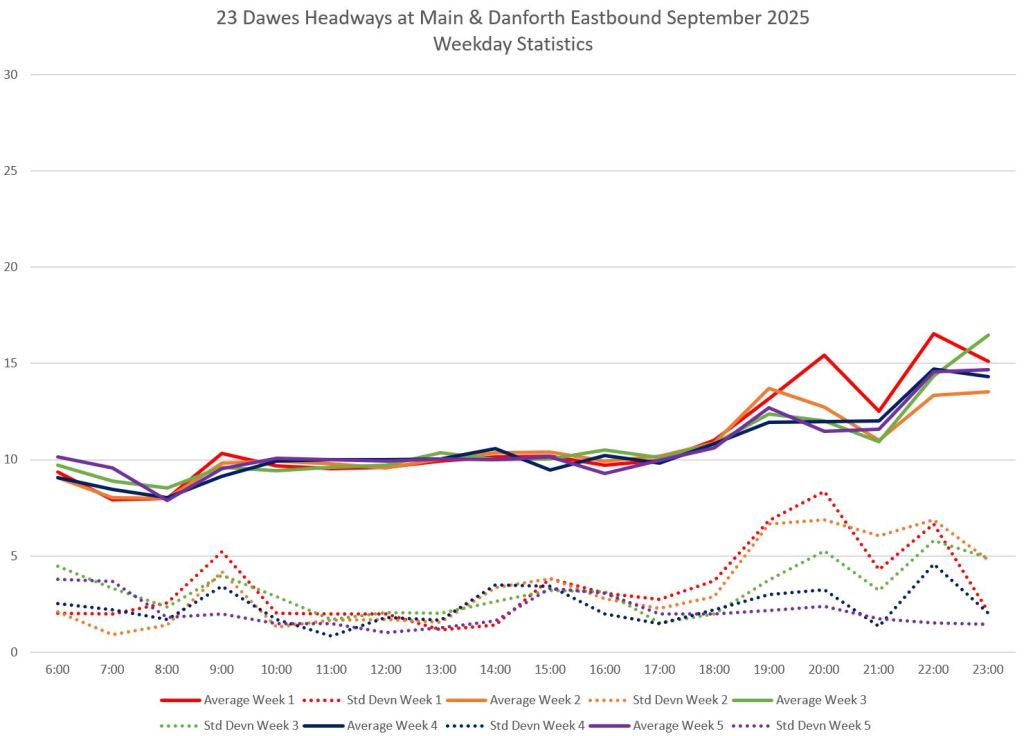
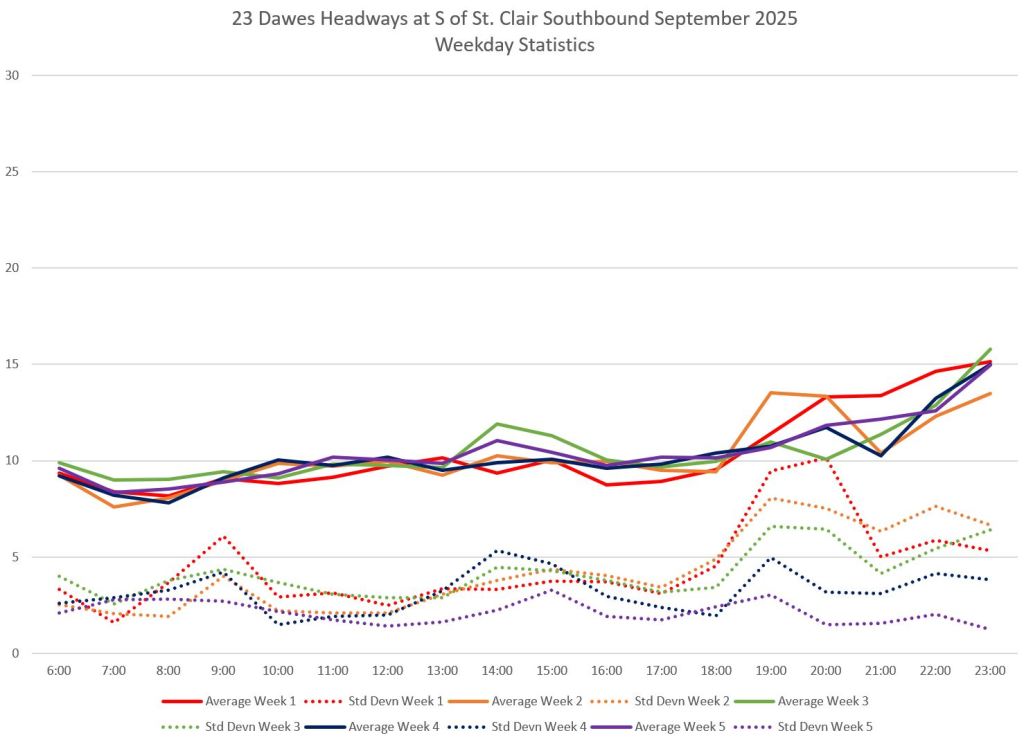
The 23 Dawes bus operates from Main Street Station east along Danforth to Dawes Road and then northeast to Victoria Park & St. Clair. Headways lie in the range from 8 to 12 minutes during most periods.
The standard deviation values eastbound from Main Station are low for much of the weekday, moreso at Main Street Station than at St. Clair, but evening values are extremely high. The detailed charts show that there is much gapping and bunching.
Weekend service on Saturdays is quite irregular, and on September 20, one bus of four was missing from roughly 8am to 8pm. No attempt was made to rebalance service, and the gap where that bus should have been travelled over the route all day. (There was also one of two buses missing from 6 to 7am.) The service chart for September 20 is linked below to illustrate how the route actually operated.
26 Dupont
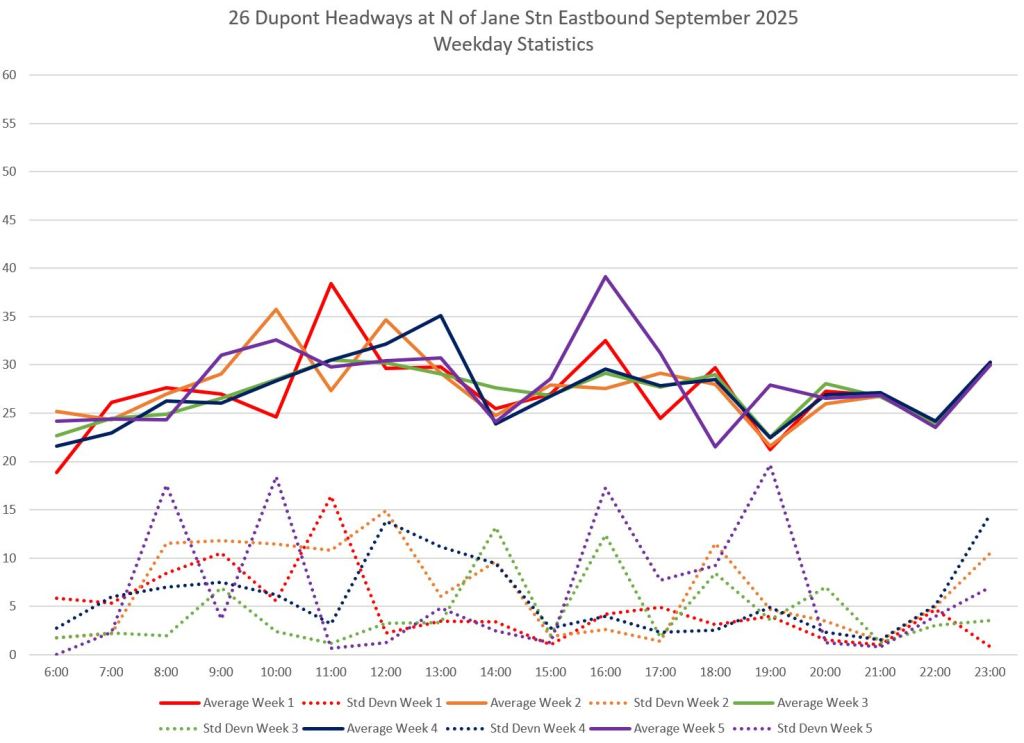
The 26 Dupont bus, like 19 Bay, was once a very frequent route serving the industrial area along Dupont Street. The route begins at St. George Station, travels north on Bedford to Davenport, then west via Davenport, Dupont and Annette to Jane, and finally south to Jane Station.
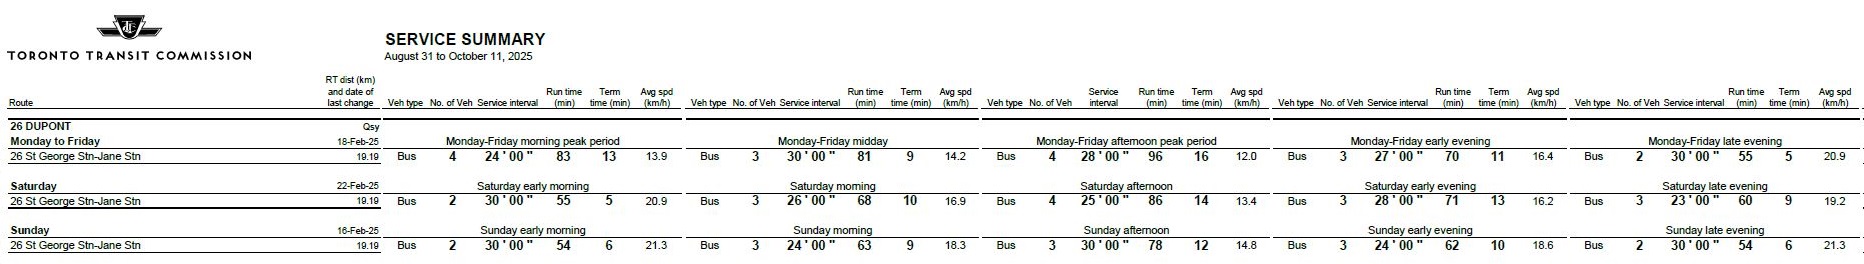
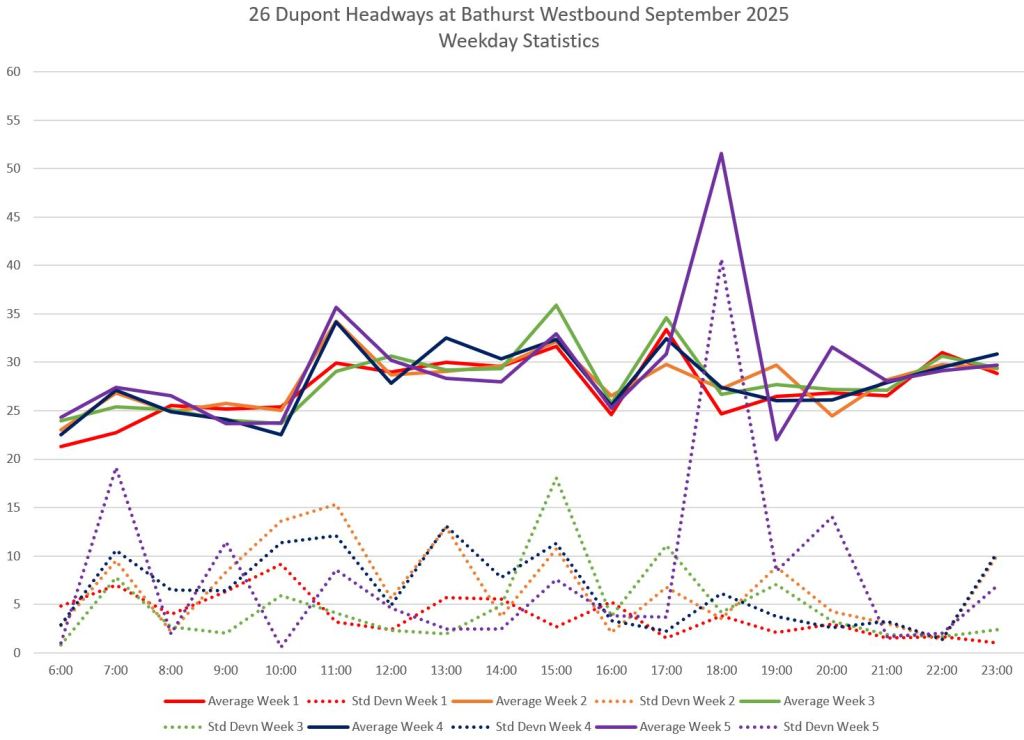
During the latter part of September, construction on Bedford Street required a change in the loop routing at St. George Station. The westbound service is shown at Bathurst Street to be clear of the diversion’s effects.
Standard deviation values for this route are often at 15 minutes or more showing extremely unreliable service. Headways between 45 and 60 minutes are not uncommon on weekdays and weekends.
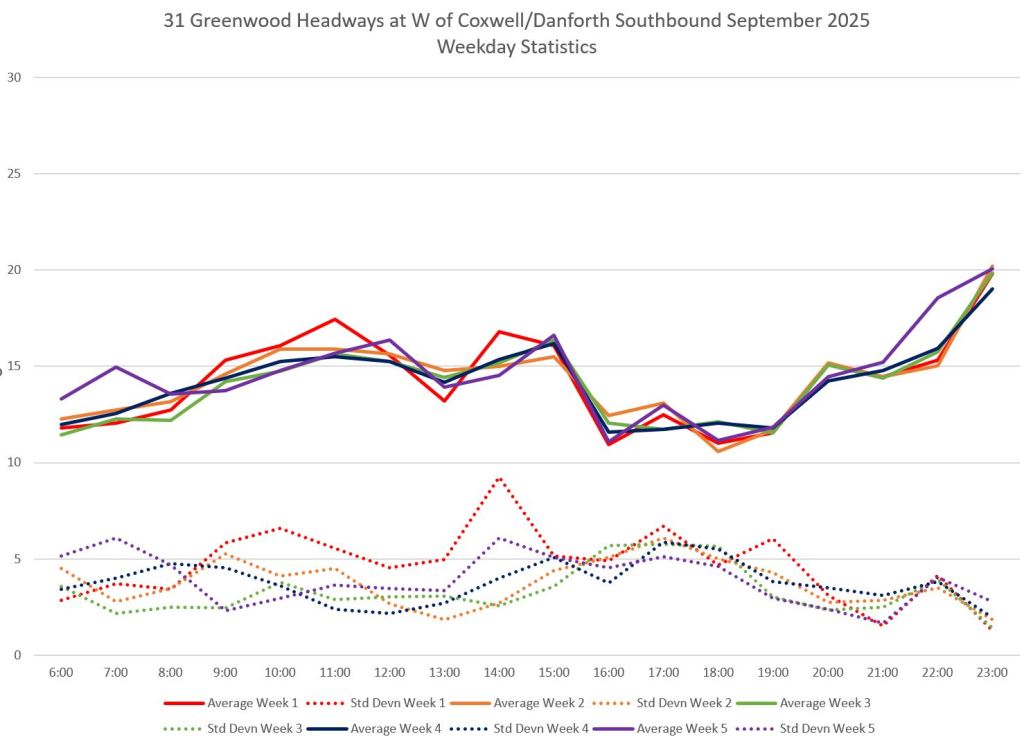
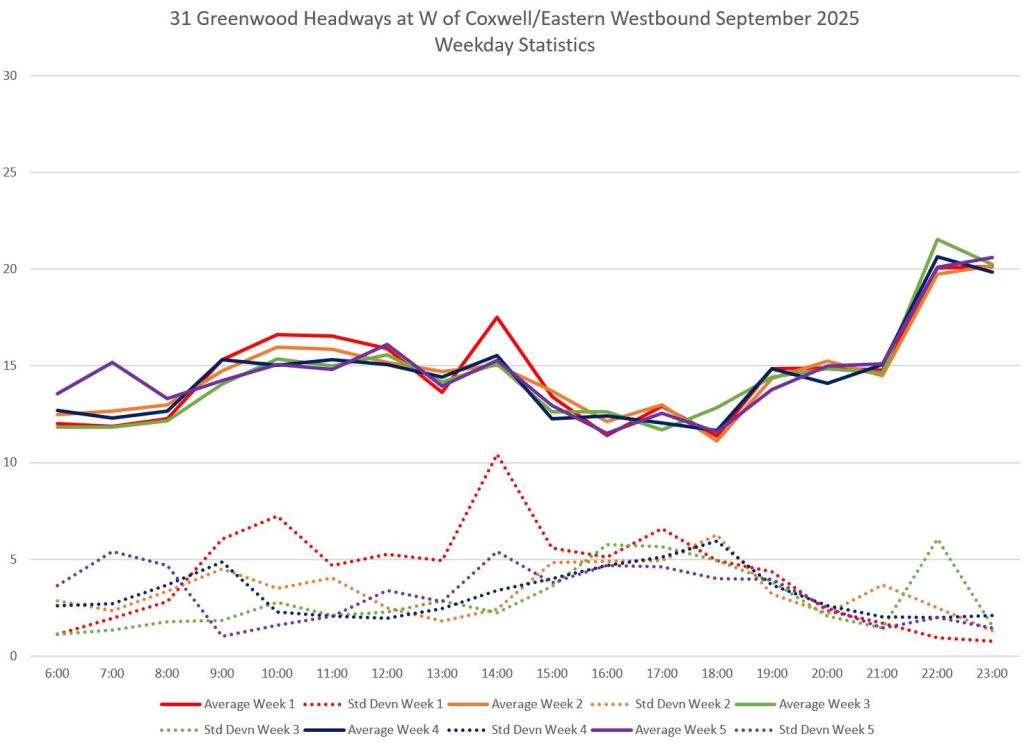
31 Greenwood
The 31 Greenwood bus is an oddly shaped route which runs from Coxwell Station to Queen and Eastern sharing the same south end loop as 22 Coxwell. Because of elevator construction at Greenwood Station, the route has been on a long-term diversion at Coxwell Station. The full route is via Coxwell, Danforth, Greenwood, Queen, Leslie, Eastern, Emdaabiimok (formerly Coxwell south) and Queen to Eastern/Kingston Road.
Service is every 15 minutes or better except in late evenings.
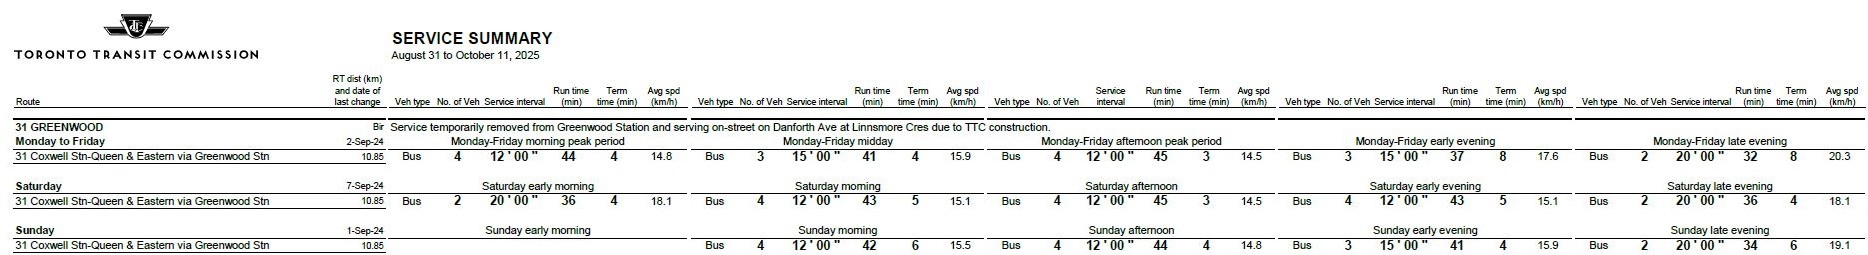
The screenlines for these measurements are west of Coxwell on Danforth and on Eastern for the northern and southern terminals respectively.
The standard deviations in weekday headways lie in the 3-5 minute range which is beyond the level where headways stay mostly in the six minute Service Standards window. Week 1 shows particularly high values because of two factors on the same day, Friday, September 5. Note that although the SD value for this week rises, the average headways stay close to the values for other weeks. All of the scheduled trips operate keeping the average headways expected, but the individual values are more widely scattered.
From 10am to noon, one bus sat out of service at Coxwell Station. Later, from 2pm to 7pm, two buses ran as a pack, occasionally joined by a third producing wide gaps and bunching. Although this is one of the worse examples, headways are generally unreliable during most periods including weekends.
- Southbound from Coxwell/Danforth
- Northbound from Coxwell/Eastern
- Service chart for Friday, September 5
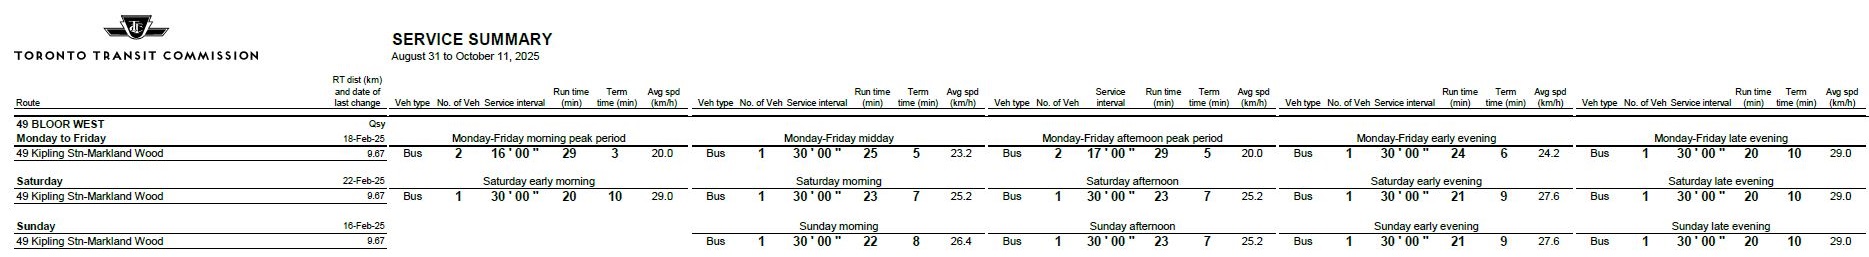
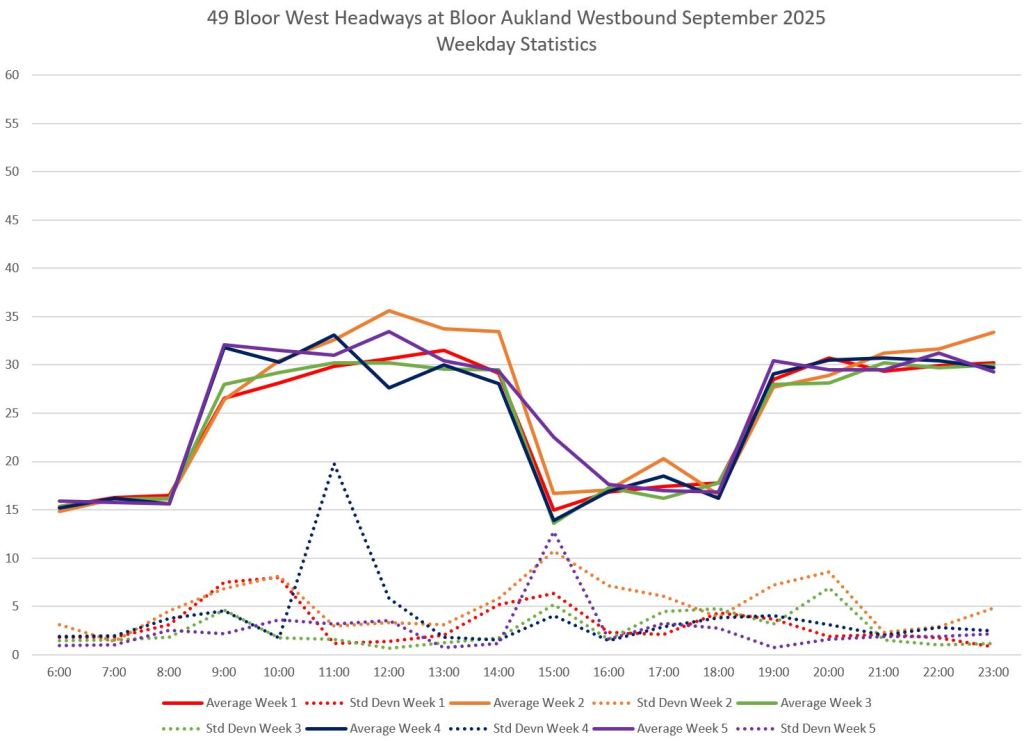
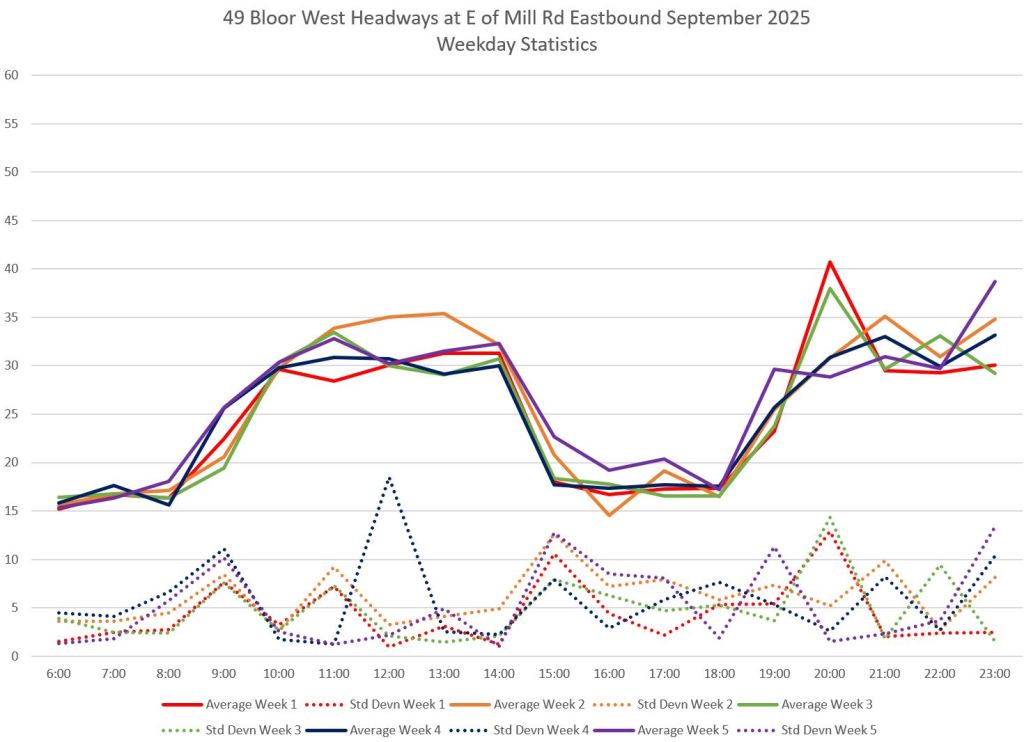
49 Bloor West
The 49 Bloor West bus runs from Kipling Station north via Aukland Road to Bloor and then west to Markland Drive, looping via Mill Road.
Service is half-hourly during all periods except the weekday peaks. The standard deviation values show that headways can vary quite a bit from their target range. Service is more regular westbound from Kipling Station than eastbound from Mill Road.
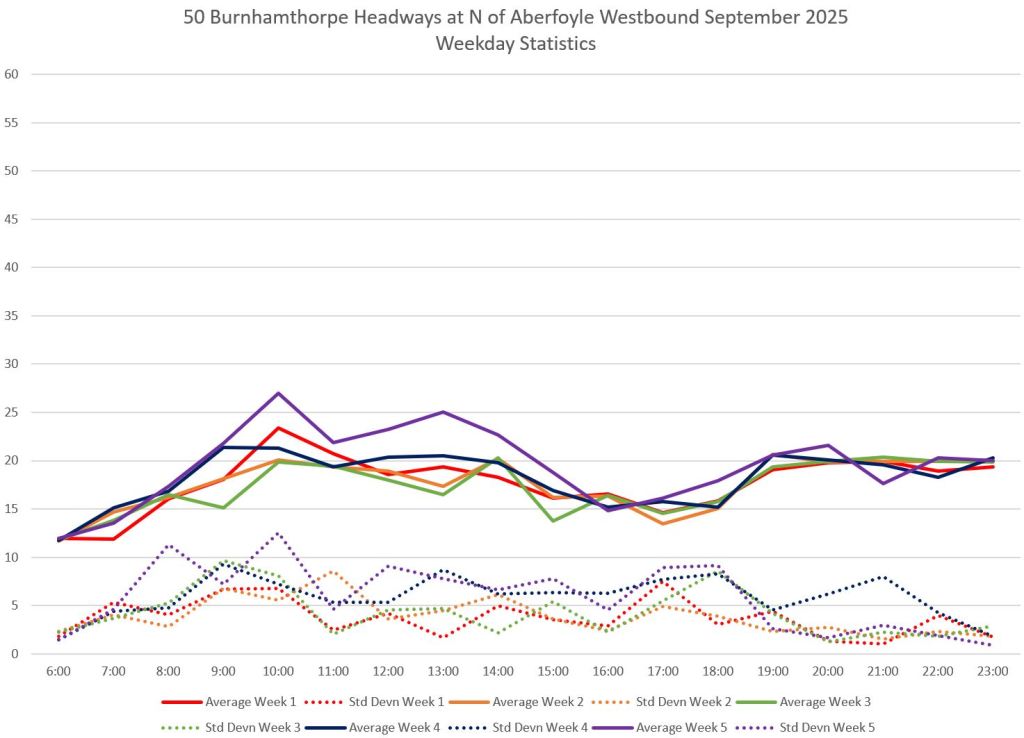
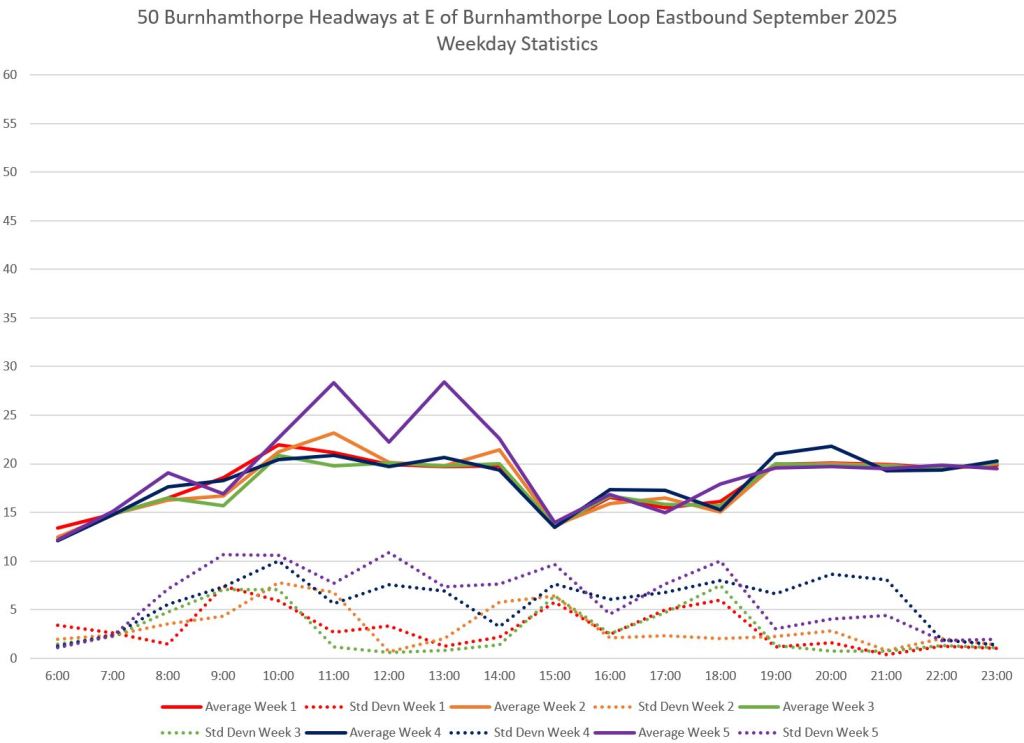
50 Burnhamthorpe
The 50 Burnhamthorpe bus runs from Islington Station north and west via Burnhamthorpe to a loop at Mill Road. Service varies from 12-20 minute headways over the course of the day.
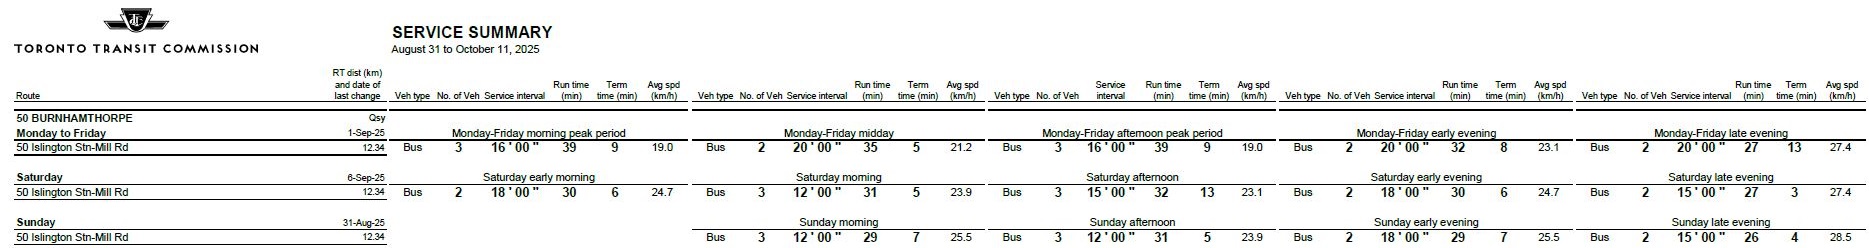
The standard deviations in headways are often above 5 minutes, particularly late in the month. This is generally due to buses operating off schedule, sometimes in pairs, not to missing service nor to traffic congestion. The service chart for September 25 is linked below as an example.
The screenlines are on Islington north of Aberfoyle (just north of the station), and just east of the loop at Mill Road.
- Westbound North of Aberfoyle
- Eastbound at Burnhamthorpe Loop
- Service chart for Thursday, September 25
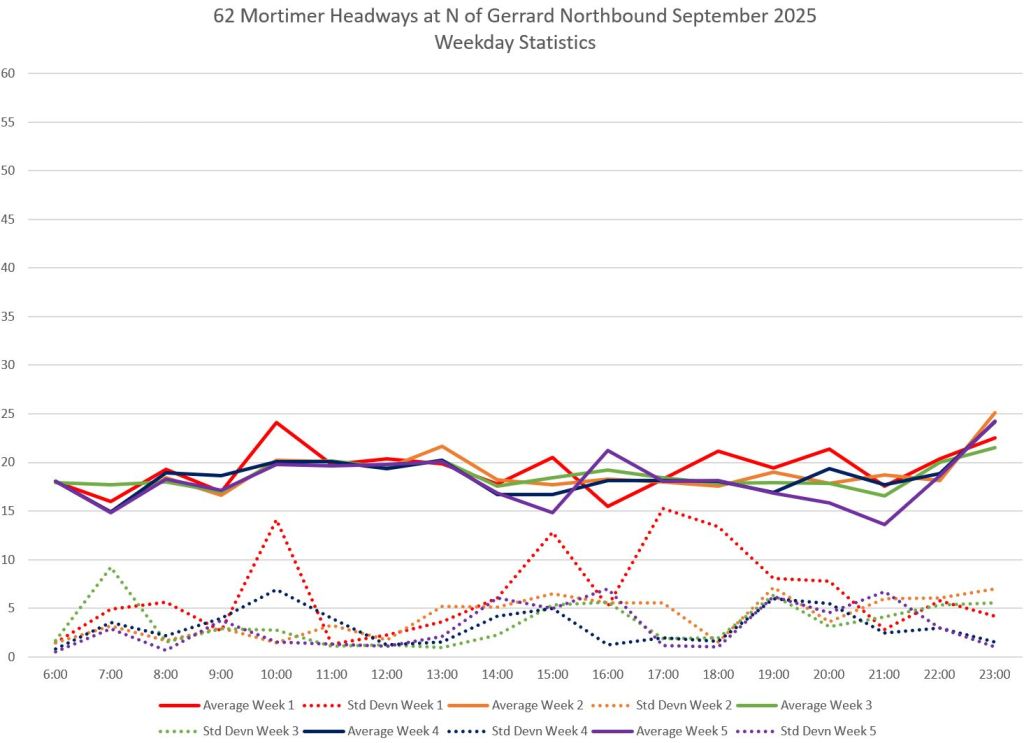
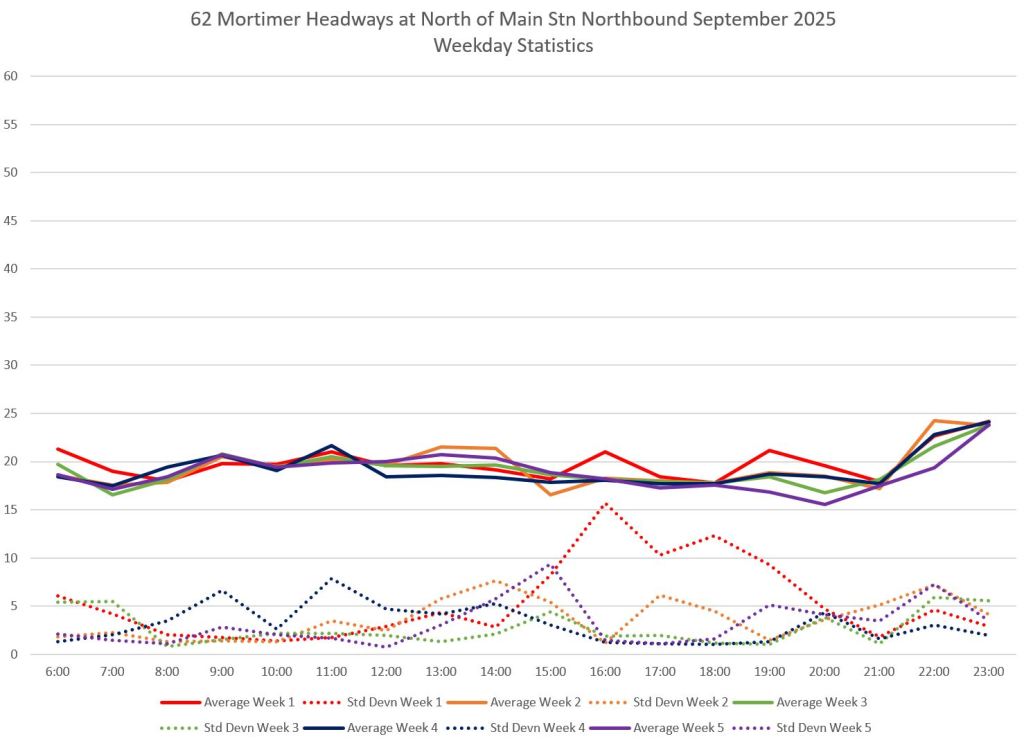
62 Mortimer
The 62 Mortimer bus normally operates between Broadview and Main Street Stations, but is extended at the west end to Broadview & Gerrard to free up space in Broadview Station for the 25/925 Don Mills service that is temporarily displaced from Pape Station during Ontario Line construction. Service operates every 18-20 minutes during most periods.
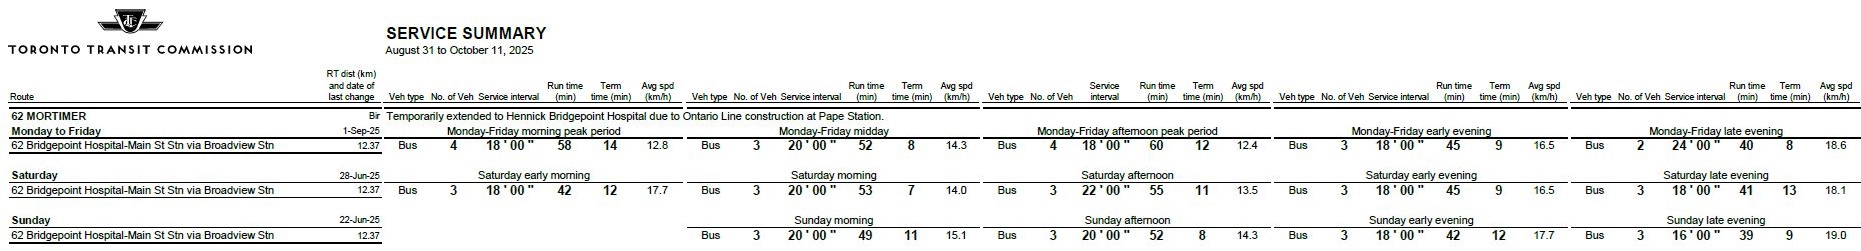
Service is fairly reliable with low weekday standard deviations in headways except for a few specific periods, notably in week 1. Weekend service shows only a few cases of extended headways.
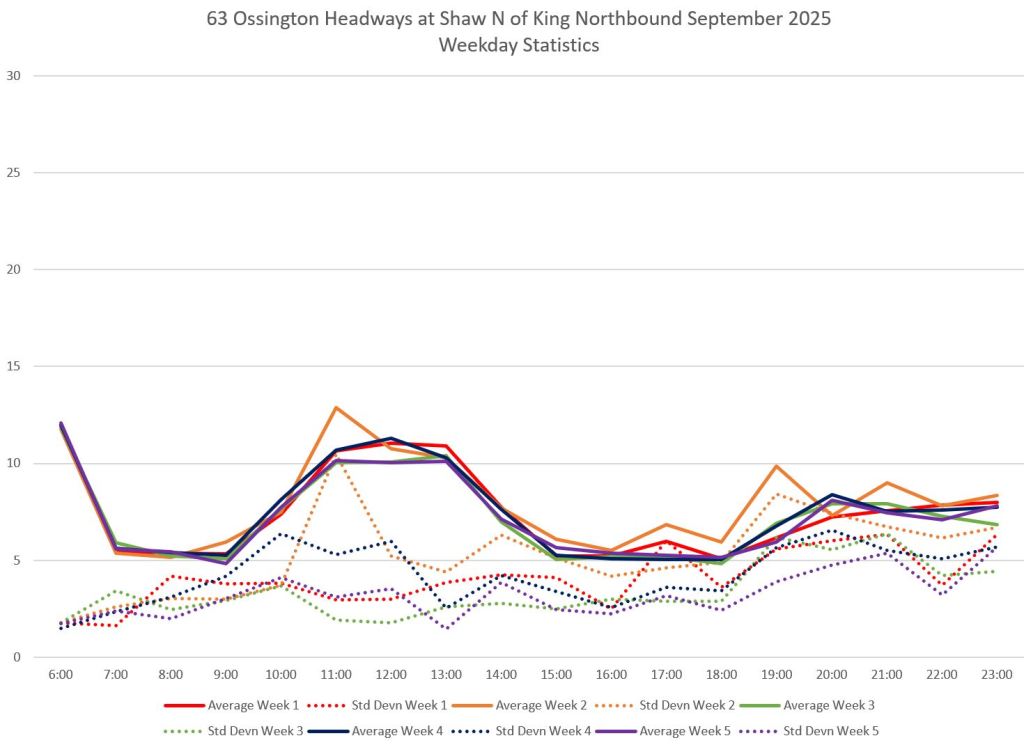
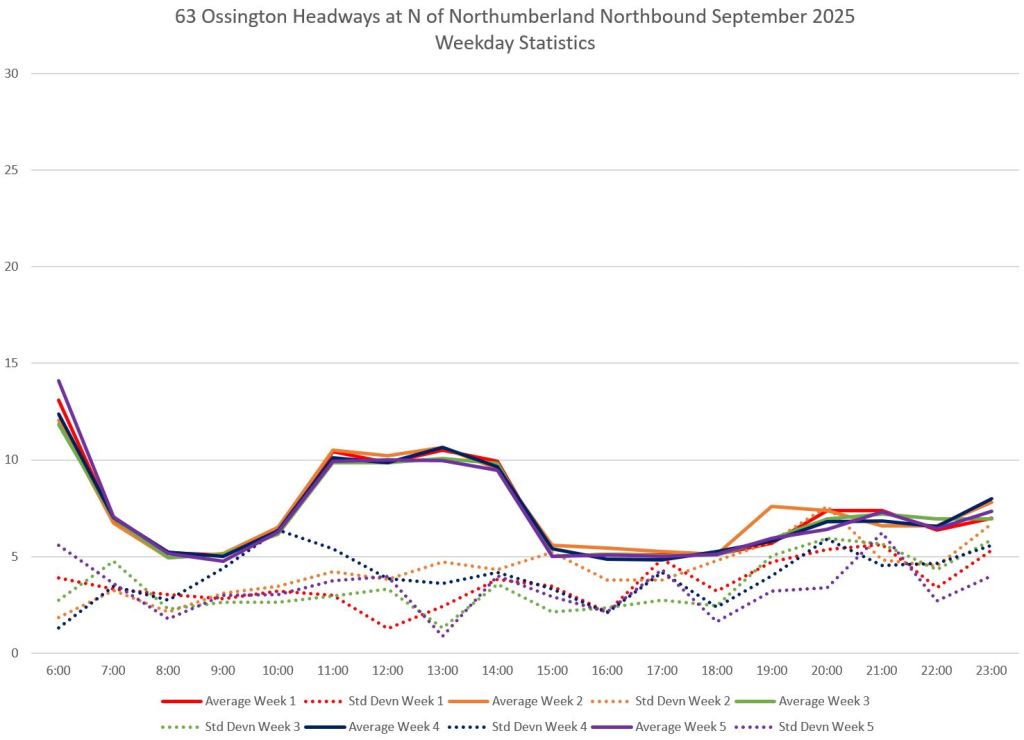
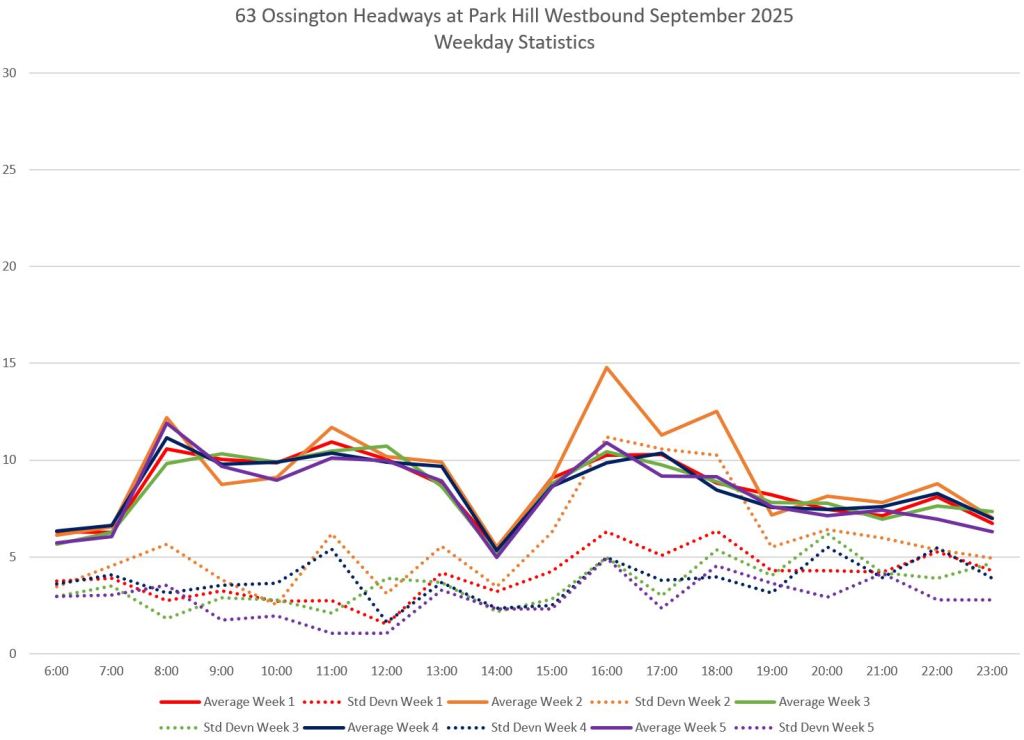
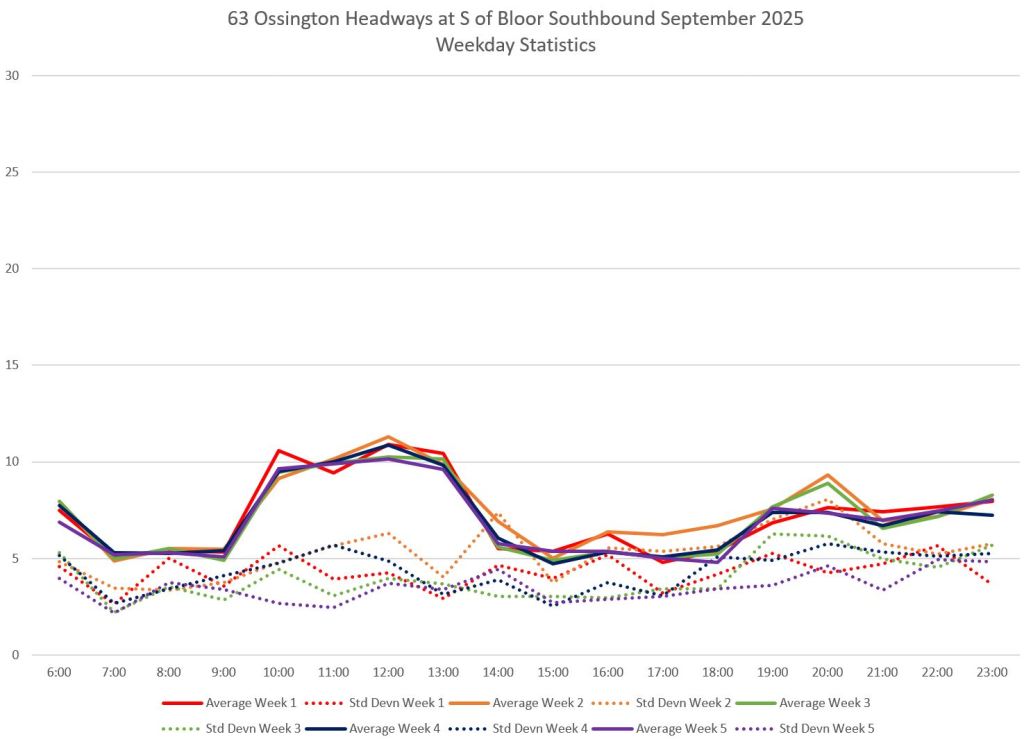
63 Ossington
The 63 Ossington bus operates from Eglinton Station to Liberty Village via Eglinton, Oakwood, Davenport, Ossington, King, Strachan and East Liberty. The return route via Liberty, Atlantic and King rejoins the main route at Shaw.
Service is every 10 minutes or better at all times. During weekday peaks, half of the service short turns northbound at St. Clair via Oakwood Loop. The route serves Ossington Station via an off-street loop in both directions providing a mid-route opportunity to restore even spacing of vehicles without blocking traffic.
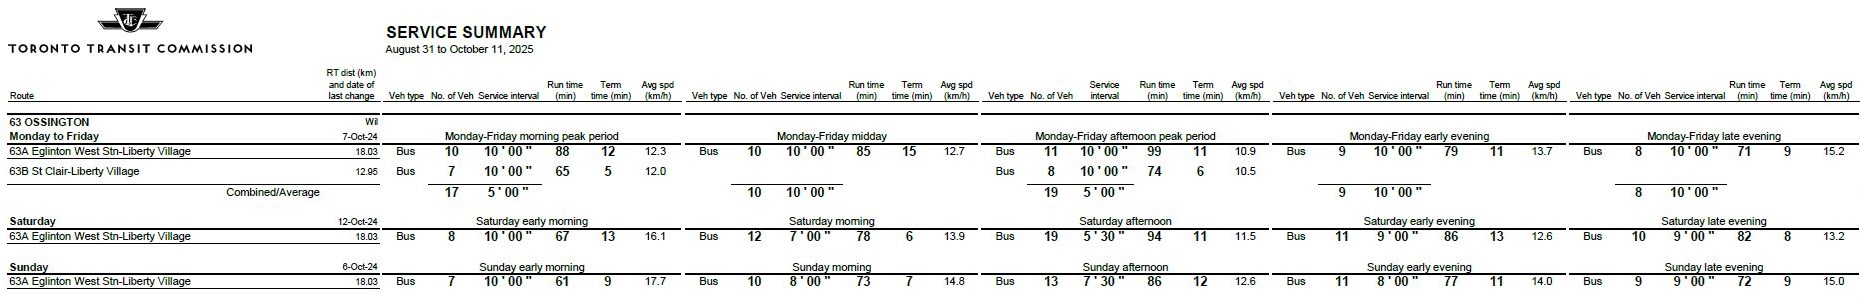
63 Ossington is a fairly frequent service, and the average headway on weekday evenings is typically 8 minutes, better than the scheduled 10 suggesting that some extra service is regularly provided. However, the standard deviation values creep close to the averages indicating that there is a lot of bunched service with corresponding gaps of 20 minutes or more.
Congestion west of Eglinton West Station affected the route although mainly in the early weeks of September. Service charts from September 9 and 23 are linked below as examples of route behaviour.
- Northbound on Shaw north of King
- Northbound from Ossington Station
- Southbound on Eglinton west of Eglinton W Station
- Southbound from Ossington Station
- Service chart for Tuesday, September 9
- Service chart for Tuesday, September 23
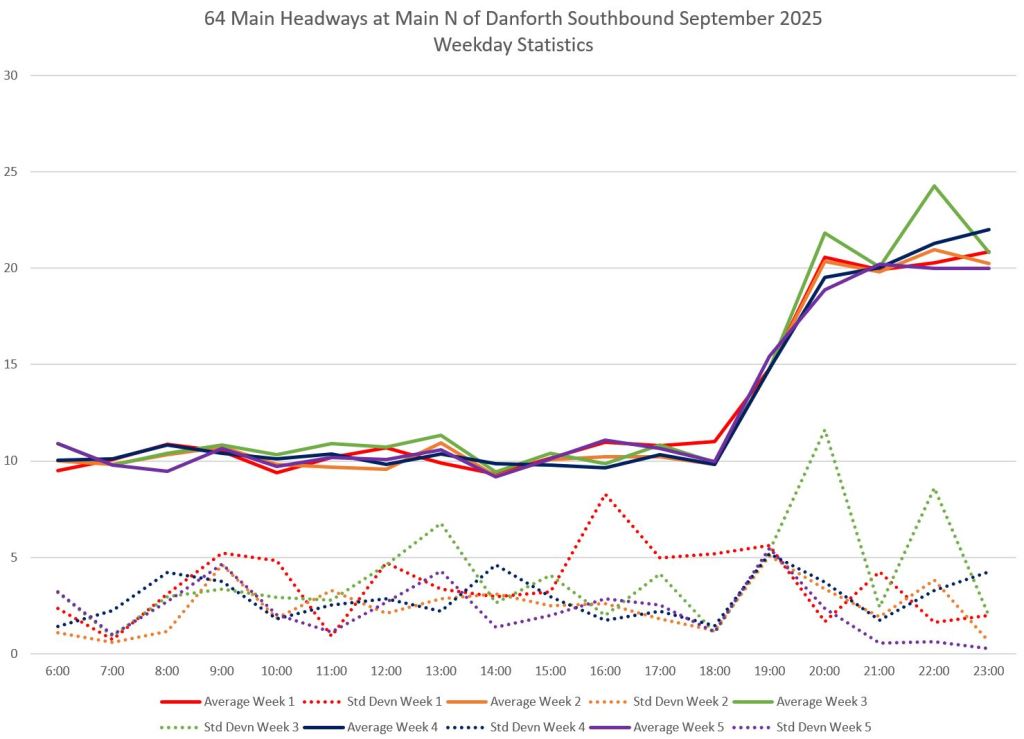
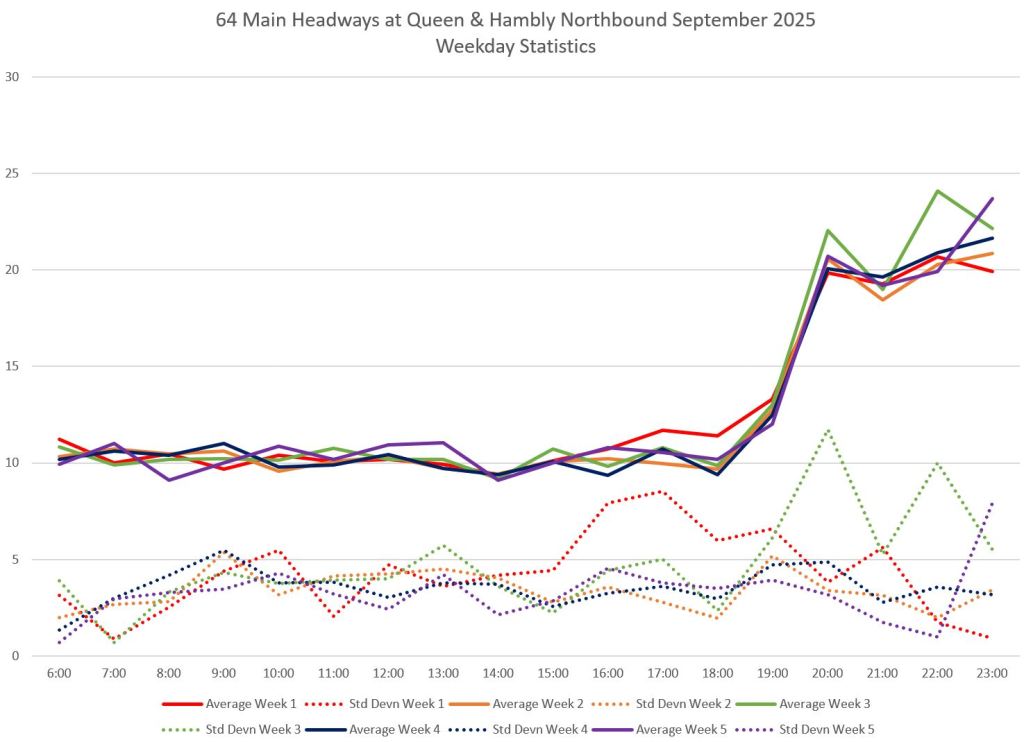
64 Main
The 64 Main is an extremely short route running from Main Street Station to Queen Street with an on street loop at the south end. Service is scheduled every 10 minutes during the daytime and every 20 in the evenings and early Saturday morning.
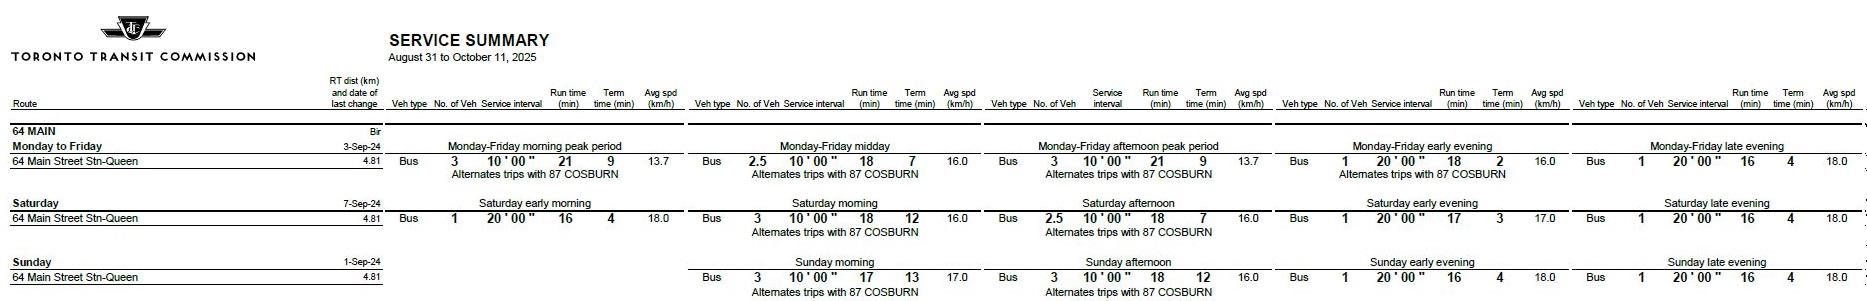
The standard deviations in weekday headways show a typical pattern with slightly better daytime values than in the evening, and more erratic service from the terminus that is not in a subway station (northbound from Queen). This is due to uneven departures, not to missing buses, as the average headways lie close to scheduled values.

In regards to 8 Broadview has any consideration been put into the fact that St. Clair is under heavy construction?
On weekdays construction occurs leading to blocked roads for extended periods of time causing bunching. Less so on weekends when there is often little or no construction workers/vehicles on site.
Similar issue with northbound Broadview south of Broadview station, only instead of construction, you have long streetcars wrapped around corners preventing the buses from passing.
I am not sure, short of stopping all buses each time a bus gets blocked, how the TTC could do anything to adjust for these issues. And parking all buses to maintain headways would be just as bad, if not worse for most of us.
Steve: What is quite striking about 8 Broadview is that there is only a small variation in headways during weekday daytimes, but the service completely disintegrates in the evening. If anything, one would expect the major effect of construction to occur during the daytime.
Looking at the detailed tracking data, congestion occurs in the PM peak at various locations, but the segment on St. Clair is only part of the problem with other areas affected too both on Broadview and O’Connor. Buses are occasionally held south of Broadview Station by streetcars, but not for lengthy periods. A few buses short turn at Broadview Station eliminating some of the large gaps coming north from Gerrard, but by no means all of them.
Travel times are longer and more varied between Warden and St. Clair/O’Connor in the peak periods, but lower at midday and certainly in the evening. The segment eastbound between Pape and Woodbine shows almost a doubling in travel time in the PM peak, but this is quite consistent, and is caused by the DVP backlog at Greenwood. Between Pape and Broadview Station, the first week of September saw longer travel times, but this vanished from week 2 onward.
Other issues I see include buses going out of service for one or more trips at various times, and the occasional extra bus that does little more than shadow another run at a close distance while adding little to the service.
LikeLike
Hi Steve,
With the exception of Ossington and possibly Lansdowne, service on the old trolley coach routes sort of went to crap a years after the regular buses were in operation. I took any of those routes often when I was younger.
A year ago, I had to take the 26 Dupont bus. Waited half an hour and nobody got on from Dufferin to Jane!! Service is that unreliable for that area.
Steve: Yes, the Dupont bus is a classic example of how to kill ridership with poor service. There might be an argument that over the years, demand reoriented to use the north-south routes to the subway, but there is a “chicken and egg” situation here where poor service could leave riders with no other option. As land use along Dupont changes from industrial to residential with considerably higher density, the 26 Dupont is a line on the map that offers little real service, and even that is unreliable. And we tal about “transit oriented communities”.
Looking at AM peak service levels on the west end TB routes in 1980 compared to today is a sad example of various routes’ decline. Only Lansdowne has held its own.
Jan Sept 1980 2025 4/26 Annette/Dupont 7'30" 24'00" 40 Junction 5'00" 11'00" 47 Lansdowne 5'00" 4'30" 63 Ossington 2'30" 5'00" 89 Weston 4'30" 10'00"LikeLike
I used the 83 for the last 7yrs, and have recently moved and have been using the 22/31. The 83 was great when it was on time, but so often it was faster for me to walk the route, especially if I was at Donlands walking down. I could walk almost half the route before a bus would catch up to me, and so I would walk more often than not because at least my walking speed is reliable.
The 31 is one of the most empty routes I’ve ever taken in Toronto, every time I use it I am maybe 1 of 3-5 people on the bus, but most often I’m the only one. if I need to get to the grocery store on Leslie it is somewhat helpful although once again I find walking is much more reliable.
All of this is obviously anecdotal, but it is always interesting to see the data that explains why I end up walking so often. Thank you for your constant work on this blog.
LikeLike
25 years ago the route used to be operated by a single bus during off peak times making a round trip in 30 minutes.
Increased congestion (buses often now can’t make it through the southbound left turn at the Danforth on the first cycle) and modern factors (new signalized intersections added) make it near impossible for buses to do that now. Increased loading too but I suppose that’s a positive.
In 2025 it’s two buses making a round trip in 40 minutes because having only a single bus would fall below service standards.
Steve: Actually the service on 83 Jones has more than 2 buses at times, and a longer round trip than 40 minutes. See the service summary.
New signals are something which add more time to streetcar routes downtown as there seem to be new installs going up all the time. The new ones on Dundas, Queen (Sackville), and I strongly suspect they will add one at King and Ontario in the next years.
LikeLike