
This is the second part of a series showing details of travel times in the Bathurst and Dufferin corridor.
For introductory remarks and a discussion of general issues, please refer to Part I.
The main part of this article contains the charts for the local and express bus services on Dufferin Street in June 2025.
Although the focus of recent debates about transit priority for Dufferin was from Eglinton south, data here show that there are issues with extended running times, particularly in the afternoon, over the full route with northbound trips taking the lion’s share of the delay. Express trips are faster than local trips, but by varying amounts over the route. The least benefit is on the southern portion of the route where red lanes will be installed, and where staying in those lanes could prevent express buses from leap-frogging the locals.
There are some areas where traffic slows in advance of an intersection, but more common is a general slowing down of bus speeds over the route representing overall traffic speed and longer stop service times when the route is busy.
Data shown here are from June 2025 with both the local 29 and express 929 services plotted together for comparison. In many times and locations their speeds are comparable, while in others the express buses have higher speeds than the locals.
The main article contains all of the charts including PDFs with all day sets.
From Dufferin Loop to Eglinton
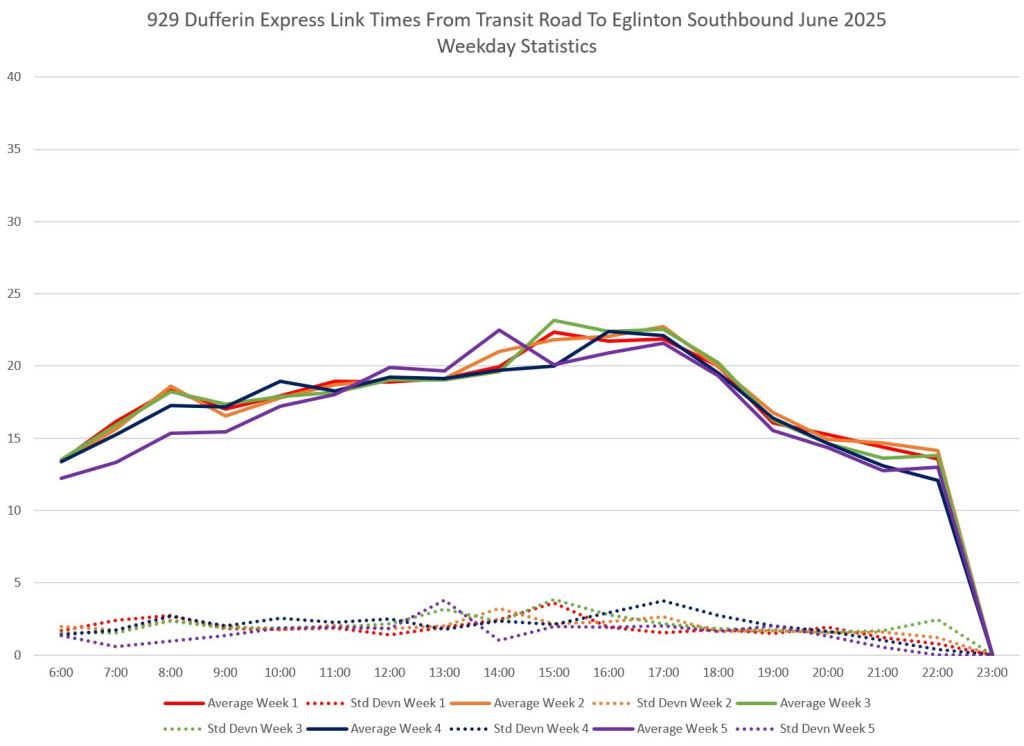
Travel Times
The travel time charts are arranged with northbound on the left and southbound on the right. Local service is in the top row, and express service on the bottom.
Note that “week 5” contains only one day, Monday, June 30, and this is effectively part of the holiday weekend. Travel times are lower on that day than typical values for these routes.
There are no data for the express service in late evening because it does not run to the end of service.


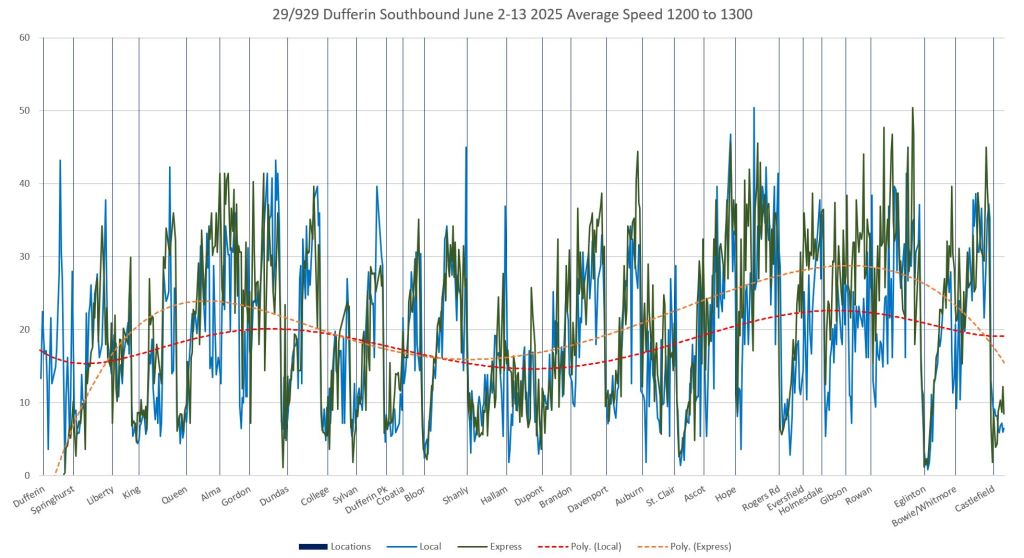
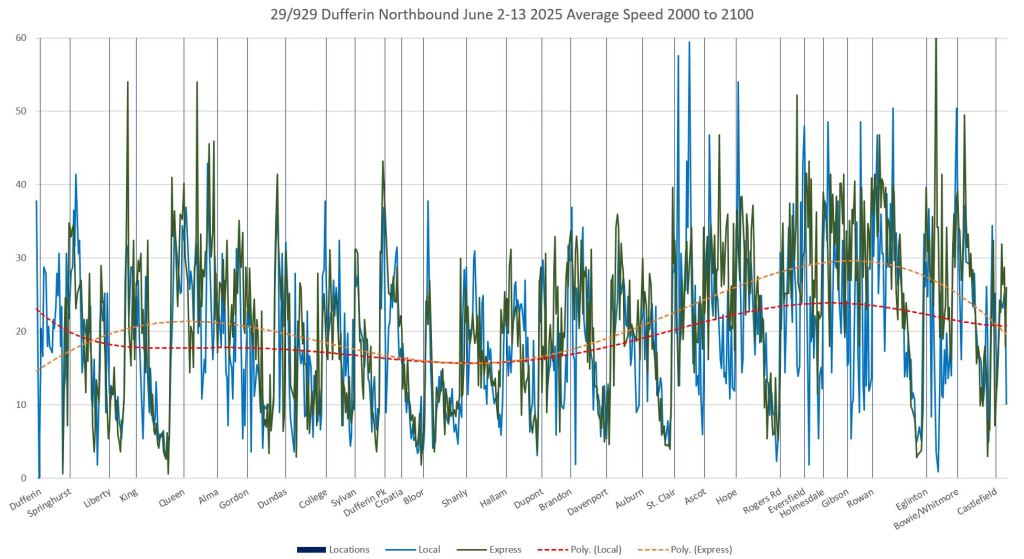
Travel Speeds
Between 6-7am, travel speeds are likely to be as good as one might expect with lighter traffic and passenger demand. There is no sign of queuing on approach to stops, and each of them has a fairly tight downward spike in speed. The south end of the route at Dufferin Loop is on the left, and the north end of this section, Eglinton, is on the right.
The blue lines (local) extend beyond Dufferin Loop because some buses operated east to the loop at Princes’ Gate. The segment of the route through Exhibition Place is omitted from the charts.
Where the blue lines (local) fall well below the green (express) this is typically for a stop served only by the 29 local service. In this segment of the route, the orange trend line for express service pulls well above the red local trend line between St. Clair and Eglinton, and to a lesser extent south of Bloor.


In the 8-9am hour, slow areas are evident near Bloor, Davenport, St. Clair and Rogers Road. Southbound speeds are slow from south of Davenport to just north of Bloor.


Midday speeds are slightly better than the 8-9am speeds above, but show the same overall pattern.

By 3-4pm, northbound speeds have dropped markedly north of College, on the approach to St. Clair and in the area north of Rogers Road. Southbound slow areas are at Rogers Road, St. Clair and south of Davenport.


Speeds from 5-6pm are similar to those seen in 3-4pm above.


By 8-9pm, the slow areas noted above have largely vanished, and the trendlines for speeds have moved back up on the charts.

From Eglinton to Wilson Station
Travel Times
The segment north of Eglinton sees a doubling of travel times northbound in the PM peak compared to earlier in the day, and particularly compared to the evening. The rise in southbound travel times is much less pronounced.


Travel Speeds
A consistent feature in the travel speed charts is the slow operation northbound approaching Lawrence and Wilson northbound, as well as westbound on Wilson approaching Dufferin. The area between Lawrence and Yorkdale is particularly bad through the afternoon.
Express speeds are generally higher than local speeds, more consistently than in the segment south of Eglinton.
In the 6-7am hour, slow operation at various locations is already evident.


By the 8-9am hour, the trend lines for average speeds are lower on the charts and slow operation at several northbound locations is evident. South is similarly slower during this hour.


Midday speeds are slightly slower than in the 8-9am hour echoing the gradual increase in travel times through the day in the charts above. Lawrence northbound continues to be a problem location, and speed northbound to Yorkdale has also dropped. Speed is also lower on Wilson westbound to Dufferin.


By 3-4pm, speeds have dropped even further including in the problem areas noted above. Note that the local and express services are below 10km/hr for extended portions of the route.


By the 5-6pm hour, the slowest portions of the route are even worse than 3-4pm for northbound buses. Southbound service is also slow, but not as bad as northbound.


In the 8-9pm hour, speeds have rebounded with the trend lines above 20km/hr, but there are still problem locations with slow speeds approaching major stops, notably Lawrence northbound.


These charts make me wonder if a branch that turns back south somewhere along Eglinton could be useful on the 29? It’d be a short transfer on Line 5 to get to Line 1, and would avoid the worst traffic of the route. Blending would be a challenge as always with the TTC… And I’m not seeing a good route to turn back on, other than Castlefield and Caledonia… Maybe west on Eglinton, Caledonia, then east on Castlefield back to Dufferin?
Steve: Once upon a time, there was a peak period short turn at Tycos Drive south of Glencairn. This lasted from April 1991 (replacing an earlier Briar Hill short turn) to October 2018 when all service was routed to Wilson Station. See Transit Toronto for the full route history.
LikeLike