
Introduction
On January 10, 2025 as part of the budget process, the TTC Board approved:
- Establish a Strategic Planning Committee to assist the TTC Board in managing strategic planning and priorities, including through a Ridership Growth Strategy and other existing strategic documents, and direct the Director, Commission Services to report back to the February 24, 2025 TTC Board meeting on a proposed structure and meeting schedule after canvassing Commissioners’ interest in committee membership;
- Amend the 2025 Schedule of Meetings to add a Special Meeting of the Board in September 2025 to consider recommendations from the Strategic Planning Committee, receive an update on the 2026 Budget, and discuss budget priorities informing the development of the 2026 TTC Operating Budget; 2026-2035 Capital Budget and Plan and 15-Year Capital Investment Plan and Real Estate Investment Plan Update;
- Direct the Director, Commission Services to include a Special Meeting to consider recommendations from the Strategic Planning Committee, receive an update on the next year’s budget, and discuss budget priorities informing the development of the next year’s budgets in future year’s recommended annual schedule of Board and Committee meetings for the Board’s approval, in
accordance with Section 20 of the By-law to Govern Board Proceedings;- TTC Staff conduct public consultations and develop a Ridership Growth Strategy 2.0, building upon the Ridership Growth Strategy 2018-2022 and report back to the Board in July 2025;
- TTC staff develop a hiring strategy on the basis of the approved Ridership Growth Strategy 2.0 and report back to the Board by October 2025; and TTC staff use the approved Ridership Growth Strategy 2.0 and associated hiring strategy to inform the 2026 TTC Budget process.
I began writing this article before the meeting took place as background based on the then-posted materials. After attending the meeting, I found that it was more productive than I had expected thanks in part to two presentations that were not in the original published agenda.
TTC Chair Jamaal Myers praised Councillor/Commissioner Alejandra Bravo who chairs the Strategic Planning Committee for the work she did in producing a focused agenda that made for a useful meeting. Past attempts by the Board to engage in general policy debates have been rare.
There was much more meat on the presentations than we have seen in a long while at the TTC. Heavy going in places, and some hard truths about the options available. This type of briefing is long overdue, and will provide the foundation for informed discussions at the TTC Board and eventually at Council.
The actual establishment of a committee contemplated in point 11 did not actually occur until the Board meeting of April 16, 2025, and the first meeting only now happened, six months after the original motion. It is not clear how much influence the committee will have on the 2026 budget process considering the length of delay.
Although the next meeting date is currently shown as October 25, 2025, Chair Bravo indicated that she does plan to schedule one in time to feed into the budget.
As for consultations on a Ridership Growth Strategy, these have not yet begun, and the TTC is now only in the first round of its Annual Plan consultations. By extension, any service improvements flowing from a new RGS including hiring required to staff buses and streetcars do not yet exist. How much would be done in the 2026 budget remains to be seen.
The delay in the committee’s initiation places the Board in a familiar position. Actual discussion of policy options is pushed off, if it occurs at all, so late in the year that the next budget is “more of the same” because there was no time to consider alternatives. Options for significant growth are never presented to Council because the TTC Board never discusses what might be done.
“Value for Money”
Almost at the end of the meeting, Chair Bravo made a comment about advising the budget process. She posed two questions about funding:
- Is it the best value for money?
- Does it create the most value for transit users?
This slipped by quickly, but a vital issue here is that these are not the same question, but two separate issues depending on what one assumes as the role of transit. Best value for money for whom? For taxpayers asked to subsidize transit? For riders awaiting a bus that never comes?
That distinction lies at the heart of every transit funding debate I have heard, but the actual question is never asked, and “value for whom” rarely starts with riders. This can be an important change in budget planning and in advocacy for financial support from the City and Province.
On The Agenda
There are three items on the July 10 agenda:
- The Committee’s Terms of Reference (this is a pro forma item)
- Key Trends on TTC Expenditures, Revenue and Opportunities for Sustainable Growth
- Framework for Ridership Growth
Key Trends on TTC Expenditures, Revenue and Opportunities for Sustainable Growth
The short introduction in a covering report sets the stage for the discussion of TTC’s future growth. A gap has opened between available subsidy, fares and other revenue, and the cost of operating the TTC at its current service level, let alone any significant increases. This makes discussion of any plan beyond just keeping the lights on and the wheels turning politically challenging. Council did not help things by passing the following motion as part of the 2025 budget approval.
City Council request the Toronto Transit Commission Board direct the Chief Executive Officer to develop a multi-year operating budget that decreases the Toronto Transit Commission’s reliance on property tax increases by:
- advocating to other orders of government for long-term sustainable funding;
- reviewing the Fare Policy, Fare Collection Outlook, and Ridership Growth
Strategy; and- implementing the recommendations of the Auditor General on fare evasion.
That motion is very much the “run the TTC on as little money as possible” argument we might have heard from a John Tory government, and it sets a gloomy stage for the ridership growth discussion to follow. There are no recommendations in the report beyond receipt for information, and the Council motion gives no implication of what a “Plan B” might look like if subsidies do not materialize.
Commissioner Mihevc, with an amendment from Chair Bravo, moved:
That TTC staff report back on a jurisdictional scan of best practices on new funding revenues that offset cost pressures and incentivize ridership.
Although the presentation contains a lot of information, it also shows the immense challenge in getting back to “the old days” when TTC revenues, mainly fares, recovered 66% of total costs. A key question that nobody asked is this: should we attempt to get back to 66%, and is this even possible in the five year term to 2030?
Such a discussion seems even more absurd in light of Commission Mihevc’s suggestion that ridership growth should aim to double the proportion of trips carried by transit. This somewhat parallels the City’s green strategy to increase transit use with substantially better transit service, but there are structural challenges to such an achievement.
Although the population grew by 25% since 2003, and for almost two decades ridership rose even more, the pandemic drop now puts transit at a growth of only 10%. Much transit growth is needed just to catch up with the population. However, the nature of travel in the TTC’s service area has changed in two key ways.
One is the obvious shift in commuting patterns thanks to work-from-home which eliminated many trips. This effect is strongest in the core area where transit had a much higher market share than auto travel. GO Transit was hit even harder by this as their primary rider group is commuters.
However, another change is the growth in employment, and hence trip destinations, outside of the core and outside of Toronto (the “416”). These trips are poorly served by transit, if at all, and suffer from the compound effect of lower service levels beyond the Toronto boundary.
Toronto’s population is projected to grow very substantially in coming decades, but transit’s ability to address this will be limited by where transit actually goes. A few suburban subway lines might deal with local problems, but not regional ones, and especially the “last mile” problem of getting to and from a rapid transit station. For trips within Toronto, there is at least the foundation of a strong grid of surface routes. The same is not uniformly true elsewhere.
The regional focus on handling commuters to downtown Toronto brings another problem. For decades Toronto bore the cost of carrying people from outside the city into the core, and this subsidy made sense because it enabled the growth of employment and student travel without associated road building. The same is not true for the opposite direction, and one must ask whether the 905 municipalities will absorb the cost of substantially better transit to serve out-commuting from Toronto.
We already know the answer from Vaughan where the TTC provides subway service with no subsidy from York Region, and there has been no discussion of who will pay to operate service to Richmond Hill.

The budget for “conventional” transit (i.e. omitting Wheel-Trans) has grown substantially over the pandemic period. A large component of this rise, $367 million, is due to contracted wage increases, as well as $201 million due to service changes including preservation of service levels and countering the effect of congestion. There is a $183 million offset from internal cost cutting.
An important consideration in any discussion of the labour component is that a considerable proportion of overall costs do not vary with service levels. They are routine maintenance and servicing of vehicles and infrastructure, a particularly large component for subways. Cutting service by 10% does not cut total costs by the same amount, and yet service is the obvious target when budgets are tight. Cuts on the maintenance side do not produce the same effect quickly and visibly, but as we have learned from major problems on the rapid transit system, they catch up with us eventually with possible catastrophic results.
Restoring TTC operations to a past state is not just a question of running more trains, buses and streetcars.

The evolution of TTC finances over past decades shows how Toronto has fallen into a deep hole.
Although 66% is the conventionally assumed level of cost recovery, the TTC actually started three decades ago at a higher level thanks to policy decisions during the recession of the early 1990s. Although Toronto and Ontario shared subsidies, the amount was well below the 1/6 level each would have paid under the traditional formula. Then Ontario walked away from transit subsidies leaving Toronto holding the bag. Only recently, and with some limited-time funding, is Ontario back to a percentage comparable to 1997.
Not shown in the chart below is Federal operating subsidy because that stream, begun during the pandemic, ended before 2025.
In 2019, the last pre-pandemic year, the cost/ride was $3.63, but it is now $6.00. The adult token fare in 1997 was $1.60, and by 2019 it had grown to $3.10, almost double. During the pandemic, fare increases were at a minimum and the Presto fare is now $3.30. This was a policy decision by the City to insulate transit riders from the growing cost of providing transit during a period of deep ridership losses. Total TTC costs rose by 37% but the basic fare only went up by 6.5%. That decision establishes a new level in the balance between revenues, subsidy and costs that cannot be wished away overnight.

Budget projections for coming years give a sobering look at the TTC’s financial picture. There is a considerable projected cost increase to 2030, and the expected loss of “New Deal” provincial funding in 2027. Fare revenue contributes modestly over the period, and is actually projected to decline by $11 million in 2026.
Projections for 2031-2035 are only approximate.
The budget gap forecast for 2030 is $936 million, rising to $1.5 billion by 2035. This does not include provision for additional service beyond the modest additions already foreseen in the service plan, and certainly not the effect of a major effort to bring more riders to the TTC.

The next chart puts the need to find new revenue in context. Dollar figures are omitted from the chart because the amounts are only estimates, but the bars give a sense of the relative magnitude of each component. About two-thirds of the total here depends on a new funding strategy.
I must point out the sliver-thin contribution of non-fare revenue. There is a wilful blindness among some commissioners and councillors that if only we “monetized” every available “opportunity”, we would rake in new revenue. This is utter crap, and deserves to be called out as such. There are limited possibilities for new advertising revenue, and the current stream is constrained by a soft market. People riding transit are browsing their smart phones, not perusing car-cards. Ancillary marketing such as subway shops or TTC swag represents a very small income stream. The TTC might have empty space in stations, but that does not guarantee a market for would-be vendors.
An important lesson from the late 2010s was that new trips will come to the system if there is capacity to absorb them, but as that decade wore on, the TTC used up surplus off-peak capacity on many routes. It is overly simplistic to argue that ridership growth stalled then as part of a continent-wide trend. TTC service suffered from overcrowding in 2019, and just “getting back” to those conditions is not a goal Toronto should pursue. (See the 2018 Operating Budget Briefing Note for information on crowding in that era.)

This brings us to a chart showing the utter folly of attempting a return to 66% cost recovery. In the absence of new subsidy, the TTC would have to get $520 million more revenue on the 2025 base, or $1 billion on the 2030 base. This assumes that Ontario essentially disappears from the mix based on their current commitments. Assuming no change in fares, the TTC would need 213 million more rides in 2025 (about 50% more) or 410 million in 2030.
The chart shows no effect of all of those new/reclaimed rides on operating costs, and it is not clear how much additional service would be required. A further problem is that the subway is the easiest place to accommodate more riders, but large scale demand there is driven by external factors in the office job market. Fares could go up, but aside from the political challenge they represent, there would be a severe effect on riding with a large fare increase.
For decades, the advice to politicians has been that small, annual increases would protect the revenue stream without driving away riders. Through several mayors, the choice instead has been to freeze fares or to tinker with the tariff by creating new discounts for some rider groups, or by making fares “buy” more travel with the two-hour transfer and regional fare integration. That is a policy choice, but now we have to live with the effect.
Even assuming the impossible conditions of the 2030 projection shown below, Toronto will not see a substantial drop in the subsidy call from the TTC. Council’s request that the TTC find ways to reduce the reliance on property taxes was a foolhardy concept that assume the TTC, on its own, could solve the funding problem. Any new revenue, be it from parking taxes, congestion fees, or provincial subsidy is for Council to pursue, and none of them will be popular.

Charts showing ridership recovery in various cities portray Toronto as following the American pattern. Although we are doing best among the western hemisphere cities shown here (notably with no Canadian comparators), Europe and Asia are generally doing better. Toronto’s performance might reflect that we have a better system to start with, notably considerable service that is not core-commuter oriented. A problem with these charts is that it is not clear whether they represent all regional travel, or only the “local” transit system. For example, Toronto would not look as good if GO Transit stats were included.

A Framework for Ridership Growth
The Ridership Growth report and presentation acknowledge that the system might try harder to win riders, but not too quickly. The recommendations are:
1. Direct TTC staff to:
a. Leverage the TTC’s Planning Advisory Group to review and receive feedback on ridership growth.
b. Conduct a comprehensive review of TTC Service Standards, with extensive consultation with TTC’s Planning Advisory Group and customers to begin in 2026.
2. Endorse the draft ridership growth guiding principles.
A small improvement in service is planned for Fall 2025, and with luck we will see Lines 5 and 6 operating sometime soon. However, any further changes such as an across the board review of service standards and quality will likely not inform the 2026 budget. We must await 2027, and hope that a transit-friendly administration will still be in place.
The 2024-2028 Five Year Plan proposes $39 million for various type of service improvements in 2026, notably to restore service to meet standards. This of course assumes that the standards will not change, and yet a review of the standards will begin soon. Equally important is the assumption that funding is needed because service does not now meet the standards.
In February 2024, the TTC considered a proposal for reduced fares for high school students on field trips. Management were concerned that many services would not have the capacity to handle the extra load. (See Overcrowding on TTC Bus Routes). A chart of midday bus occupancy showed many routes with crowding problems, and there have been few service increases since that report to eliminate this problem. Crowding exists, and the TTC has the data to show when and where it occurs.
This type of chart should be routinely produced as part of the monthly metrics report with breakdowns by time of day, as well as lists of when and how the crowding will be addressed.
At times, typically when riders advocate for more service, TTC management claims that few trips are crowded, and yet the Five Year Plan also explicitly provides for restoration of crowding levels and service frequency.

Draft Guiding Principles for Discussing Ridership Growth
Although there is a recommendation to “endorse the draft ridership growth guiding principles”, no such principles are in the main report. They appeared in the presentation deck for the meeting. The list was amended by the Committee (changes in italics):
- Prioritize initiatives that have greater return on investment than others
- Reduce points of friction in the customer journey
- Bundle complementary improvements for greater impact
- Leverage partnerships to extend reach and resources
- Partner with City on advocacy efforts
- Address key barriers to mode shift
- Improve reliability and reduce service interruptions
- Align with current standards and approved TTC Plans (e.g., Corporate Plan, 5YSP, etc.)
- Maximize use and efficiency of existing fleet and resources
- Focus initiatives on key customer groups – women, people with low income, and shift workers
- Ensure that the TTC remains affordable, accessible and equitable for customers
- Sustain ridership gains from fare and service initiatives through customer experience improvements
- Centre riders and ensure that their experience informs and drives decisions
- Use and report on indicators, standards and metrics that support reducing barriers to ridership growth
- Ensure accountability and transparency
The Shifting Transit Market
Any Ridership Growth Strategy must take into account the changing market for transit. The mix of trip types has shifted, and the total TTC boardings are down from 2019. This changes the distribution of trips both geographically and in time.

A more striking figure is the change in overall trips by all modes. Total travel is 10% below the 2019 level, and the TTC’s share of those trips is down from 26% to 21%. Many of those trips simply do not exist any more because there is less commuting (including both office and school travel). Auto modes (car driver, passenger, taxi) have gone up from 46% to 52% of the reduced number of trips.. The TTC sees opportunities for growth in peeling off trips from autos, not in developing new trips overall. This is a challenge considering issues with transit’s poor reputation for reliability and speed.

The travel market is broken differently depending on trip length. For short trips (under 5km) transit has only 14% of the market with the lion’s share going to active transportation and motor vehicles. An important distinction for this group of trips (which are by far the majority of trips overall) is that access and wait times are a substantial portion of total travel time. Walking to a stop, waiting for a transit vehicle, and potentially waiting again for transfer connections can together be more than the in-vehicle time. As TTC service becomes less reliable, riders have to factor in larger padding in trip estimates to allow for the possibility of delays enroute.
Transit has a higher mode share for trips over 6km, and collectively these represent a about the same number of trips as the 0-5km group. Note that the data is from 2022 and may not reflect the 2025 breakdown in trip lengths and mode shares. TTC’s ability to sway auto users to transit for the longer trips will depend a lot on where people are travelling.
Some of the longest trips are likely in outer parts of Toronto and beyond where transit is less competitive. A question not answered in this presentation is whether there is more opportunity to build the transit share in the 6-10 and 11-15km trip groups. The 16+km group is roughly the same size as the 6-15 groups combined, but is likely more expensive to serve.

A related issue is that population growth is not projected to be uniform across the city but to be concentrated in a few centres. This is not to say growth does not occur elsewhere, but it would not be on a lower scale and hence harder to serve by transit.
Important factors not mentioned in the presentation are what this growth map is expected to look like in, say, 2035, and equally important where major destinations (offices, industrial areas, schools) will grow in the same period. It is comparatively easy to serve destinations like offices and college campuses by transit as they concentrate demand in space and time. Origins (residential areas) create a more diffuse many-to-many outward pattern. Serving office towers is easy. Serving condo towers is harder.

The demographics of potential transit riders are shifting, and this has implications for the type, time and location of transit trips. The reference to Gen-Z riders here ties in with the shift of trips from TTC to ride sharing services. There are questions of availability and speed where the relative fare is not necessarily the driving factor. Again the issues of service reliability, wait and travel times builds into the choice riders make.
A survey of former users of the TTC found that almost half switched to driving with smaller groups moving to cycling and other modes. The totals in the survey are greater than 100% and there is no indication of how many people are represented.

What Do Riders Want?
Customer satisfaction is down thanks to delays, disruptions, crowding, cleanliness and poor behaviour by other passengers. Details from these surveys and from feedback in annual plan reviews shows consistently that service quality and crowding are key issues, while the TTC, until recently, played these down by contrast to economic factors. If the TTC is going to attract riders, they must address the key issues riders flag rather than pretending service is acceptable.

The key areas for riders and non-riders are summarized in the table below. Note that the TTC claims that only 0.6% of daily trips are overcrowded. This does not accord with rider experience, nor does it align with “heat maps” of crowding that show a much more extensive problem. Indeed, if only 0.6% of trips needed relief, the cost of reducing crowding would be far less than the $18 million in each year of the five-year plan.
A major problem with reporting crowding lies in how the TTC calculates its stats. Typically, they look at entire routes over a time period (e.g. am peak) and report average values. This smooths out the effect of gaps and bunches on uneven loads, and counts lighter-loaded counter-peak and shoulder peak trips. Someone wishing to ride at 8am cannot use empty buses running the opposite direction, and with bunched service, most riders are on crowded buses even if the average load is modest. The average rider does not experience the average load.

Opportunities for Growth
The presentation lists six “opportunities for growth” together with estimated costs, revenue and ridership effects including:
- Fare policy changes
- Service changes and enhancements
- Improved speed and reliability
- Improved integration with other agencies and modes
Fare Policy
Two options are examined here. This work was done as part of the 2025 budget, although these figures were not published.
Fare capping would set an upper limit on the number of fares charged per month so that riders would have the benefit of a fixed cost without buying a monthly pass up front. This scheme costs a substantial amount if the capped level is low, but also drives ridership. Beneficiaries are moderate to frequent riders.
Not shown here is another capping option to a shorter period such as a week to benefit riders with uneven travel requirements through a month.
Fare increases would gain more income, but with the offsetting effect of discouraging ridership. The larger the jump, he worse the effect. If the intent is to raise revenue, then a big fare increase will do the trick, but at the cost of losing riders.
These are not all of the options, merely a sample of what might be on the table.

Service Enhancements
The proposals here have different “payback”, but none comes close to a break-even level. This is a basic fact of life about transit. At the current ratio of cost to fares, no additional ridership can be obtained at a profit, and none of the changes is free. That said, the order of magnitude of cost/revenue tradeoffs shows shows that service improvement will not be free, and will cost a lot to implement.
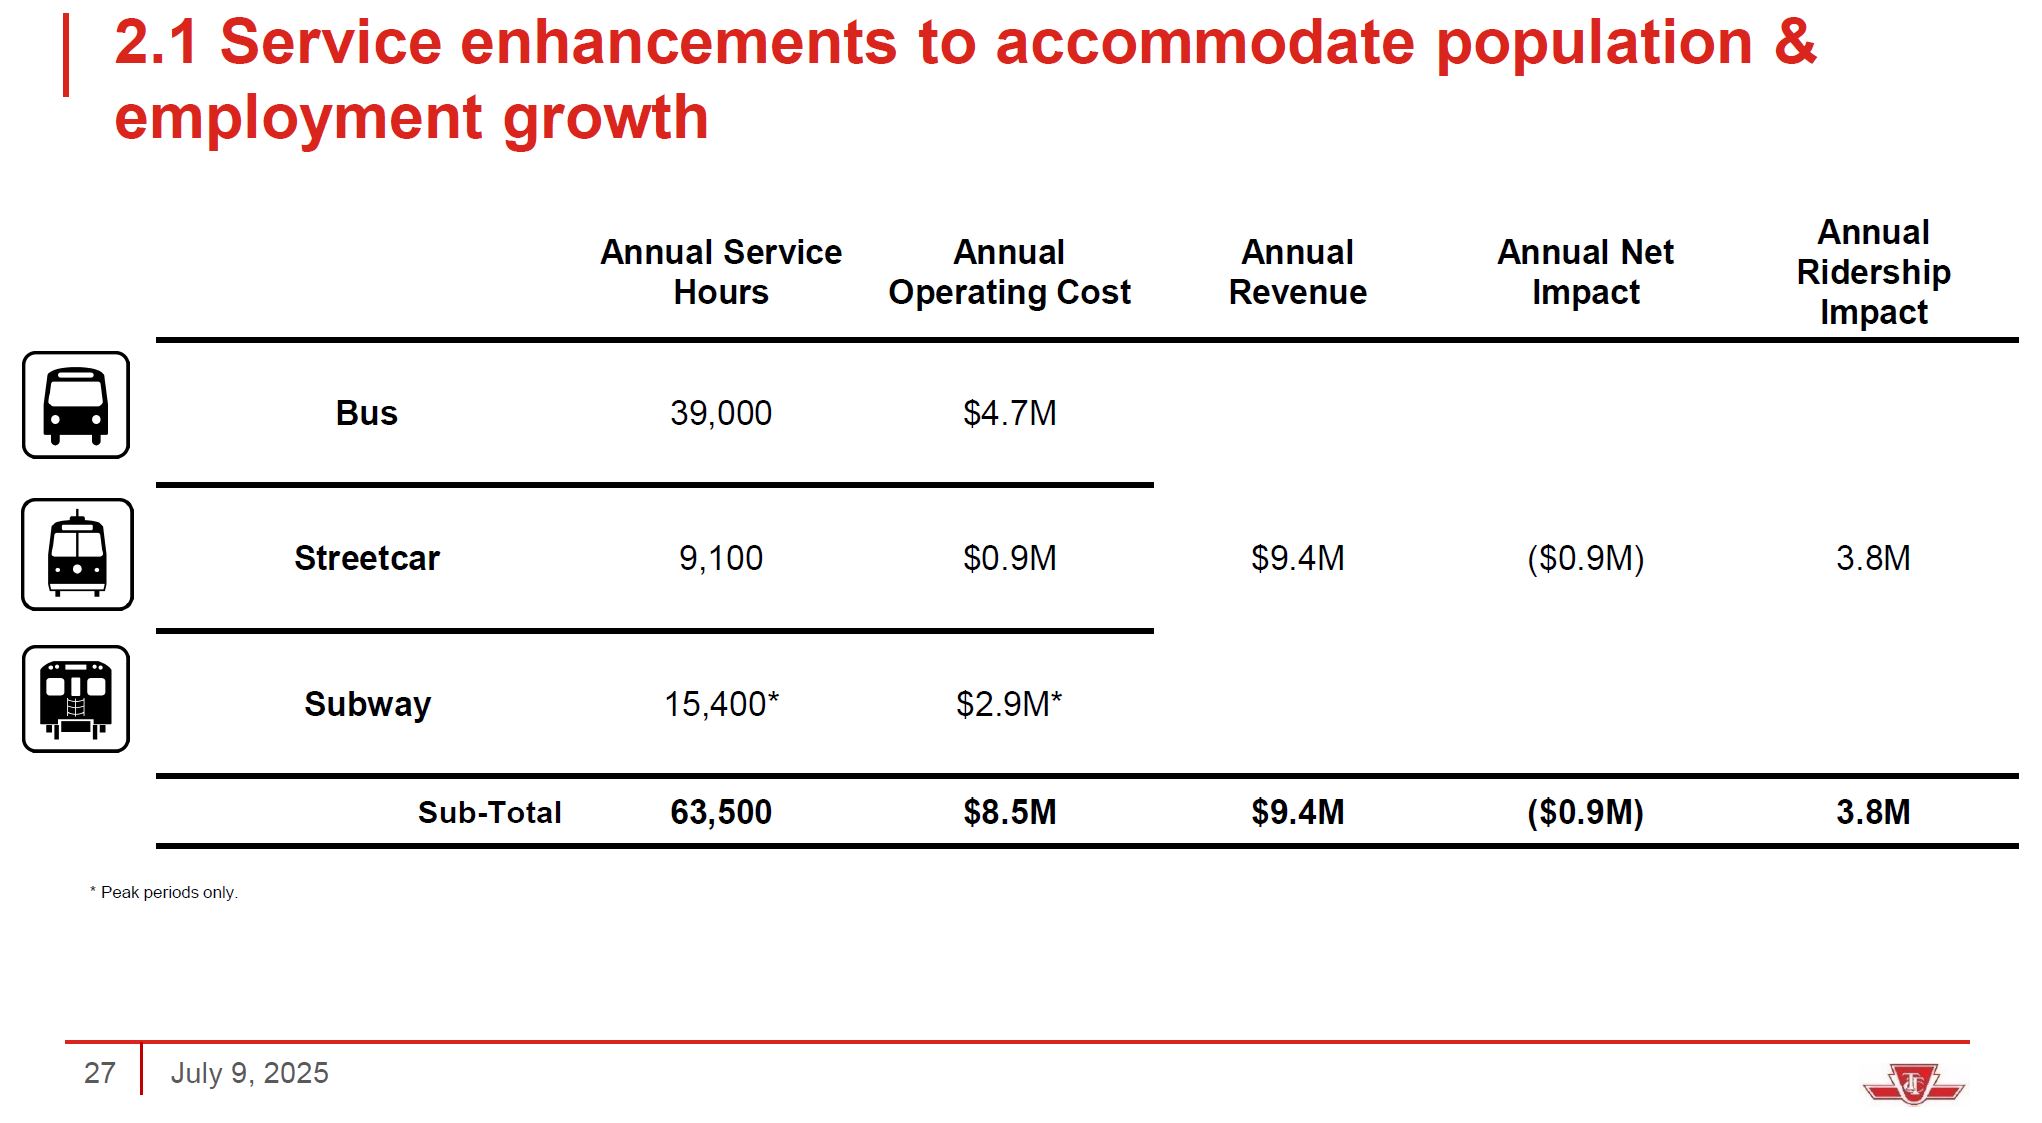
Service for Growth
The report is silent on just what growth the proposal addresses. To put the numbers in context the weekly budget for service hours ranges from about 190k to 200k per week. An additional 63,500 hours per year is really small change, under 1%.
Service Enhancement to Meet Standards
The existence of this slide tells us that the TTC is not currently meeting its own standards, although like the “growth” proposal above, the amount of service added is quite small relative to the total, roughly a 1.75% change.

Other Service Enhancements
The proposals here represent a more substantial change of almost 11% additional service hours, although the projected new ridership is only about 3.2% relative to the 2025 budgeted level.

Speed and Reliability
The options shown here are familiar from past advocacy efforts by the TTC. There is an important difference between schemes like RapidTO and Queue Jump Lanes that address specific pain points in the network, and broader projects like Transit Signal Priority. The TTC also plans system-wide changes in management and scheduling, although this is still a work in progress.

Other uncosted proposals include integration with other agencies and modes (e.g. cycling), and various schemes to improve the “customer experience”. Some of these address chronic problems with communication of service interruptions and diversions while others speak to passenger comfort. There is no estimate of the ridership effect of these changes.
TTC Service Standards
The Service Standards have a long history. The original scheme was an outgrowth of work done by former Mayor John Sewell, Greg Stewart of City Planning and me in the mid-1970s. The intent was to provide an unbiased measure of transit resources and needs, and to weigh demands for service among competing requests.
At the time, many parts of what was then “Metro Toronto” (now the outer 416) were in early stages of development, and there was concern that TTC resources were not fairly applied across the city to establish new service areas and ensure comparable quality on new and old parts of the network.
The standards have several sections that I will not review here in detail. Interested readers can look at the presentation and the underlying Service Standards report.
An important term often seen in reference to the standards is “Board Approved”. Whether the Board fully understands how the standards work and interact could be questioned, but they give staff a formal context in which service proposals can be evaluated. Sometimes the results are not to everyone’s liking, and exceptions have been made to work around limitations and to accommodate political desires of the day.
In the 2023 budget, TTC staff unilaterally changed the crowding standards so that off-peak service targets were almost as crowded as peak service. This was not explicitly approved by the Board, and the move was reversed in 2024. Other changes over the years have adjusted for differences in vehicle size and capacity. There is no detailed list of services that do not meet standards.
The greatest problem with the “standards” is that reporting on them leaves a lot to be desired. Some of the metrics offer wide ranges for “success” that leave a gap between standards and actual experience. Some are reported infrequently and on a system-wide basis rather than focusing on individual routes and time periods.
Greater transparency and granularity in reporting is needed so that the divergence between advertised and delivery service are plain to see. Advocating for improvement and greater transit funding is difficult when the transit system itself claims that there are hardly any problems.
There are several broad areas of standards:
- Network design
- Service quality
- Performance targets
- Service changes and warrants
- Service evaluation
Network design standards set parameters such as the maximum distance to a transit stop for most would-be riders:
- During the daytime and evening, 90% of Toronto’s population and employment is within 400 metres of the All-Day, Every-Day network
- The overnight network is designed so 95% of the population and employment is within a 1,250-metre walk (15 minutes) of transit service
There are various types of service on the TTC such as rapid transit lines, local and express surface routes, and community buses. Different standards apply to each type.
The walk to transit is not the same as stop spacing, and this has produced confusion on occasion. The maximum stop spacing for surface routes is 400 metres, but the walking distance to a stop includes access out to a route, not just along it. (For express routes, the maximum stop spacing is 1,200 metres.) This means that once someone is on a transit route, they should be no more than 200 metres from a stop one way or the other, although local geography can make the nearer stop less accessible.
Service Quality and Crowding
Within the surface routes, some are designated as a core “10-minute network” where service should always be scheduled every 10 minutes or better regardless of demand. Some of these routes have seen exceptions during off hours to work within budgets. There are two classes of express routes with Tier 1 being all-day services, and Tier 2 being peak only.
The minimum service level is every 6 minutes for rapid transit lines, 30 minutes for streetcar and local bus routes, and 15 minutes for express buses outside of the peak period. Tier 1 express routes have a 10 minute minimum. These standards include a footnote that “Service is subject to ridership meeting minimum performance standards.” Problems arise when ridership is very weak, but there are geographic or political reasons to retain service.
The crowding standards are set so that during off-peak periods there should be no standees. There is an important caveat here:
Vehicle crowding standards are applied as an average. For example, the off-peak crowding standard for vehicles calls for a seated load, with no standees. This standard does not guarantee that no customers will stand; it does ensure that, on average, vehicles will carry a seated load of customers during the busiest 60 minutes during off-peak periods of service. (Service Standards, p. 14)
That averaging interacts with reliability issues. The more a service has bunches and gaps, the more likely that it will have vehicles with well over a seated load, but on average, the stats look good. TTC does not report publicly on routes and time periods where crowding exceeds standards, although they have done this on-and-off in the past.

Convenience, comfort, predictability and dependability are the main features customers expect of a transit system. A person using any transportation mode has an expectation that the service will be reliable. Services that cannot meet their published schedules or provide a consistent headway lose the loyalty of their customers. A consistent and reliable service reduces the variability of wait times for customers and improves comfort as customers are evenly distributed between vehicles. (Service Standards, p. 15)
No, I didn’t write that. It is the TTC’s own description of how service should operate, and the point about customer loyalty is key. The TTC has metrics for how service is supposed to behave, but there are many problems with them:
- The on time performance standard applies only at terminals, and even there is generous enough that service can be quite erratic and yet be “on time”.
- Headway performance standards apply to mid-route conditions, but these are never reported on and no measurements have been publicly reported.
On time terminal departures should be no more than 1 minute early or 5 minutes late, 90% of the time. In practice this allows for wide gaps and bunching on frequent routes where the six minute leeway can be close to or more than the scheduled headway. For reporting purposes, the TTC recently eliminated the 1 minute early option, but they still summarize data on a month-long basis for all routes. There is no exception reporting of problem locations and times when service exceeds the standard.
Terminal arrivals have the same 6 minute leeway, but the target is to achieve this only 60% of the time. In practice this standard is not reported on publicly, and is probably not tracked because it is so lax. Arrival targets can produce operational problems along routes where running times are padded to worst case conditions, and operators are challenged to avoid running early most of the time. The practice of padding is particularly bad on streetcar routes, but its effect can be seen at many terminals where multiple buses and streetcars wait for their scheduled departure times.
Headways have similar standards, but again there is no reporting on how these are met. There is very wide leeway in the targets to the point that the standards are meaningless.
- Services less often than every 10 minutes are subject to the same 6-minute on time window as terminal departures, but with a target of only 60% of trips meeting the standard.
- Services between every 5 and 10 minutes are allowed a headway deviation of up to 50%, but with a target of only 60% of the time. Note that this means a 10-minute service could see a headway as low as 5 minutes or as high as 15 minutes and still meet the standard.
- Services more frequent than every 5 minutes are allowed a 75% deviation 60% of the time. A 4 minute service could arrive with a 7 minute gap, or only 1 minute behind another vehicle, and still meet the standard.
A gap of more than 20 minutes from a terminal is considered as a “missed trip”. These are related to short turns which, on typical headways for many routes today, can produce gaps of 20 minutes or more at terminals, especially when irregular departures are considered. The TTC reports on short turns only on an aggregated monthly basis, and does not report on instances of wide headways at terminals.
Their goal is to minimize these events, although sometimes this can be counterproductive when a short turn could break up a parade of vehicles and restore regular headways. The Rick Leary era was particularly bad for this because “no short turns” was the rule, even when it perpetuated major service disruptions.
A significant problem for both short turns and scheduled branching or turnbacks on routes is that there appears to be little or no management of blending services. Combined with the lax headway standards and the absence of “on time” metrics along routes, uneven service can be the norm and go unreported.
Service Performance
Service productivity is measured against boardings per vehicle hour. This was originally a surrogate for fare revenue, although the link is more tenuous now that we have a two-hour transfer and a “trip” is not tightly linked to a “fare”. This relationship began to diverge with the introduction of passes in 1980 and the gap has grown ever since.
The target values are related both to vehicle size and type of service, although there is no distinction between routes operating with larger and smaller buses. Given the inconsistency of actual versus scheduled vehicle allocations, it would be difficult to set a target on that basis.
Note that these targets do not make every vehicle full all of the time as boardings will accumulate along a route, especially one that serves many different neighbourhoods and demand patterns. Streetcars and bus loads will vary with ons-and-offs, and few routes have a clear demand pattern accumulating riders to a single point. Bus routes can have well under a seated load and still meet the performance target.
Where a service runs though a Neighbourhood Improvement Area, the actual boardings/hour are increased by 25% for the purpose of route evaluation. The intent is to give a better chance to these areas where marginal services might not otherwise meet the target.

The TTC also has a net cost per passenger metric, but this has not been published since pre-pandemic days. This applies both to existing services and to proposals for additions or removals. Routes that rank highest on this scale are subject to review, and new services must be no more expensive than the range for existing routes.
A separate metric of change in ridership per net dollar spent is more arcane, and the target value must be adjusted each year to account for fares and operating costs. These do not go up lock step and so one cannot set a fixed ratio as a target. This was done in the past, but has been corrected in the current version of the standards that are recalibrated to current conditions.
When several possible changes are under review, those that get the most new riders (or lose the fewest) per dollar rank high. This metric can skew reviews because the dollars spent on a route are directly affected by vehicle type and speed, and more riders are needed to “pay for” one hour of vehicle service on slow routes than on fast ones.
Effects on Riders
In calculating the effect of a change on riders, the TTC weights time spent on different parts of a journey to reflect the perceived annoyance each leg involves. Note that access times, including transfers, are more heavily weighted than travel time. Getting to and between routes, and awaiting a vehicle’s arrival are perceived as greater penalties than actual travel time. Put another way, a change in speed of a vehicle must be substantial, proportionately, to offset a longer access times to service.
| Each minute of … | Weight |
|---|---|
| In-vehicle travel time | 1.0 |
| Wait time | 1.3 |
| Walk time | 1.8 |
| Subway transfer | 1.0 |
| Right-of-way surface transfer | 2.0 |
| Mixed-traffic surface transfer | 6.0 |
Service Warrants
The standards contain warrants identifying potential routes for express service. As a starting point, the existing local service must run every six minutes or better, and the projected travel time saving must be about 15-20% lower than the local service. The route must be at least 10km long, or have projected trips that are 60% or more of the route’s length. In other words, the express service is not intended to serve short trips. Stops on the express service should serve 50% or more of the route’s total demand.
Tier 1 (all day) express service is subject to more stringent rules than Tier 2 (peak only).
There are also standards for preservation of frequency on the local service after express buses are introduced especially if the existing service is every 10 minutes or greater. Note that this conflicts with the premise that only routes with a 6 minute or better service would be considered for express operation.
Consultation History
This presentation recaps what the TTC heard over and over again from public consultations. A common thread through this is better service: faster travel times, improved frequency and reliability. Other concerns were safety, comfort and affordability.
However, what the TTC actually did only nibbled at these issues around the edges. Problems of reliability remain across the system, and service growth is hampered by budgets, the lack of full ridership recovery, and the resulting shortfall in fare revenue. Although the TTC has detailed ridership and crowding data, some of which appear in the Service Standards presentation (above), these are not regularly published and they are not available via Open Data or on a TTC dashboard.
Too often, there is a fixation on secondary aspects of travel such as provision of WiFi or construction of more salubrious shelters rather than simply making buses arrive on a reliable basis. Wait time is an important and annoying factor in journeys especially when it is unpredictable.
Many items are listed as examples of how consultation informed changes are at the local level such as specific route modifications, but these can generally be implemented at minimal cost. The downside is that the benefits are seen only by the small proportion of riders who use the affected services.
In the 2023 plan, the TTC talked of improved handling of construction project planning, communications and operation. Recent experience shows that this did not go well with the compound effect of multiple projects on the go downtown. A particular problem is the effect of schedule changes when projects run early or late, and routes change to suit project stages. The issue of never knowing “where is my streetcar” challenges and frustrates riders.
The City’s contribution both through traffic management (signals, lane use changes, traffic wardens) has a reactive feel with fixes applied after the fact.
Diversion management is supposed to be a topic for Round 2 of the Annual Network Plan coming in August.
The table below shows the changes TTC implemented in response to consultation. Some of these are significant, others are not.


This does look like a positive step forward but I really wish the TTC would stop talking about vehicles being ‘on time’ for routes that run frequently (which is most of them): it is the vehicle ‘spacing’ that is important to customers. As you have noted many times, TTC route management is either non-existent or based on arrival and/or departure times/spacing only at the termini.
LikeLiked by 1 person
Does the TTC still plans to merge 22 Coxwell and 70 O’Connor buses into one route? If so when?
Steve: Yes I believe so, but the date has not been announced. There is an ongoing problem with service changes “announced” in one year’s plan but not showing up on the street for a year or more. They should include a recap of outstanding/pending changes in each new report, but they don’t.
LikeLike
Will the Toronto Transportation Services and MTO put up “roadblocks” against the TTC? Some aspects are not in the hands of the TTC, as long as priority is given to the single-occupant SUVs.
Steve: The biggest problem with Transportation Services is that they are not aggressive enough about transit priority measures. Spending months or years working on designs for a single RapidTO corridor diverts attention from the many places where signal priority could be installed as a permanent aid to routine diversions, not just a few scheduled movements. As for MTO, that question is really for the Premier. Bloor West bike lanes got his attention because a Tory was slagging them in the election campaign.
LikeLike
In the very last slide you published, it appears to indicate that the MiWay “doors open” pilot will finally begin this year. Do you have any details on what this will entail and when it will begin?
Steve: No, I have not seen any details on that project.
LikeLike
Is there anything to show the saving from fully converting Line 1 to single operator working? Presumably operators cost/are paid more than CSRs and most other public facing positions, so one would expect some serious savings. Or did it just conveniently turn out to match the overall salary increases…?
Steve: The implementation of one person train operation was projected to save $14.6 million in the 2022 budget. An important point about subway budgets is that the on-train crew represents a fairly small part of overall staffing including a small army of maintenance works needed for the infrastructure which has no equivalent on surface routes. Station staff are part of this too regardless of whether they are called collectors or station managers. The CSAs are extra on top of this, as are the increased staff to deal with security issues.
LikeLike