
This article reviews the operation of 63 Ossington in September and October 2024. This route operates from Eglinton West station to Liberty Village with a peak period short turn at St. Clair through Oakwood Loop. Historically, the route is a patchwork of former streetcar, later trolleybus, lines including Oakwood and Dovercourt. Service south of King Street runs through Liberty Village, formerly an industrial neighbourhood, and now a dense residential area.
Until early October, the route’s south end extended west to Sunnyside Loop replacing part of 504 King during road and track construction. On October 6, it resumed the standard looping through Liberty Village. With the new schedule, service was reduced during several periods, although in some cases not by much.
General observations:
- Departures from Sunnyside Loop were irregular, but headways improved east of Roncesvalles because buses took their layovers on King Street, not at the loop.
- Service was less reliable on the route while the extension operated, but improved with the return of the normal south end loop. Demand on the Sunnyside extension was rather light.
- Ossington is a fairly short route (9km one way), but it is subject to some of the same problems as longer routes. Headway reliability is poor during some periods even though there are three locations where buses could be dispatched on a regular spacing: from the two terminals, and at Ossington Station.
- There is some evidence of headway management at Ossington Station to restore proper bus spacing, but the effect is short-lived.
Note to readers: This article and a previous one about 129 McCowan North arose from reader suggestions, and I used them for detailed presentations of tracking data in various formats. Both routes had new schedules in early October, and this provided a chance to look at how service changed for the better or worse. For some, this will be a case of “TL/DR”, and I understand that this sort of thing is not everyone’s cup of tea. To those of you who love the detail, happy reading!
Service Summaries
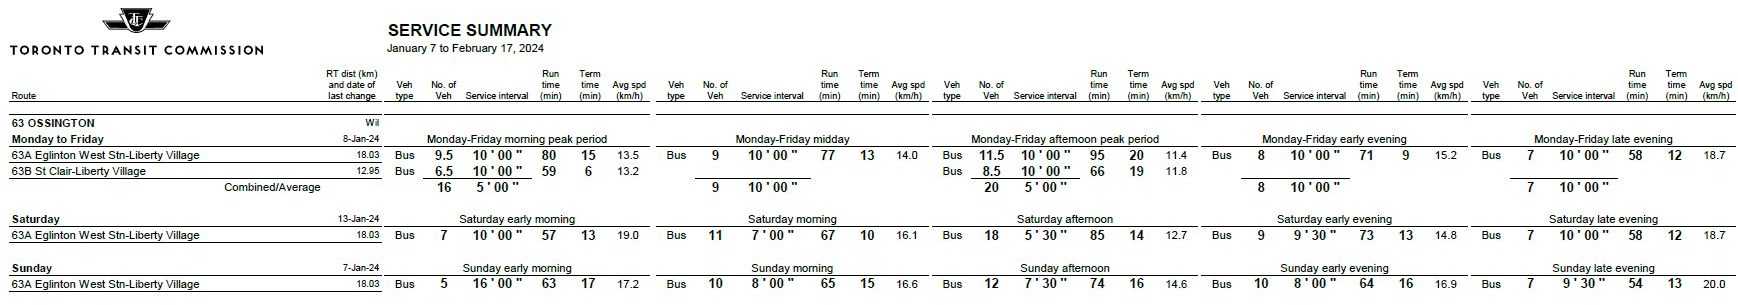
The service summaries for September and October show the planned headways, but some of the information is inaccurate. The route is shown as going to “Liberty Village” in September, but the route length corresponds to the extended version to Sunnyside Loop. The same length is shown in October when the route really was only to Liberty Village, but pre-extension summaries show that the correct length is about 18km, not 24km, round trip.
This renders the scheduled speeds for all entries in October incorrect. Buses are not travelling at an average speed of over 20km/hr. This does not affect any of the analysis here.
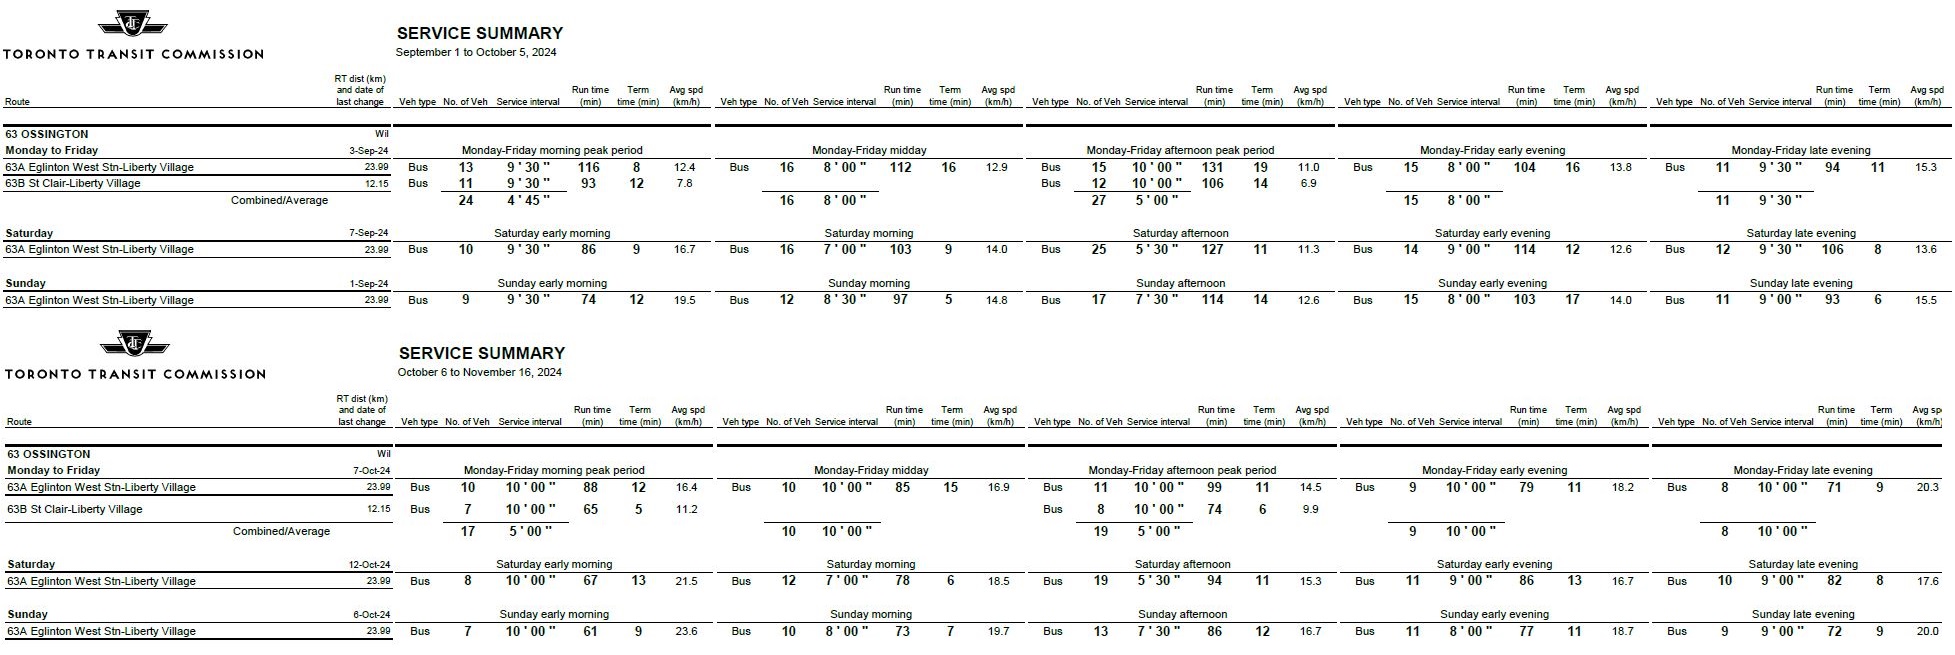
Here is the summary for January 2024 showing the correct mileages and scheduled speeds for the schedules as they then were. Note that there have been changes in headways and running times between January and October.
Monthly Details
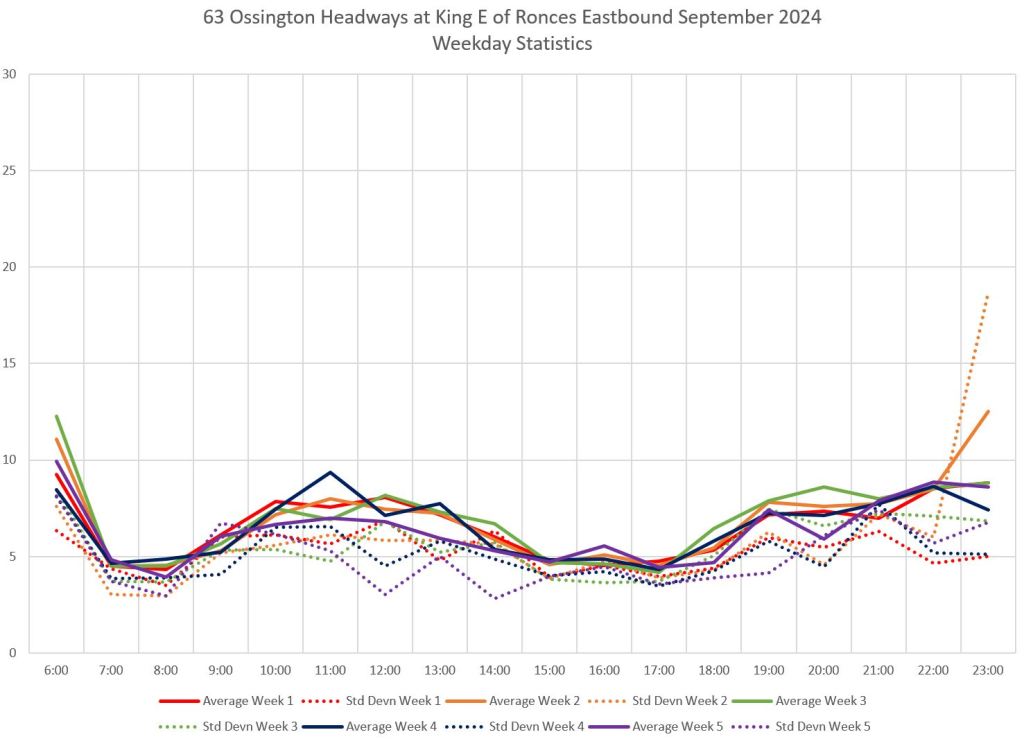
Eastbound from Sunnyside Loop and from Dufferin
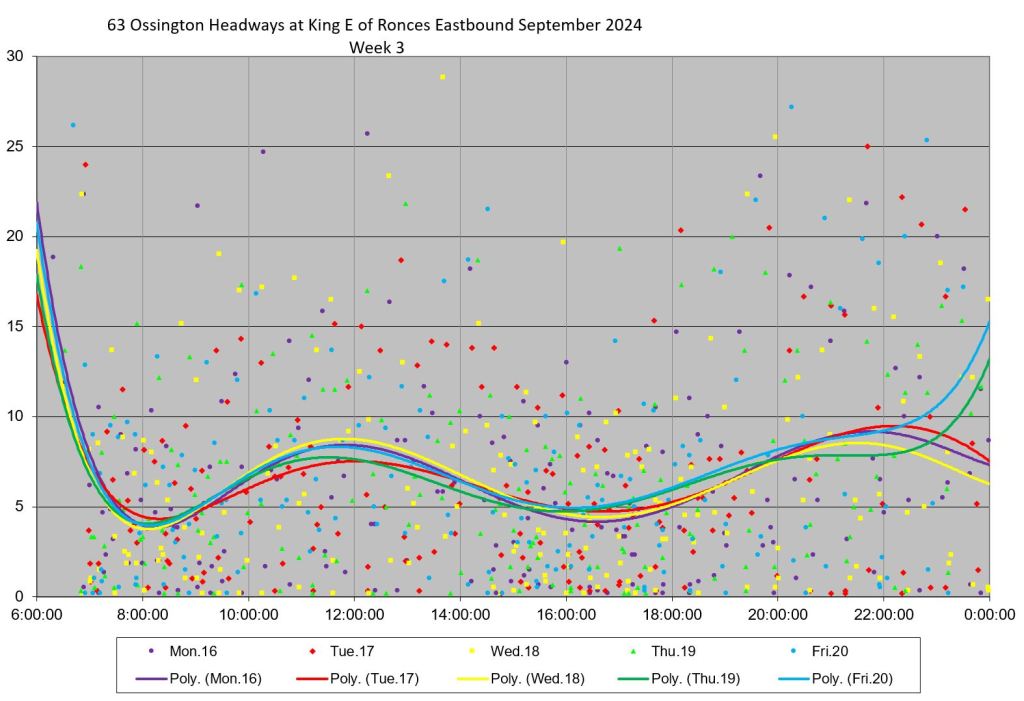
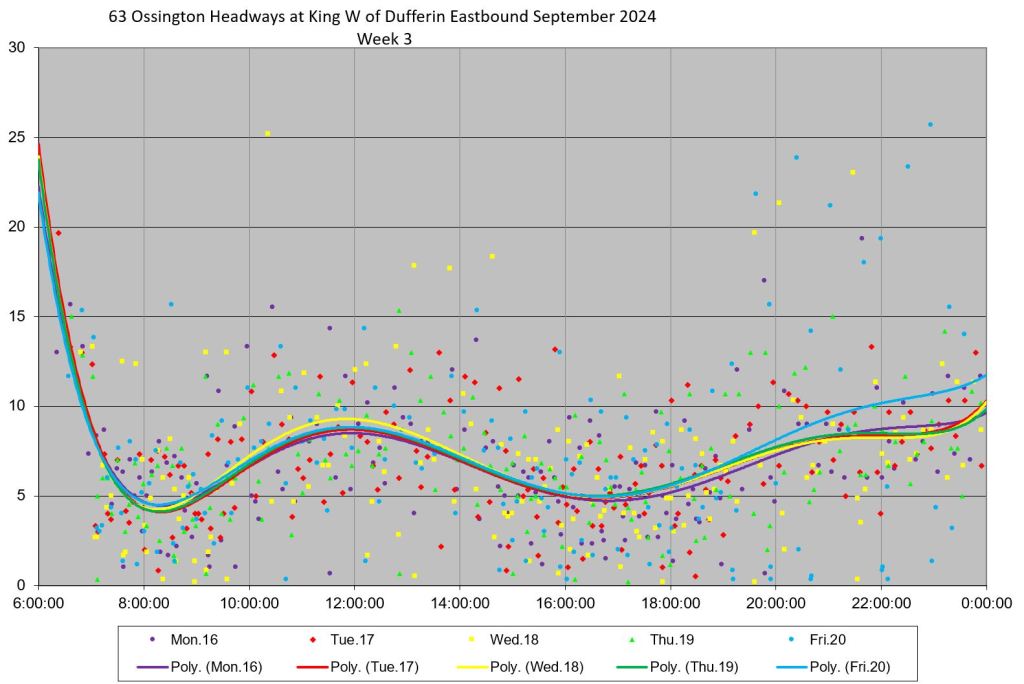
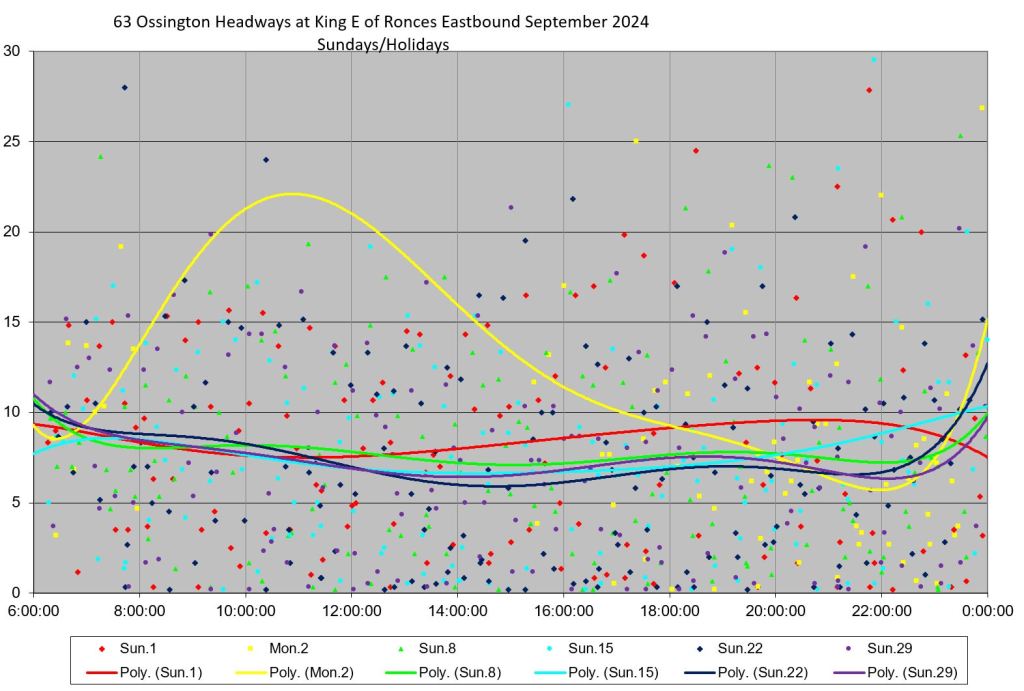
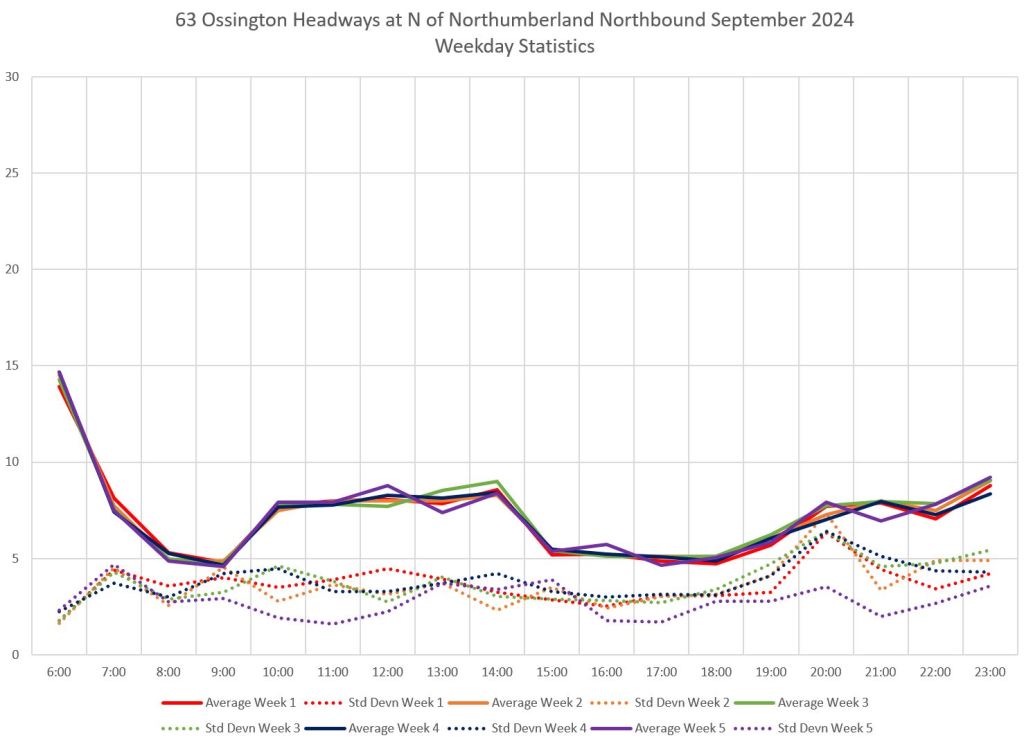
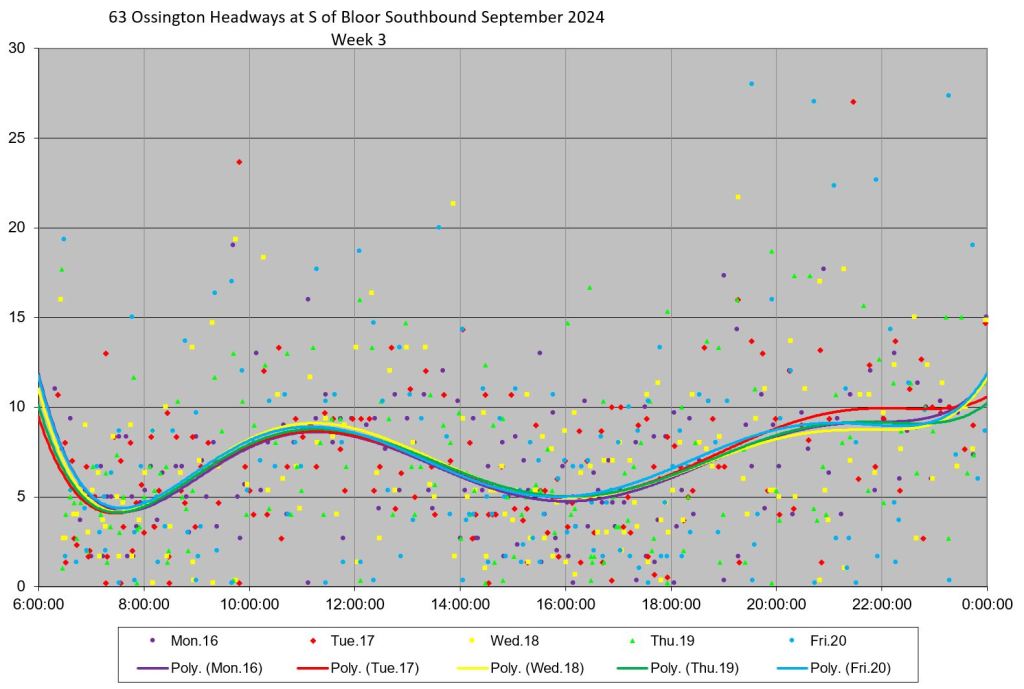
The data for September show the headways crossing Roncesvalles are scattered over a wide range from 0 to 15 minutes, with several well above that. Standard deviation values (dotted, upper left) are high indicating a large amount of bunching through the month. The week 3 data shows many trips on very short headways. As we will see later (see the operating chart for September 18), the buses took their layovers on King east of Roncesvalles. This is east of the screenline I used to measure headways. The service at Dufferin was better behaved because bus spacing was more regular east of the layover point.
This is an example of a case where measuring performance right at the terminal actually shows worse service than was actually provided because the more regular departures were east of the official “end of the line”.
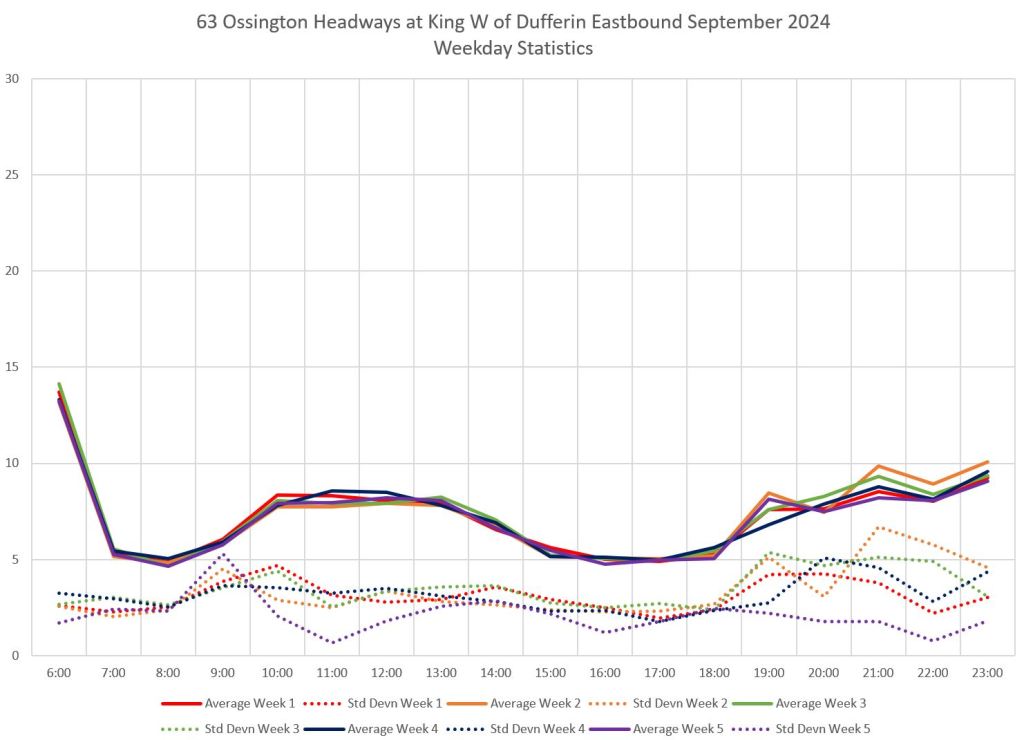
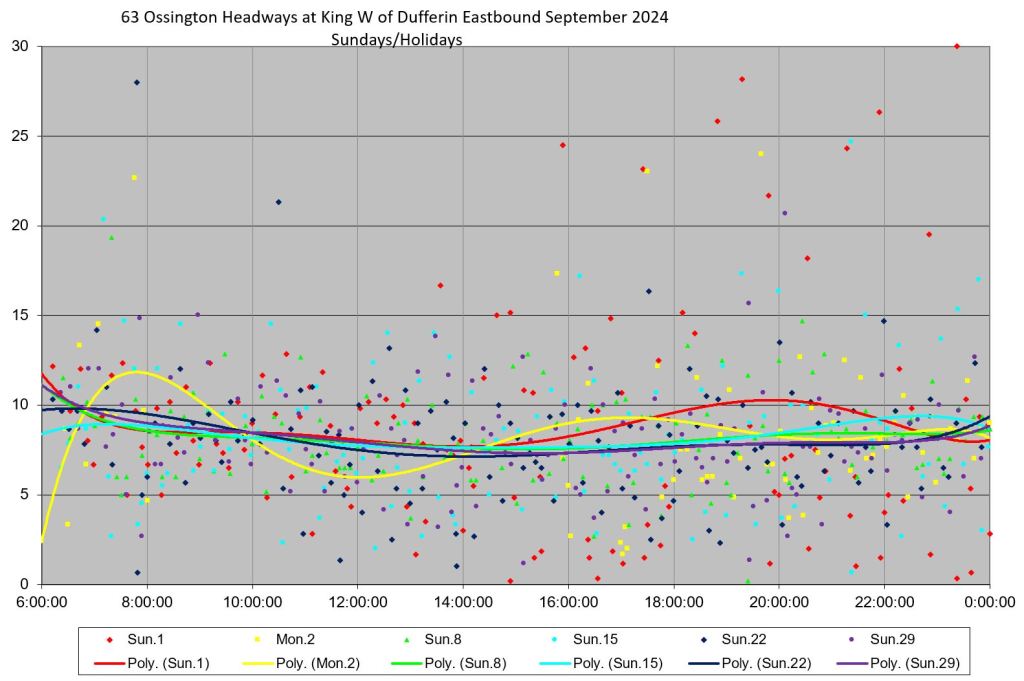
The data for headways at Dufferin shows weekly averages that lie in a tight band, and lower standard deviation values showing less scatter in the data. This is also visible in week 3 chart on the right where the data points lie closer to the trend lines and the scheduled headways. Bunching still occurs, but less of it.
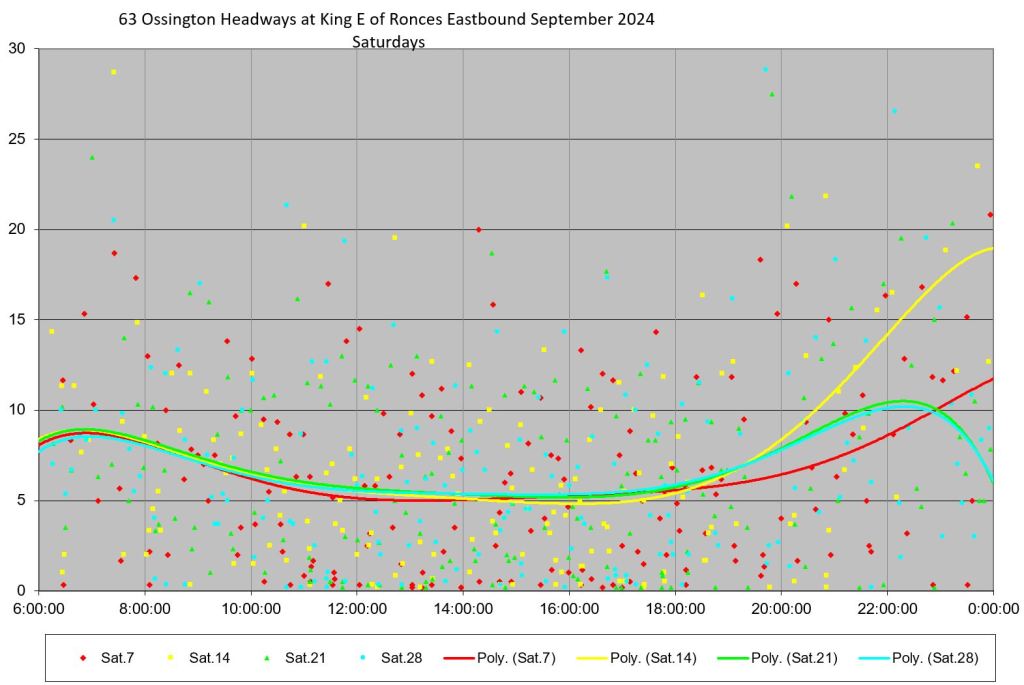
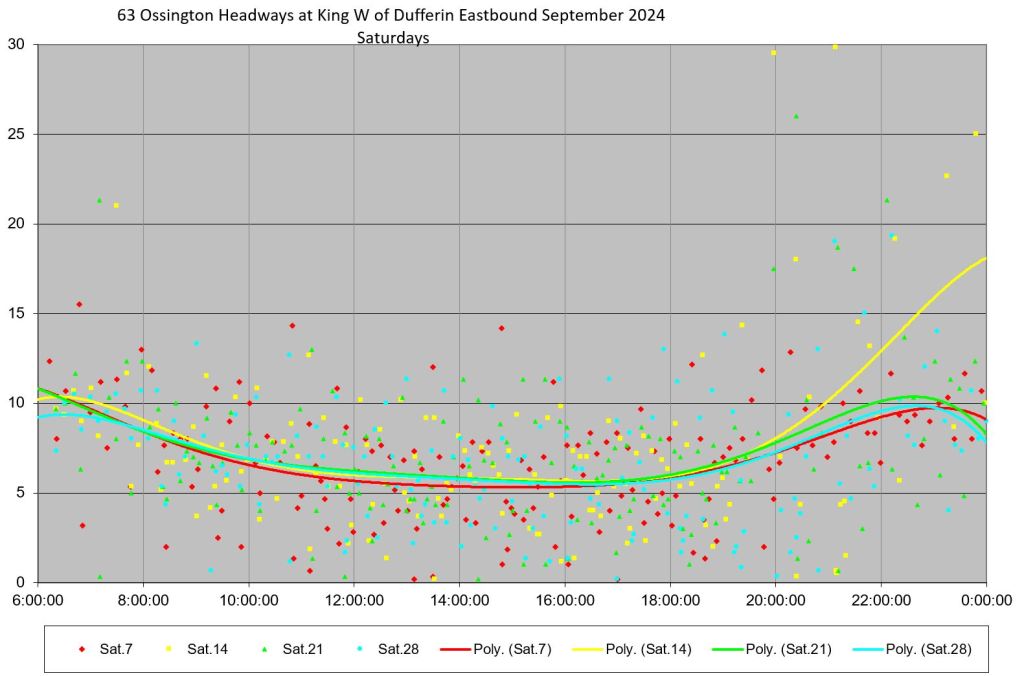
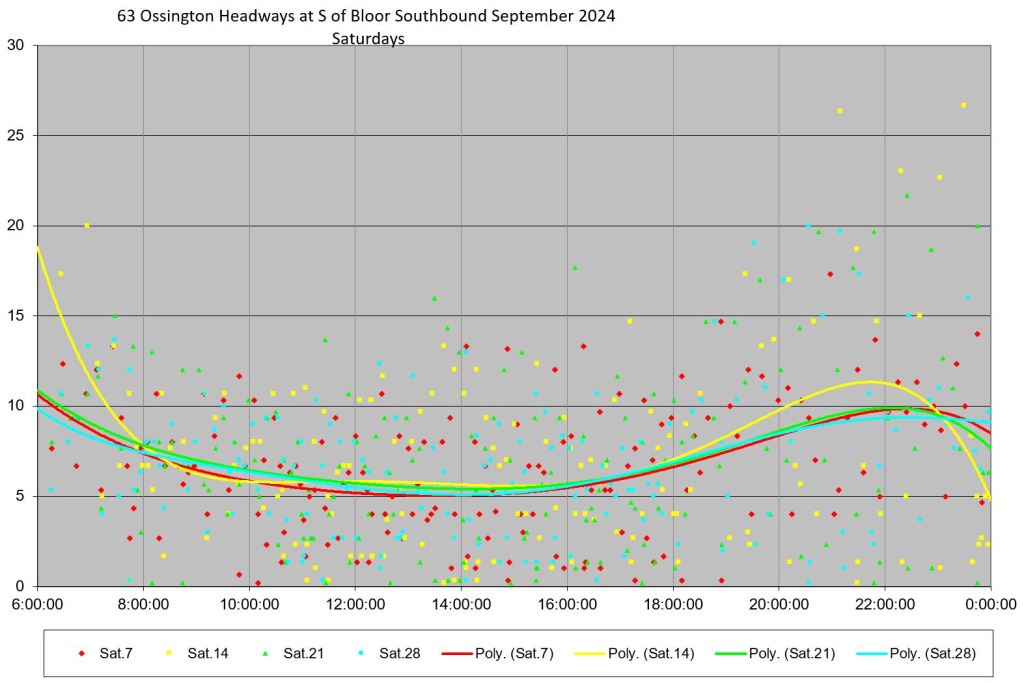
Weekend service shows the same pattern. The large hump on September 2 at Roncesvalles is due to the Labour Day parade when service on 63 Ossington did not operate through to Sunnyside creating a very wide gap.
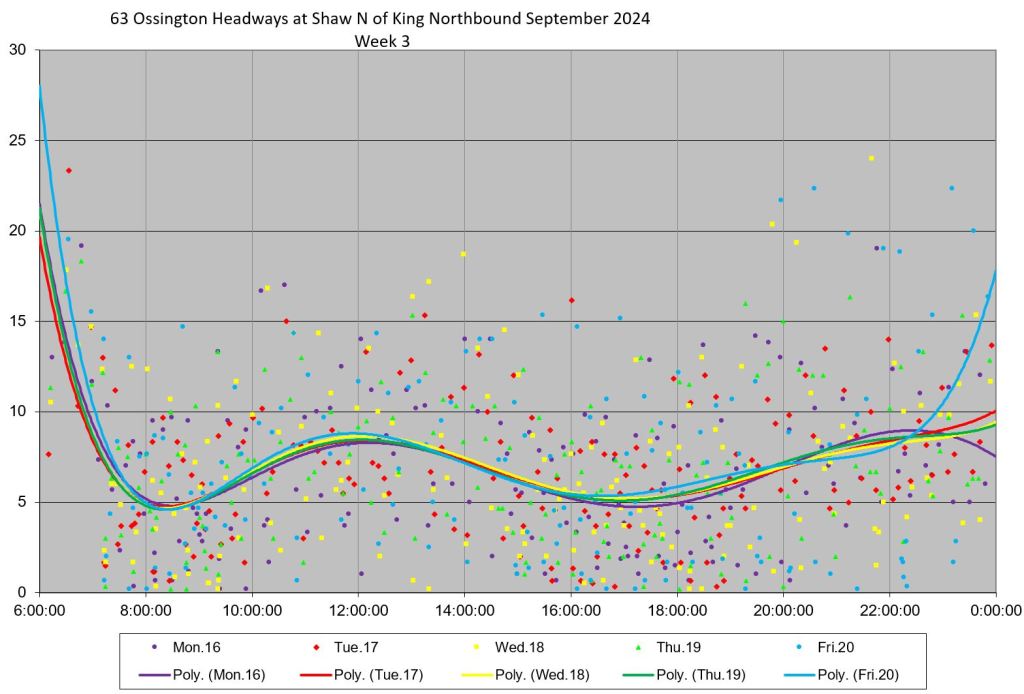
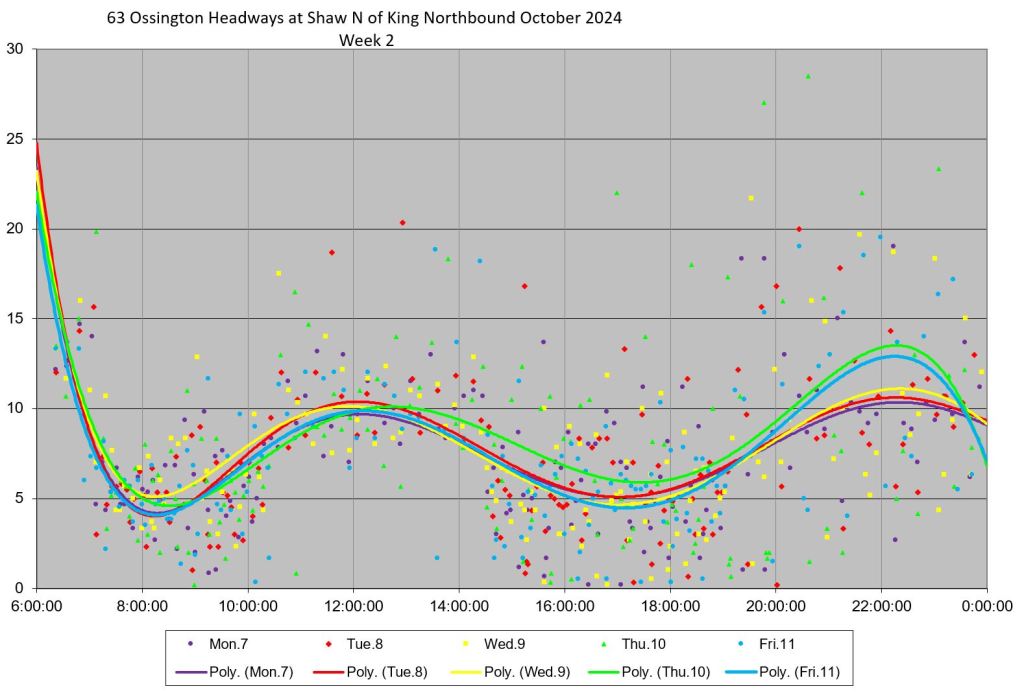
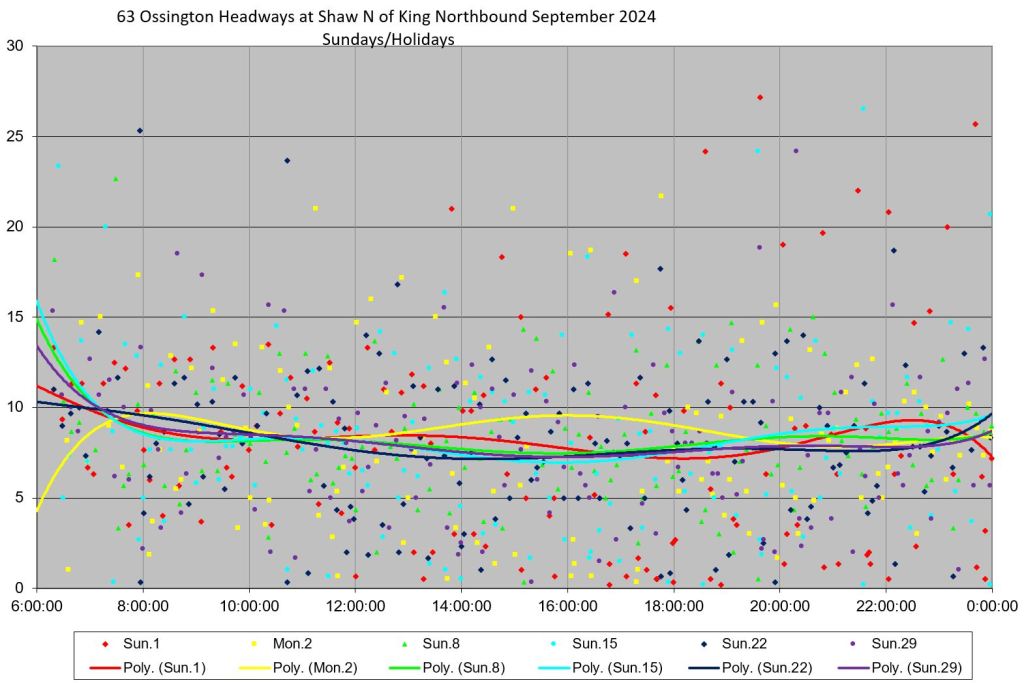
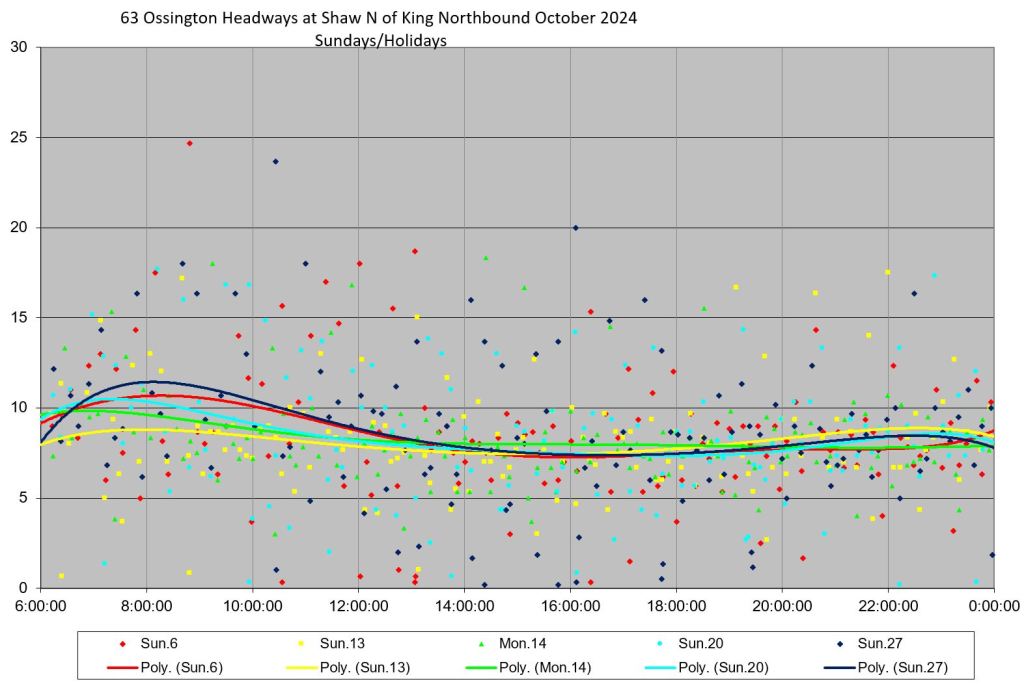
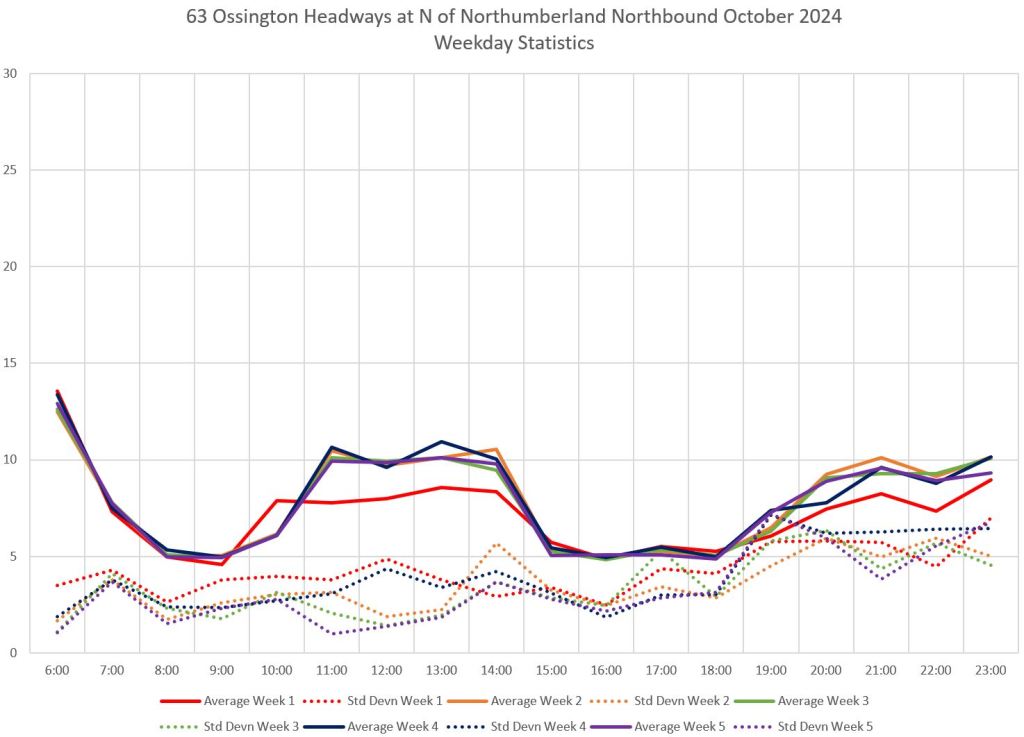
Northbound on Shaw from King
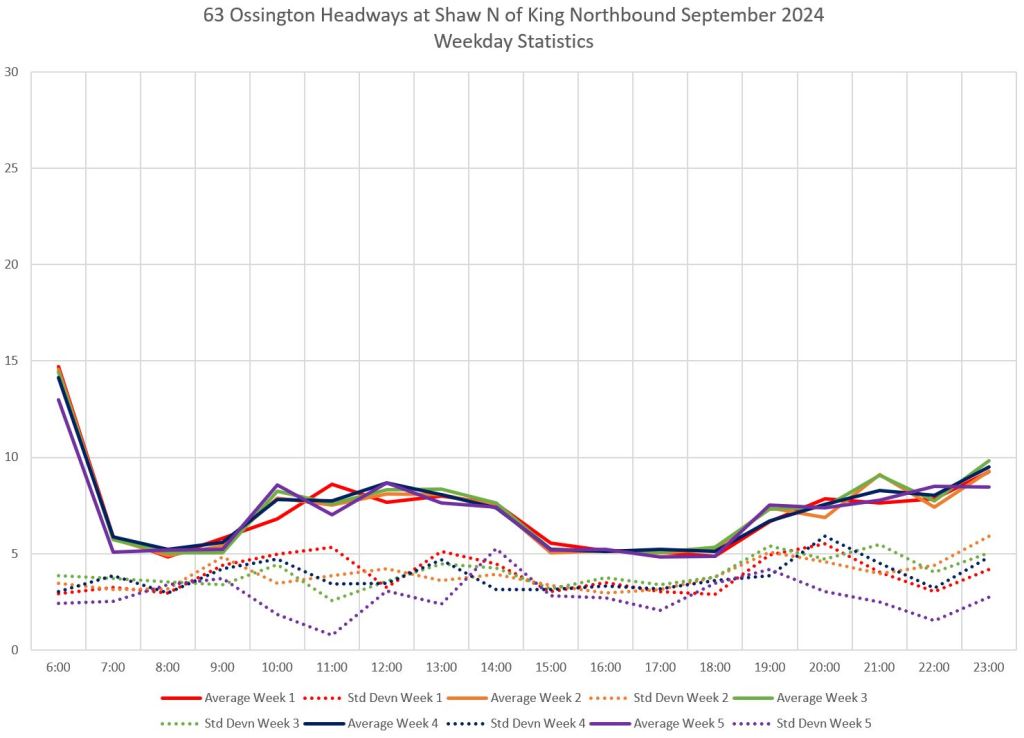
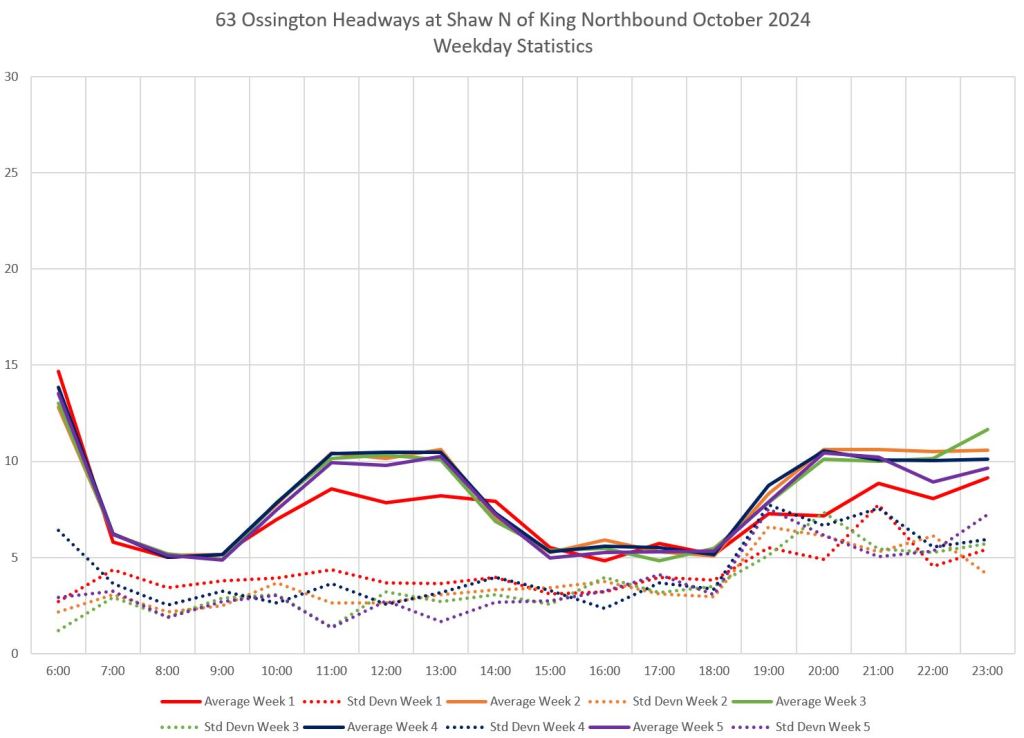
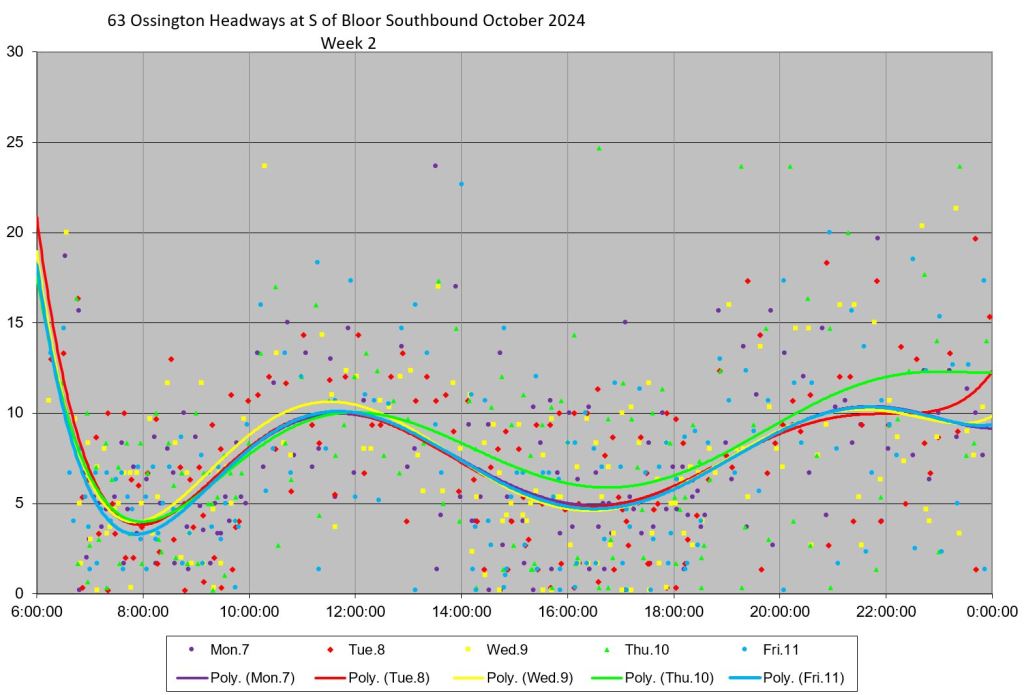
The charts here contrast September (left) and October (right) data for a screenline at King and Shaw. This is a common point to both versions of the route on the northbound trip.
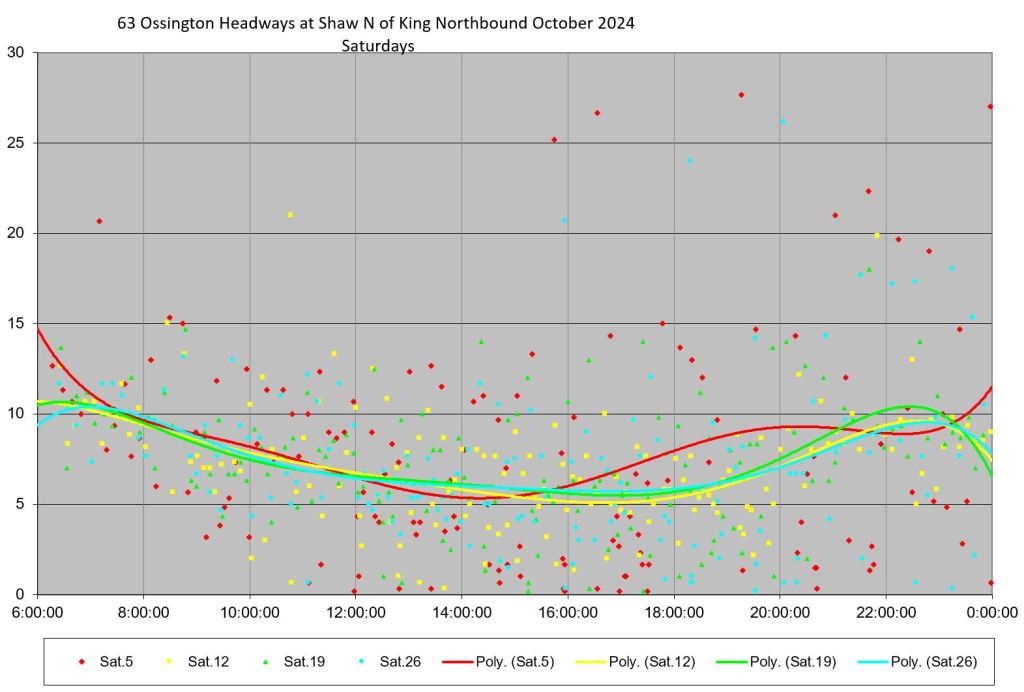
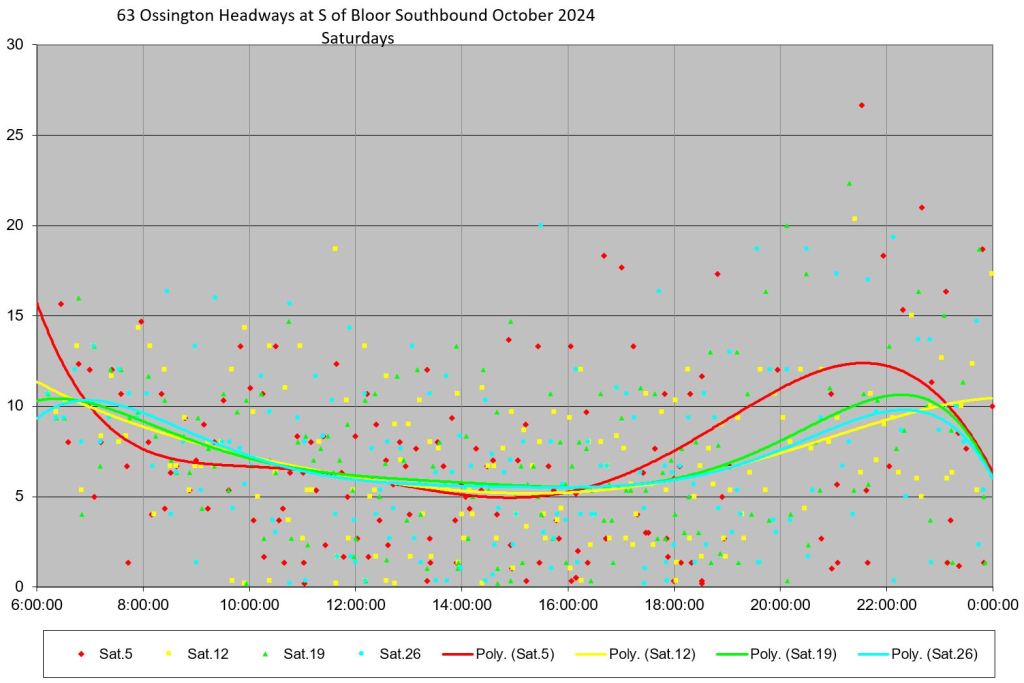
In October, week 1 (red in the chart of average headways, upper right) is on the Sunnyside Schedule, whereas other weeks follow the restored standard loop in Liberty Village via Atlantic Avenue and King. Saturday October 5 was affected by severe traffic congestion near King & Dufferin during the late afternoon and early evening.
Comparing headways for mid-September with the first week of the standard route, the improvement in reliability is evident in less scattered values and fewer points near the x-axis (bunching).
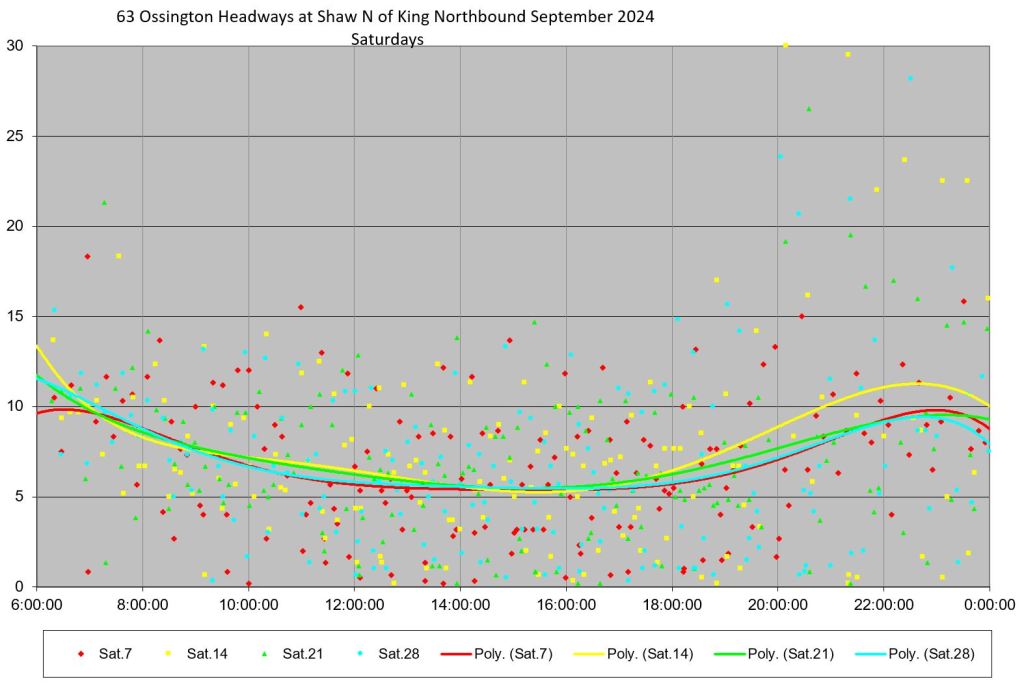
The weekday improvement is reflected to some extent on weekends, but not as strongly.
Northbound from Ossington Station
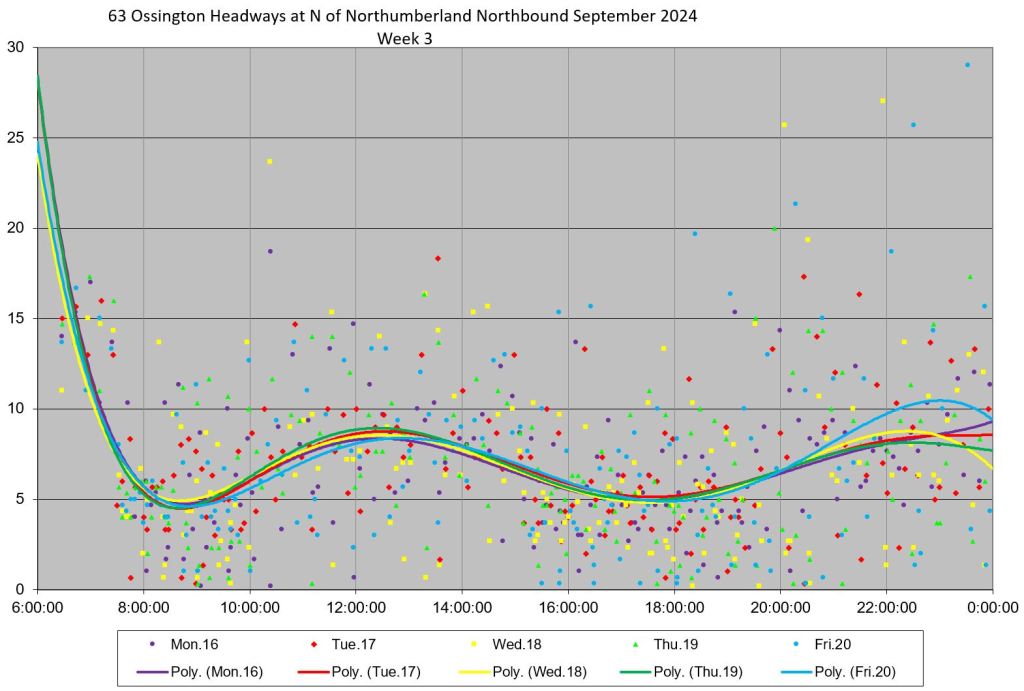
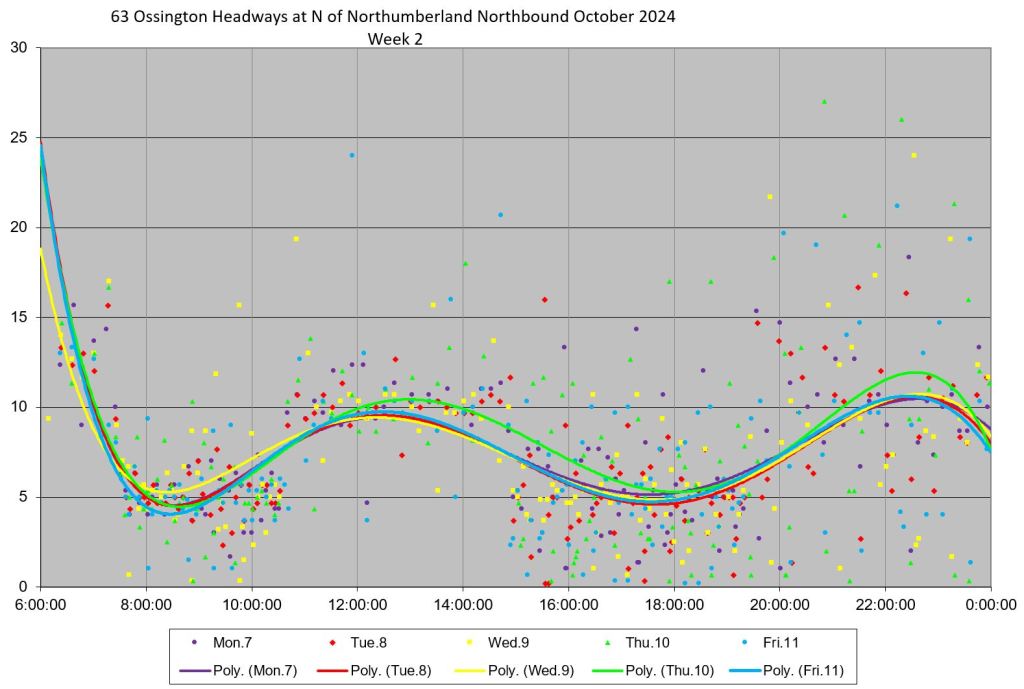
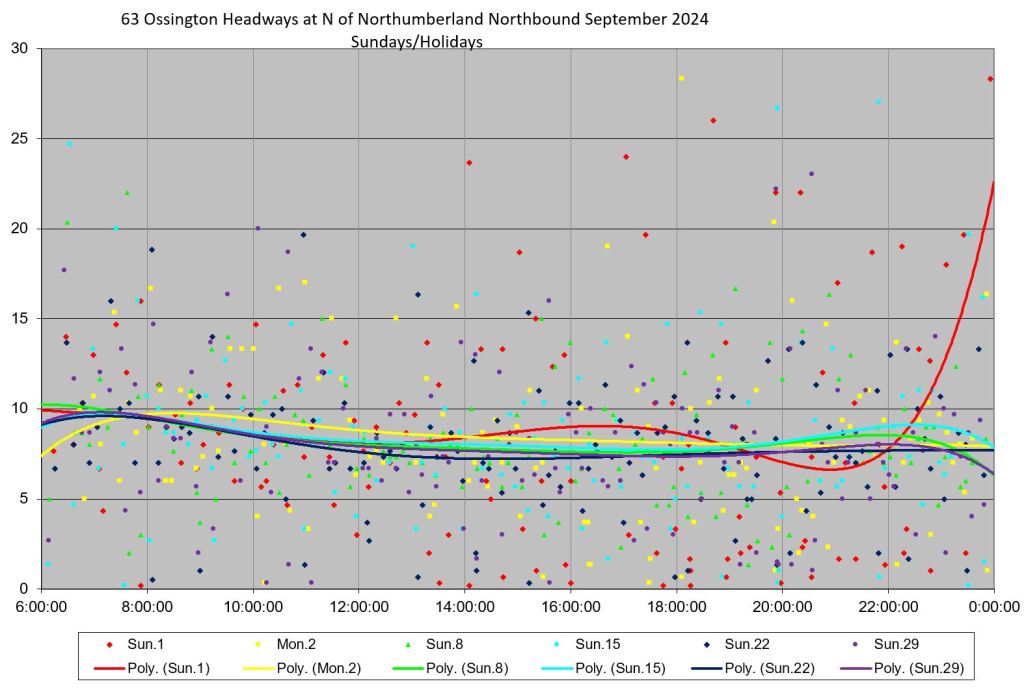
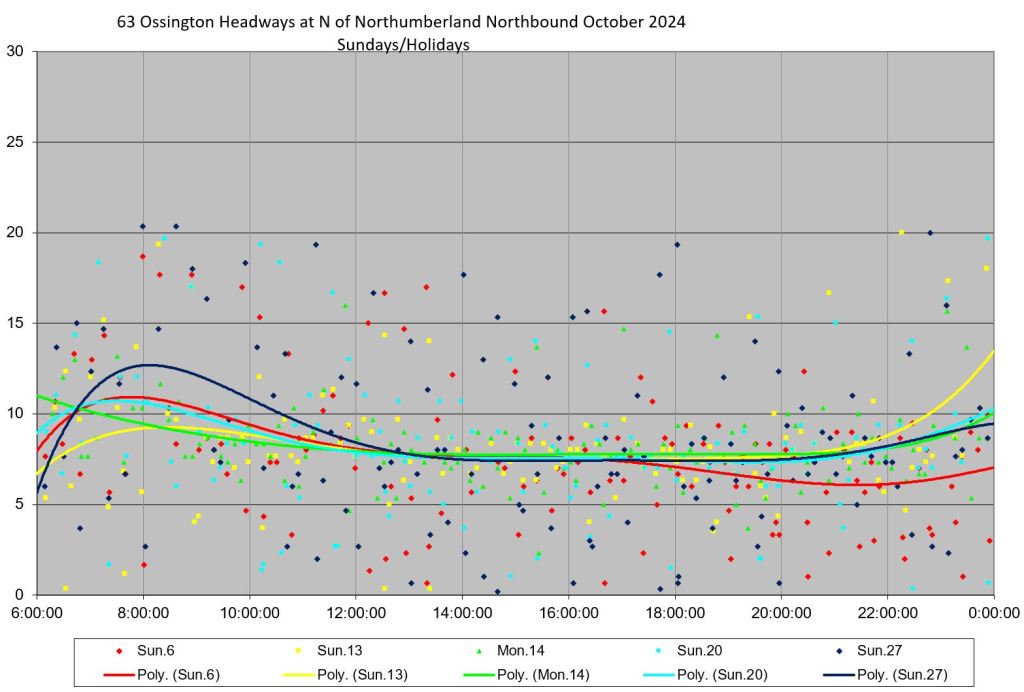
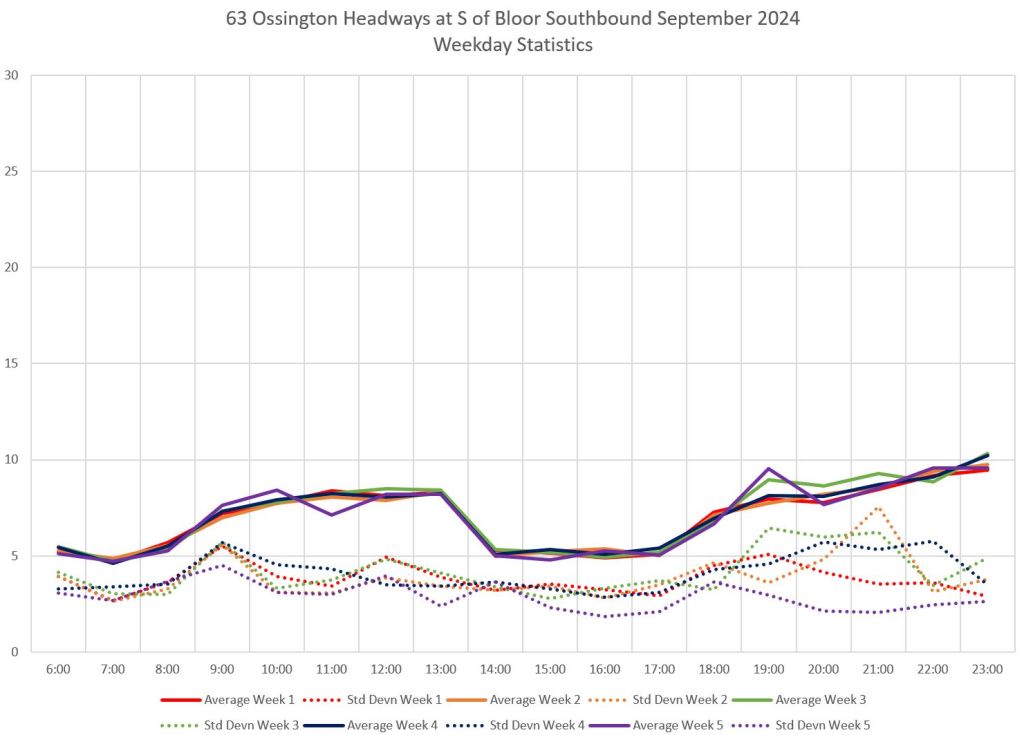
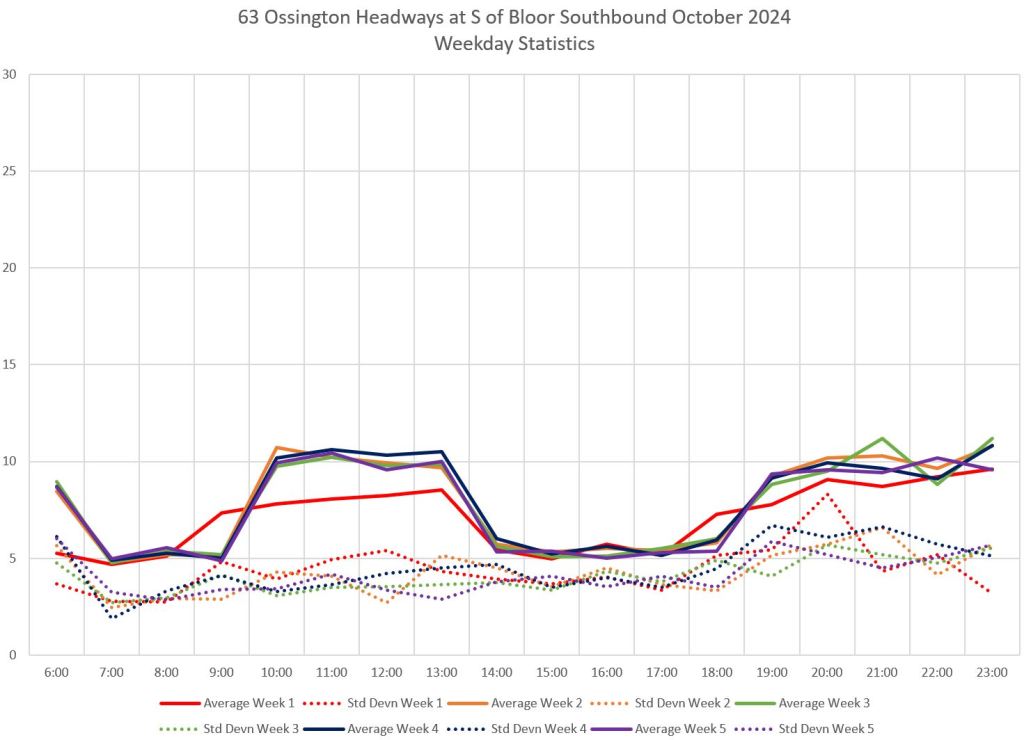
Leaving Ossington Station northbound there is a marked difference in the scatter of weekday headways between September and October, particularly at midday. Even though the scheduled service is less frequent, it is more reliable. However, PM peak and evening headways still extend over a wide range.
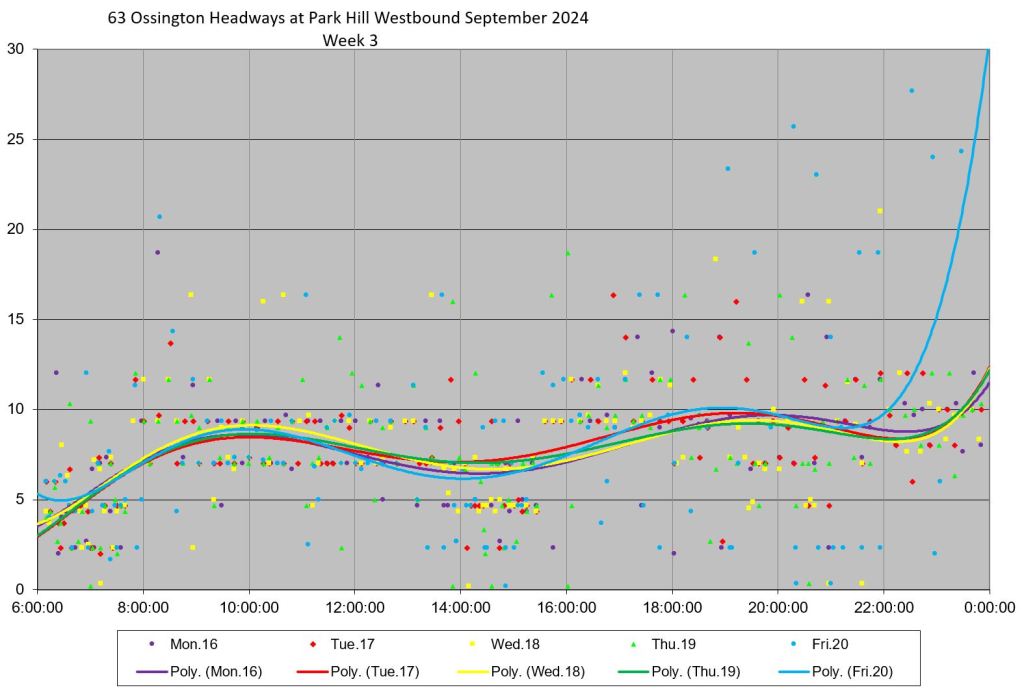
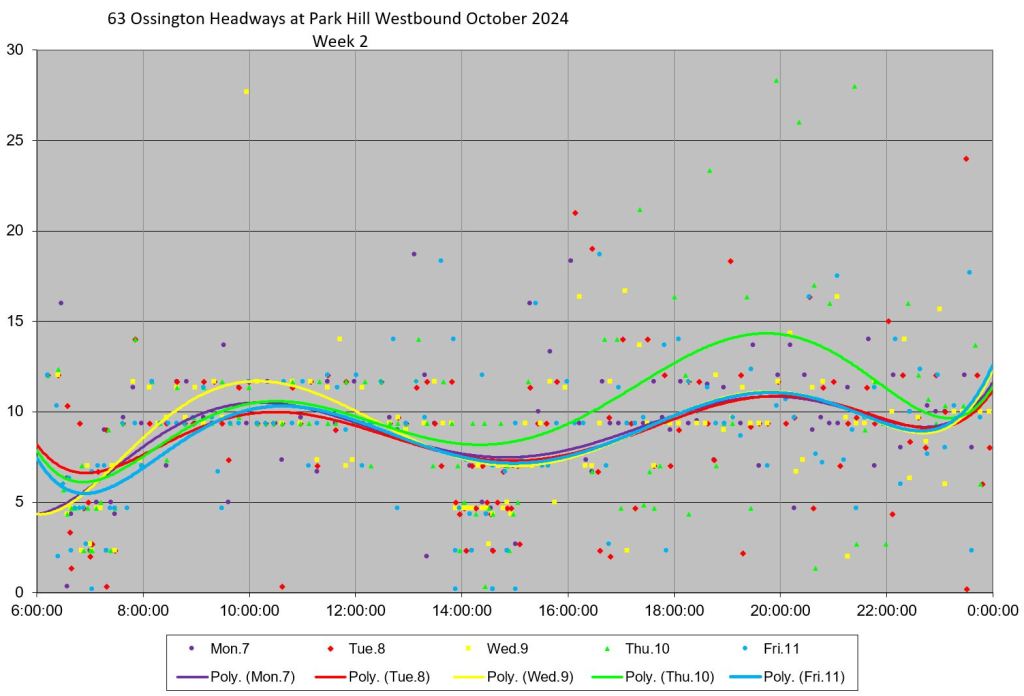
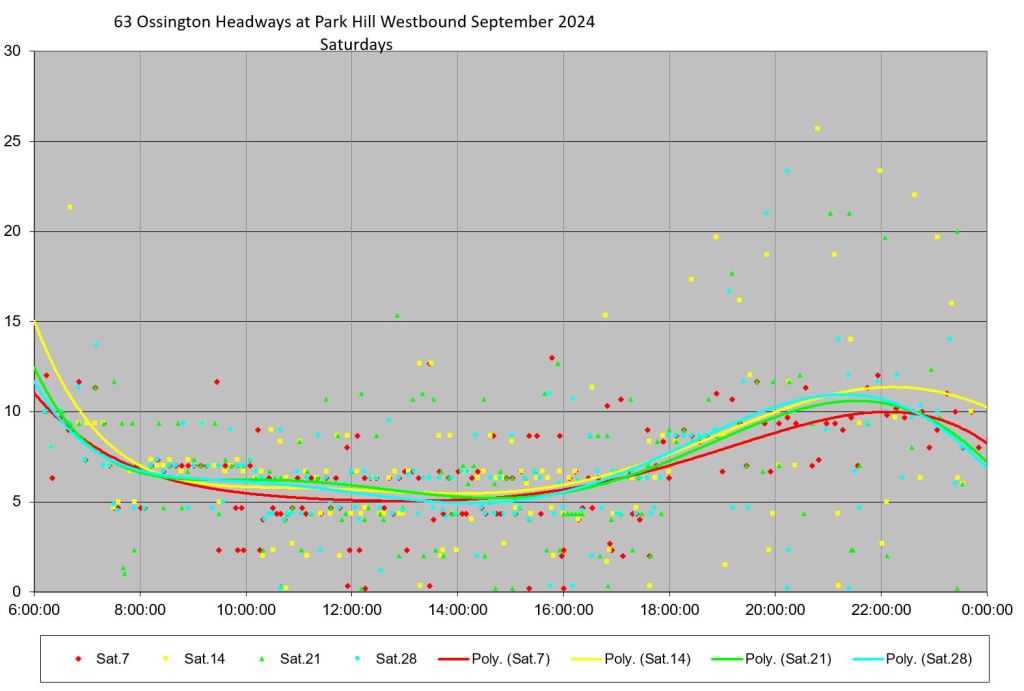
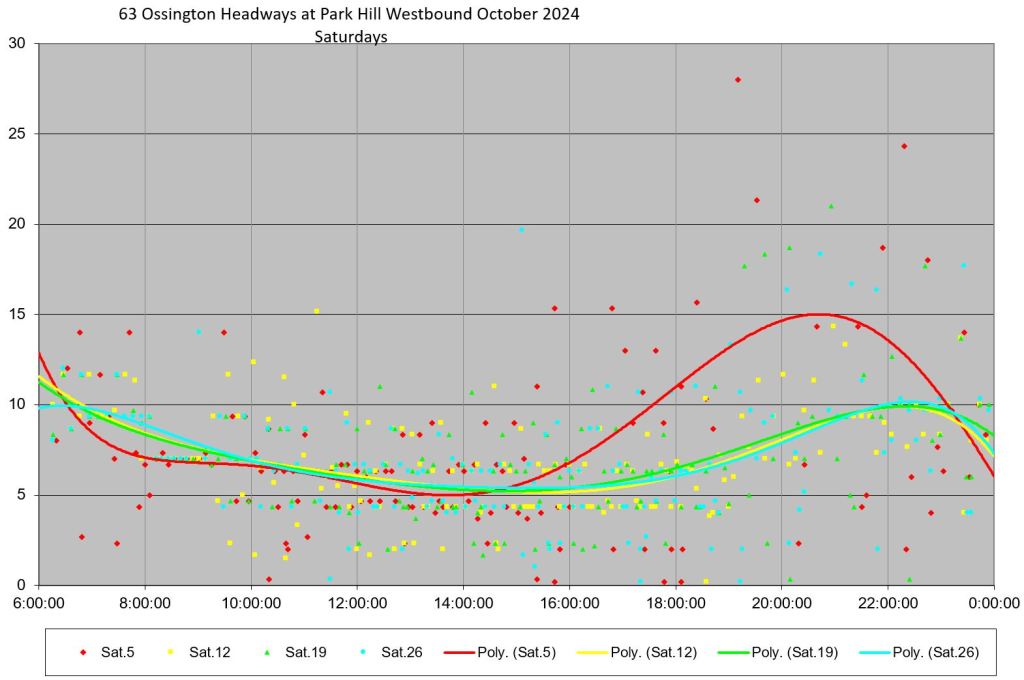
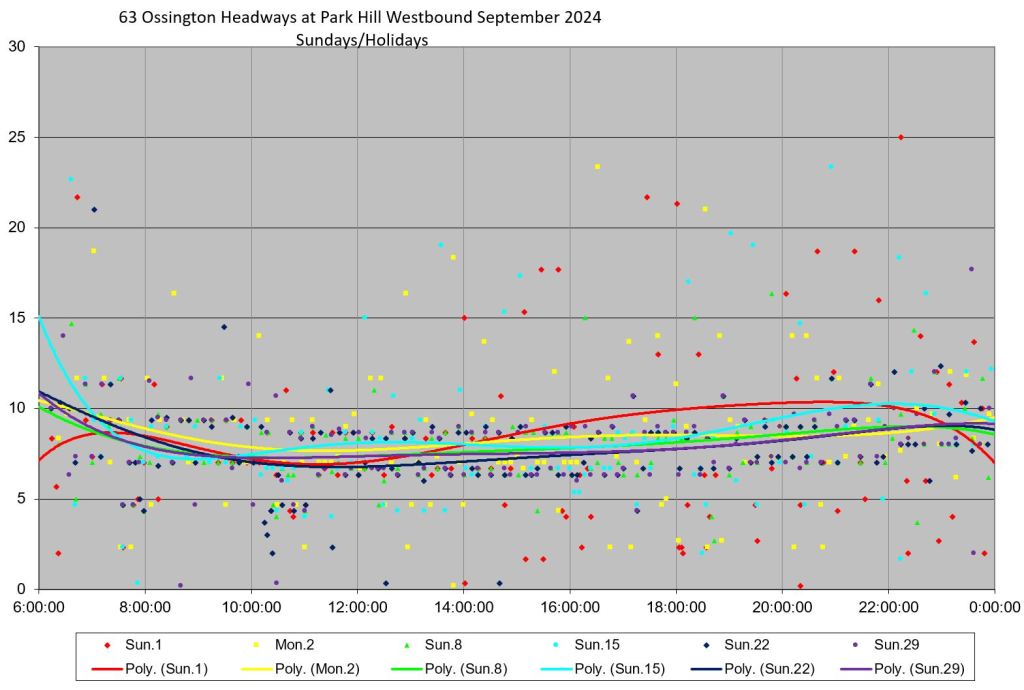
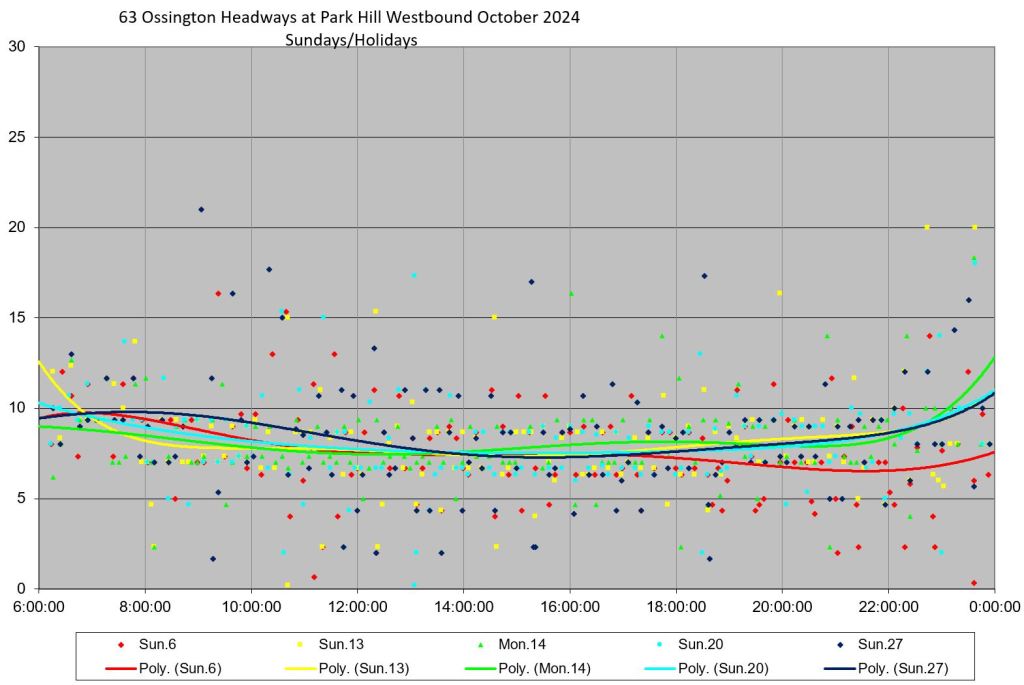
Southbound from Eglinton West Station
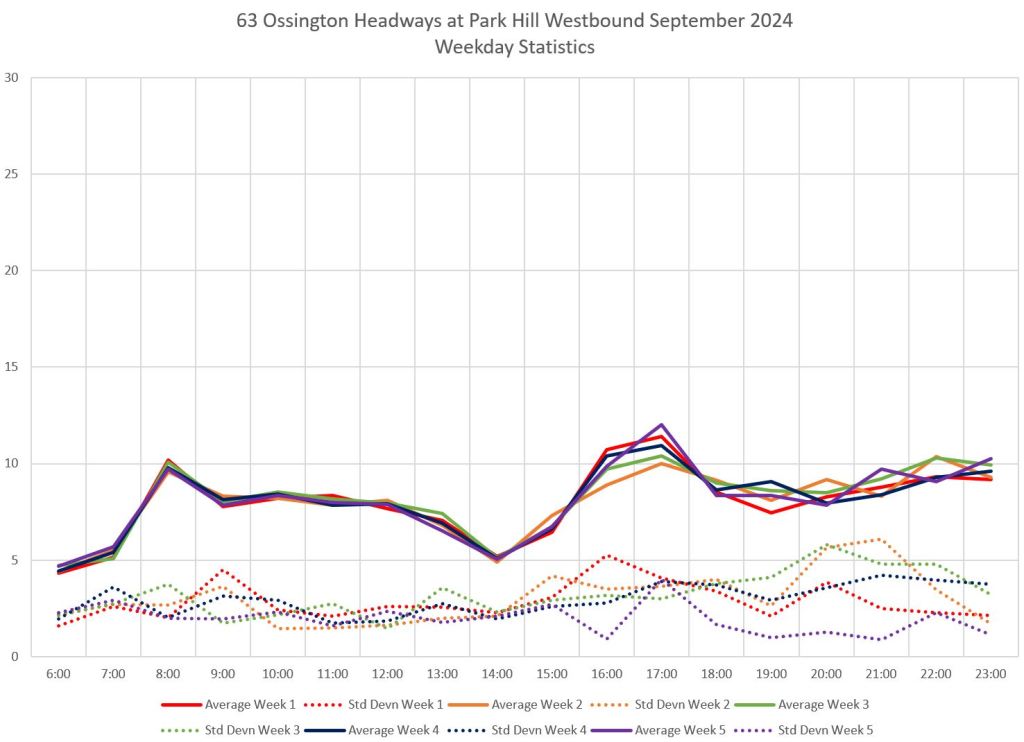
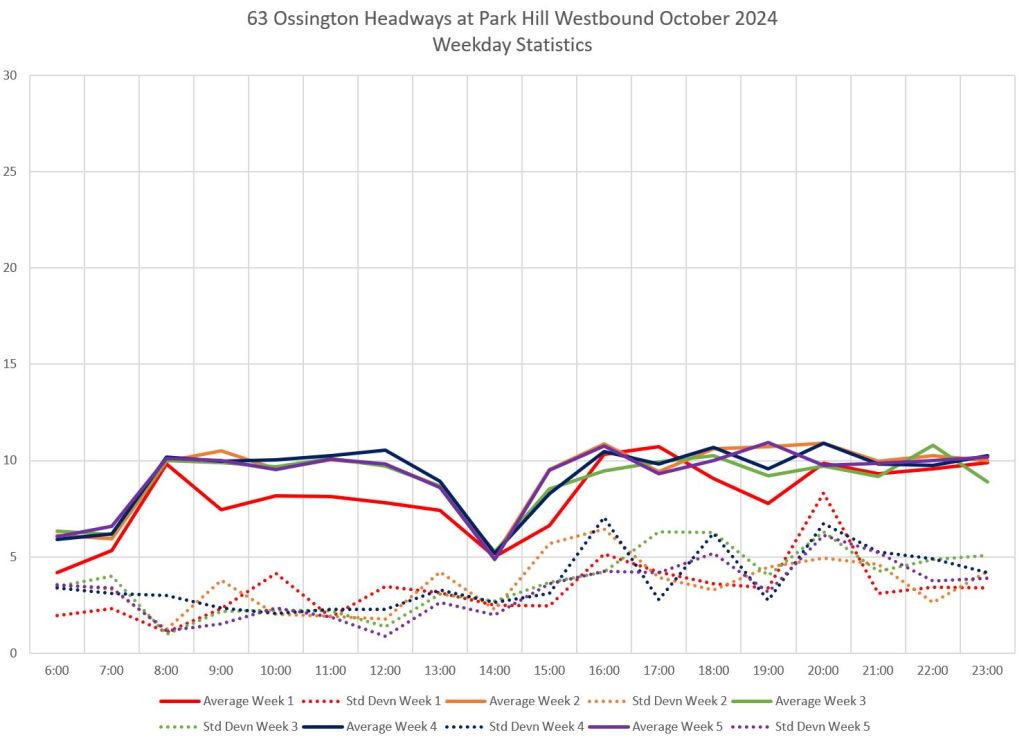
Service from Eglinton West Station is measured at Park Hill, west of the station, to eliminate any effects from bus movements within the station itself. The headway values lie in horizontal bands because the traffic signal at the Allen Expressway off ramp marshalls buses into multiples of the cycle time.
Southbound from Ossington Station
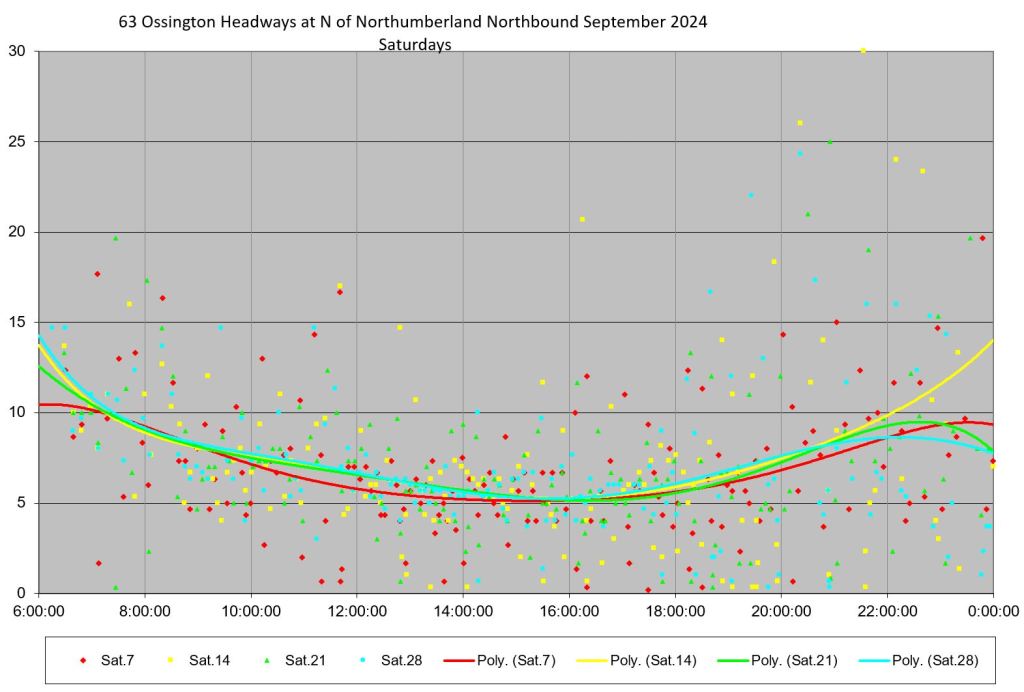
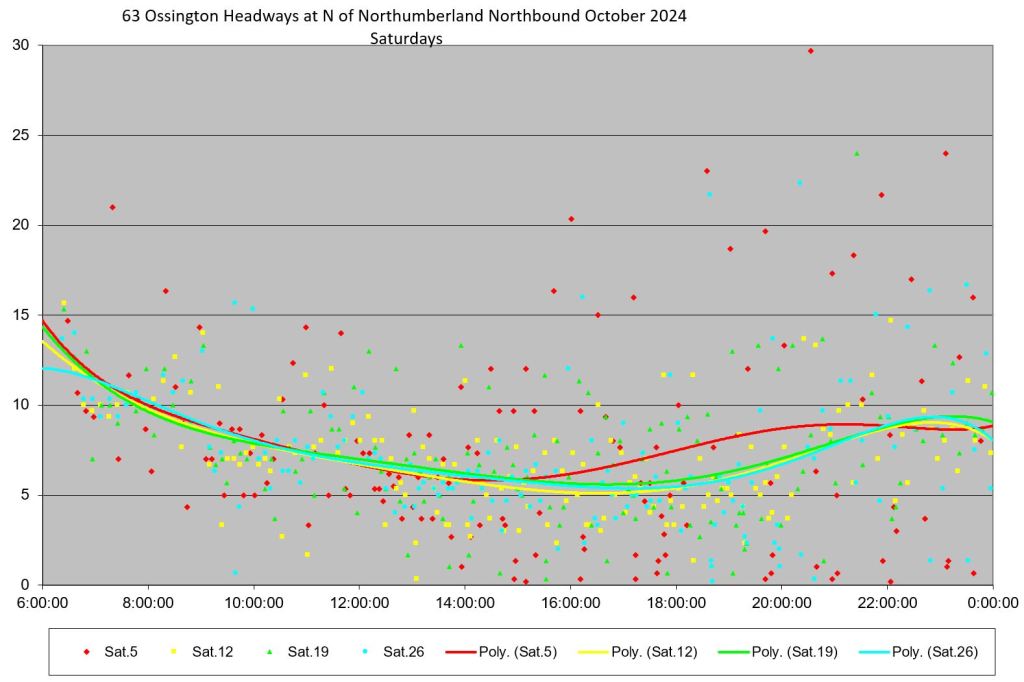
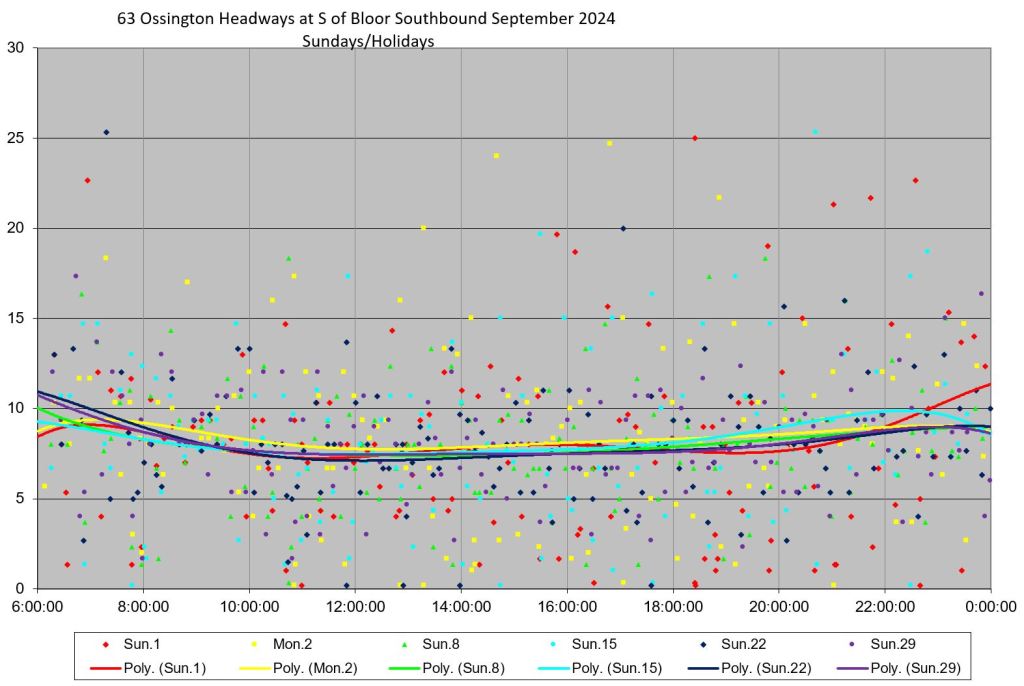
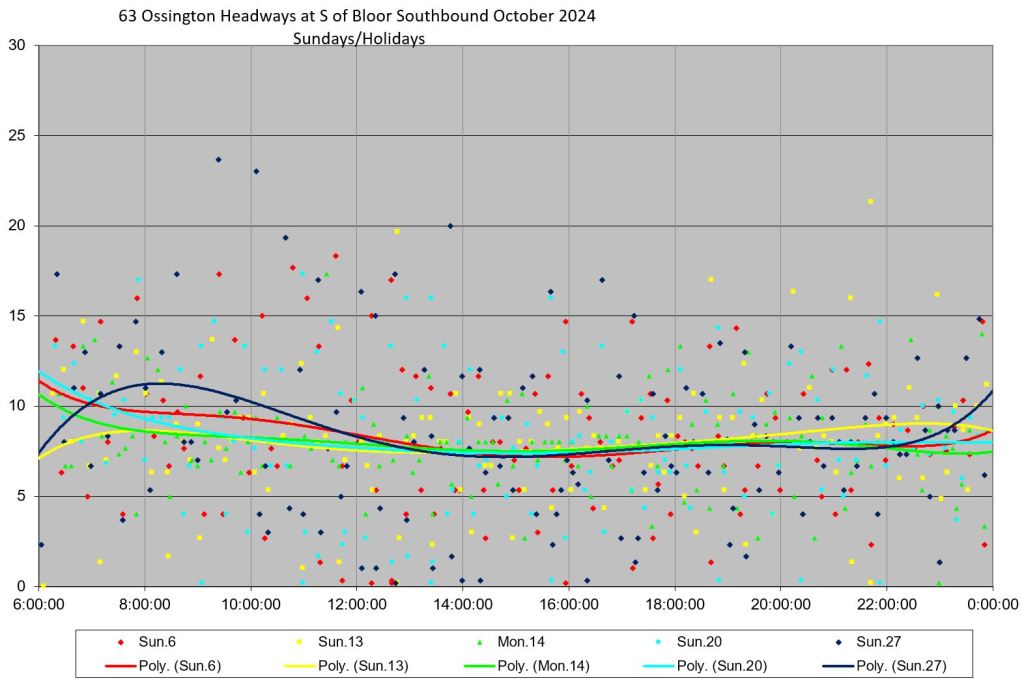
As with the northbound service here, weekday midway headways show less bunching, but otherwise headways are scattered over a wide range. On weekends there is little change. This is not surprising because the north end of the route is unchanged between the two months.
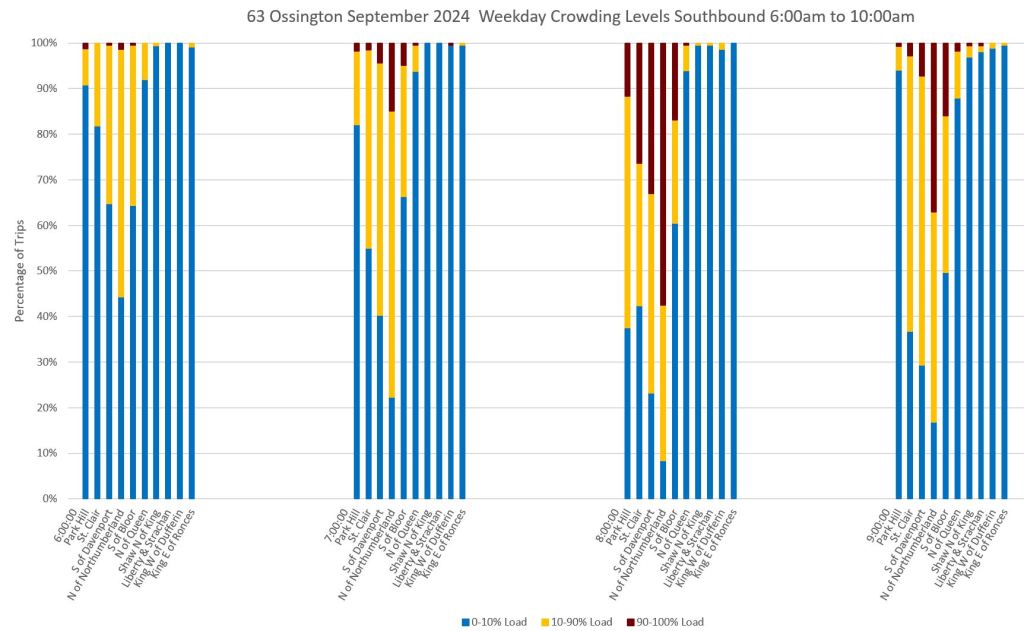
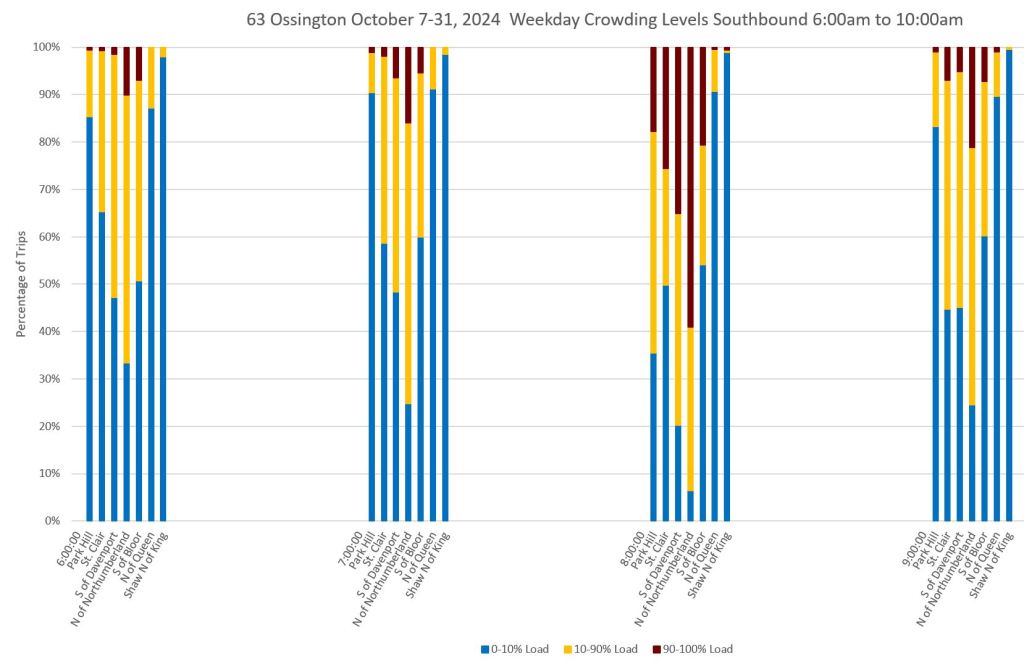
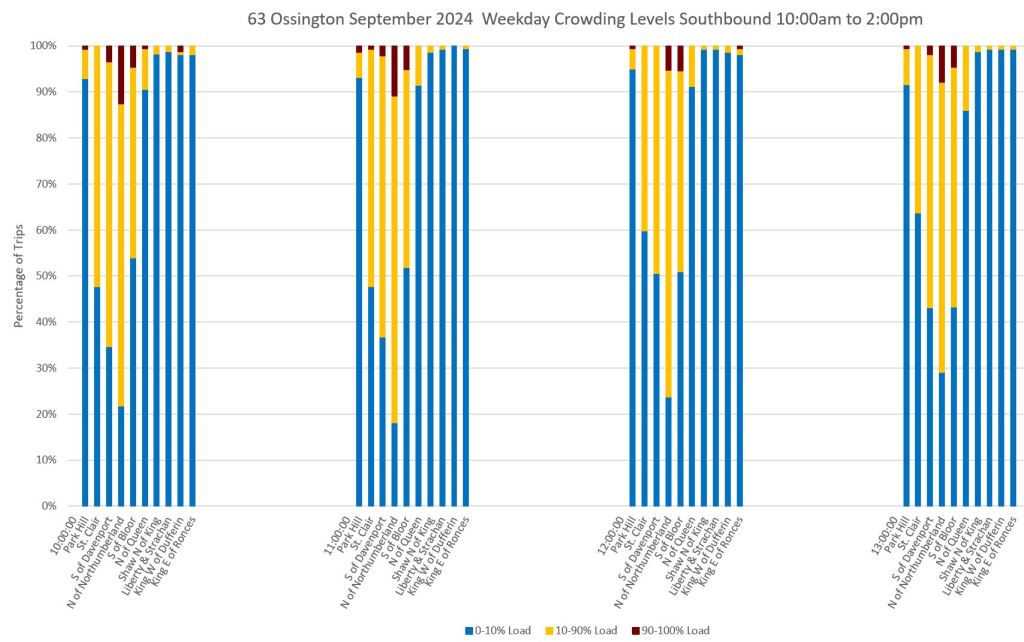
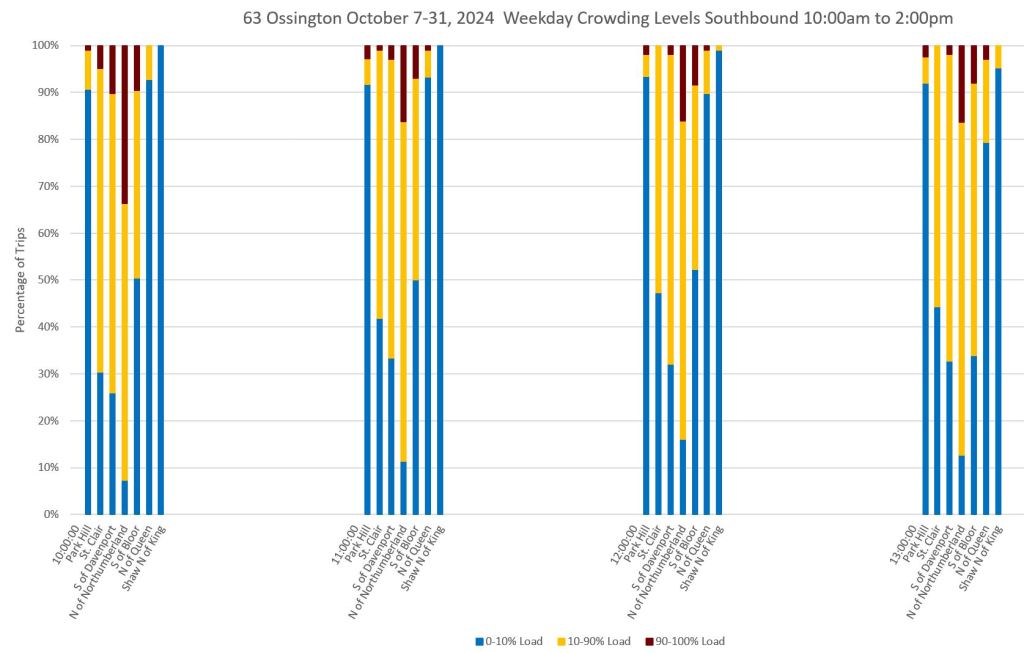
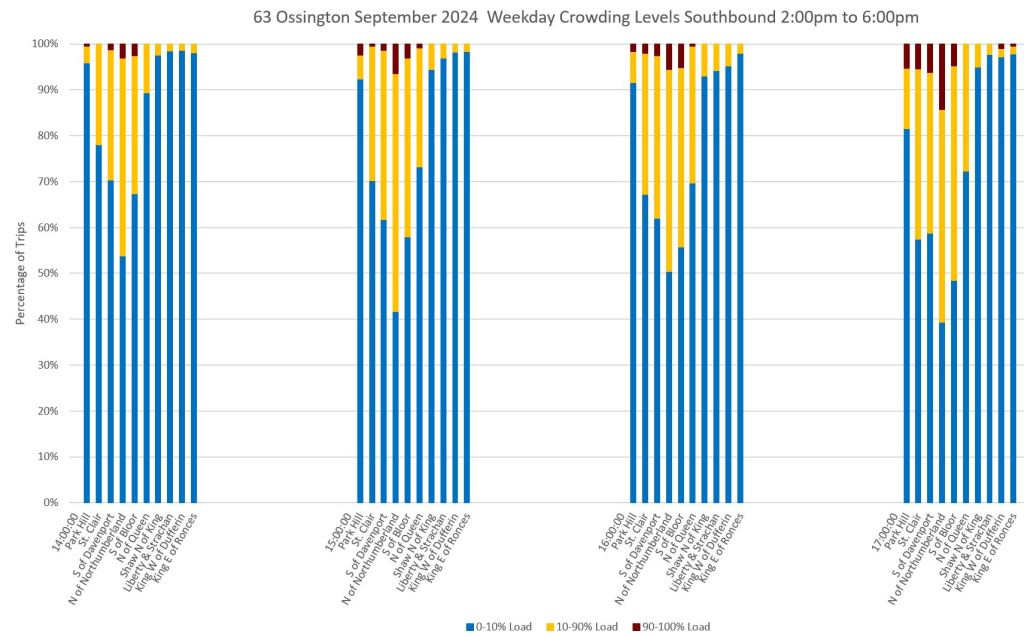
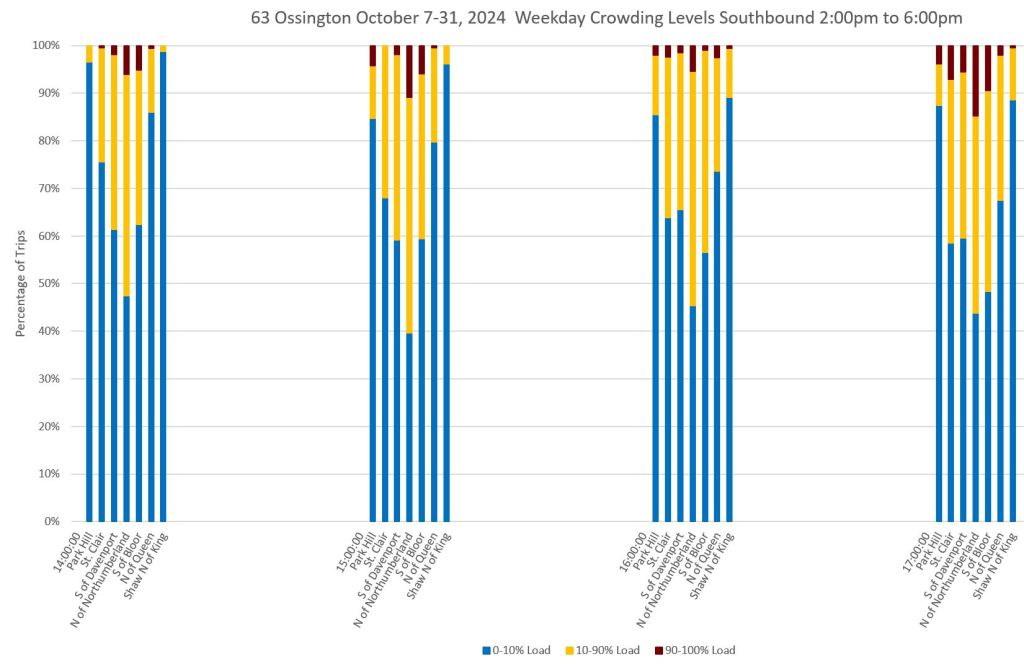
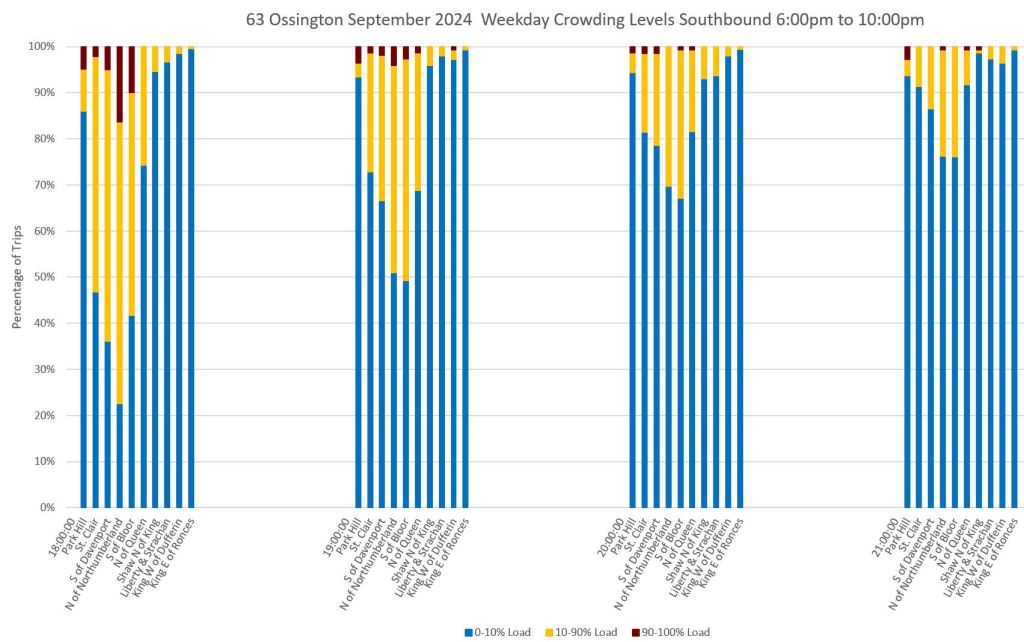
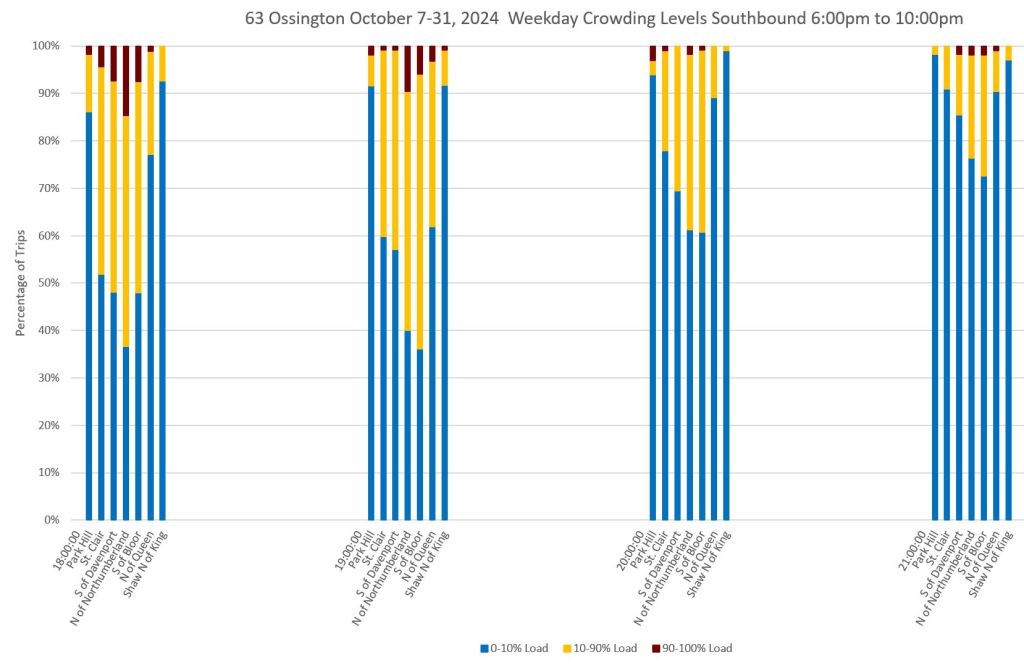
Crowding
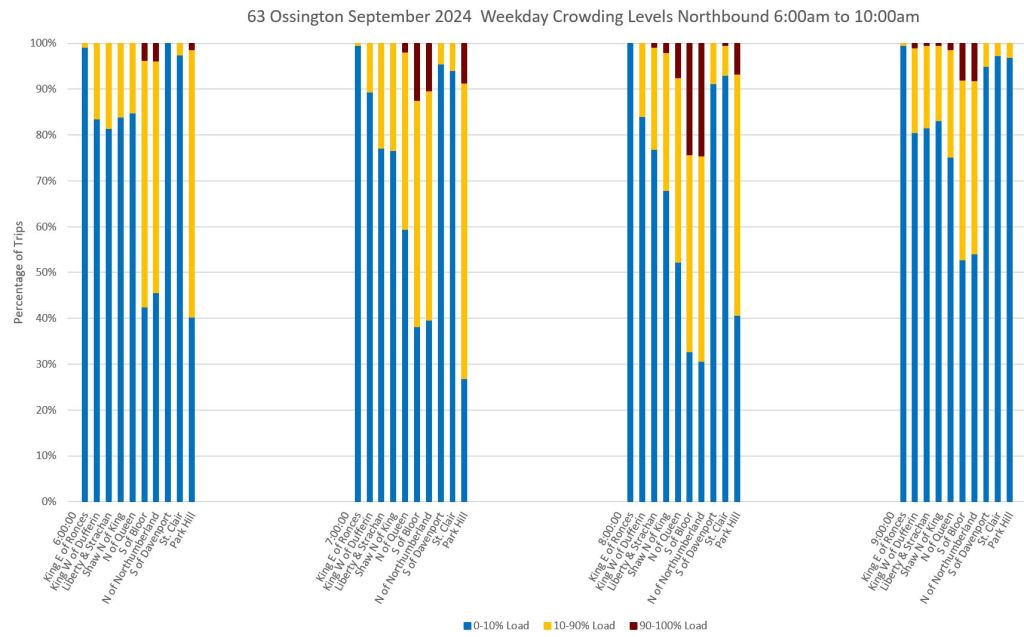
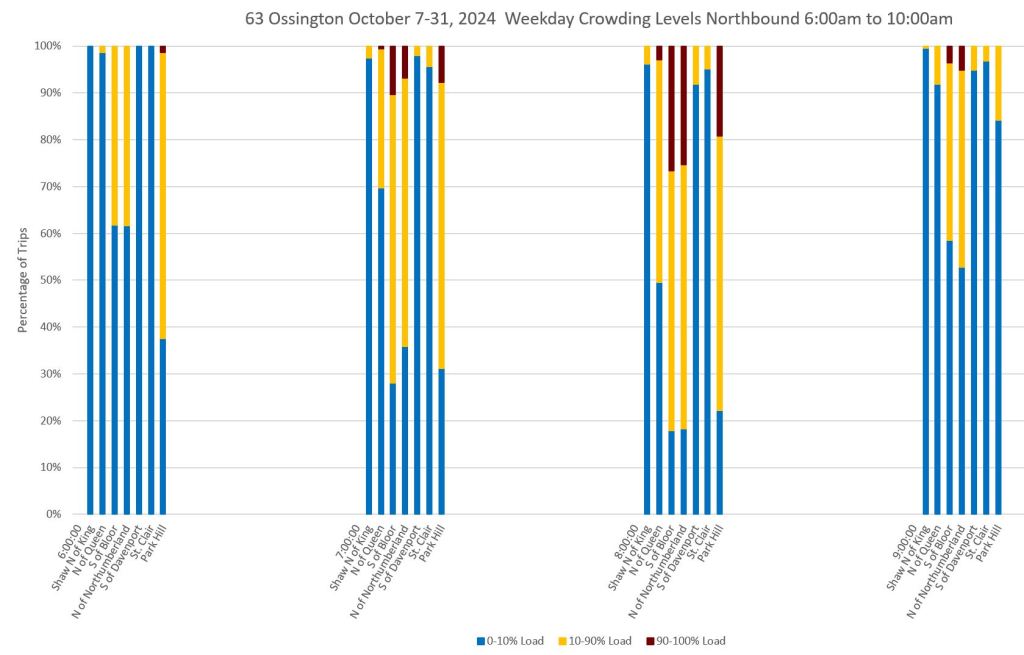
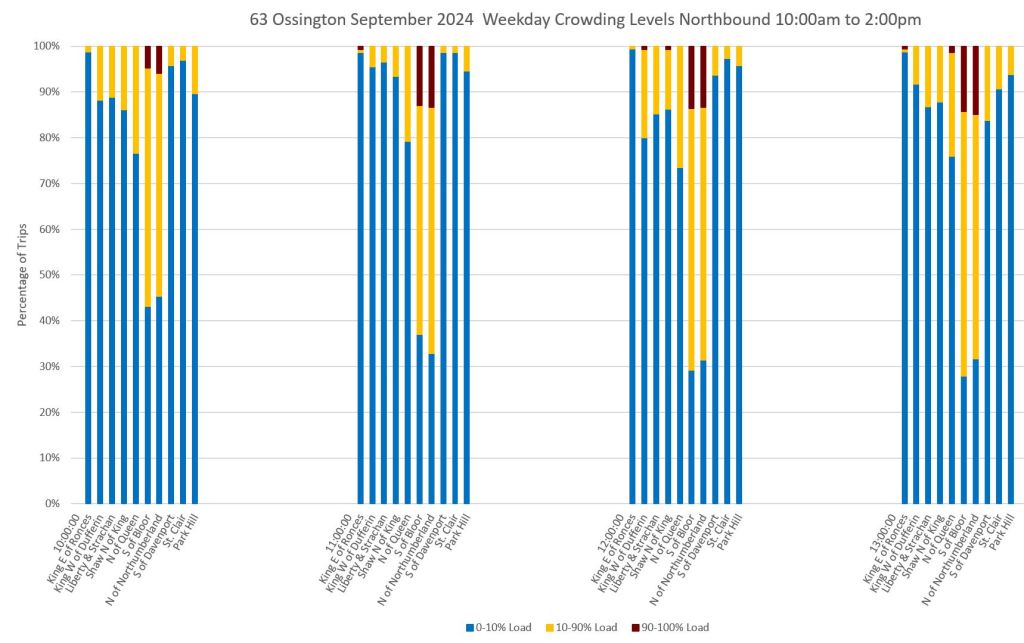
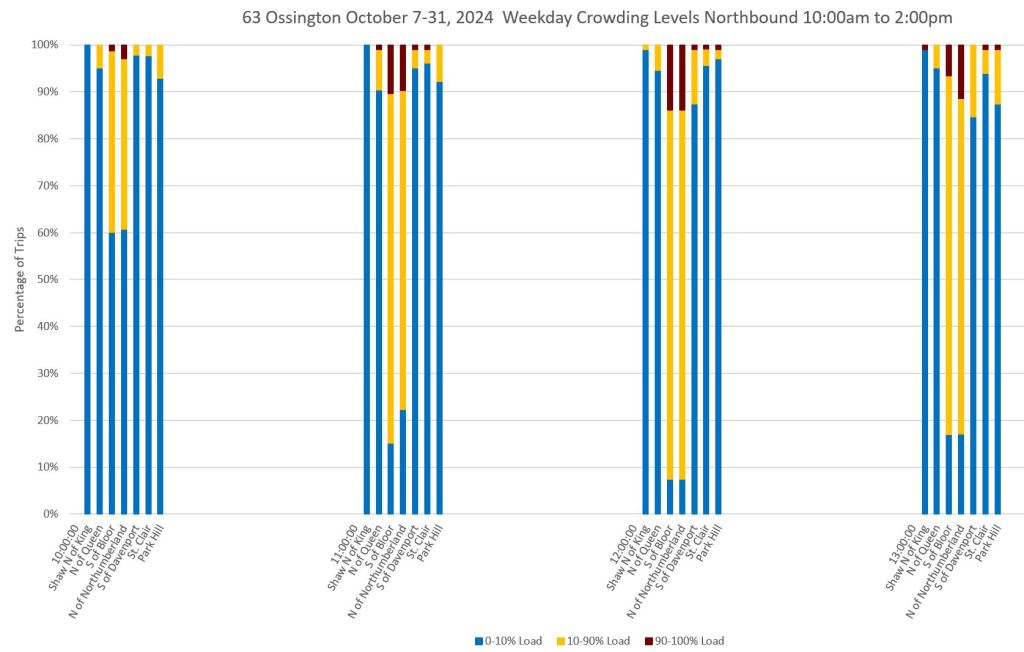
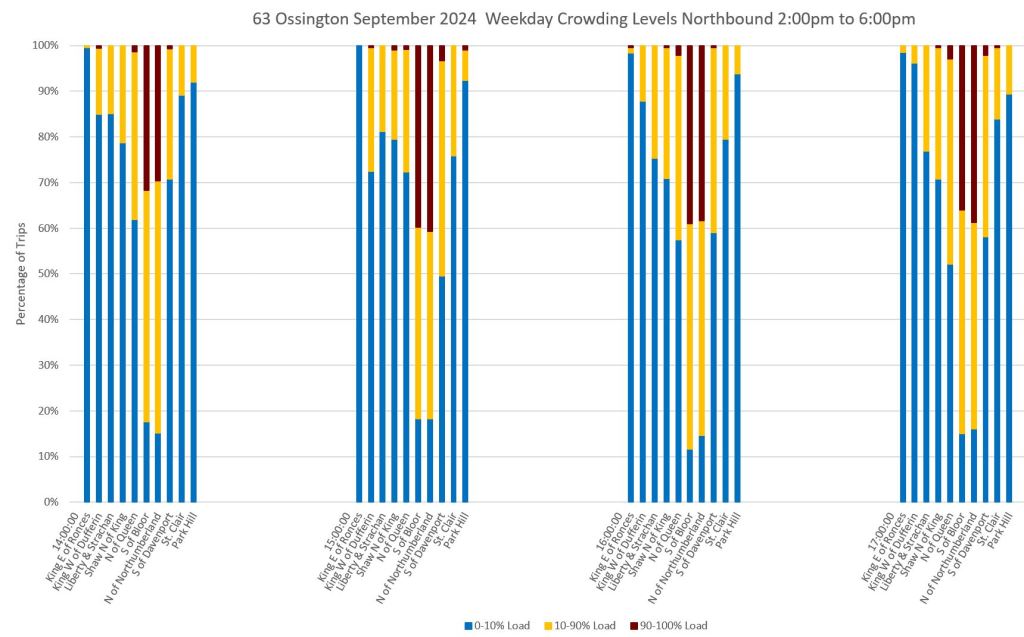
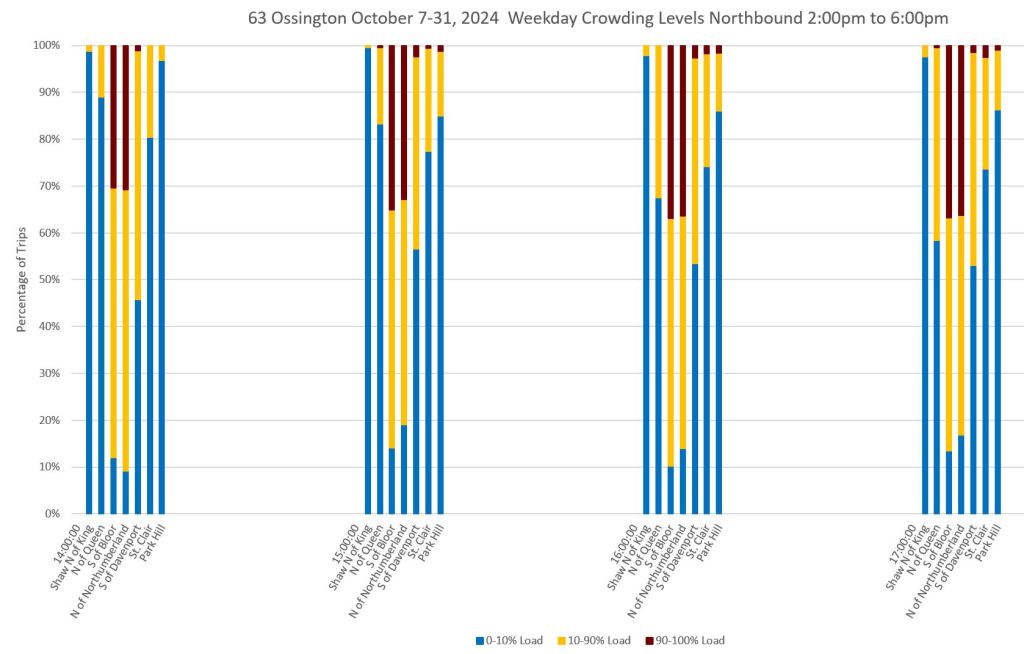
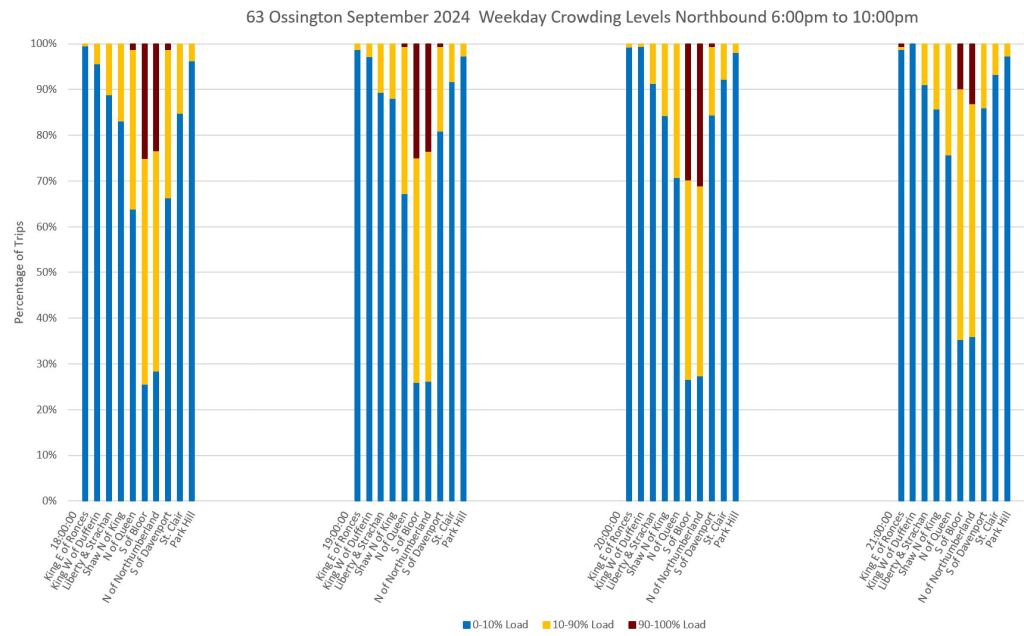
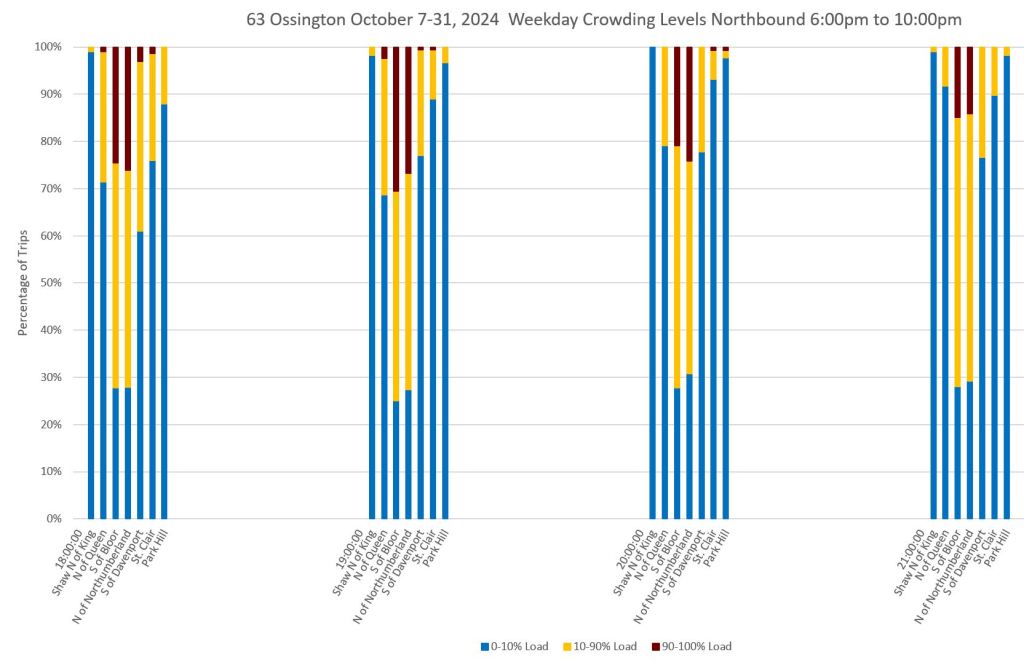
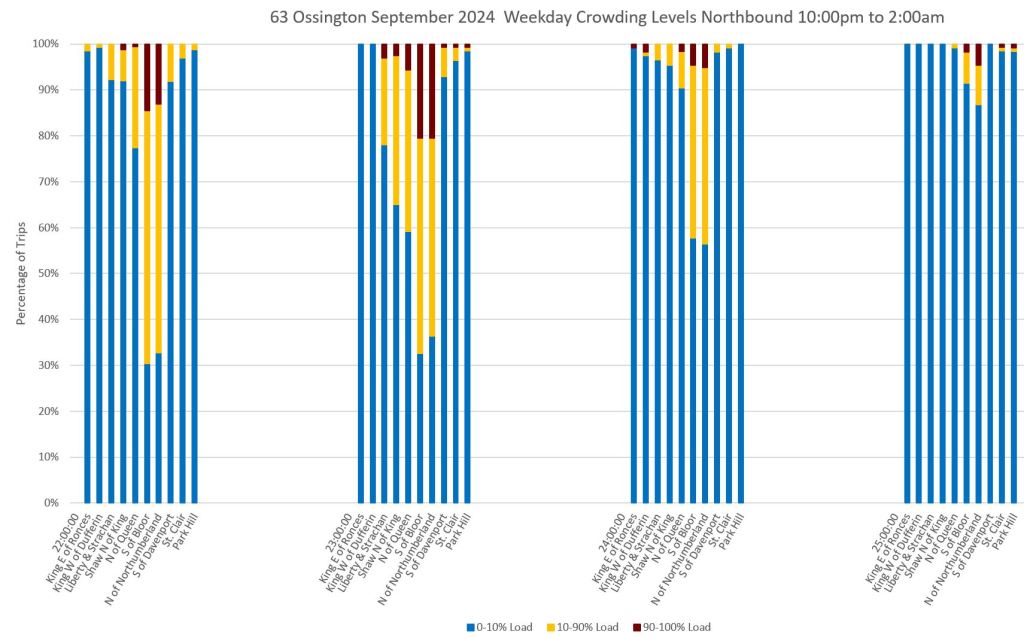
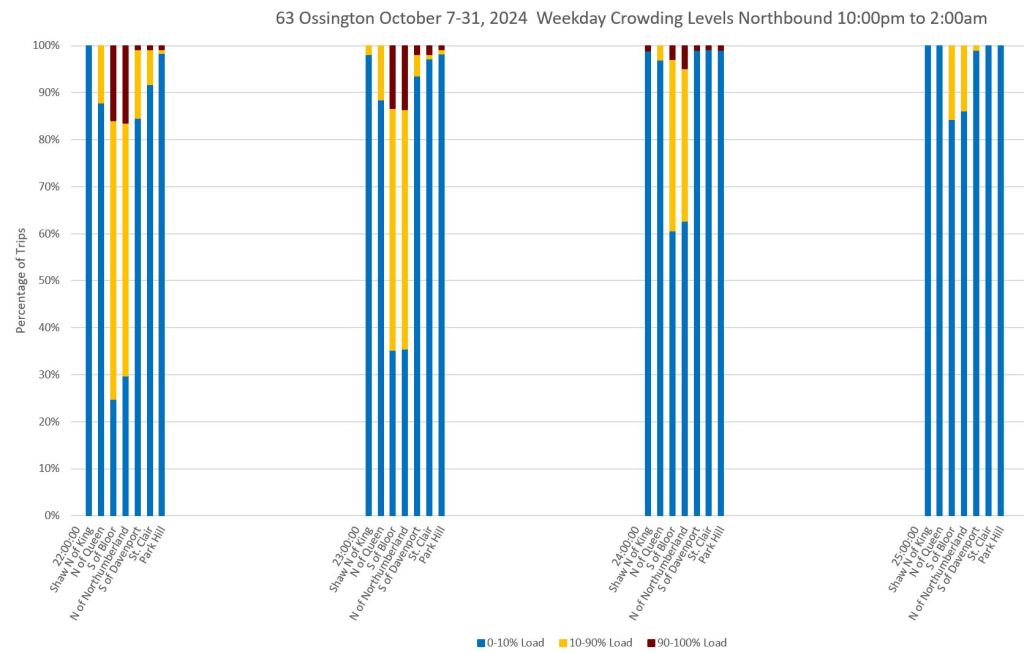
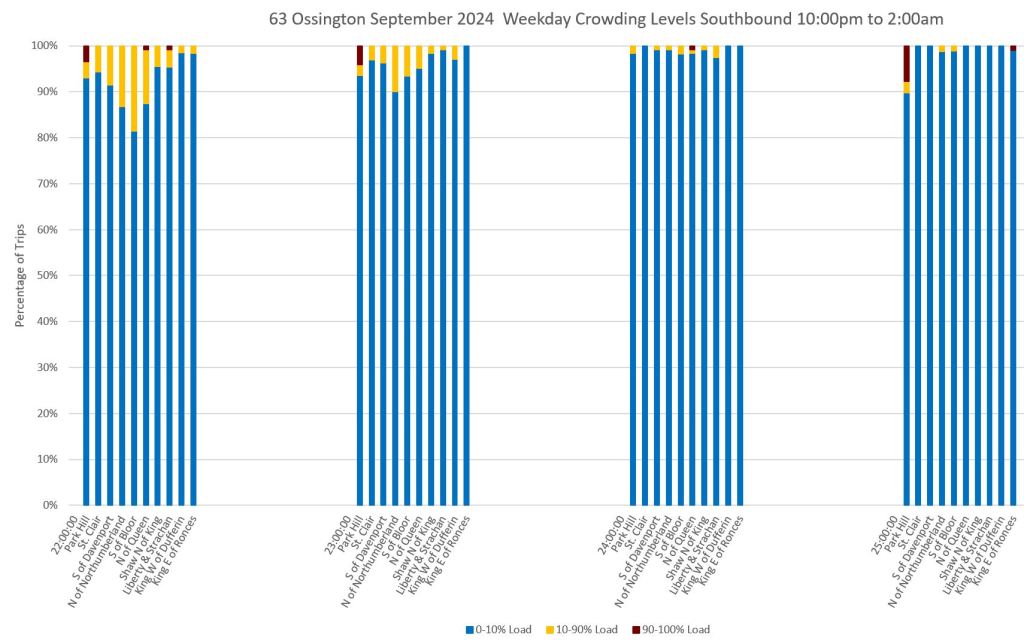
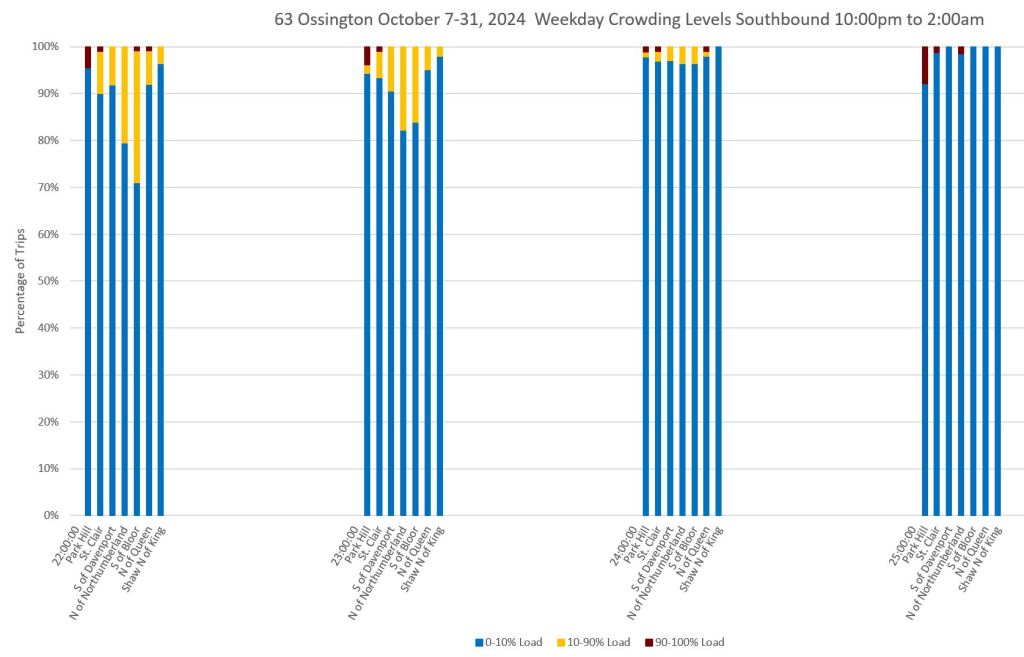
The charts below show the degree of crowding hour by hour. Each group of columns contains one hour’s data, and the individual columns show the proportion of light, medium and heavily loaded vehicles at each screenline where I have tracked service. These are the same locations as in the headway charts later in the article.
October data include only the days after the schedule change and the return of the route to its normal configuration.
Dark red at the top of the charts indicates crowded vehicles. This is most common southbound in the AM peak and northbound in the PM peak. Crowding is at its height near Ossington Station, and a pair of red bars appears for the screenlines South of Bloor and North of Northumberland (the northern part of the loop around the station).
Note that as with the headway charts, there are three extra locations in the September charts measuring conditions on the extended route. These are on the left of the northbound charts (the start of the trip) and on the right on the southbound charts (end of trip).
Northbound
Southbound
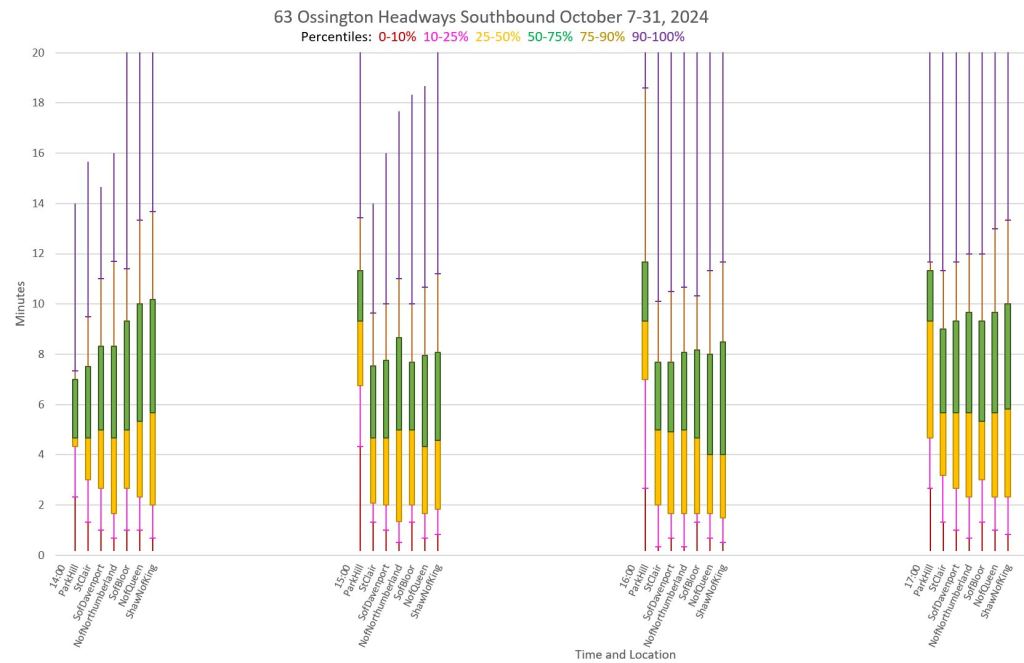
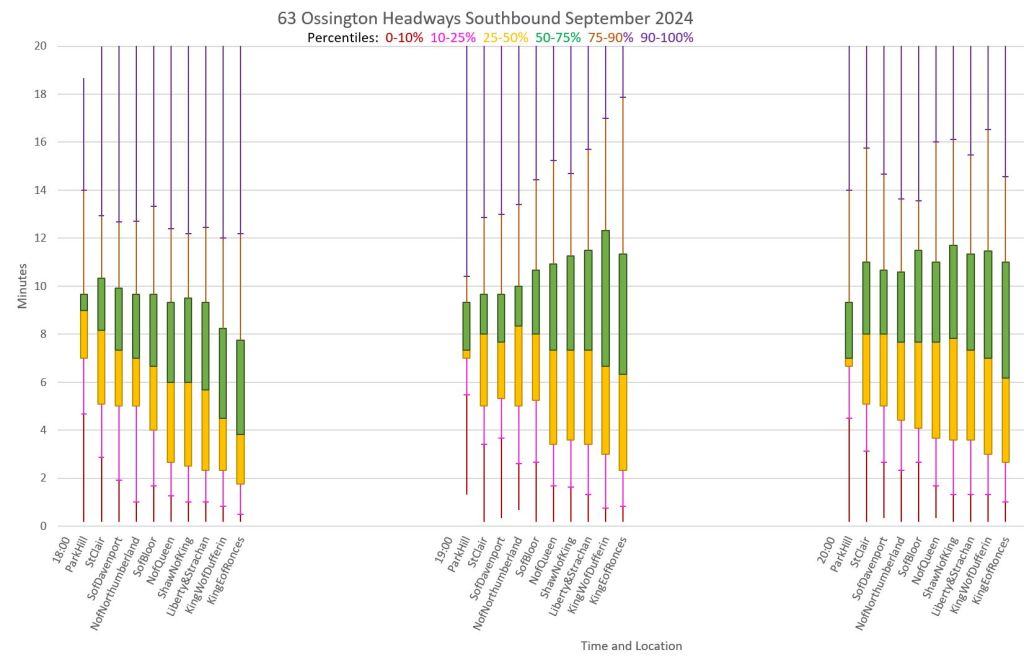
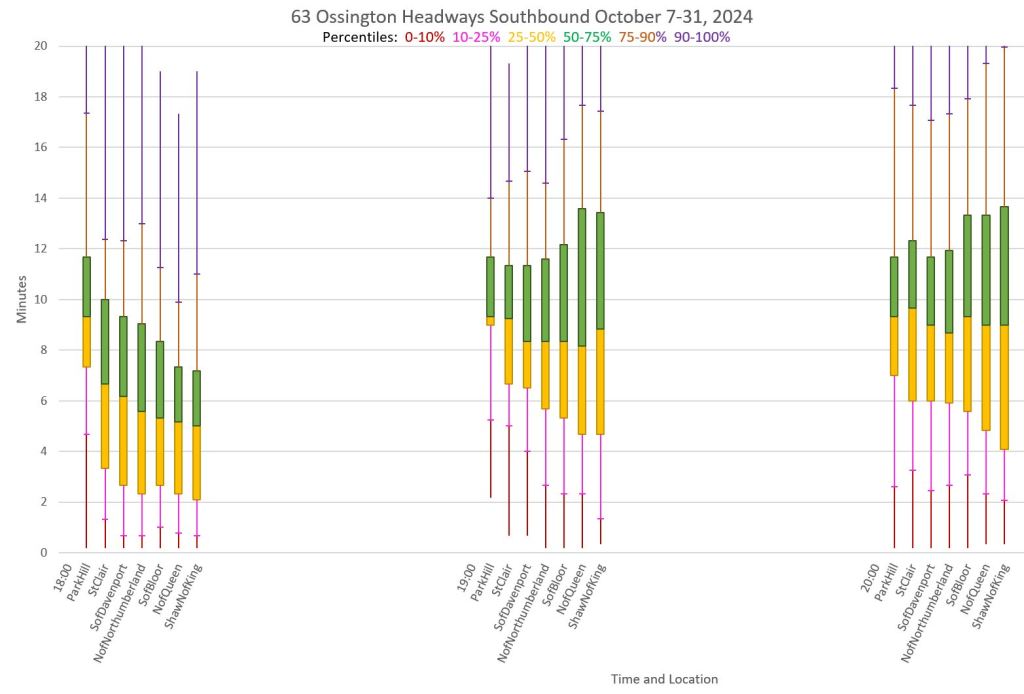
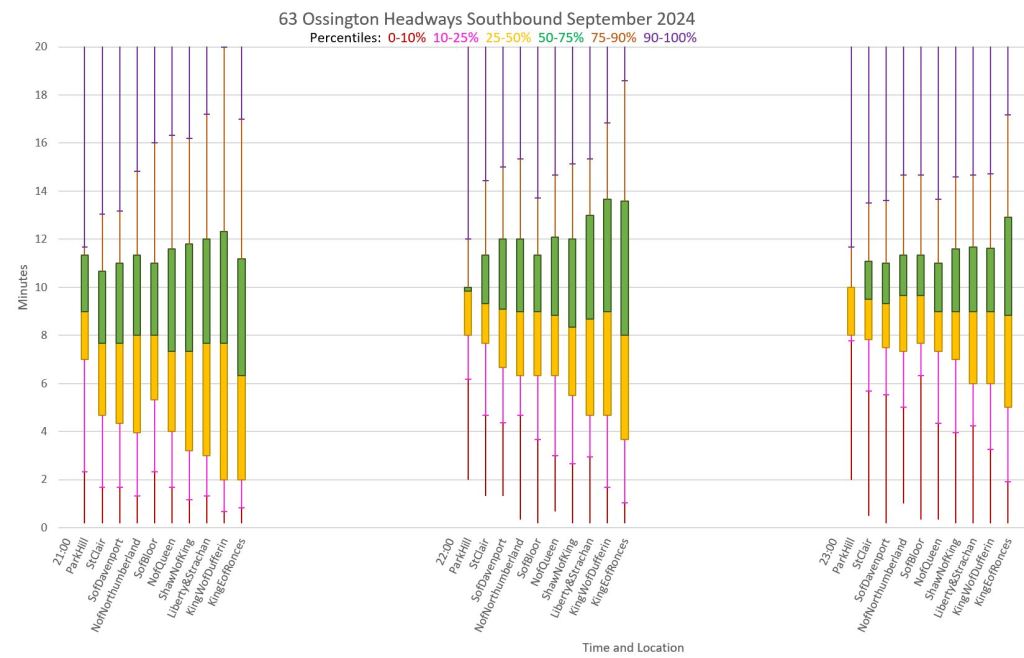
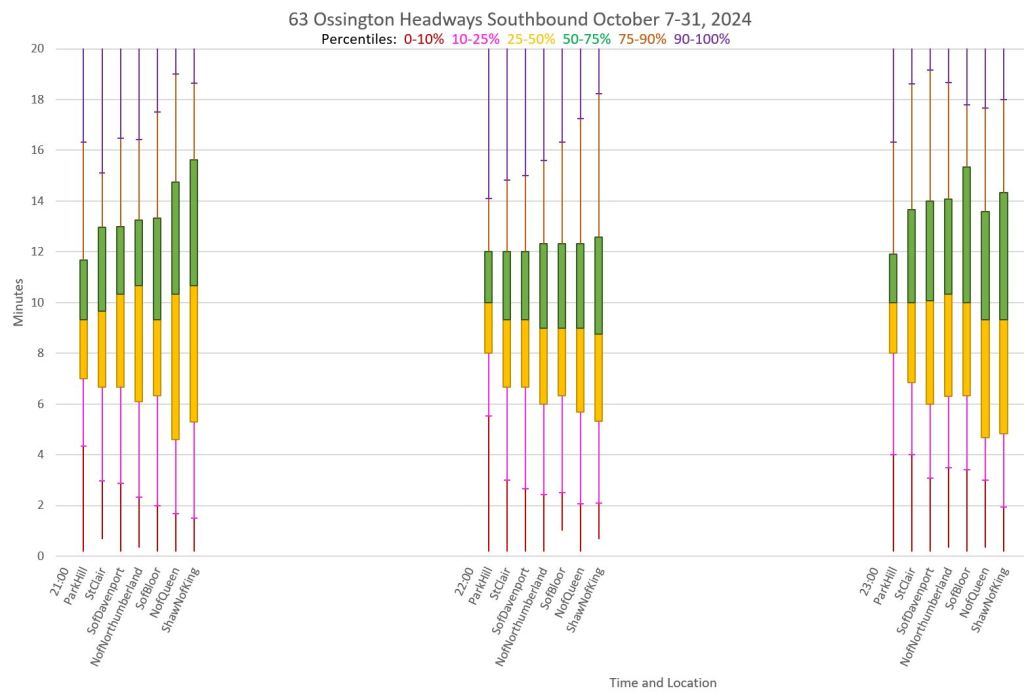
Headway Reliability
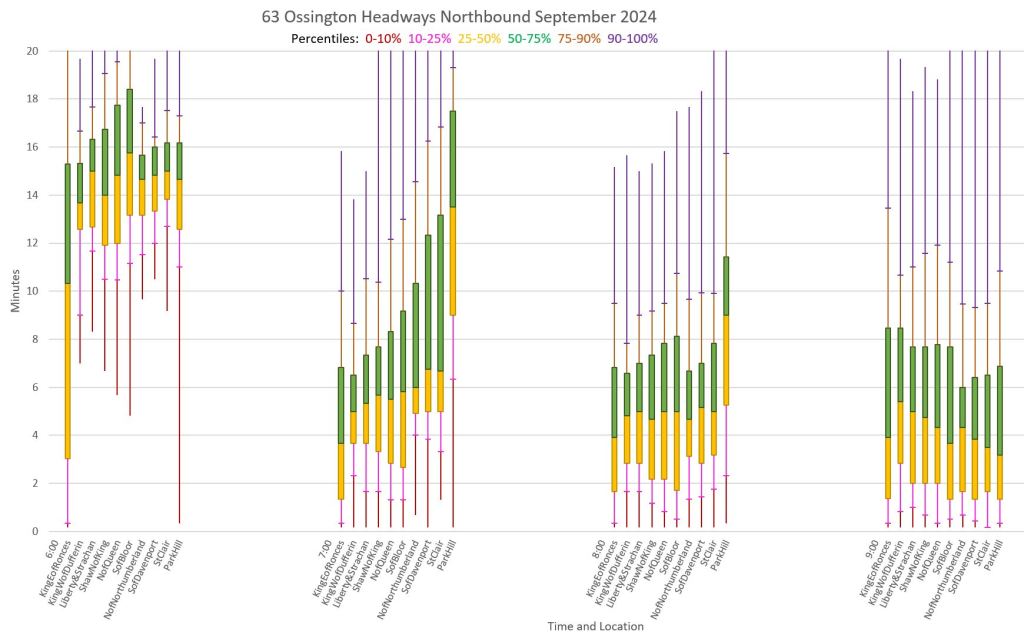
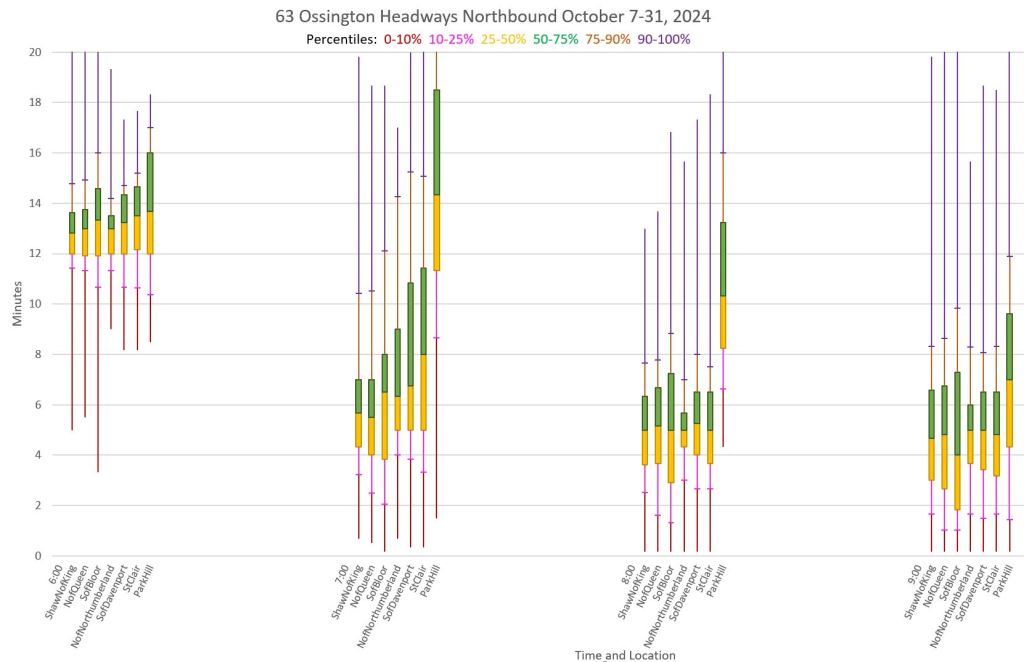
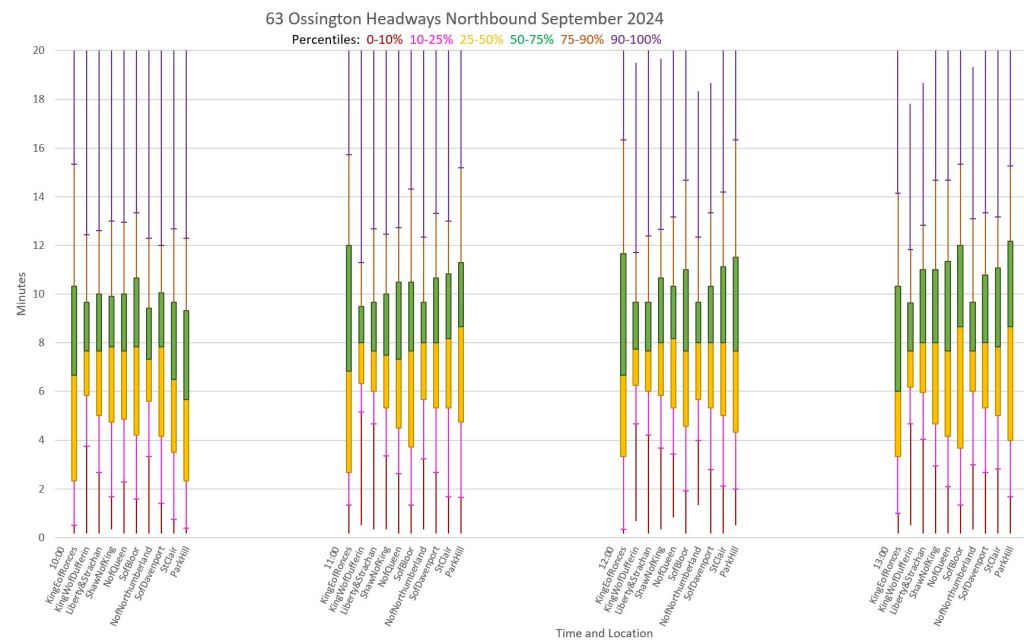
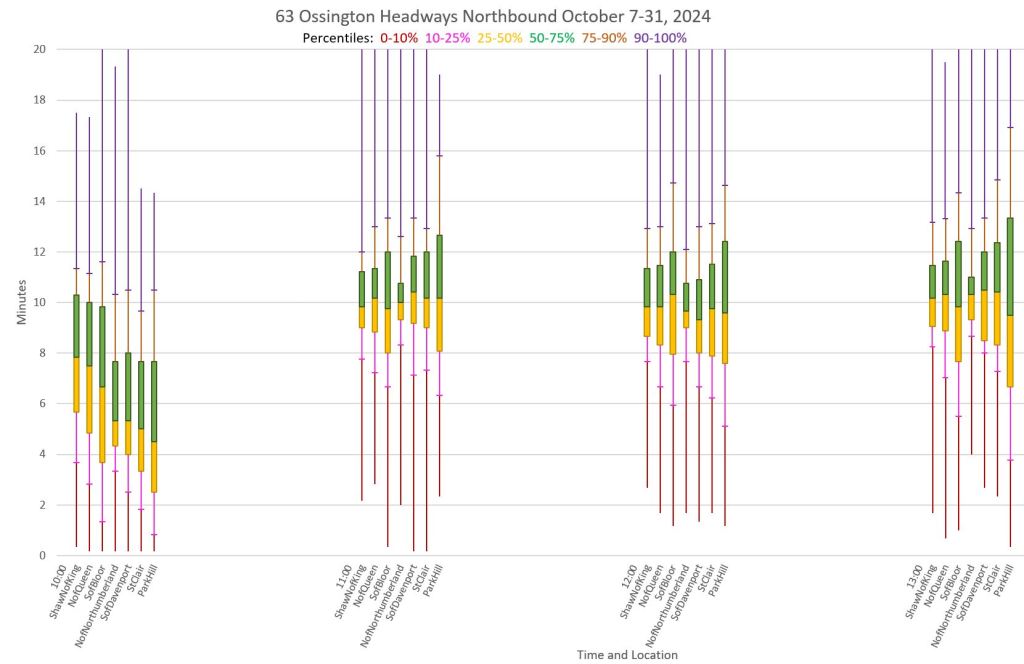
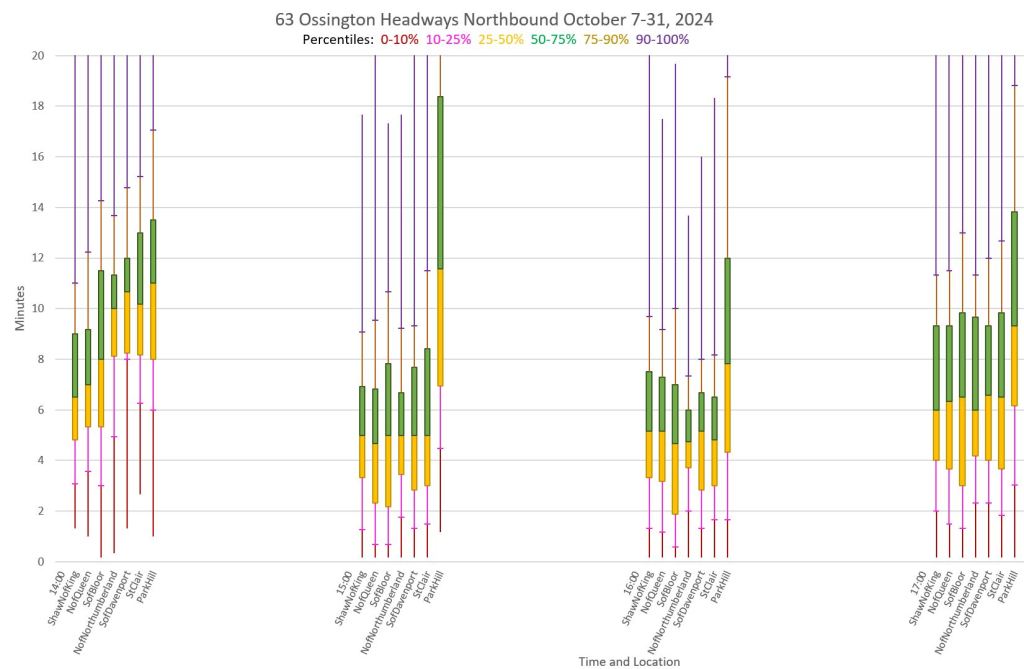
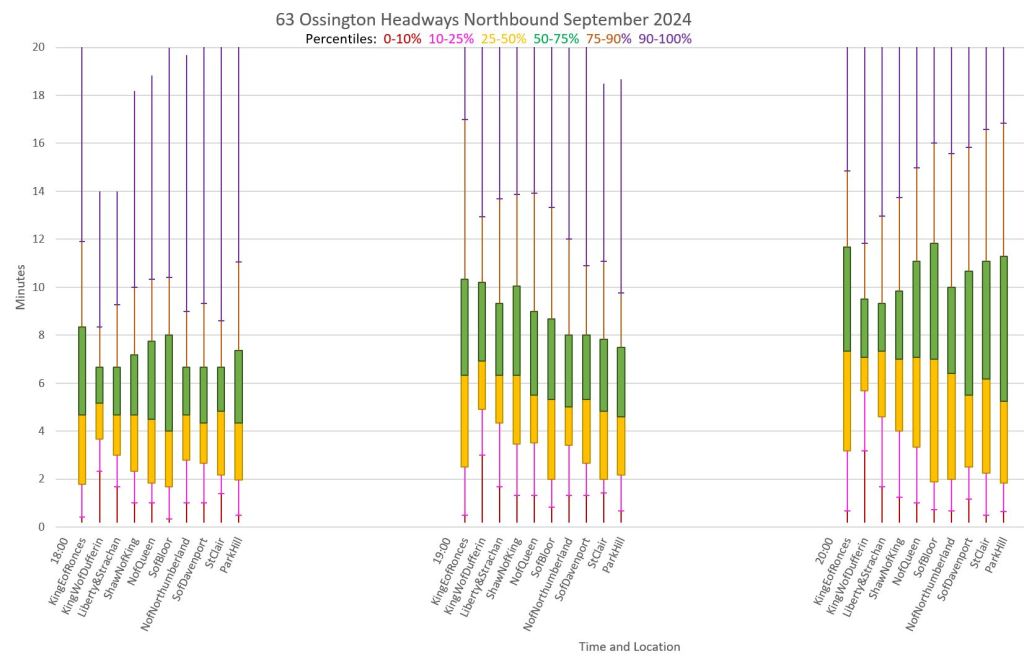
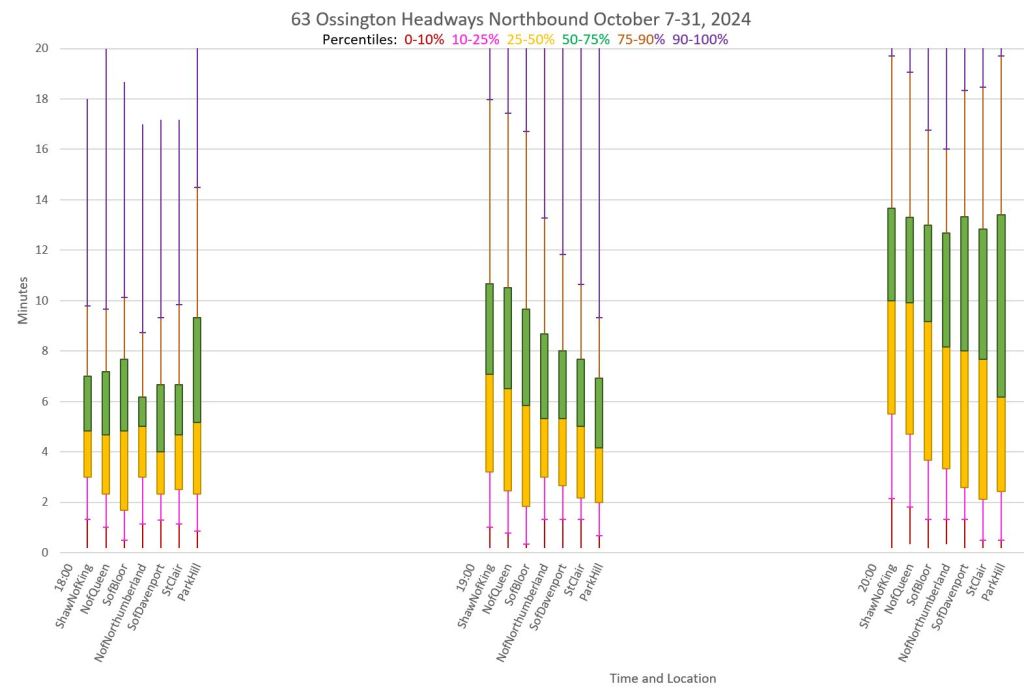
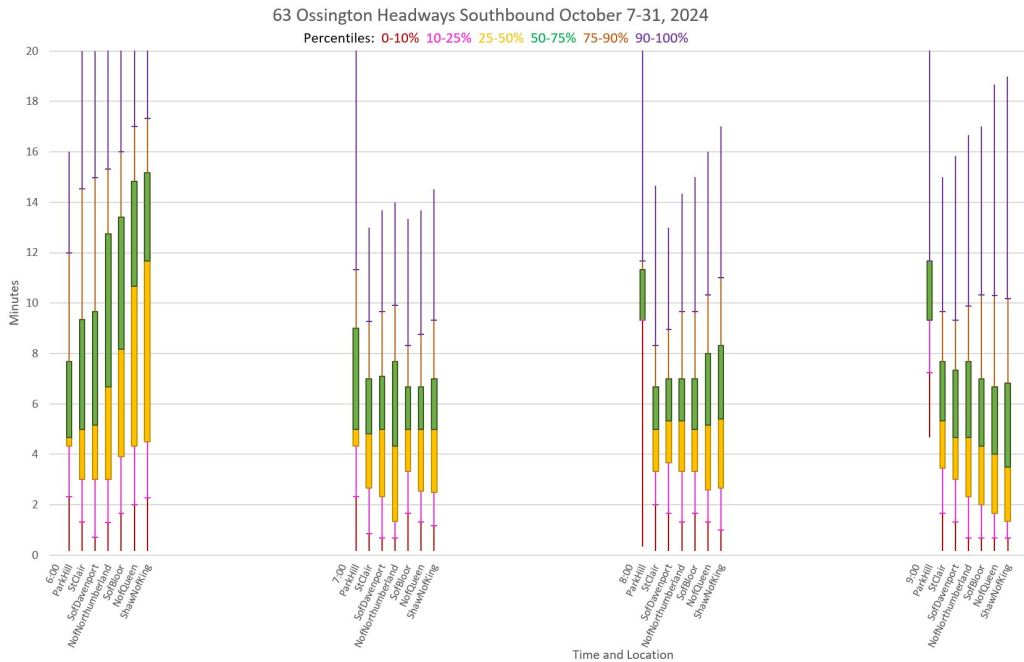
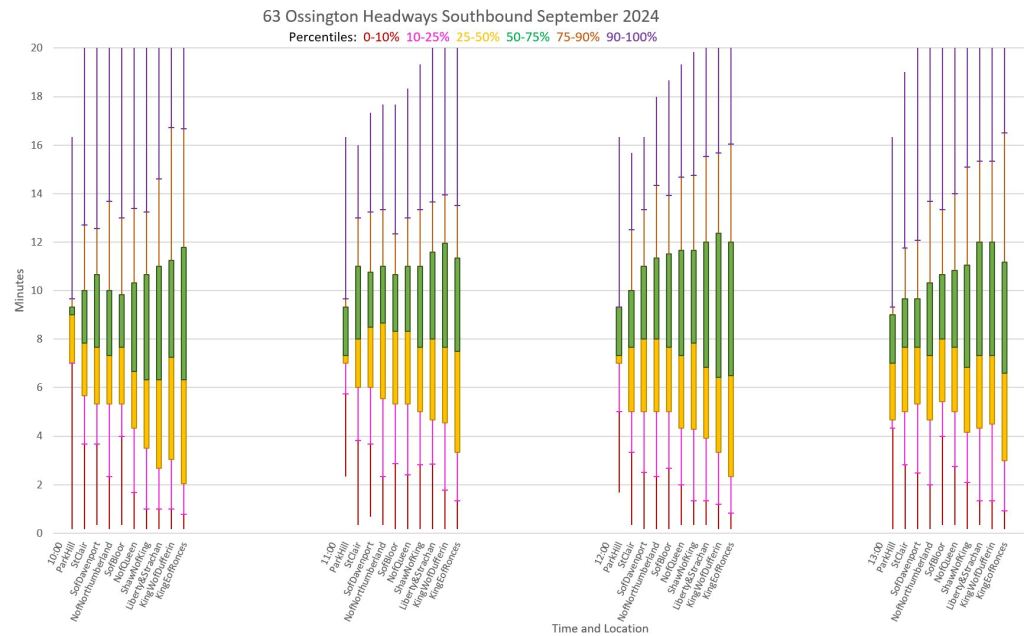
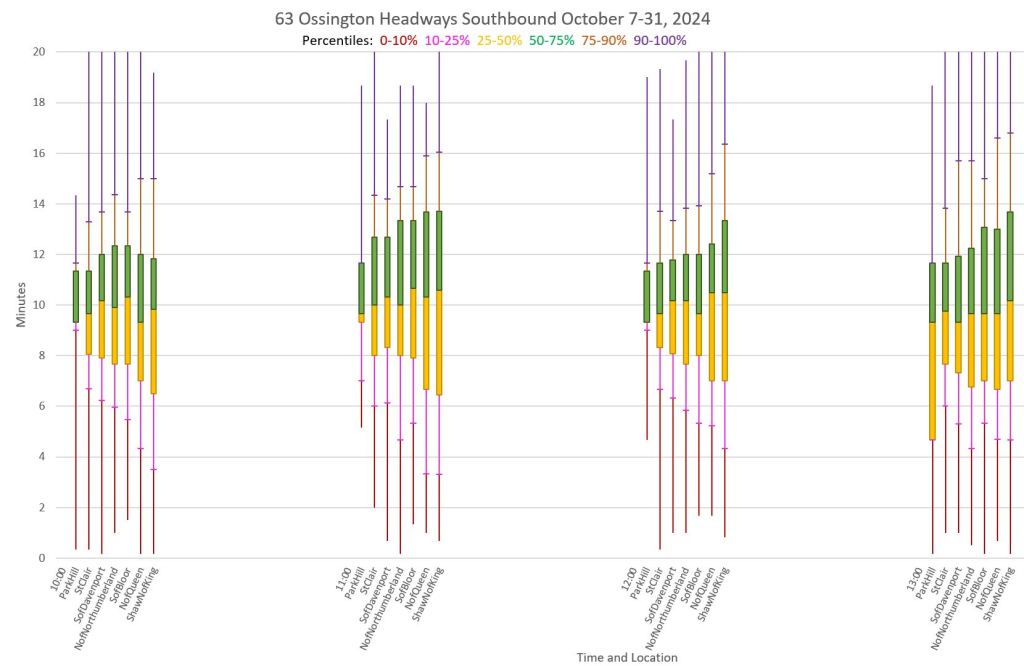
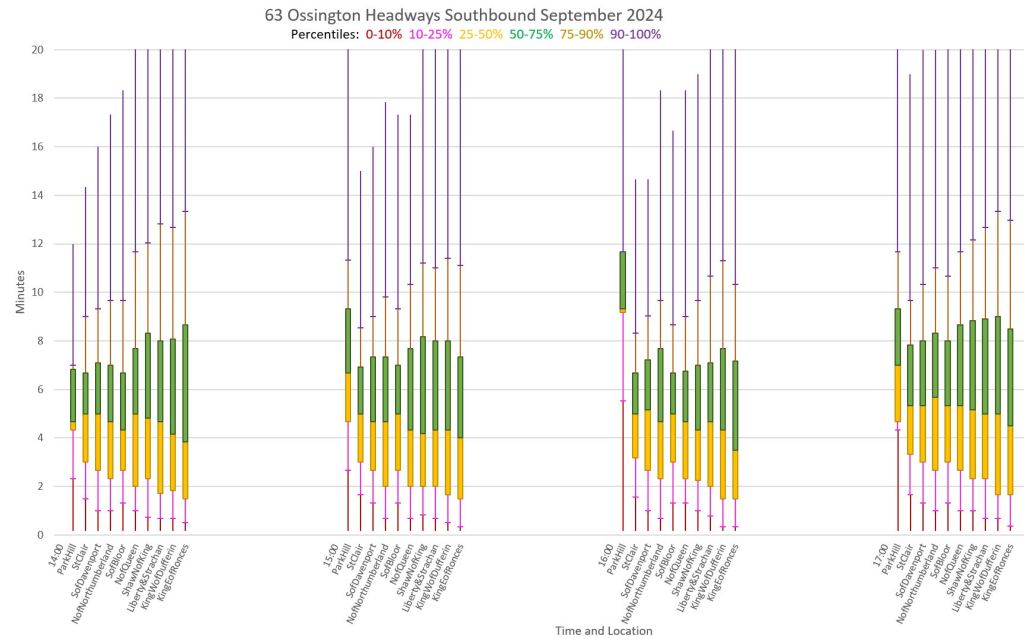
The reliability charts show the spread of actual headways at various points along the route. The central green and yellow boxes contain 50% of the data (the 2nd and 3rd quartiles), while the outliers are in the tails above and below the boxes. The small crossbar in the tails marks the boundary with the top and bottom 10% (10th and 1st deciles).
The boundary between the yellow and green boxes is the median, and this generally matches the scheduled headway.
In simple terms, a rider at a time, stop and direction would expect a headway within the range of the central boxes half of the time. The other half would lie along the upper and lower ranges. The upper tails include the worst values for 10% of the time. This means that a regular rider (five round trips per week) would likely encounter a very wide gap at least once a week, possibly more, during most periods.
A rider is far more likely to arrive at a stop and wait during a wide gap than between two buses minutes apart. Although the 0-10% and 90-100% deciles contain the same number of trips, far more riders are “served” by the upper band. (This is the subject of my article on Actual vs Advertised Wait Times.)
The lower crossbar often lies below the 2 minute line indicating that 10% or more of the service is bunched.
In many cases, the area covered by the bars widen left to right showing how headways tend to stretch along the route. One point that is visible in many charts is that the central boxes shrink at Ossington Station, mainly in the northbound direction. This indicates that some headway management occurs mid-route. However, as the charts show, the effect does not last, and the range of headways widens afterward. (Ossington Station lies between the screenlines at “S of Bloor” and “N of Northumberland”.)
During peak periods, the headways at the north end of the route (screenline “Park Hill” is just west of Eglinton West Station) are wider because half of the service turns back at St. Clair.
Note that there are three more locations in the September charts than in October to cover the route extension to Sunnyside.
Northbound
The charts on the left show September data, and the charts on the right October from the 7th onward with the new schedules. Note that the midday headways in October lie higher on the chart because the schedule changed from every 8 to every 10 minutes, but the boxes are not as spread out indicating that service is more reliable.

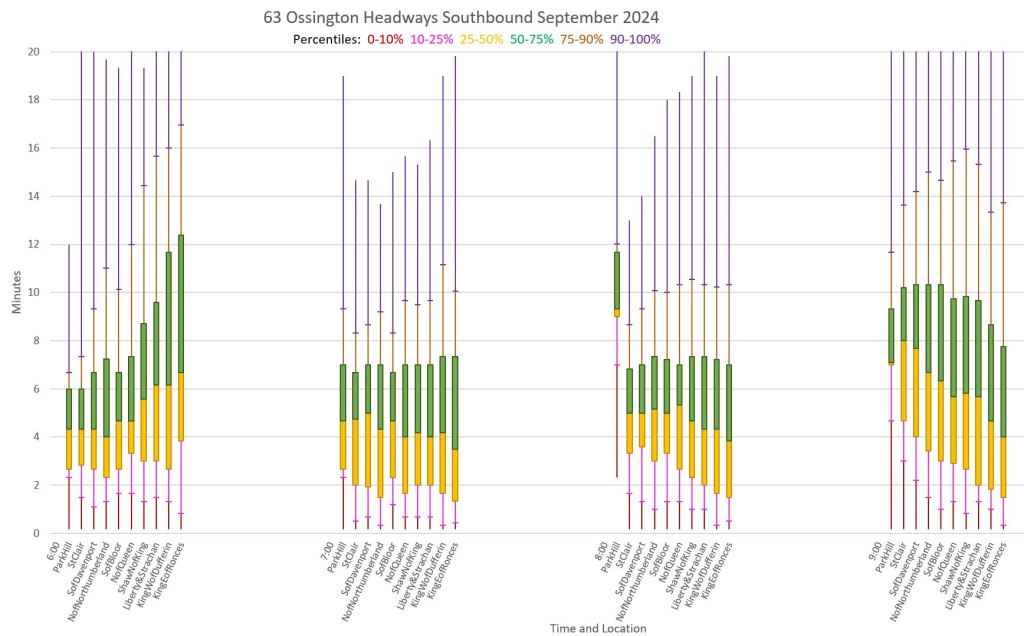
Southbound
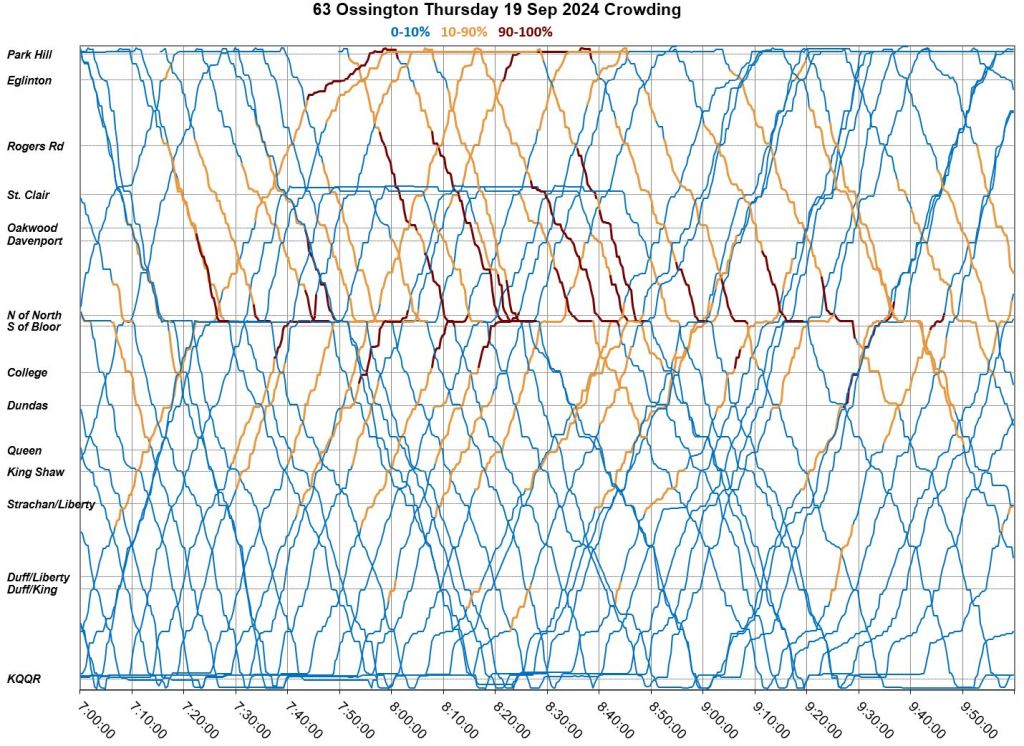
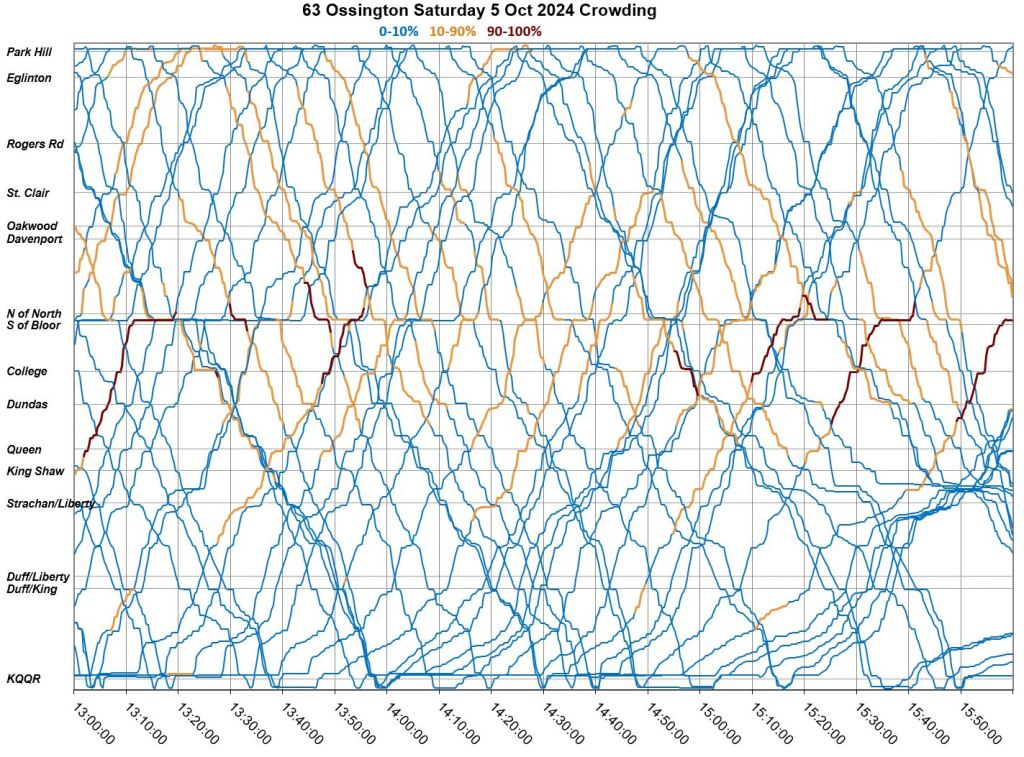
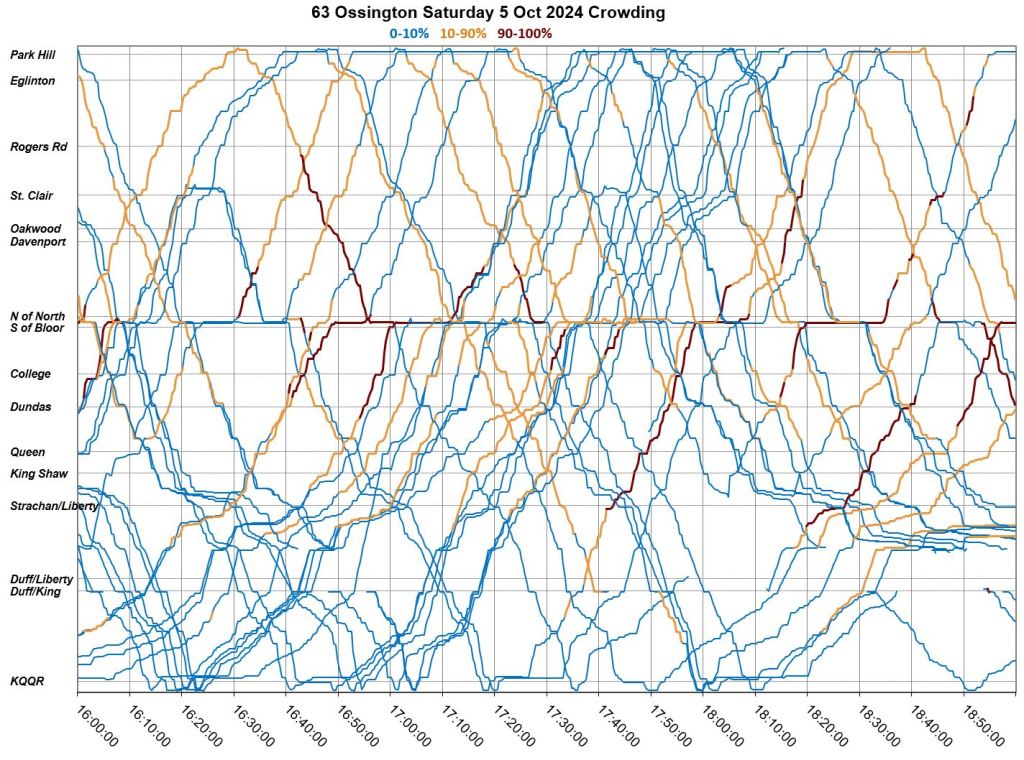
Review of Individual Days
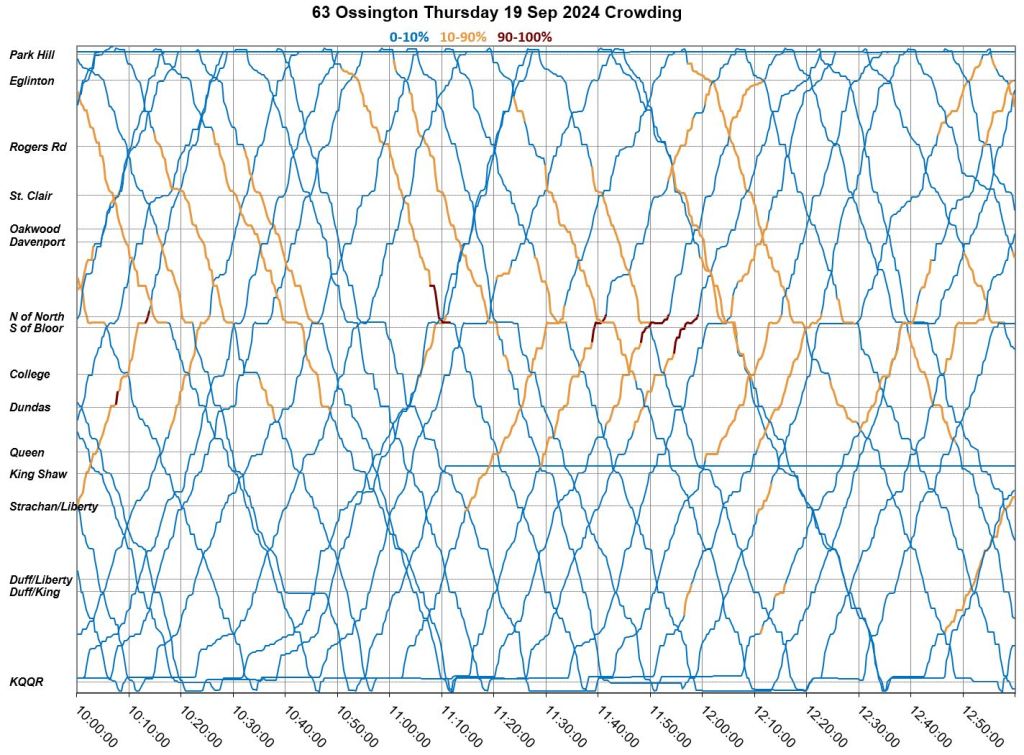
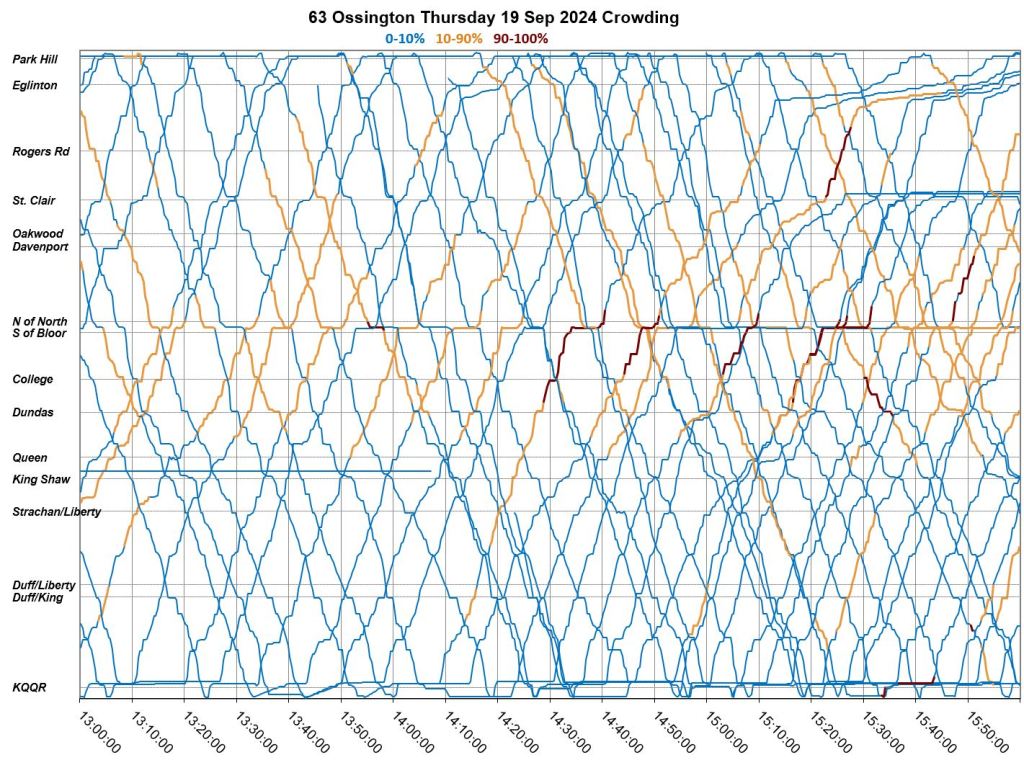
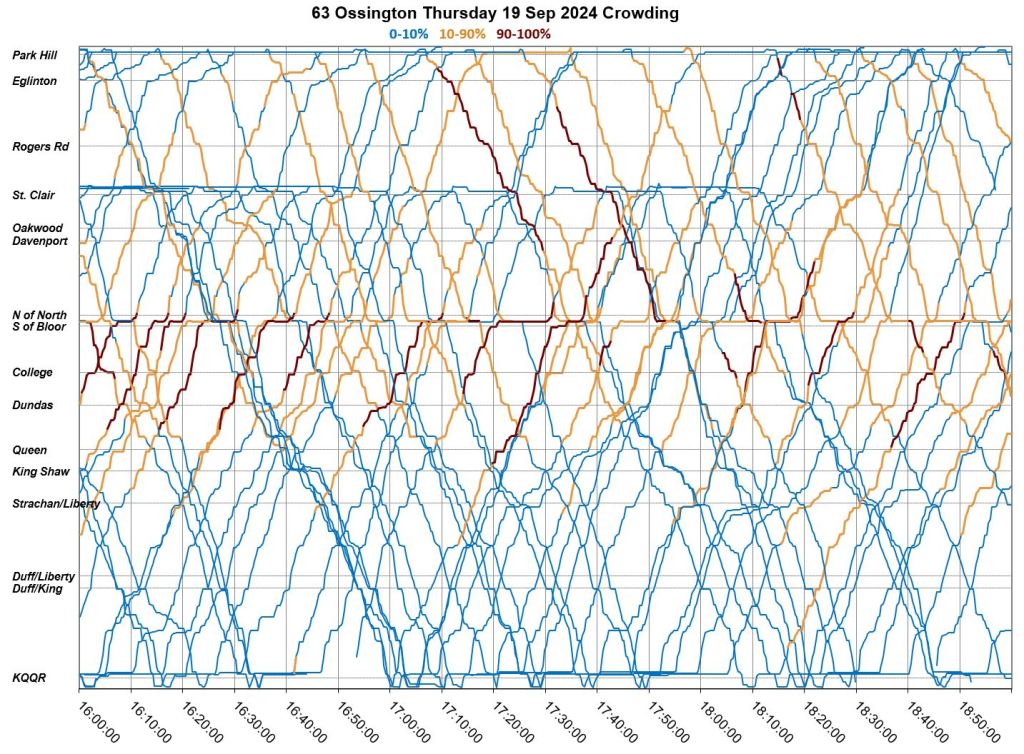
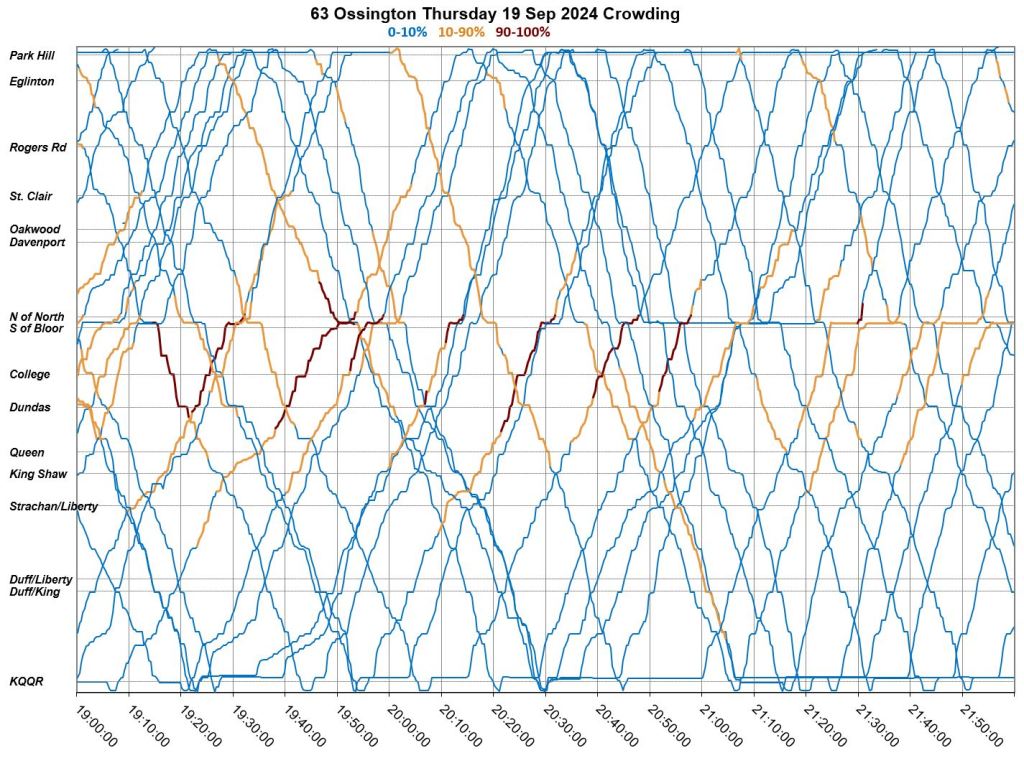
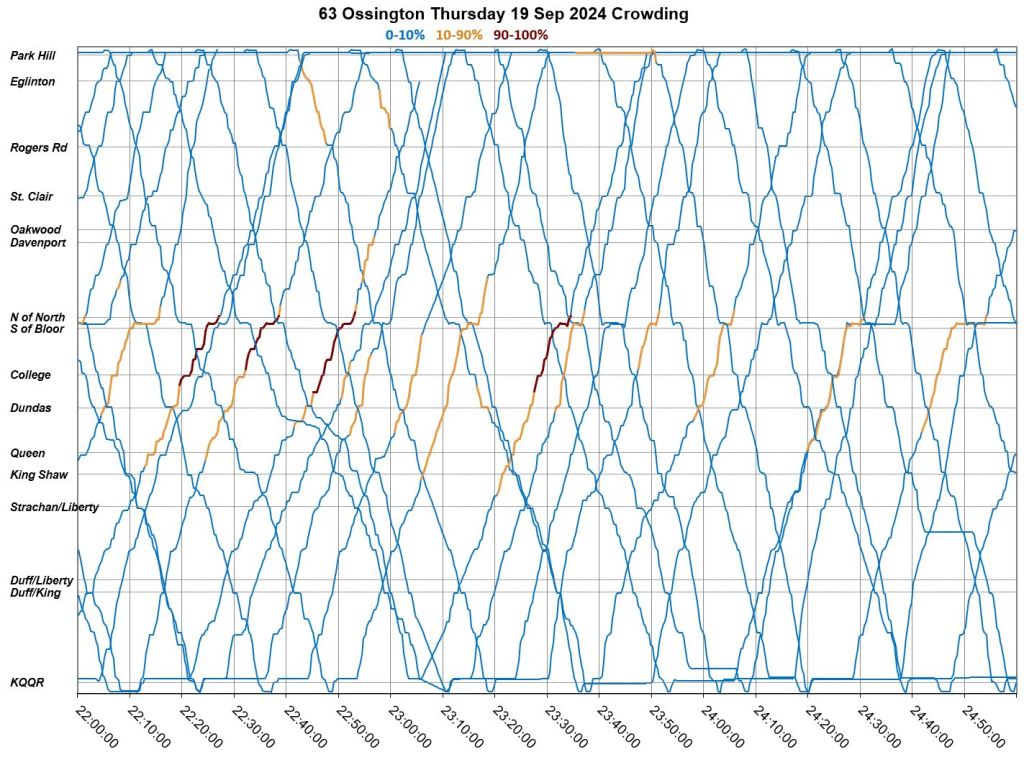
Thursday, September 19
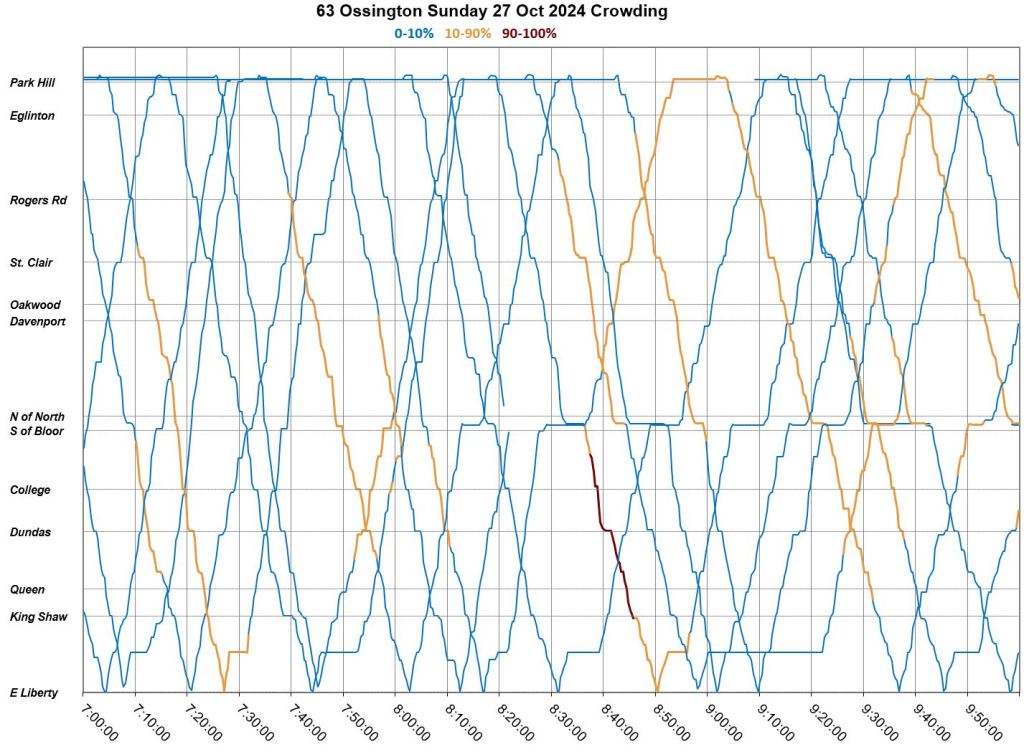
September 19 is a typical day on the extended version of the route to Sunnyside. Visible throughout the day are the layovers taken by buses on their trips east from King-Queen-Queensway-Roncesvalles (KQQR) at the bottom of each chart. The horizontal lines show buses sitting just east of KQQR.
Crowding (dark red lines) is mainly within a few km either side of Ossington Station usually in the peak direction.
Congestion occurs on the approach to Eglinton West Station in the shoulder pm peak period. This is likely due to curb lane restrictions being in effect only from 4pm onward even though traffic levels build up sooner. A southbound gap from Eglinton West occurs just before 4pm as a result. This travels south and west to Sunnyside.
Another gap opens up northbound just before 7pm, and this echoes over a full round trip compounded by some bus bunching. These buses are spaced leaving Sunnyside at about 8:30pm, but become bunched again at Ossington Station. Other bus pairs persist through the evening.
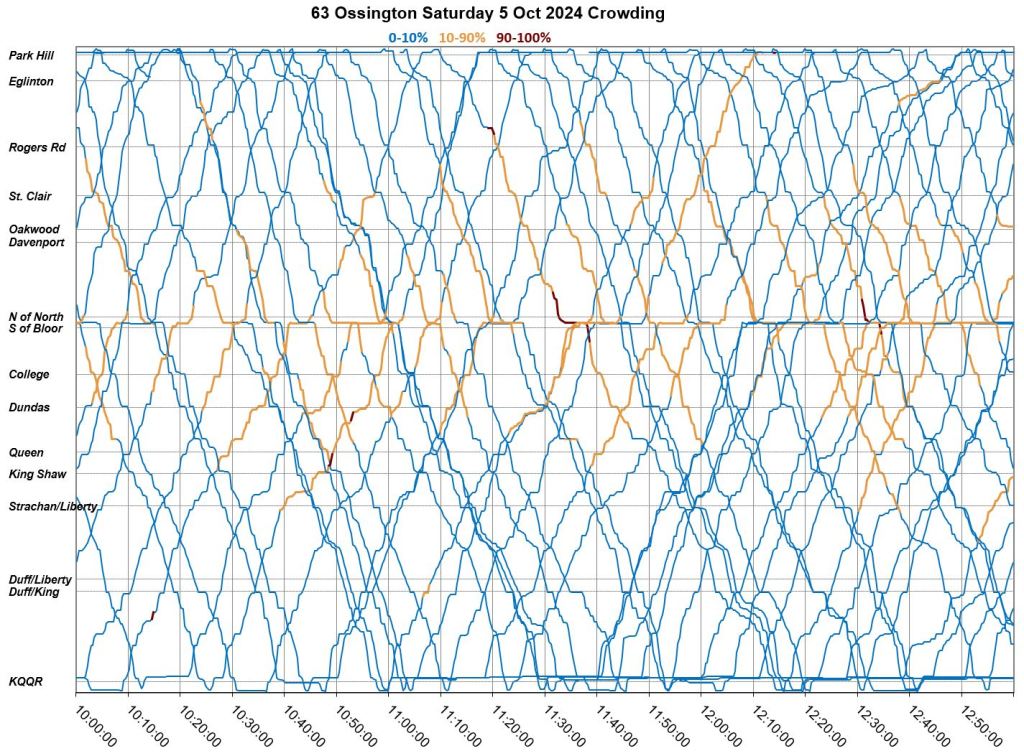
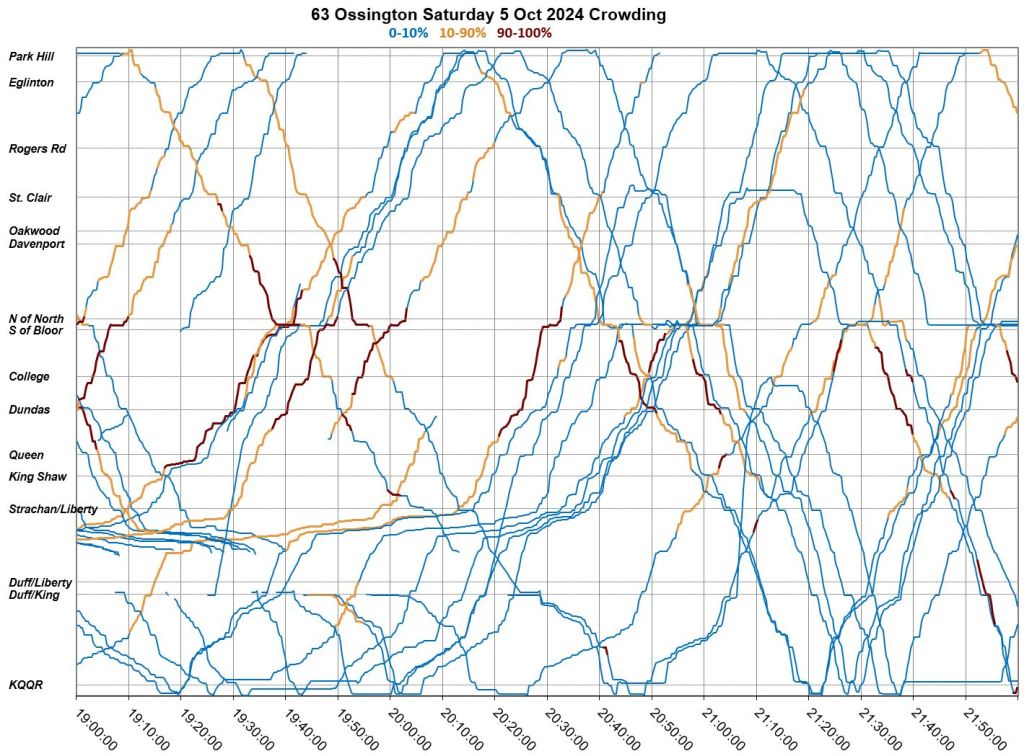
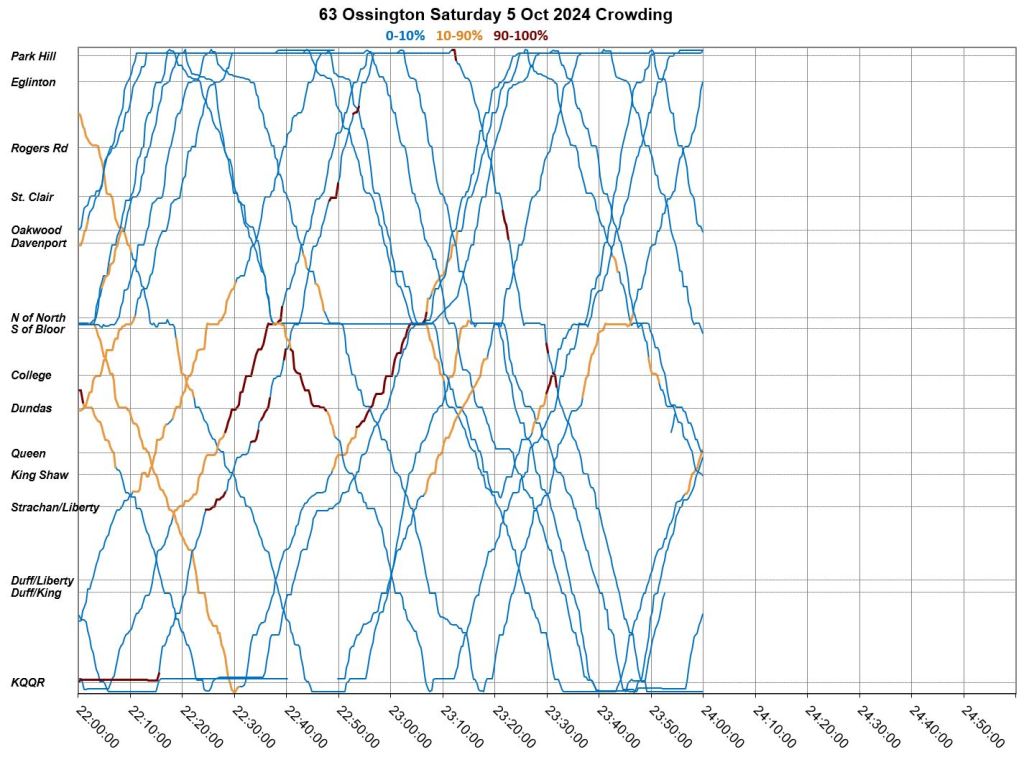
Saturday, October 5
October 5 shows the effect of extreme congestion in the Liberty Village area from 2pm onward. The result is severely bunched service and erratic headways until late evening. For a period after 4pm buses diverted via King east of Dufferin. Several buses were short turned at Ossington Station and at St. Clair.
This is an example of an event on one part of a route totally disrupting service over a wider area.

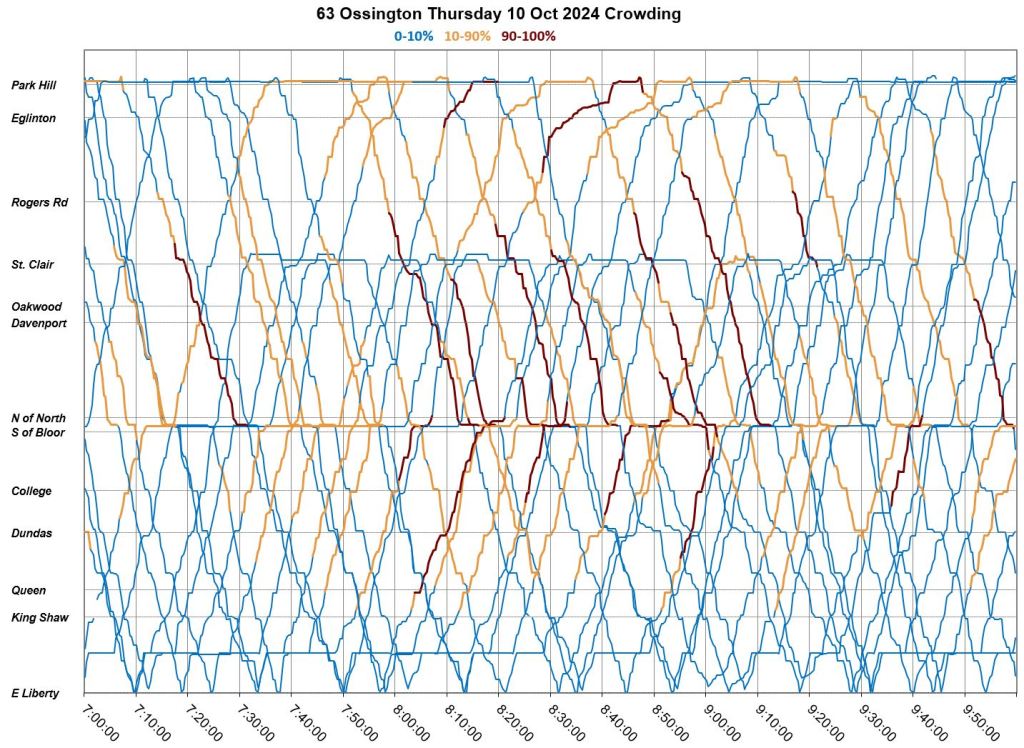
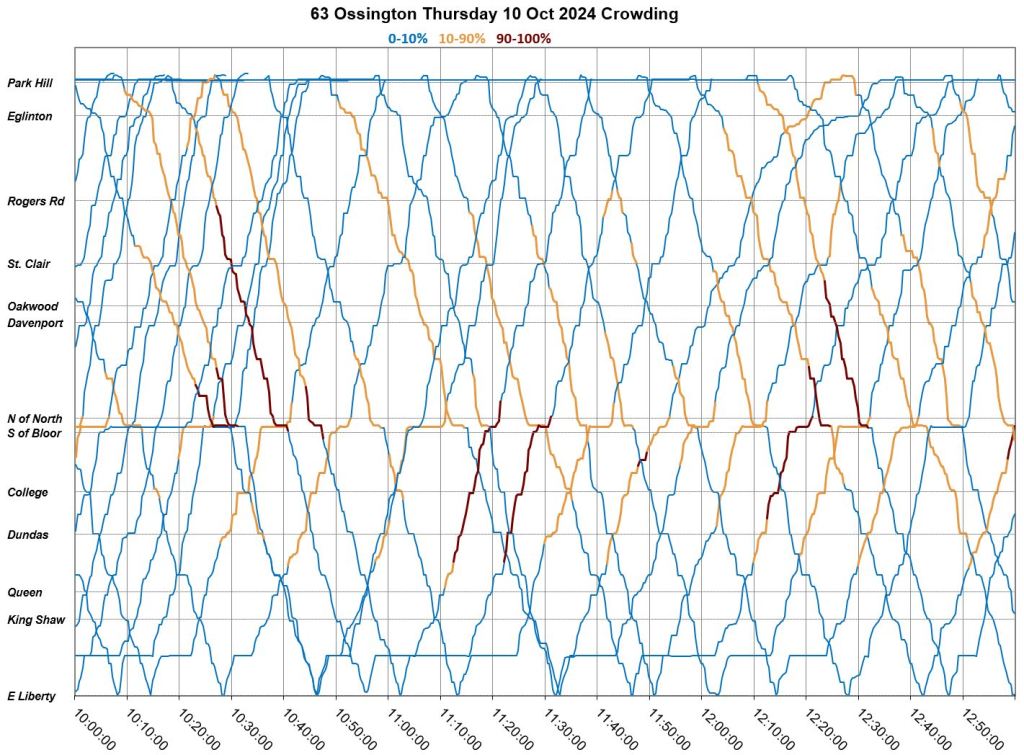
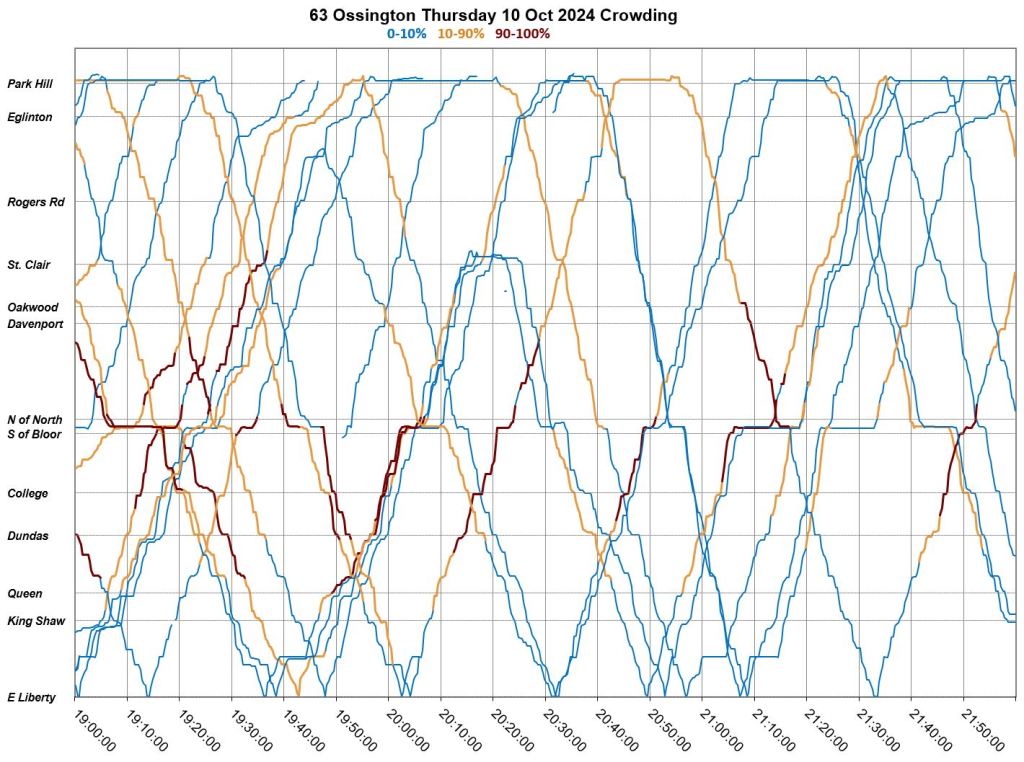
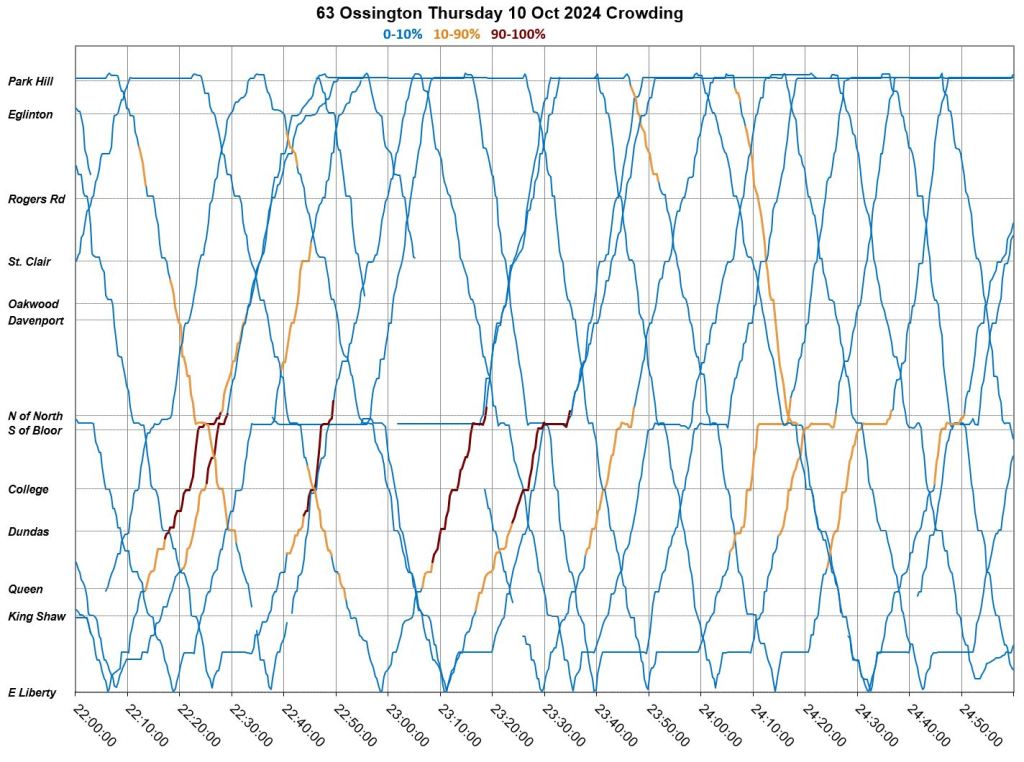
Thursday, October 10
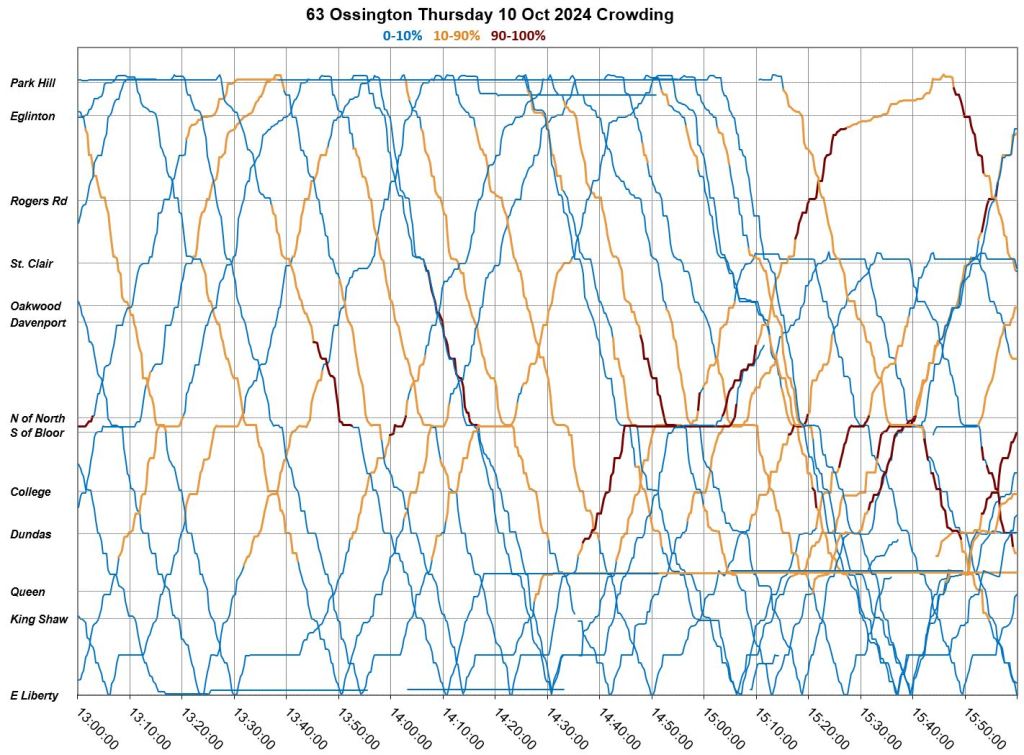
October 10th was uneventful until mid-afternoon when, for an extended period, there was almost no service north of St. Clair. No service alert was issued indicating the cause of this problem.
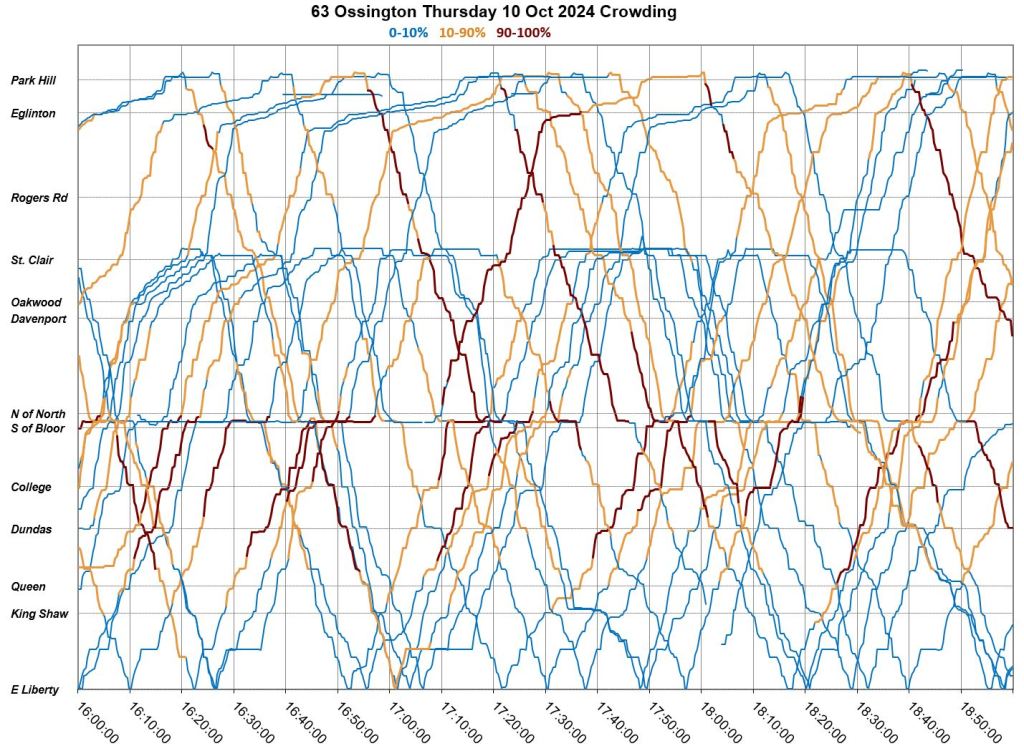
After service was restored at about 4pm, the usual congestion on Eglinton appeared, and many buses were turned back from St. Clair, more than the usual scheduled number. Service was not restored to a reliable level until late evening as buses continued to operate with bunching, gaps and some unscheduled short turns.
In spite of the erratic service, most buses managed a layover at least at Eglinton West (the horizontal lines in the tracking charts). At the south end, layovers are regularly taken northbound on Atlantic at King. Some layovers at Ossington Station are also evident.
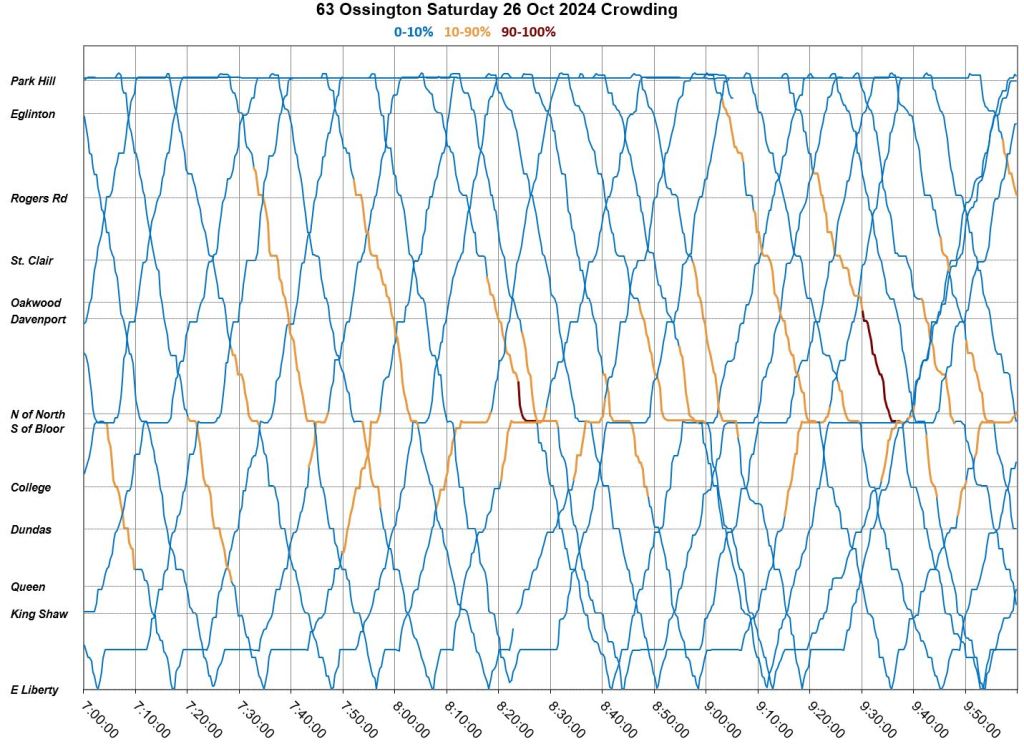
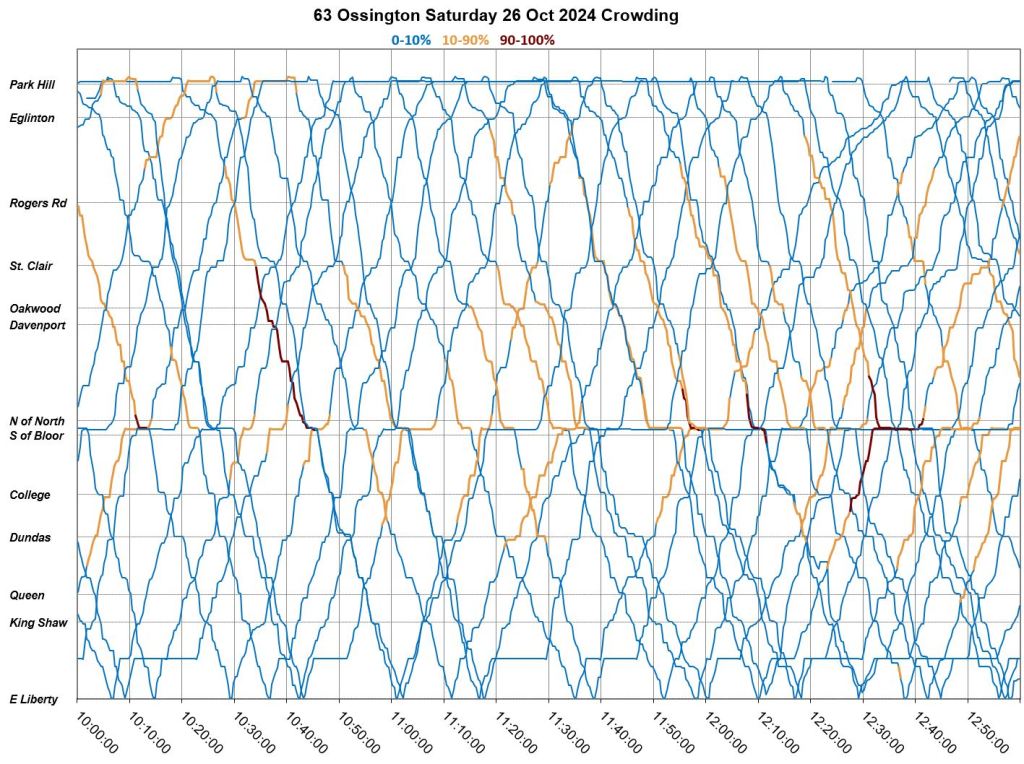
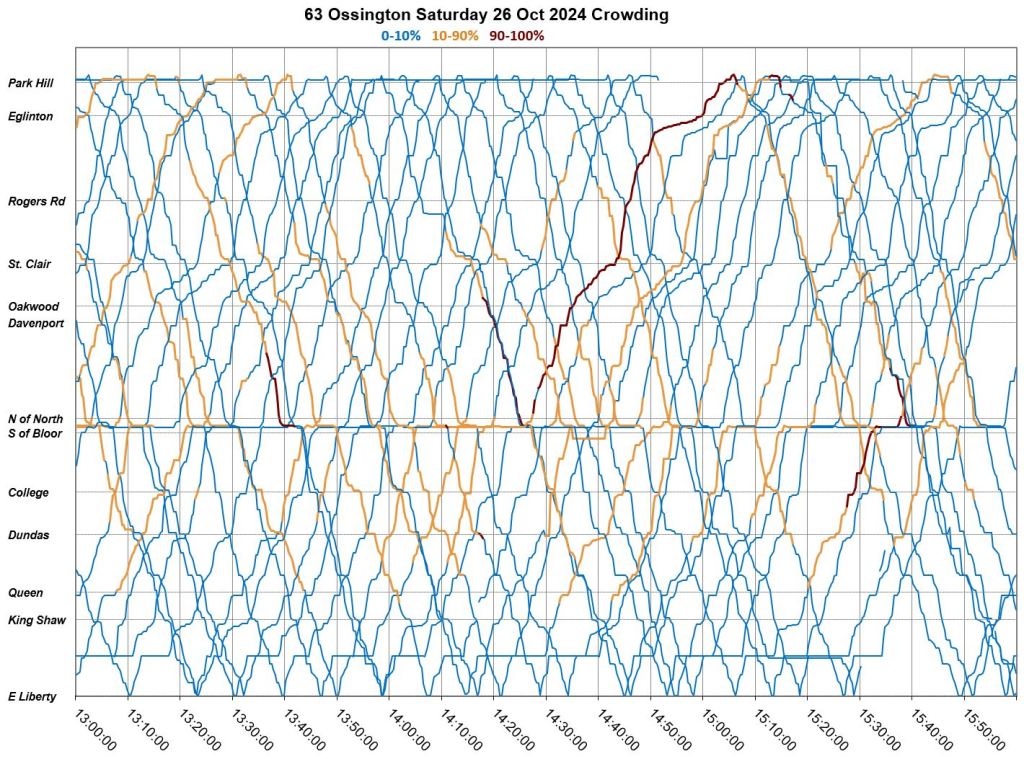
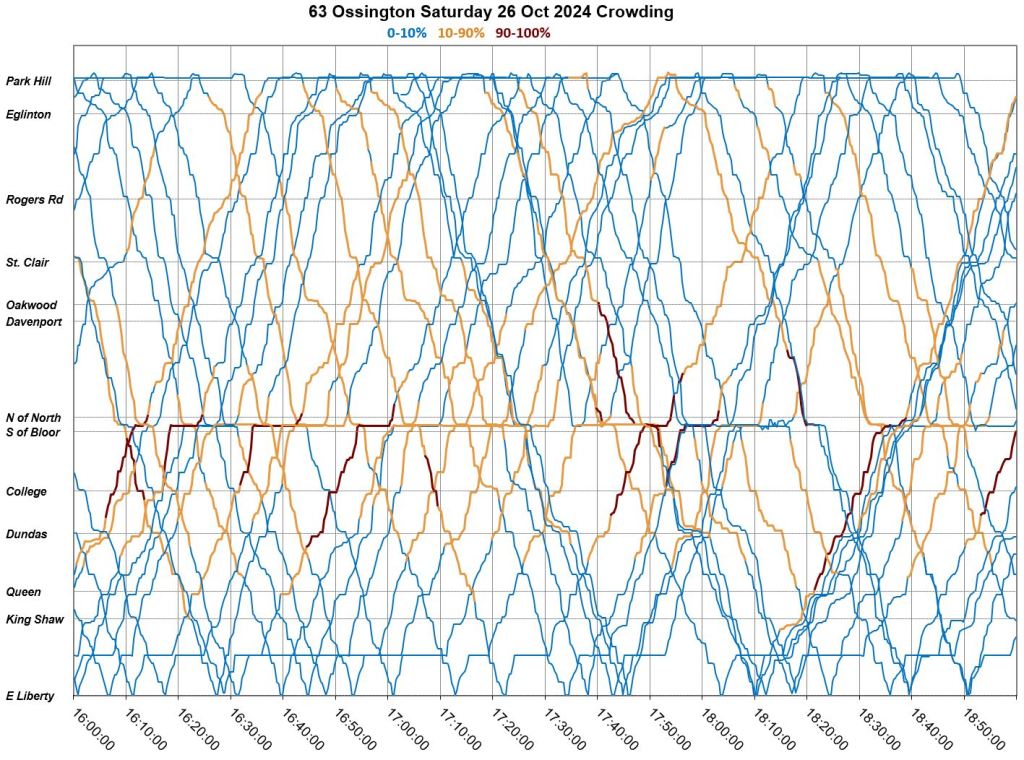
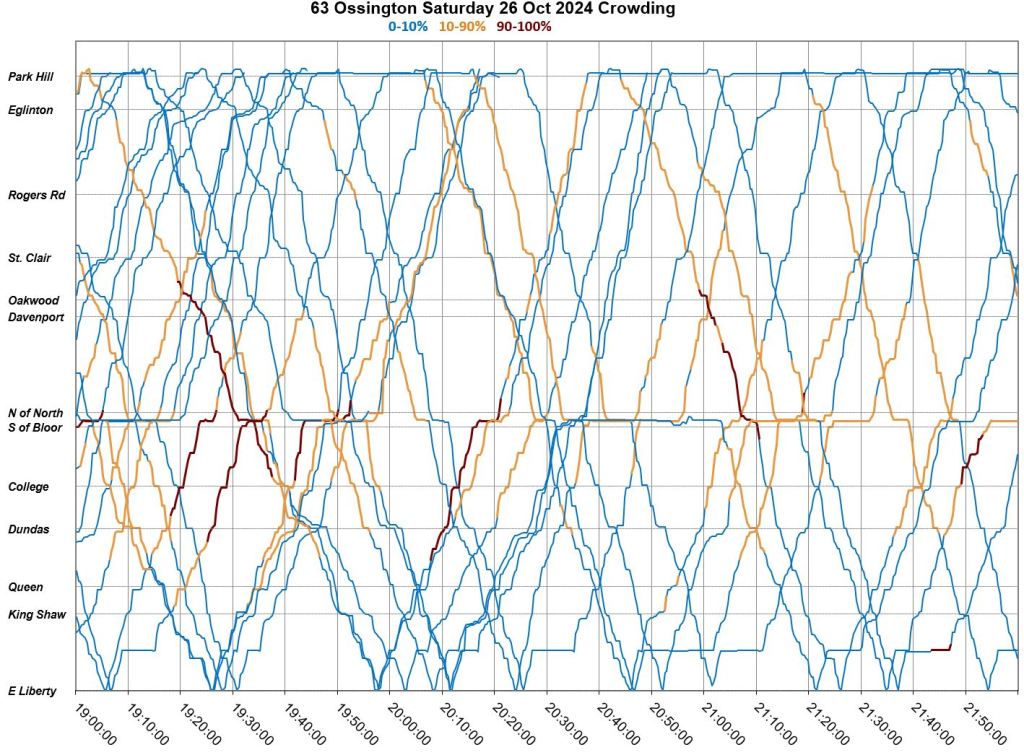
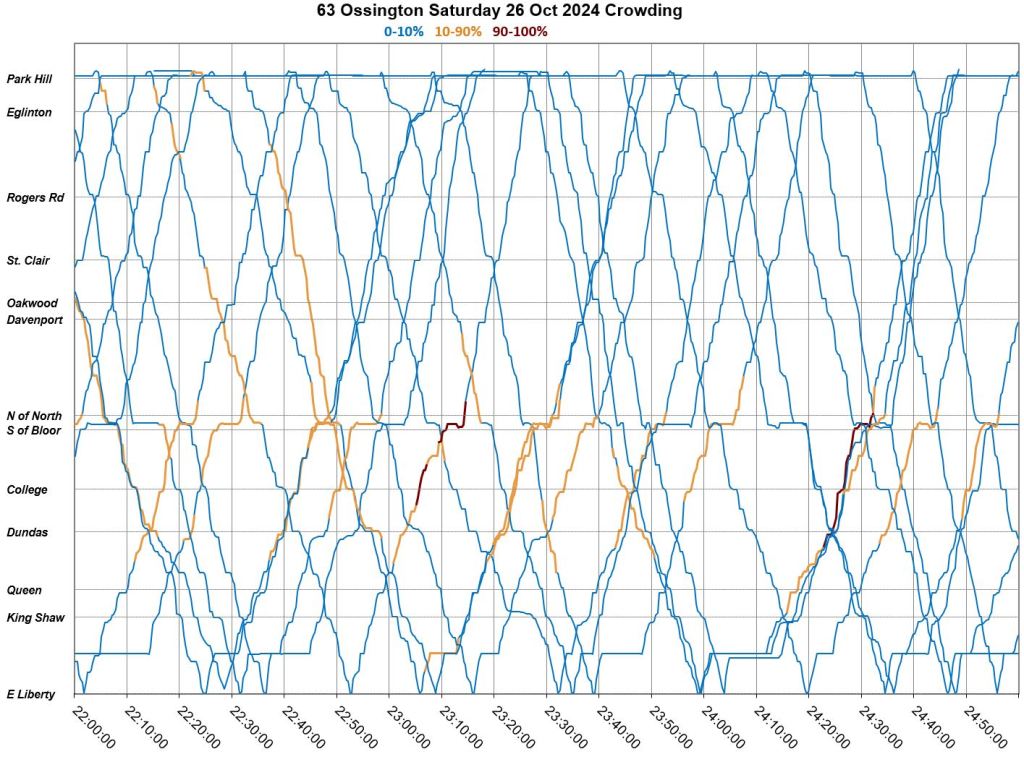
Saturday, October 26
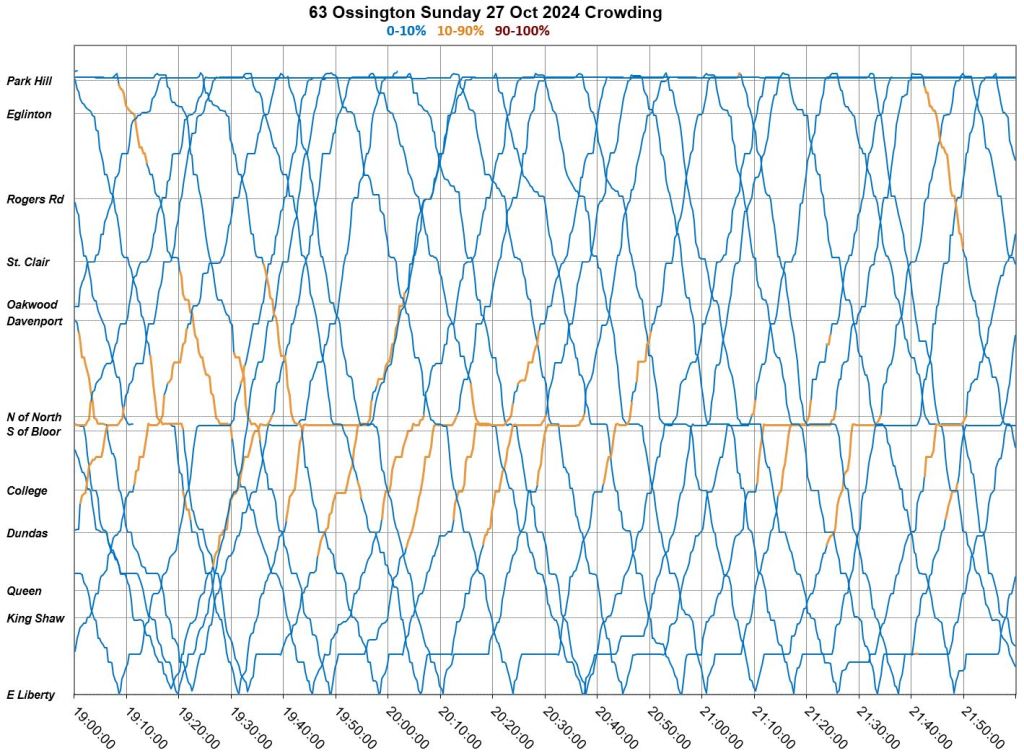
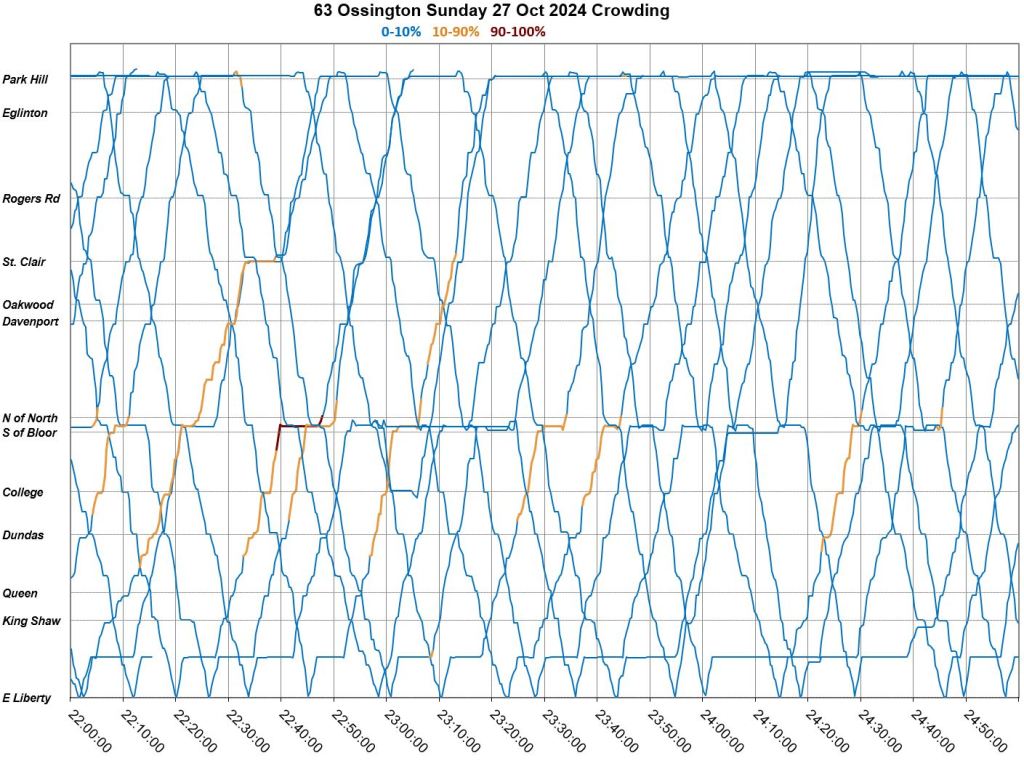
There are no service disruptions on October 26, and only brief congestion effects at Eglinton. However, a gap following bunched buses opens up southbound at about 5pm, and this echoes for two and a half round trips gathering more buses over time. More regular service sets in after 9pm, but some bunching is still evident through the late evening.
Similar service issues appear on October 27 as well.
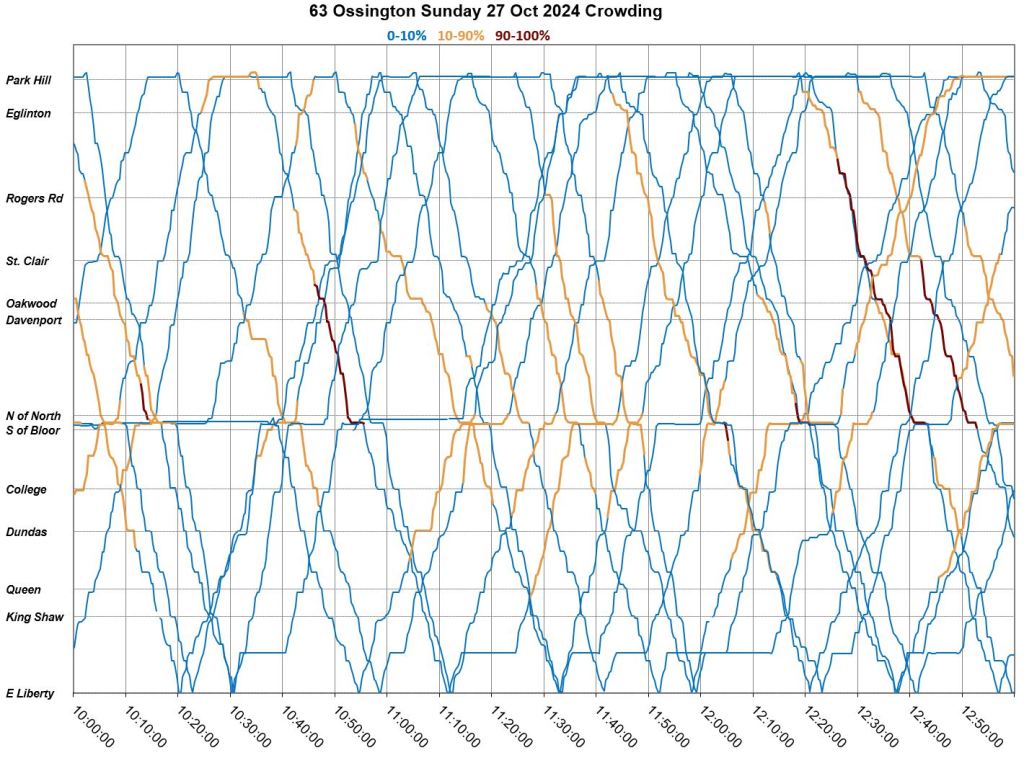
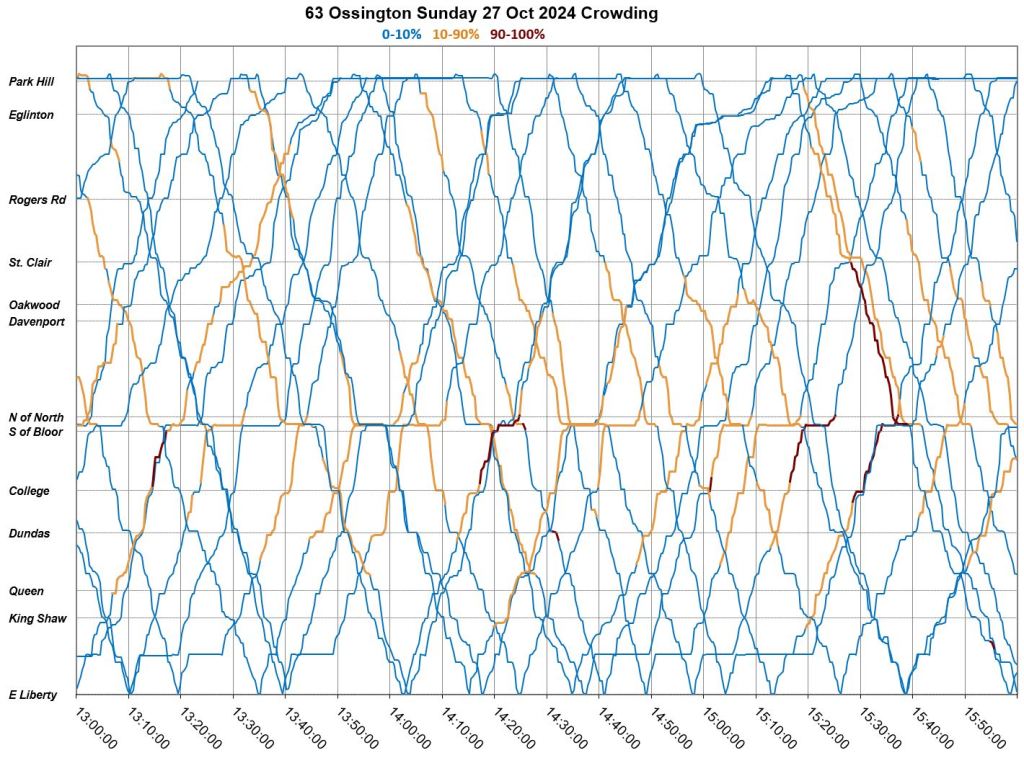
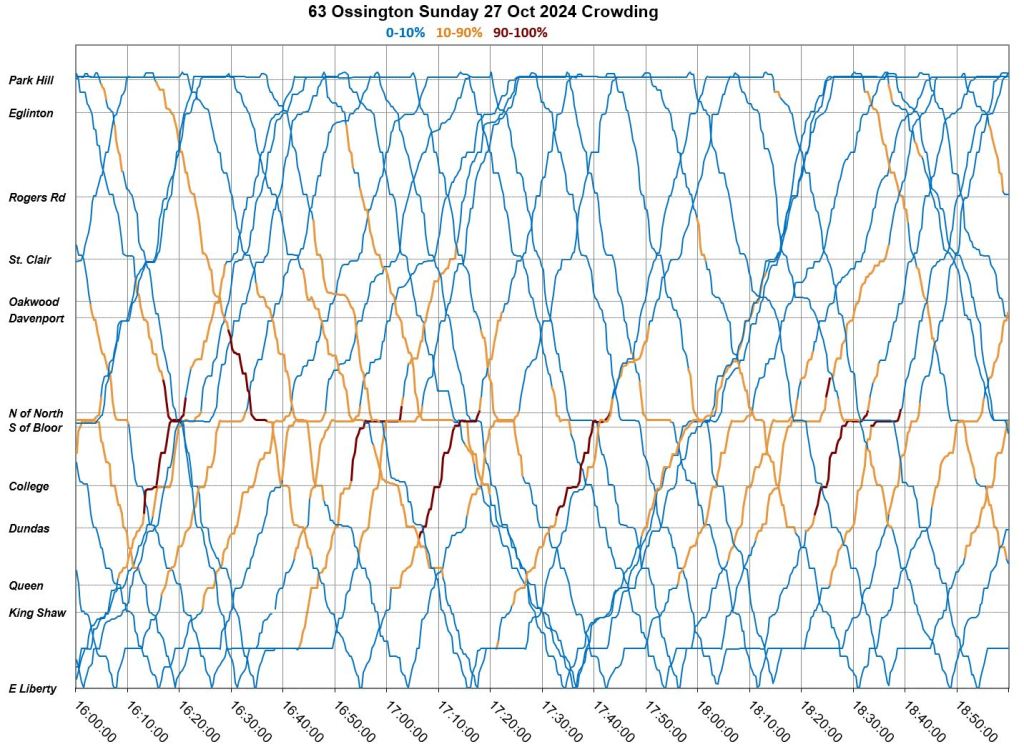
Sunday, October 27
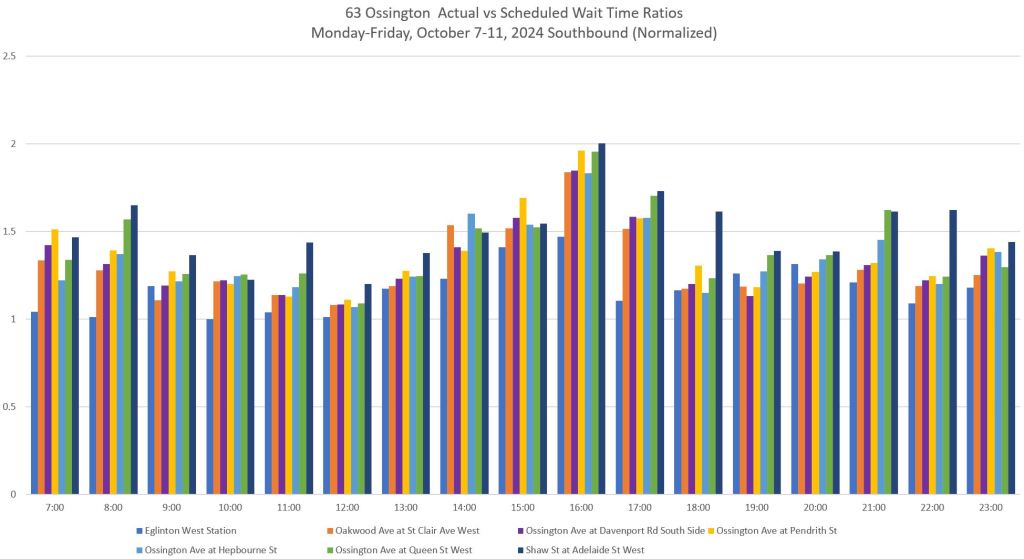
Actual vs Scheduled Wait Time Ratios
The charts in this section are based on the methodology described in Actual vs Advertised Wait Times. I consider this scheme still experimental, but include the charts for those interested in how this index behaves.
The height of the bars shows the ratio between the actual wait times riders face and the scheduled value. The data are subdivided by hour (groups of bars) and location (bars within each group). Values are weighted to account for the larger number of riders affected by service gaps and bunching compared to evenly spaced service.
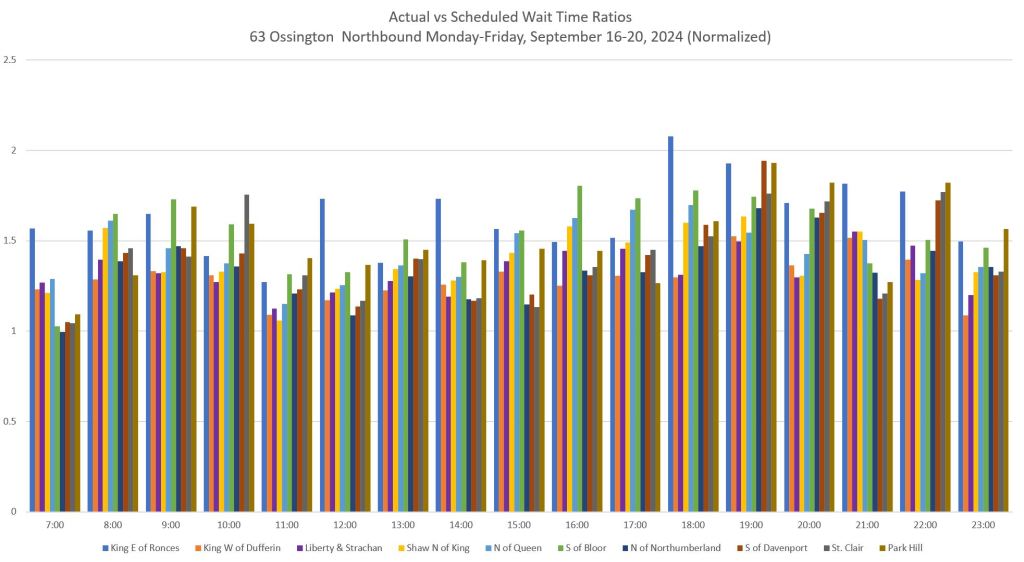
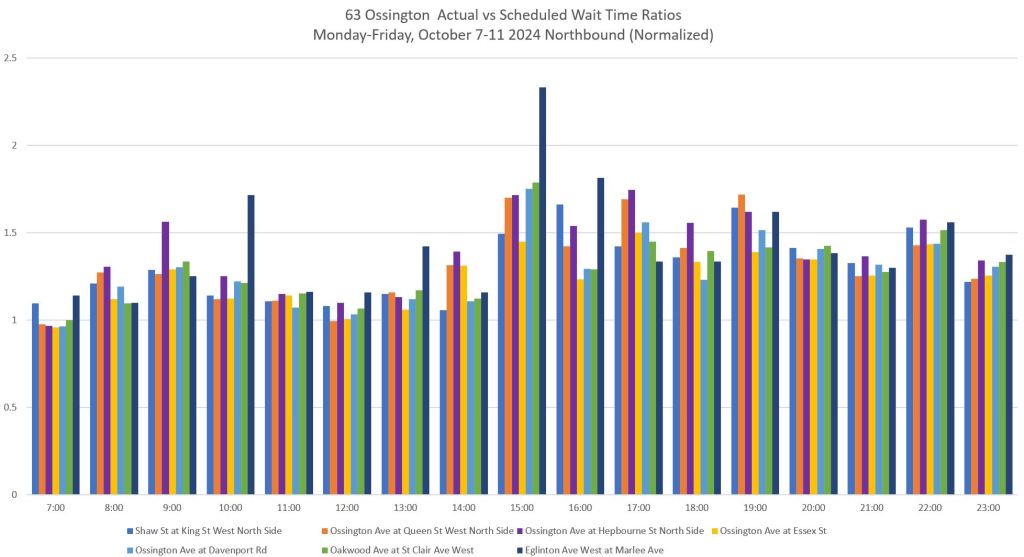
Northbound
The high blue bars at the left side of each group on the September chart shows the effect of erratic departures eastbound from Roncesvalles. Bus spacing improves further east and the ratio drops. The reason for this is that many buses took their layover on King east of Roncesvalles. The headways are measured west of the layover point.
This is an example of problems arising from an assumption about where headways should be measured.
In October, the midday values are close to 1 showing the effect of a new schedule and the return to the standard route.
Southbound
The ratio’s value southbound from Eglinton West Station (Park Hill screenline) sits close to 1 in many periods, but quickly rises further south. During the 4-5pm hour in October, the ratio goes up to 2 indicating that riders face considerably longer typical waits than the advertised schedule.


Thanks for this Steve, though I don’t use this service. Three points:
Steve: Looking at Google Street View, the stop has been well north of Queen (about 70m) since at least 2007, the oldest view online.
LikeLike
Have you’ve received the memo for the January 2025 service changes yet?
Steve: No. I will be putting out info re the short December board soon.
LikeLike
No matter what route is checked, the headway graphs invariably have a festive air, as if someone popped a few party balloons filled with coloured confetti and they landed all over the graph paper.
Steve: Years ago when I started these analyses, my purpose was to determine whether the usual line about streetcars and running in mixed traffic held water. An important thing I discovered is that bus routes are as badly screwed up in some cases. More recently, line management problems and Leary’s “no short turn” edict have contributed to the problems. I am not sure that many within the TTC understand just how bad things are, and they probably don’t want to know.
I have had, or attempted to have, conversations about how my analyses could help, or possible changes that might be useful internally, but sometimes get the “everything’s all right here” response. Wilful blindness.
LikeLike
Those crowding charts are astounding for how few riders there are south of Queen. Without seeing these charts, I would’ve assumed there was a decent number of riders generated by all the condos in Liberty Village. Instead, nearly every trip has, what, 5 riders or less in the section south of Queen? No more than 10% of capacity. Weekday… weekend… northbound… southbound… peak… off-peak.
Also… let me call out the 10-minute vertical gridlines on the Marey diagrams and how they make it easier to figure out how long gaps are… like that southbound gap at Ossington Station around 8 PM on October 5 (answer: a staggering 45 minutes!!).
Steve: I have seen a lot of “lightly loaded” buses in data since the TTC has included loading stats, and this is troubling. I am pursuing the numeric values rather than the low-medium-high rankings, and await feedback from the TTC. This also ties in with the service standards that called for no or few standees during off-peak periods. TTC management made a unilateral change effectively deleting this standard a few years ago. Now the questions are (a) how badly is this violated within that 10-90% load band, and (b) what would be needed to restore standards.
Re the gridlines, you’re welcome.
LikeLike
I’m pretty sure the threshold between “empty” and “few seats available” is a lot higher than 10%. I think it around 15-20 passengers. People could count the passengers while monitoring the reported load of the vehicle on TransSee.
LikeLike
Not being sure exactly where Sunnyside Loop is, not to be confused with looping through Roncesvalles Carhouse and nearby Humber Loop, Kipling Loop, and Long Branch Loop, I found the following:
And, from Wikipedia:
Even as a visitor to St. Joseph’s Hospital, I had no idea, but now I know!
On a slightly different topic, about the short missing link between Exhibition Loop and Dufferin Loop, the Harbourfront West LRT extension, is there any progress? By now it should be known where the Ontario Line will be placed. I have rarely seen any mention of this in the past year. Thanks, Steve.
Steve: This project is stalled because of the Ontario Line and, I suspect, because of “planning” for a link from Exhibition Station to the Ontario Place site. Construction of Exhibition Station will also get in the way for some time. This is, frankly, not a very high priority project without the extension west to The Queensway that would bypass the traffic bottleneck in Parkdale.
LikeLike
That’s the trouble with naming things after landmarks that shut down almost 70 years ago.
Steve: Like “Woodbine Loop” named after the racetrack that was rebranded as “Greenwood” after “New Woodbine” track opened, not after the street a few blocks further east.
LikeLike