
With the June 23, 2024 schedule change, buses were replaced with streetcars running from St. Clair Station at Yonge to Gunn’s Loop west of Keele Street. Buses operated mostly in the regular traffic lanes, not on the streetcar right-of-way.
This article reviews the travel times on the 512 St. Clair bus and streetcar services to compare travel times over the route.
Although the streetcars in week 4 of June (beginning on June 23) are overall faster than the buses they replaced, the degree of this advantage varies by location and direction.
This is a companion piece to my review of the streetcar-to-bus change on 510 Spadina that happened at the same time.
The overall observation here is that although travel times are now shorter for many riders, headway reliability is very poor and gaps can undo the benefit of a faster trip.
Service Level Comparison
Added July 7, 2024 at 9pm
The table below compares the bus and streetcar services on 512 St. Clair before and after the June 23 changeover. It is taken from my detailed article on those changes.

St. Clair Station to Gunn’s Loop
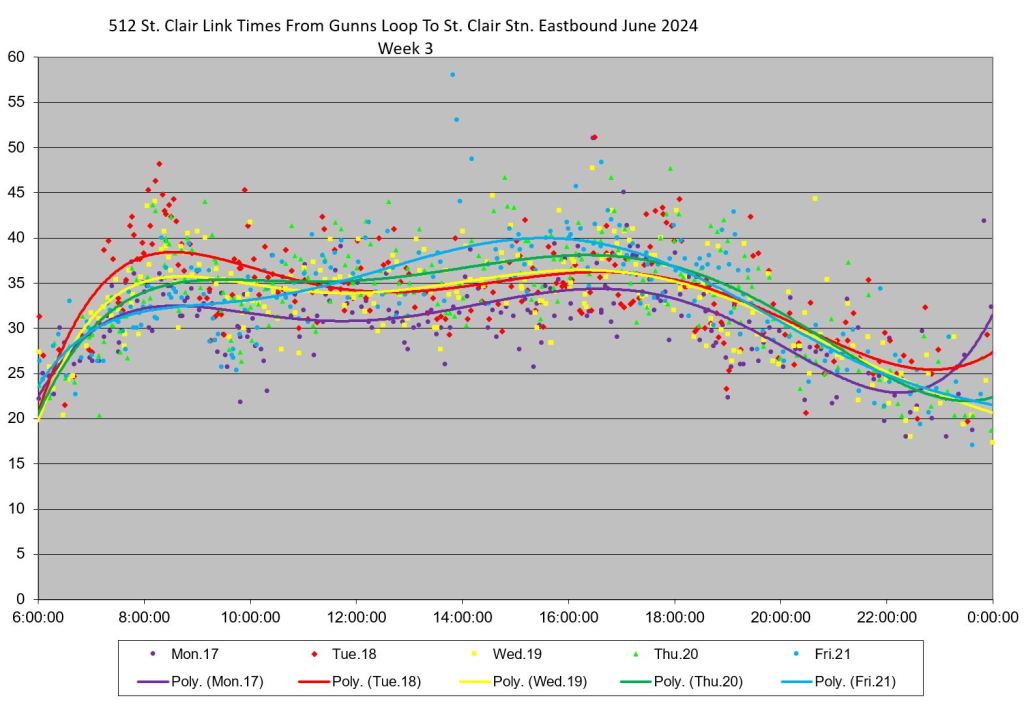
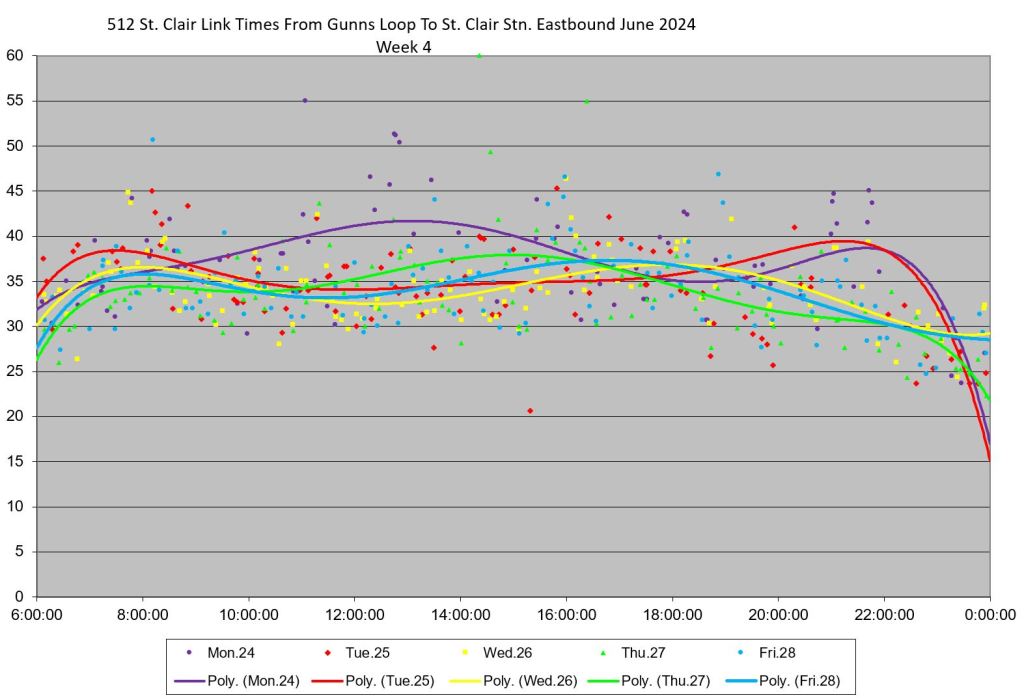
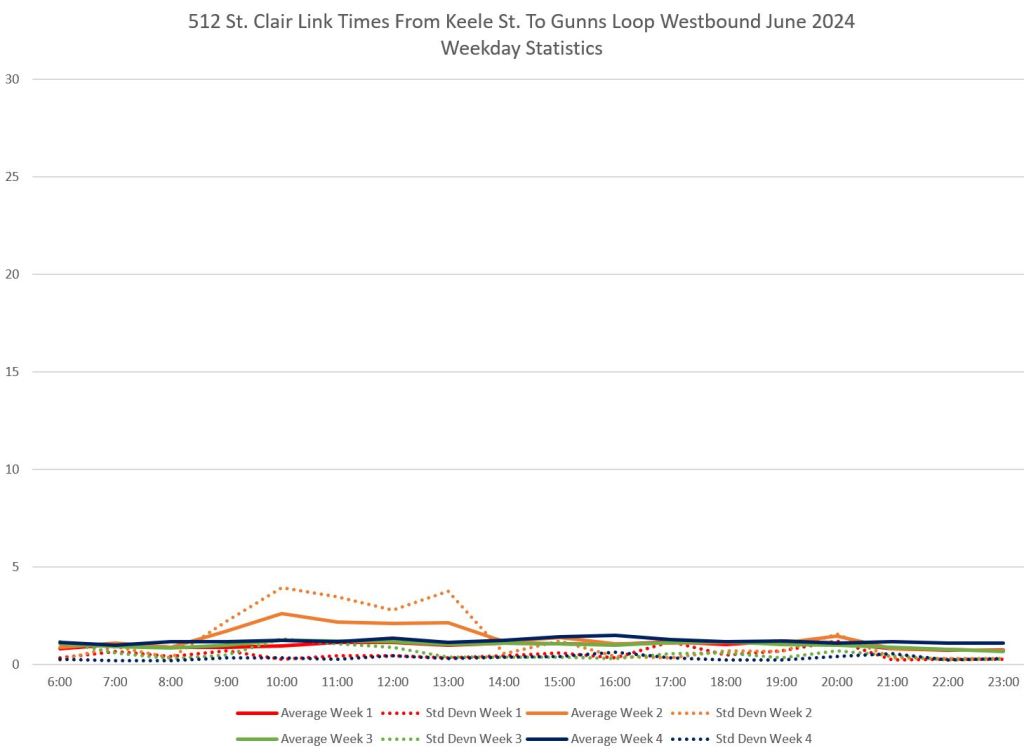
The charts below show the weekday travel times, by week, between St. Clair Station and Gunn’s Loop for westbound (on the left) and eastbound (on the right) service. Week 4, operated with streetcars, is the dark blue line while Weeks 1-3 are shown in red, orange and green.
There is a clear difference between streetcar and bus times westbound, but eastbound this only shows up in the evening and then not in the streetcars’ favour.
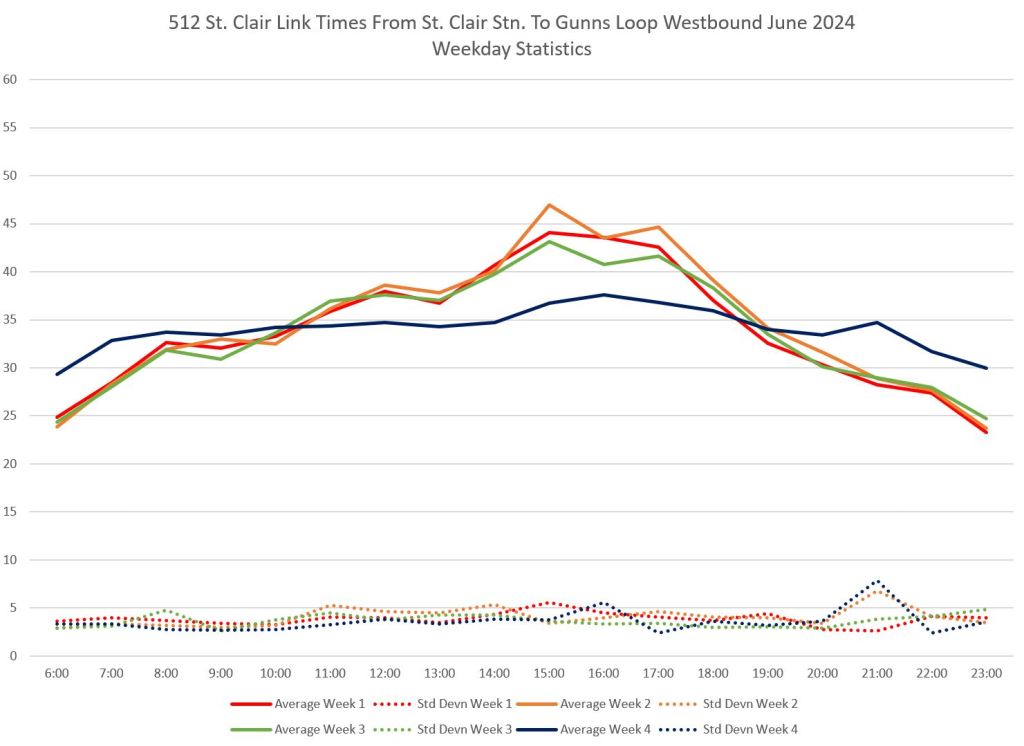

Part of this is due to a major delay on Tuesday, June 25 which caused extended travel times, but even with that day removed, the streetcar times are still longer. (No service alert was issued for this incident, and so its exact cause is unclear.)
The charts below show the weekday and weekend travel times westbound. The Week 3 and Week 4 charts show a clear difference between bus operation in the traffic lanes and streetcar operation on the right-of-way. On weekends, the three streetcar days (June 23, 29 and 30) show lower and much more consistent times throughout the day.


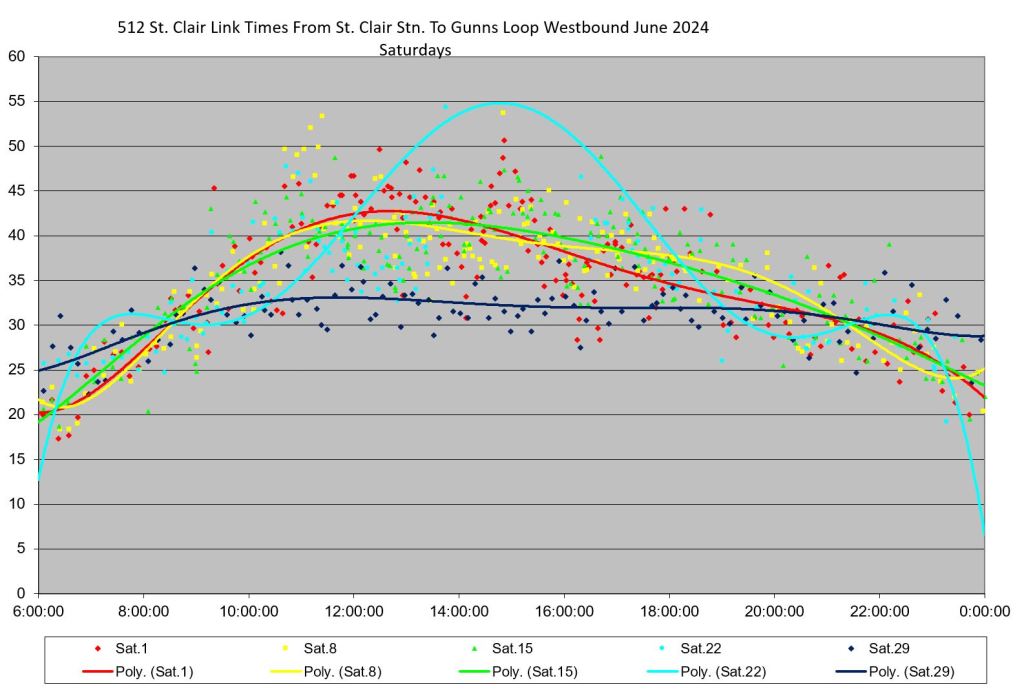

The charts below show the corresponding travel times eastbound. On weekdays, the streetcar advantage over the buses is negligible. On weekends, especially on Saturday, June 29, streetcar travel times are consistent and shorter across the day much moreso than buses. Sundays are slightly better for streetcars.


Sectional Breakdowns
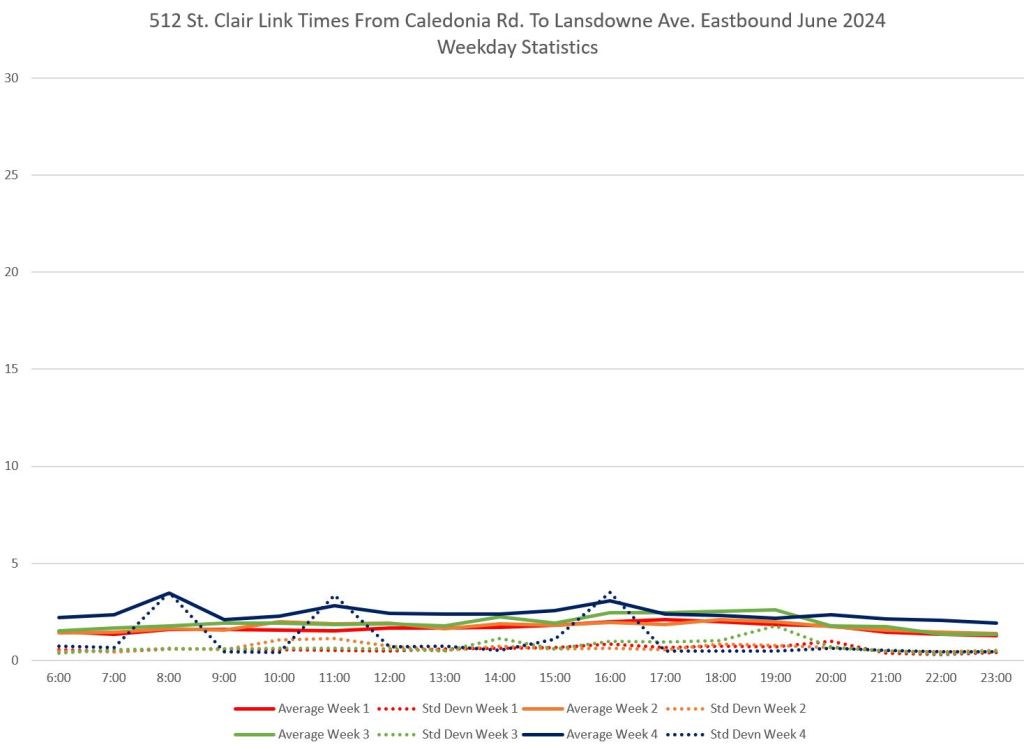
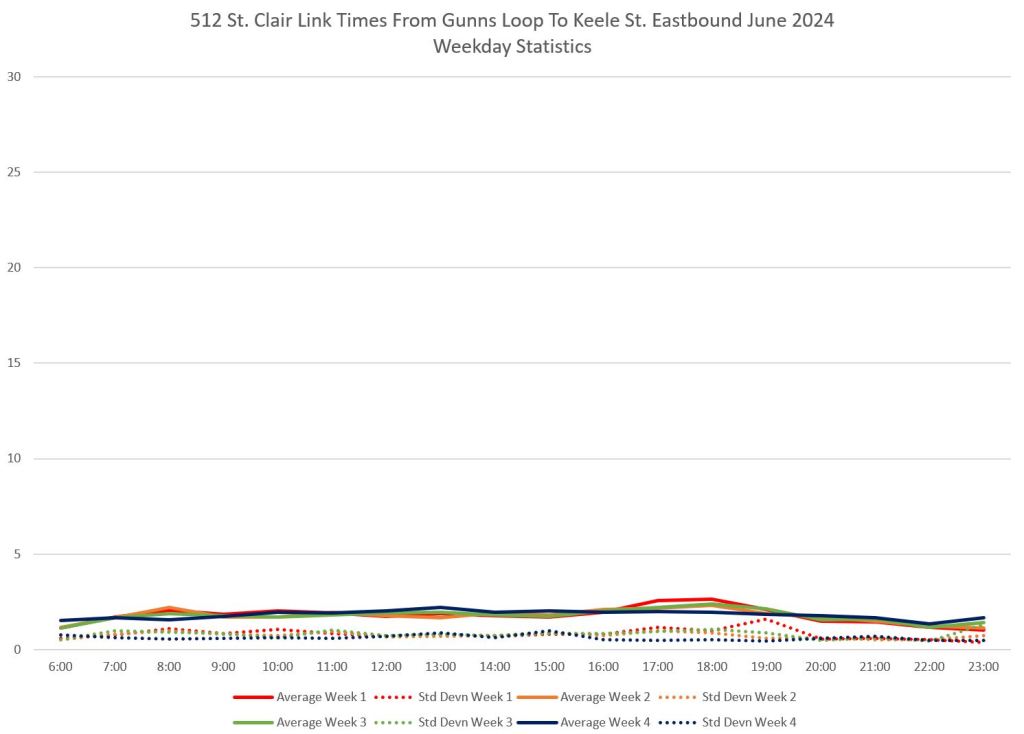
The charts below show the weekday travel time stats for each segment of the route to isolate locations where there is actually a difference between the two modes. In these cases, I am not publishing the Week 3 and 4 detailed charts because the overall stats tell the story.
Charts on the left are for westbound travel, on the right for eastbound. Some of the segments are fairly short and so the difference in travel times is not large. Where the dark blue line lies more or less on top of the others, the streetcar times are roughly the same as the buses. Where the lines move apart, streetcars are faster (below) or slower (above) than buses for that segment and direction.


Headway Reliability
One would hope that with a return to reserved lane operation and greater consistency in travel times, headways would be more reliable with streetcars than buses. In fact the streetcars are considerably worse.
A premise (and a dubious one at that) for TTC line management is that if service “on time” at terminals, them the rest of the line will take care of itself. It might even be possible to demonstrate this is there was something resembling reliable headways leaving St. Clair Station and Gunn’s Loop. However, actual headways are all over the place, and it is impossible that this line is running “on time” by any definition of the term
Although riders have had to put up with erratic travel times on the buses, at least they showed up more often than the streetcars.
Several notes common to these charts:
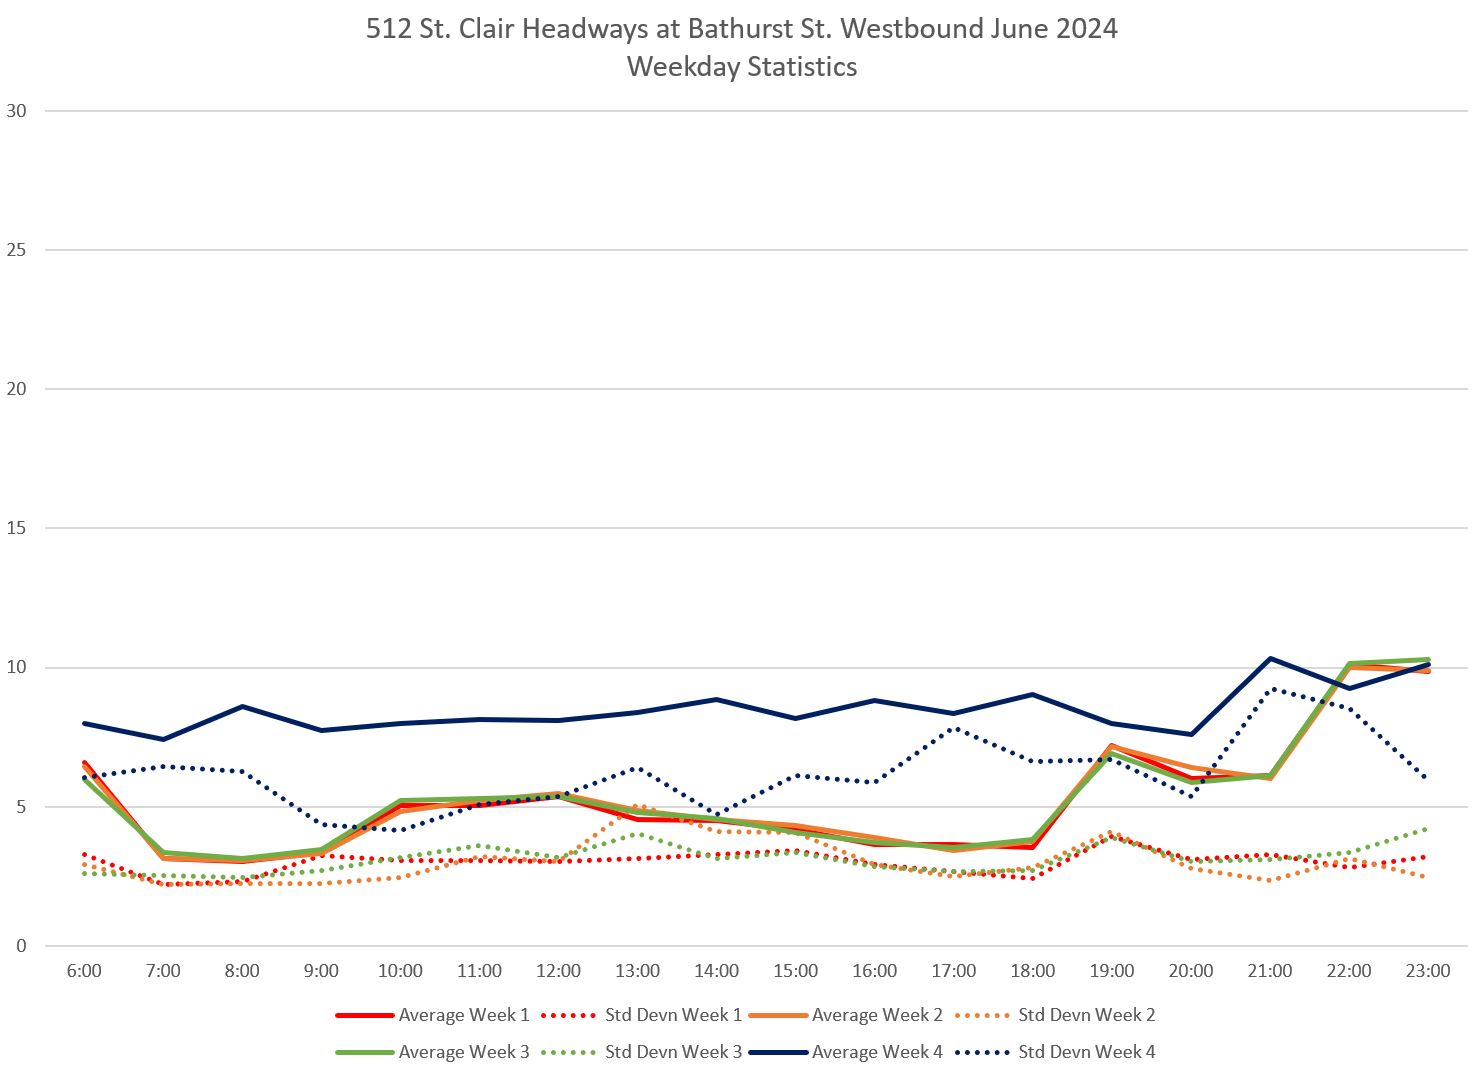
- Note that the standard deviation (dotted line) for the Week 4 data is generally higher for other weeks. This shows that the data points are more spread out in Week 4 (streetcars) than the bus weeks, even where the location is at or near a terminal where some sort of reliable dispatching might occur.
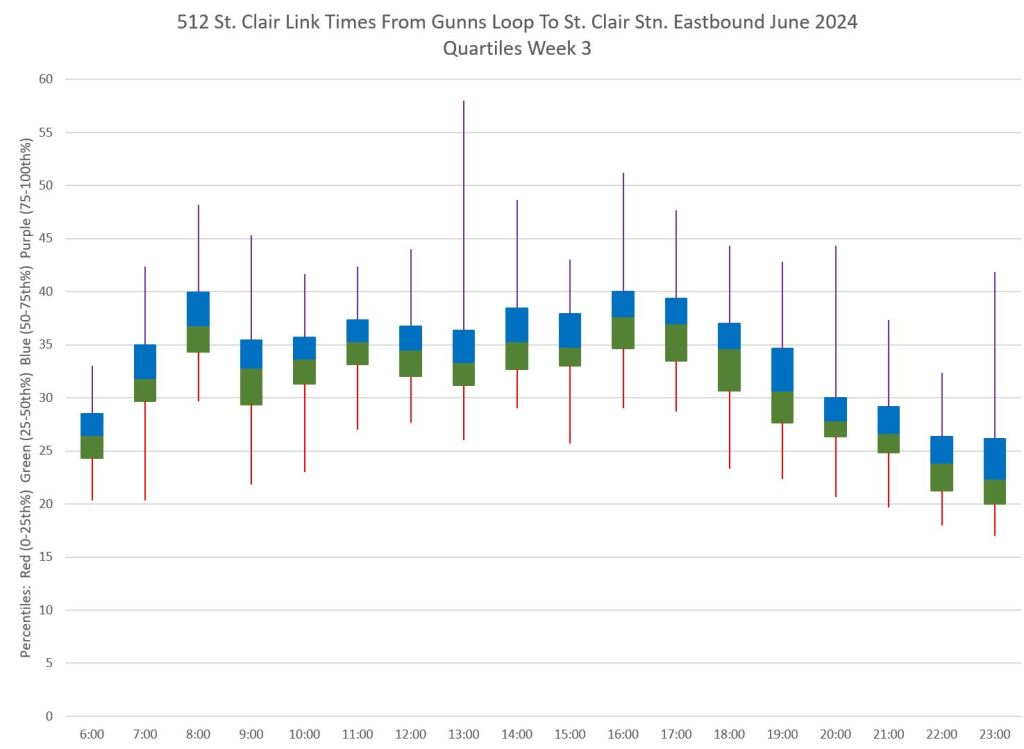
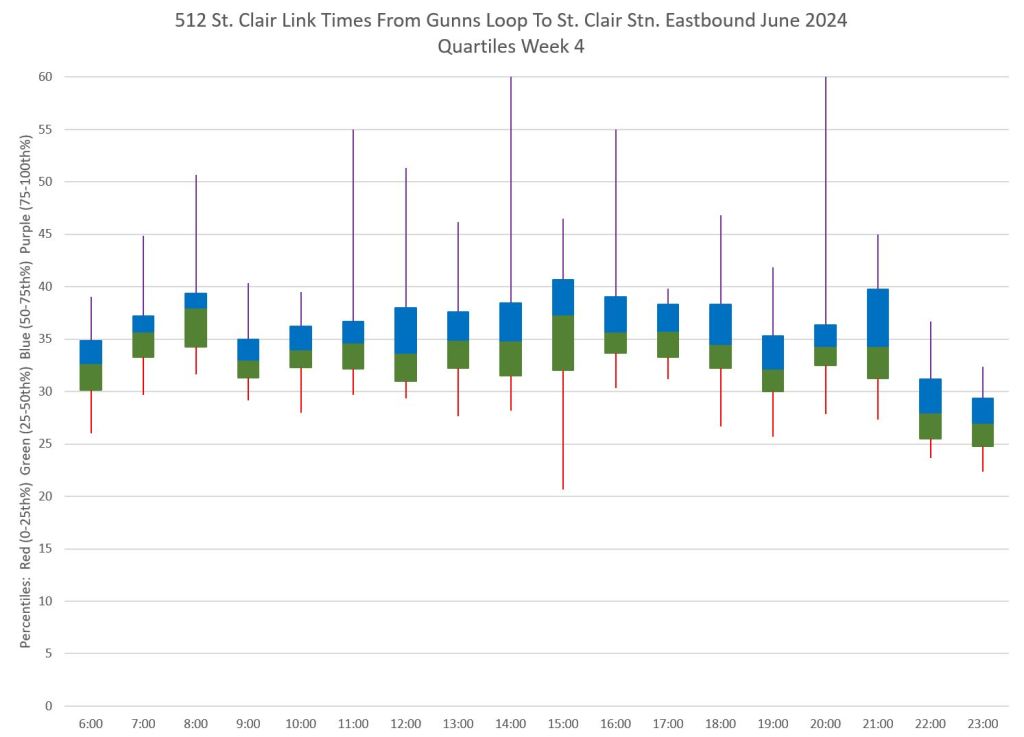
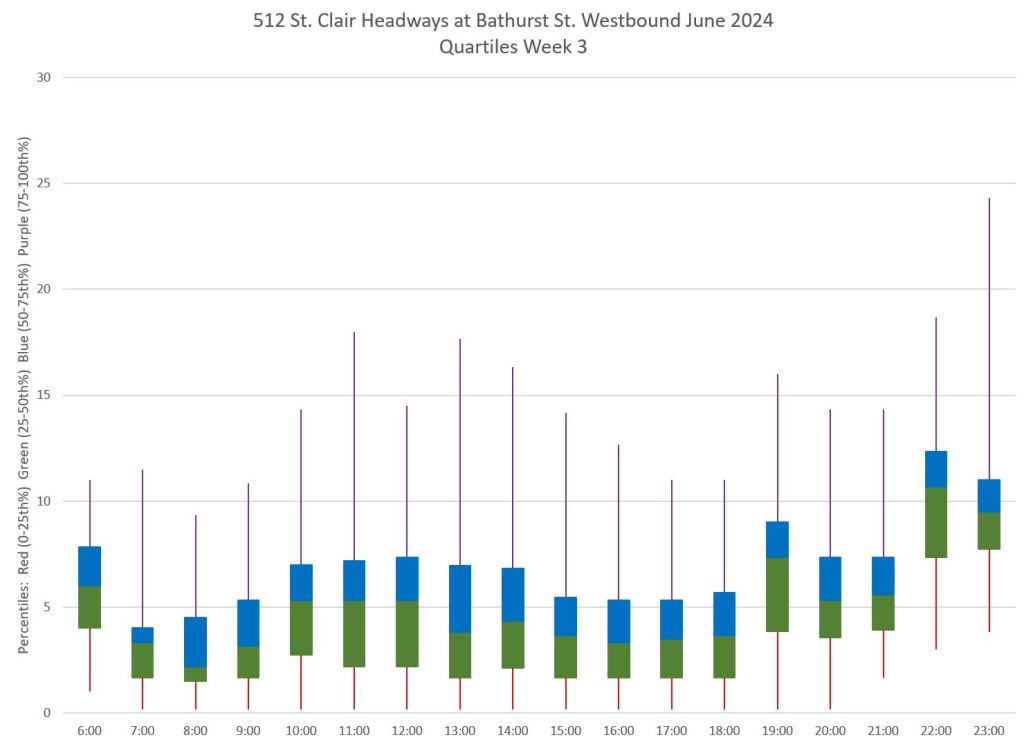
- This spread also shows up in the quartile charts where both the over all top-to-bottom span and the width of the central blocks with quartiles 2 and 3 are wider for Week 4.
- The trend lines for individual days lie more or less on top of each other. This indicates that the same overall level of service was operated, and that there were few or no missing runs.
- Individual data points lie in bands across most charts. This is caused by buses and streetcars effectively being “dispatched” or regulated by the cycle time of the traffic signals. It does not matter what the scheduled headway is, the actual value will be a multiple of the signal cycle.
Westbound at Yonge Street


Westbound at Bathurst
Service at Bathurst is roughly the same as what we see at Yonge above, although the headway values for both modes have spread out slightly. This is a typical pattern on transit routes where gaps get wider and bunches get tighter as vehicles move along their route.


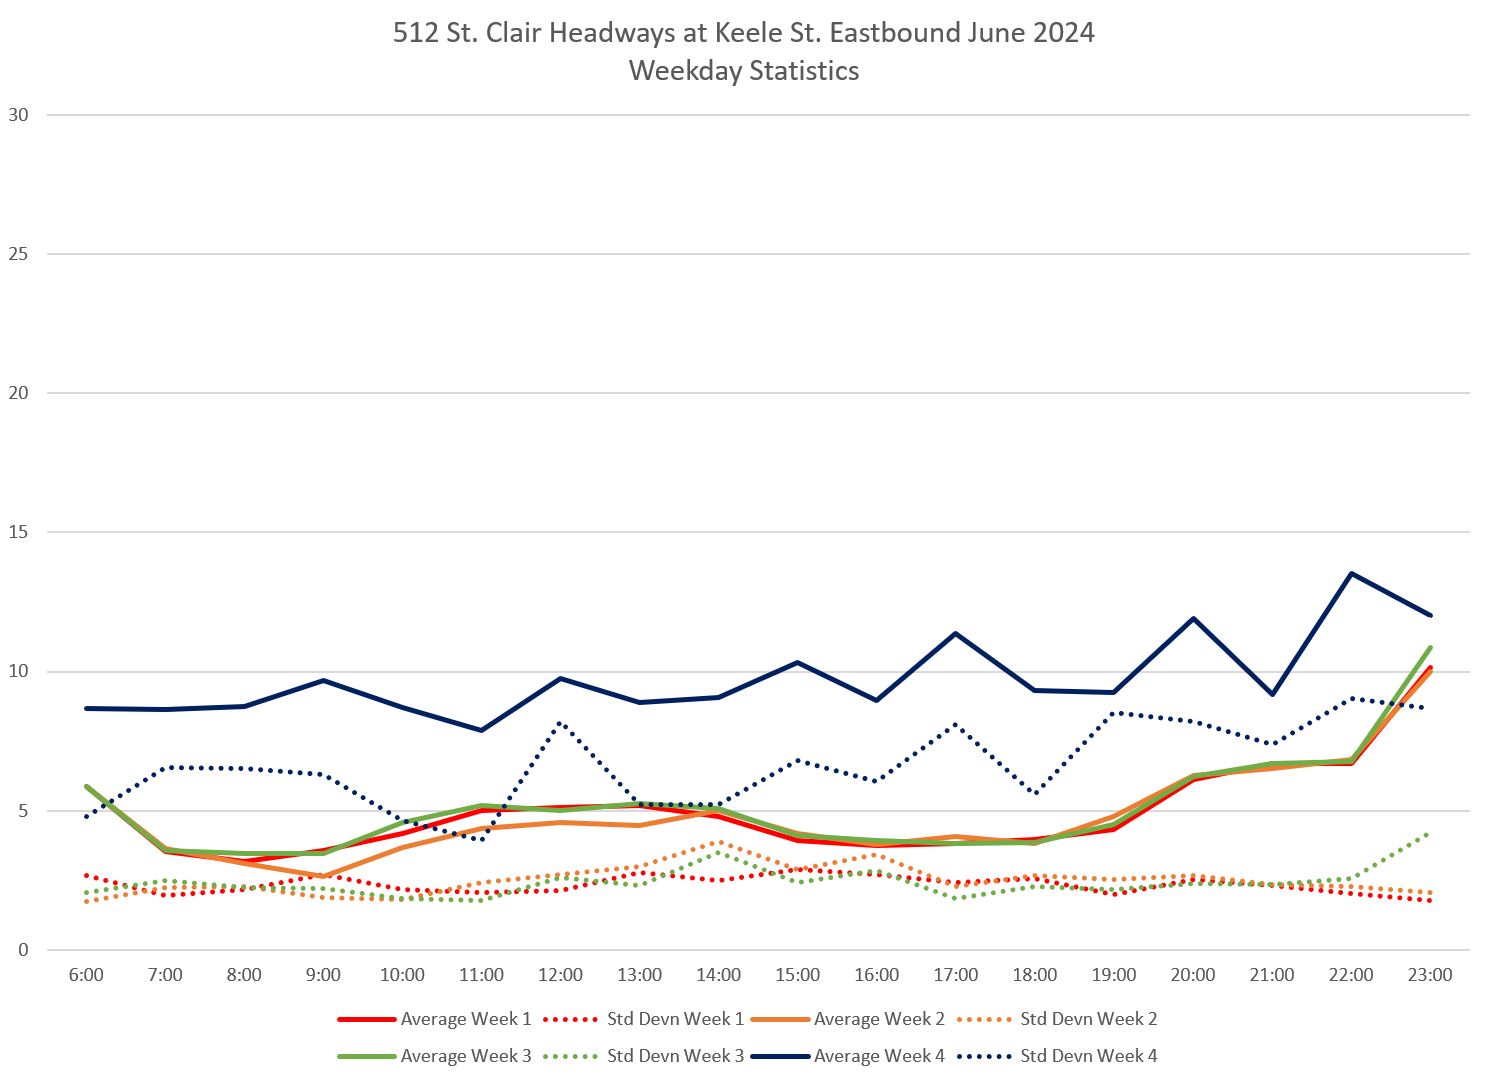
Eastbound at Keele
Service eastbound crossing Keele Street shows a similar pattern to the westbound departures at Yonge, and the SD value is very high indicating an extremely erratic service even though this is a terminal location.
Some of this is due to short turned cars at Landsowne, and the stats for Dufferin eastbound below are not quite as bad, although still nothing to brag over.


Eastbound at Dufferin
Note that the average streetcar headway at Dufferin is lower than at Keele (above) thanks to cars that joined the service eastbound at Lansdowne.


Eastbound at Bathurst
At Bathurst, the average headways look reasonable, but the actual distribution of vehicle arrivals is all over the map with streetcar gaps of over 20 minutes common, and a corresponding large number of very short headways. The streetcars tend not to have “zero” headways because only one crosses the intersection on a traffic signal cycle due to platform constraints. Buses, by contrast, regularly cross in pairs on the same cycle.


Thanks much for this great effort to capture the scene.
I’d welcome further help in providing lessons, conclusions, or other synopses of the data. Especially, implications for fixes needed.*
Ben
LikeLike
reply to Ben barkow
maybe the solution is automated streetcars. Take the human element that has to be “managed” out of it
Steve: Maybe the solution is humans who do their jobs properly.
LikeLiked by 1 person
Ben Barkow notes “they intentionally kill a traffic-light cycle or two so as not be show up early for their inspection.” Is anyone actually paying any attention as to whether vehicles are arriving ‘on time’? If Transit Control or the on-street inspectors (do they even exist now?) were paying attention one would assume they might try to deal with this and if they were on top of things would ensure the vehicles at least departed ‘on time’. Your charts show that that there is virtually NO (effective) route management on this or any other route so I see no reason why operators would make any efforts not to arrive early.
Steve: Moreover, TTC only measures “on time” at terminals. Bathurst Street or St. Clair West Station don’t count.
LikeLike
Is there any evidence that TTC management / board has any desire to fix these issues? Are they actually looking at this data, and just ignoring it because they don’t think they can get the funding or infrastructure changes to improve service? Or are they just covering their eyes and ears and thinking that everything is great!, and patting themselves on the back for just getting streetcars back?
Steve: Frankly I think that unless board members are set upon by constituents and actually see the problems for themselves, they are ignorant. For years I have heard deputations at board meetings complaining about service quality. Some board members might mumble mild objections, but they swallow the so-called statistics churned about by management every time. There is an unwillingness about challenging the veracity of management reports on the presumption that they are all “honourable men”.
LikeLike
Right of way streetcars and LRTs will in most cases be [more?] reliable than buses.
I cannot find the review for Route 34 Eglinton East, but that route is a nightmare. Crowded at Kennedy station during rush hour and buses only arrive every 15 to 25 minutes.
I guess that they’re waiting for the 40-storey mega condos to sprout up along the Eglinton East corridor, and the long term residents to move out and crawl in a hole before increasing and improving service along that line. Gentrification for the win.
Steve: I have not been tracking 34 Eglinton East in detail because of the construction, but do have some data for 2020 and 2022. I will get some current data to allow for a comparison over the last five years. Stay tuned, but it won’t appear for a while.
LikeLike
I have 2 questions about this comparison.
Steve: I have added a table with info about vehicle counts and schedules to the article. And, yes, having a lot of buses can add to traffic woes particularly because of stop service time.
Fire trucks would only be on the right-of-way one way at a time and so the concern about buses passing does not apply.
LikeLike
You noted that, with the switch back to streetcars, headway reliability often undoes the benefit of a faster (if at all) trip. But even with perfect reliability, the streetcar trip would have taken longer on average because of the longer headways.
If the average streetcar headway in week 4 was 4 to 5 minutes longer than the bus headways in weeks 1-3, the average waiting time would have been 2 to 3 minutes longer, which would have negated most of the travel time savings (if any!) except maybe in the afternoon peak period, and even then only for riders traveling most of the length of the route.
(I’m curious if you’ve reviewed the CLRV vs Flexity travel times on St. Clair, or other places where a direct comparison can be made absent the potential for speeds to be affected by traffic. It seems like travel times have gone up with the Flexitys, if only because of how long the door service times are.)
Steve: Yes I have done such comparisons. For example, here is an article about 501 Queen. There are other articles on the site on this topic.
LikeLike
Steve has been publishing this type of anaysis on his web site for over 15 years now, including those Marey diagrams that show lax service management in plain sight. I can think of a couple of measures that have been implemented, but both have had unintended consequences:
And even with these measures, service reliability still comes down to operators and supervisors / transit control. How closely is transit control monitoring the route? How lax or aggressive are supervisors in managing the service? Are the operators leaving terminals when they’re supposed to? etc.
Steve: I lay all of this at the feet of Rick Leary who was hired, so to speak, to make the trains run on time. His standard approach is to pad schedules . What is so frustrating in all of this is that the TTC could be doing the same sort of analyses as I am to determine appropriate designs and to review line management techniques. Over the years, a common complaint I hear, privately, from some management is “I wish we had those charts from our own people.
I was inspired, among other ways, by something I saw at the SkyTrain control centre in Vancouver shortly after the line opened. Their train control system produced a strip chart in Marey format for every day of operation, and when things went badly, they would review the service’s behaviour and tweak the schedule options for this automated system and how it would react to unusual conditions. I started producing my analyses of TTC data two decades later, although initially the absence of GPS on TTC vehicles made the tracking very coarse.
LikeLike
Further to your remark “that unless board members are set upon by constituents,” do I have a particular board member I can set upon? Do they represent wards or other geographical areas? And how would I set upon them? Email?
Thanks.
Steve: Some board members are “citizens”, that is to say not Councillors, and they tend to have limited dealings with voters. That group hails from the era when pols thought that putting some private sector people on the Board would bring new ideas. In theory it’s possible, but when the members are chosen more for political connections than expertise we get the worst of both worlds — a politician with no accountability.
If you are lucky enough that your Councillor sits on the Board, you can complain directly. If not, you can still complain and hope that your Councillor will be supportive in taking your issues to colleagues who are.
LikeLike
Do we know why the St. Clair streetcars perform slower than buses, despite having dedicated lanes? Is it the horrible advance left-hand turns, which prioritize cars ahead of streetcars?
Steve: One common factor I think between Spadina and St. Clair is that buses stop nearside, and so they don’t fall out of the traffic wave by making a farside stop. This is related to signal timings and the issue of whether streetcars get extended green times to ensure they are not held nearside by arriving “late” in the cycle.
One the July data are in, I will have more to work with and plan to compare average speeds an a detailed level along the route over the course of the day. This will show exactly where each mode has an advantage.
Bus drivers tend to be more aggressive, to the extent that traffic allows, than streetcar drivers.
Another factor that does not show up in speed comparisons is stop service time. This is affected both by crowding and by door operations. A stopped vehicle is “travelling” at the same speed regardless of mode, but might spend longer stopped because of vehicle design. We saw this in the slowdown on all routes after the CLRV-to-Flexity conversion.
LikeLike
I wrote on June 25th about a streetcar ride that morning from Gunn’s Loop to St. Clair station, where the car was overwhelmed by riders that could not embark, that there was “obviously not enough vehicles to meet the demand”.
I took a similar trip this past Wednesday morning July 3rd at 7:30 am, but this time all was good. The car arrived promptly at Gunn’s Loop. As we left Gunn’s Loop, the next car arrived at the lights. It was only between Christie and Bathurst that there remained standing room only.
And yesterday, I took the reverse trip at 4:00 pm, and again all was good. Not all of the seats were taken.
I would guess, therefore, that TTC management has added sufficient vehicles. 512 St. Clair is an important and key route because the nearest parallel east-west routes are Eglinton and Dupont, and those are too far away. Compare 512 to College or Dundas routes, which have Wellesley-Harbord, Bloor, Queen, and King in parallel, maybe which is why the TTC figures that College and Dundas can subsist with poor headways.
Yes, when buses were substituting on St. Clair, it seemed to me that the smaller vehicles resulted in oftener service. But, the buses could not compare in comfort.
This past week, my experiences riding on the TTC was unusual – Wellesley and Sherbourne buses, all the subways, and 509 Harbourfront car all ran very well.
LikeLike