
Introduction: Regular readers of this site will recognize threads and arguments from past articles here. Indeed some recent posts were intended as background to this overall article on our city’s transit direction. There is a new Mayor with Council support for change. However, we risk that momentum will be lost and content ourselves with “full service restoration” and a handful of RapidTO projects.
This is not exactly a manifesto, but we have been here before with hopes for new and improved transit seeking progress beyond “business as usual”. Will this round be any different?
Thanks to readers for tweaks in the text. This is a long article, and I have broken it into segments with hotlinks here so that you can jump to specific chapters.
- Part 1: Origins of the Ridership Growth Strategy
- Part 2: 2024 and Beyond
- Part 3: Looking Back at the 2003 Plan
Part 1: Origins of the Ridership Growth Strategy
Back in 2003, the TTC adopted its Ridership Growth Strategy in a move to change the debate on what the TTC could be. That document came from the efforts of progressive members of the TTC Board, notably then-Councillor David Miller who would, later that year, be elected Mayor.
Following the recession of the early 1990s, the TTC lost 20% of its ridership, and there was a long, slow climb back. The problem was compounded by the Harris government at Queen’s Park cutting all provincial transit funding and leaving the City to carry all costs.
A decade-plus of making do with available funds led to a stock response of “we can’t afford that” to any proposals for better transit, and an ingrained management focus on just keeping the wheels turning without advocacy for improvement. Even worse, when any money did magically appear, it would be scooped for the pet project of the moment with no comparative review of how else it might have been used.
The Ridership Growth Strategy arose from the thought that some changes might not be as financially challenging as had been implied. The TTC Board, Council and public deserved to know what might be possible and at what cost.
The challenge to management was this: don’t tell us what we cannot do, tell us what we might do and how much money we need. Let the policy debate occur on an informed basis. When I reviewed the progress-to-date in 2010, the results were mixed. (Details of the 2003 plan are at the end of this article.)

In December 2017, the TTC issued a new Ridership Growth Strategy, but it was much less ambitious. It came on the heels of a ridership decline that began a few years earlier. In fact, although the TTC managed to grow through the first part of the 2010s, the rate of growth slowed and by 2017 had shifted to decline. At the time, then CEO Andy Byford observed that the growth came by filling up spare capacity on the system, primarily in the off-peak, but even that had its limits.
I wrote about the 2018 RGS when it was presented to the TTC Board in late 2017, and for the now-defunct Torontoist website.
See:
- TTC Board Meeting: Monday, December 11, 2017
- Can the TTC Gain More Riders? [Adapted from Torontoist article]
Total ridership counts were flat through the mid 2010s, but growth in children’s trips through free fares as well as senior/student riding masked a decline in adult trips. Also, the trip multiple for pass holders (the number of single trips represented by one monthly pass) was out of whack with actual behaviour affecting the assumed total trip count.
TTC now reports both “trips” and “boardings” where the latter represent individual legs of a journey (each transfer counts as a new boarding except on the subway) regardless of whether a new fare is collected or not. The fare structure in 2024 is such that a “trip” is increasingly divorced from a “fare”, especially with the coming regional integration and the effect of two-hour transfers.
Gaining riders, especially those who had been lost to car travel, was and is important, but the real challenge is not to lose them in the first place.
Factors affecting transit’s attractiveness were common to riders and non-riders in the 2017 study: trip duration, wait time, crowding, affordability, and reliability. This is not news, but it underscores the importance of service. There has to be something to sell that people will buy. It is easier and cheaper to get an existing “customer” to buy more because they are already “in the shop”. A new customer might be lured in, but will they return? Flashing lights and promotions are poor substitutes for quality merchandise.
The 2017 report posed three growth scenarios. They will sound familiar.
- A 1% growth rate could be obtained by addressing “current pain points including service reliability on major downtown routes”.
- A 2% rate would require improving service “by adding flexible fare options and transforming surface travel to make it the optimal choice through greater transit priority”.
- A 5% rate would require that the TTC “invest in system expansion and major service upgrades”.
An issue at the time was whether the TTC could actually handle the proposed growth in ridership given constraints on its fleet and garage facilities. The first two percent were considered achievable, but not a 5% rate.
This remains a problem today. A large, sustained service increase is impossible without more buses and garages to house them, and more staff to drive and maintain the larger fleet. The TTC does have surplus buses and will have surplus streetcars when all of the 60 new cars now in delivery arrive, but there are limits to what these can do. In brief, there is capacity for short-term service improvements, but longer-term growth will push capacity limits, especially for aggressive rates contemplated in Net Zero plans.
A related problem is that many of the improvements are one-time fixes. They squeeze more out of the existing network, but once implemented cannot be repeated. For example, a fare change such as the two-hour transfer or elimination of cross-boundary double fares will have a benefit that will probably build in over at most a few years. Surplus vehicles can only be used once to reduce headways.
Sustained growth in ridership requires sustained commitment to better service.
In 2017, I wrote:
A further problem is that real growth is not a one-time effort, but an ongoing trend that must be sustained by continuous improvement and expansion of service. More riders need more buses and streetcars, something the TTC is unable to provide in the short term and Council will be reluctant to fund in the longer term. “System expansion and major service upgrades” means more than a subway line every ten years serving one isolated part of the city. A network of improvements will be needed and this means hard choices about just what they will entail.
Decisions about spending on transit lie at the political level, but it is the responsibility of transit staff to provide well-informed options showing what can be done.
The basics of simply providing better service are held ransom to the demand for constrained growth in taxes and subsidies. Were it not for the new subway opening, the TTC would get little if any new funding for 2018, and much of that will go to the subway, not to better bus and streetcar service.
Those who remember pre-pandemic conditions will know that overcrowding was a common complaint, but during recent years this was forgotten. As ridership returned, the TTC changed its Service Standards in 2023 unwinding more-generous targets for off-peak crowding that date back to the 2003 RGS. In theory, this change will be reversed over coming years, but there are few details about the extent of crowding on the system or of factors such as capacity and reliability that contribute to the problem.
We no longer have a “Ridership Growth Strategy” per se, but rather a Five Year Service Plan with the 2024-2028 edition coming to the TTC Board later this year. It was expected in February, but is not on the coming Board agenda.
There are seven “pillars” within the 5YSP:
- Foster a customer-centric mindset
- Enhance the transit network
- Improve service reliability
- Prioritize surface transit
- Accelerate integration with other transit agencies and complementary modes of transit
- Enhance safety and comfort at stops, stations and in vehicles
- Streamline information services
Most of that list would be familiar to anyone grappling with conditions two decades ago. The addition of safety and information services reflects today’s conditions and technology. The proposed level of growth is modest in keeping with the Ford/Tory era of constrained budgets.
This is “steady as she goes”, not actively pursuing new ridership, let alone the scope contemplated in the City’s Net Zero 2050 plan. Transit market share has fallen in Toronto because of lost commuter trips to the core. These are much harder to replace by suburb-to-suburb travel that is largely dependent on bus service.
There is a Net Zero 2040 plan that Council has endorsed, although funding for all it implies is not yet committed. From the TTC’s point of view, this matches what the TTC had planned to do anyhow with only modest service growth but full fleet electrification. Assuming a 12-year replacement cycle for diesel and hybrid buses, and reliability of an all-electric fleet, this would be achieved in the mid-to-late 2030s.
The NZ2050 plan is much more ambitious including very substantial increases in bus (70%) and streetcar (50%) service, and improved off-peak subway service. This has not been endorsed by Council, but the ambition is much greater than anything we have seen before. Automatic train control will allow for more-frequent service than pre-pandemic levels, but this is not an explicit part of NZ2050 plans. The “growth trains” in TTC capital plans do not cover the equipment needed to reach the service level ATC makes possible on both lines 1 and 2 including their extensions.
Such a change cannot be achieved overnight and the system would have to build up over many years to reach that level. That would require a long-term commitment to service growth at a time when even getting back to 2020 levels is a challenge.
A fundamental problem with the NZ goals is that the compounding effect of natural growth and a campaign to shift more riding to transit is much larger than the numbers appear. When both natural growth from 1 to 2 percent is combined with a desire for 70% more service, the result is a need for more than double the current bus operations over the coming quarter century. (Details appear later in the article.) This is even before any provision for lost productivity through congestion and extra vehicle hours for charging.
I reviewed the final consultation round on the Draft 2024-2028 Plan in a recent article:
This title shows the plan’s parentage in two separate plans. For a time, the TTC looked at various creature comforts such as expanded waiting areas at major transfer points, widespread network access, more diverse offerings in subway shops, and did so separate from basic service planning. Very bluntly, this is a motorist’s view of what transit should do, and it diverts needed attention from the most basic function of a transit system – moving people. The new plan’s goal is:
Focus on improvements that enhance TTC’s core-competency: mass transit – moving large volumes of customers safely, reliably, and swiftly across Toronto and improving how customers experience the system.
Toronto needs Council and the TTC to be true advocates for what transit can be. If some Councillors do not want this debate in public, that’s too bad, but the era of just making do should be over.
In brief, a 2024 Ridership Growth Strategy should include:
- Restoration of crowding standards that do not cram riders onto vehicles.
- A clear evaluation of service improvements well beyond current levels.
- Monitoring and reporting of service quality and crowding that reflects what riders actually experience, not a collection of averages that hide real-world conditions.
- Service design and management that demands reliability with metrics showing minimal gapping and bunching of service, not bogus “on time performance” numbers.
- Transit priority that will bring benefits across the network, not just to a handful of routes after extended study.
- Schedule planning that takes into account the midweek bulge in demand.
- Fleet planning and staffing requirements to field increased levels of service.
- Vehicle and infrastructure reliability metrics that can be measured against service needs.
- Transparent planning of the resources needed in both capital and operating budgets.
- Capital spending plans that prioritize needed state-of-good-repair work together with the most important aspects of system expansion and enhancement.
- A review process to ensure major new projects do not slip ahead in the queue for funding without good reason.
I have explicitly omitted any discussion of funding as that depends first on the City understanding how many aspects of transit plans interact and deciding how to proceed. Governments and spending priorities will change, but the “shopping list” should not be biased by political rhetoric and the perennial desire for “my plan” with incoming governments.
Some TTC Commissioners talk about “their responsibility to taxpayers” as if the people who ride the system are freeloaders whose needs are secondary. The same poobahs will show up for any photo op of a freshly-dug hole in the ground, or a new garage opening, or a shiny new vehicle.
Of course taxpayers somewhere must pay the freight, but advocacy can convince them that this is a good deal, worthwhile for the City. When the general sense is that transit is in decline, when it is resented rather than celebrated, support for more spending is hard to come by. Years of just making do drove down customer satisfaction scores, but the unseen damage is to transit’s credibility as a municipal service.
These topics are explored in more detail after the break. As an appendix, I summarize major parts of the 2003 Ridership Growth Strategy for those interested in the history.
No long-range plan will unfold under uniform conditions. In the decades I have followed TTC affairs, we have been through two Middle East oil crises, a recession, a stock market crash, and a pandemic, not to mention a few politicians whose attitude was decidedly anti-transit and anti-Toronto. A quarter century of economic stability and enlightened policy is very unlikely.
Any long term plan to change the makeup of Toronto’s transit habit must take these downturns into account.
On a larger scale, the growth of the regional transit habit will depend on a very substantial improvement in the transit network that is more than a fare subsidy. We cannot shift trips to transit if it is impossible to get from “here” to “there” without a car.
The GO Expansion plan will provide key links in some areas, but it is the local transit systems that will make or break the ability to get around with transit as a credible choice. Massive parking garages might keep the downtown commuter market happy, to the extent it still exists, but they do nothing for trips that rely on local service for last mile access at one or both ends of a journey.
Toronto cannot make that change alone, although it can certainly encourage other municipalities and the provincial government to recognize the need for frequent local services with good coverage to be a real alternative to driving.
That is a bigger job than a Toronto growth strategy, but we cannot hope for regional transformation while allowing our own transit system’s importance to decline.
Part 2: 2024 And Beyond
Restoring Crowding Standards and Service
In the 2023 Budget, TTC management implemented an off-peak crowding standard that undid the 2003 RGS strategy of deliberately providing excess capacity in off-peak service. In a recent article, Overcrowding on TTC Bus Routes, I showed a TTC “heat map” where current midday loads exceeded the pre-2023 standard. Any planned improvement must begin with actually achieving the original RGS standards, let alone overshooting to accommodate and encourage growth.
There is no point in dreaming of a 2050 nirvana if we wait a few decades before making transit a more attractive option. The problem, then, is to decide how quickly to grow and determining where new ridership might be obtained. This cannot depend just on a few high density nodes around major transit stations. Even with new rapid transit lines, many parts of Toronto lie beyond the immediate reach of rapid transit both as origins and destinations for trips.
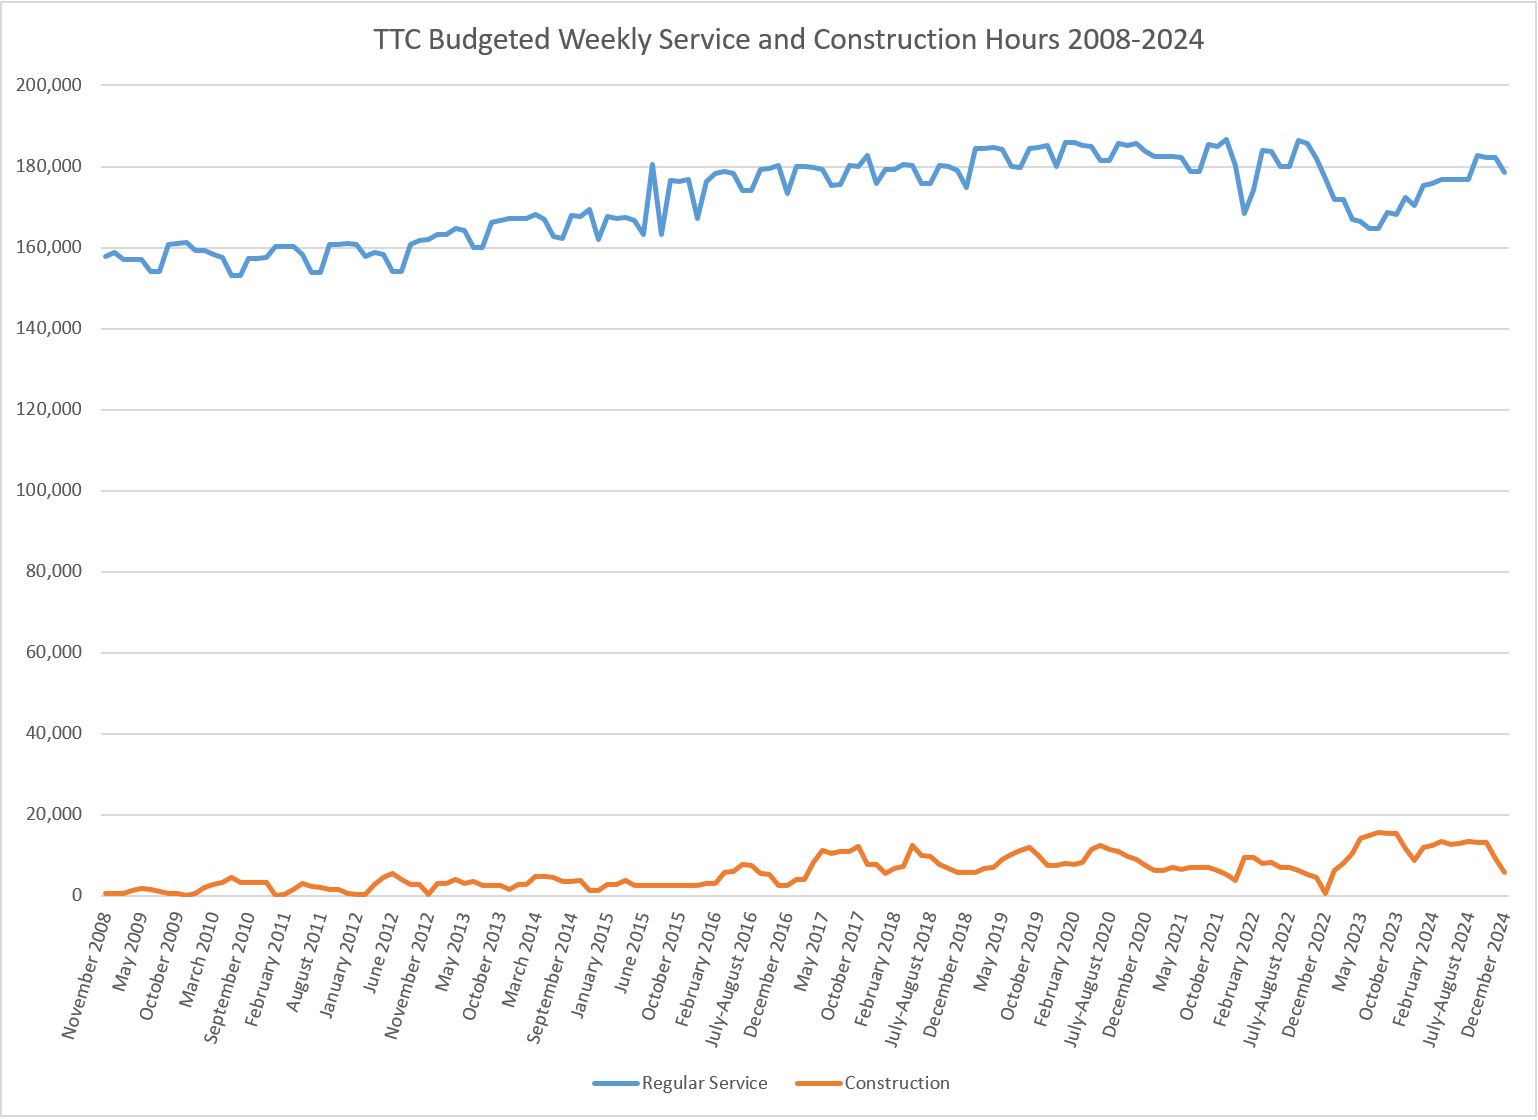
Service growth has hardly been impressive over the past decade. The chart below shows the budgeted weekly hours of service from November 2008 to December 2024. In recent years, the actual service operated had generally been below budget because aspirations of recovery from covid effects proved more optimistic than actual experience. Even so, the budgeted service shows what Toronto was prepared to operate as each year’s budget was prepared. The major drop in budgeted hours began in 2022.
Despite claims that the TTC will build back to pre-pandemic service, the chart clearly shows that 2024 numbers will be below levels that prevailed from 2016 to early 2020. This is due mainly to reduction in subway and streetcar service in reaction to lower weekday demand in the core area.
Notes:
- The subway extension to Vaughan opened in December 2017.
- Construction hours are shown separately. Much of this is paid for by capital project budgets, although it consumes resources that would otherwise be available for regular operations.
- The spike in mid-2015 is for the Pan-Am Games.
- As congestion and operating practices reduce the average speed of transit vehicles (including recovery time), the amount of service provided per budgeted hour declines. This is not reflected in the chart.
- Conversion of the subway to one-person crews on Lines 1 and 4 reduced subway hours with no change in service level. Similarly streetcar hours declined through the shift to larger vehicles. However, bus hours dominate the totals and the overall trend is for minimal additions to service.
- Population growth over this period for the City was 16%, and for the GTA was 23%. Transit did not keep up.
Service Growth Beyond Business As Usual
Current planning looks only at population growth as a driver of new riding, but this is not the only factor. If there is any desire to improve transit’s travel market share, growth must exceed that basic level. Moreover, as travel growth occurs outside of the core, the pressure for more and better service will fall on the surface network, primarily buses.
The NZ2050 plan proposes a growth of 70% in bus service and 50% in streetcar service. However, for this to have a real effect, it must be in addition to the growth that would otherwise occur. “Business as usual” growth alone over the next quarter century will contribute substantially to the TTC’s scale of operations, assuming that transit even tries to keep up.
The table below illustrates this problem. If there is only a 1% growth in service operated over 25 years, the compound effect of that will be 28.2% more service. (There is a big fat asterisk here, but that will come later.) If the annual rate is 2%, the compounding effect over 25 years would be 64.1% more service. This is before we add in the extra service to make the system more attractive to would be riders.
Adding another 70% on top of the business as usual figures pushed the total well over a 100% increase in service depending on the assumed growth rate. Working backwards from that total gives the growth required every year for 25 years to achieve the target.
For example:
- If we run 1000 units of service today, this would grow at 1% to 1282 units in 25 years. If we then want 70% more service than business as usual, that would bump 1282 up to 2118 units, a 118% increase over the base 1000. This requires a compound annual growth rate of 3.05%.
- If we run 1000 units of service today, this would grow at 2% to 1641 units in 25 years. Adding 70% more service to that bring us to 2790 units, a 179% increase. This requires a compound annual growth rate of 4.19%
I do not think the authors of the Net Zero study proposal, let alone the TTC, have thought through the implications of this much additional service. Any debate over NZ goals has to recognize the very substantial long term commitment this means to transit growth.
That big fat asterisk I mentioned above: These figures do not make any allowance for lost productivity through slower operating speeds, whatever the source, including a loss of revenue vehicle hours for battery recharging during service. A substantial portion of the service hours added in 2024 go not to more frequent service, but to offsetting congestion. On a compounded basis, this would be a severe drag on real growth in system capacity.
City Council must set a clear goal for the next 25 years including the spending needed to reach the targets, whatever they might be. This is not a decision to put off for a decade and then start the push for service growth. The longer the City delays, the more compressed the time to reach the target service level and the higher the annual increment will be.
All growth will not come on the bus and streetcar network, and both the rapid transit lines and GO Transit will make a contribution. However, these modes depend on the surface network for much travel in Toronto. Any new subway or GO rider who needs a bus or streetcar for their “last mile” contributes to pressure on the surface system. Many trips, especially in the growing suburb-to-suburb market, will only be served by buses.
| Business As Usual Growth Rate | 25-Year Compound Growth | 70% NZ2050 Bus Increase | Annual Rate for 70% Bus Target | 50% NZ2050 Streetcar Increase | Annual Rate for 50% Streetcar Target |
|---|---|---|---|---|---|
| 1% | 28.2% | 118% | 3.05% | 92.3% | 2.65% |
| 1.5% | 45.1% | 147% | 3.68% | 118% | 3.05% |
| 2.0% | 64.1% | 179% | 4.19% | 146% | 3.67% |
These are daunting figures with substantial implications for both operating and capital budgets, and they are only for the level of service, not inflation. Can an enlightened attitude to transit spending survive the next 25 years of political upheaval at Toronto Council and Queen’s Park?
Monitoring and Reporting on Service Quality
Riders are sensitive to two important factors in service: does the bus or streetcar show up reliably and can they ride comfortably when it does. For most TTC routes, “reliably” does not mean “on time”, but rather at a regular spacing (also known as “headway”) so that missing a bus does not condemn a rider to a service gap that could be three times the scheduled headway. Crowding refers to the bus a rider is actually on, not to the average load carried by 10 buses over the course of a peak hour. It should be self-evident that more riders are on crowded buses than half-empty ones, and so the average experience of crowding is worse than average occupancy values would imply.
Crowding levels vary with many factors, but there will be consistent “hot spots” where occupancy runs above standards. When service is designed to be full, bus-to-bus variations will accentuate the problem. Crowding also affects vehicle speed by adding to stop service times as passengers struggle to get on and off vehicles. That translates to a higher cost for buses and drivers simply because of additional time needed at stops. It is a form of “congestion” the TTC does not talk about.
TTC measures only whether a vehicle leaves the terminus within a six minute window (1 minute early to 5 minutes late) of its schedule. For frequent services, this actually allows vehicles to run in pairs or even triplets but to be counted as “on time”. Here are two examples of “on time” performance.
| Departure | Variance (mins) | Gap (mins) | Departure | Variance (mins) | Gap (mins) |
|---|---|---|---|---|---|
| 1:00 | 0 | 1:05 | -5 | ||
| 1:06 | 0 | 6 | 1:06 | 0 | 1 |
| 1:12 | 0 | 6 | 1:11 | +1 | 5 |
| 1:18 | 0 | 6 | 1:23 | -5 | 12 |
| 1:24 | 0 | 6 | 1:24 | 0 | 1 |
The bus on the 12-minute headway carries a gap double the scheduled headway, while those a minute apart will run as pairs over the entire route.
Management gold stars should not be handed out for “performance” like that.
The TTC has no published metric for:
- Headway reliability:
- The number of trips operating at very close headways.
- The number of trips operating at acceptable headways.
- The number of trips operating at wide headways.
- The number of missed trips (vehicle not in service, diverted or short-turned).
- There can be some debate about just how these categories are defined, but the information needs to be broken out by route and time of day.
- The proportion of trips operating beyond the target crowding level, broken out by route, location and time of day. The TTC recently published a heat map showing overcrowded midday service, but this type of report is not generated as a standing, publicly available set of maps.
The number of short turns reported by the TTC appears to be quite low, but actual experience and vehicle tracking data suggest that the count is under-reported. It is trivially easy to count how many trips actually reach a terminus rather than disappearing somewhere enroute. This is a far more reliable statistic than depending on officially logged short turns.
See also: The Myth of No Short Turns
As long as service metrics are designed to show that everything is just peachy, thank you, service will not improve. The metrics must reflect a rider’s view of service: individual vehicle conditions, not averages, across all routes, locations and hours.
Service Design and Management
Ever since the TTC launched a “no short turns” policy in April 2019 (a policy they now acknowledge, but at the time vigourously denied), there have been schedule adjustments to pad out the running times. In 2019 and still in cases five years later, some routes’ schedules were inadequate for the actual conditions enroute, and vehicles often had to be short turned to stay on time. This played havoc with service on the outer ends of routes, notably the streetcar lines.
However, in a bid to ensure that short turns were almost never required, the TTC overshot to the extent that it is common to see multiple vehicles laying over at terminals for considerable periods. The behavior this produces along routes varies. On streetcar lines, vehicles tend to crawl along so as to avoid running early thereby frustrating riders and motorists. On bus routes, vehicles drive quickly to maximize their terminal layovers either by arriving early or leaving late.
TTC under-reports short turns as I described in the article linked above, but also with “on time performance” measured only for terminal departures, headway reliability over routes can vary substantially to the frustration of riders. Vehicles can run in pairs (or worse), but this is not measured nor controlled. I have published many analyses of routes showing this problem.
The varying conditions on routes from day-to-day, hour-to-hour, can be challenging because no schedule can adapt to every circumstance. A quiet Monday will present very different problems from a busy Wednesday, especially if this is compounded by a special event.
Short turns are a valid tactic for service management, especially if vehicles are bunched after a delay, and the edict forbidding them works against good service in those cases. A related problem is that short turned vehicles might not re-enter service optimally to “split the gap”. This is also seen on any branching route where service inbound from the merge point can be uneven. The TTC looks only at terminals, not at key points enroute for service reliability.
Network-wide Transit Priority
The RapidTO program foresees transit priority lanes over many routes in the city, or at least that was the impression in its early days. King Street was a pilot in November 2017, followed by the red lanes in Scarborough on Eglinton-Kingston-Morningside in Fall 2020. The program stalled in part due to the pandemic, and in part because extension to other corridors was not as easy as drawing a line on a map.
Both the King Street and Scarborough locations had characteristics making their implementation relatively easy.
King between Bathurst and Jarvis was already dominated by transit with very high demand and frequent service. Parallel nearby roads could absorb traffic displaced from King and there was no doubt that auto traffic was in the minority. As a dense and growing residential, office and entertainment area, there was heavy pedestrian traffic and a ready market for expansion of sidewalks into curb lane patios. Streetcars owned the centre lanes and pedestrians took the curbs with occasional breaks for loading zones.
In Scarborough, peak period diamond lanes already existed, and loss of peak capacity for other road users was much less of an issue. The streets are not designed for pedestrian activity, and curb-running buses would prevent expansion of pedestrian areas anyhow.
In both cases, there was a small improvement in average travel times. Far more importantly, reduced variability of travel times improved service reliability. Transit priority is too often “sold” as a way to reduce operating costs rather than to improve transit’s attractiveness. That spin says something about the target audience – politicians who resent transit spending.
The pandemic provided a real world experiment that would otherwise be impossible: what happens if traffic goes away? Results on many corridors showed a small drop in travel times, mainly in peak periods, and some improvement in reliability. This illustrated the limits of what could be expected from getting traffic out of transit’s way. The effect vanished over time from 2020 through 2023, and in some locations travel times now are worse than before.
Even the Scarborough RapidTO lanes are slower in 2024, with the change showing up mainly near stops (longer loading times for more passengers per bus) and construction effects near Kennedy Station. Downtown saw a complete collapse of transit “priority” on King Street with the combined effect of the Queen/Yonge closure for the Ontario Line, reconstruction of Adelaide for water mains and a streetcar diversion track, and an embarrassing lack of traffic management/enforcement.
Neither of these projects was intended nor could possibly turn buses or streetcars into rockets blasting across the city. Their benefit was to cap travel times and limit growth with priority. The alternative, as King Street showed, is chaos from the combined effect of lost capacity, bad planning and missing-in-action enforcement.
Expansion to more corridors has been slow in part from study delays, but a new thread has appeared when talking about “priority”. End-to-end red lanes on some routes might not be “the answer”, and more targeted changes could address the most severe problems.
Equally important will be to avoid the sense that transit improvements will find their way slowly, one route at a time, through the system. The idea that “we’re doing something”, but that your own route is far down the list, is cold comfort to riders who want better bus service today. “RapidTO” should not be like a subway plan where the benefits lie far in the future and for other parts of the city.
This brings the question of who roads are for, and the difficulty of apportioning space and capacity. The suburban network was designed around cars and trucks. Transit, pedestrians and cyclists get the leftovers, if they get anything. Changing that balance will not be easy. Downtown, transit dominates in theory, but service cuts and wider headways over the years bring a key question: where are all the transit vehicles we are making priority for? If Toronto is content to run a streetcar every 10 minutes at best, can this service lay claim to priority?
Signal priority is a tool touted in current City plans, but at a rate of 50 intersections a year. By contrast, there are well over 2,000 signalized intersections in Toronto and more are added every year. Do they have transit priority from day one? Probably not because “priority” comes from a separate budget.
More priority is needed especially for the streetcar system where every diversion sends cars on routes for which signals are not optimized. This should not occur after the fact when delays are observed, but be built into signals as an always-available assistance to the inevitable route changes.
Now comes the difficult question: who is “priority” actually for? Does it actually speed transit, or simply hold transit out of the way while other traffic gets its turn? This problem appears at many locations where left turning autos get first crack while transit riders sit in the queue. The overall philosophy is that “a rising tide lifts all boats”, and that making all traffic move faster will also benefit transit. That is hard to believe when streetcars on their own rights-of-way face repeated delays from “priority” signals.
Road network improvements will benefit transit in selected locations, and can help to slow or prevent the buildup of transit delays, if only transit really does get priority.
Planning For the Three-Day Week
The future of work-from-home and an evolution of office environments to part time use brings a fundamental change in travel patterns. Some trips will never come back to transit because the trips simply ceased to exist. Unlike past decades, demand will not grow just because downtown office towers and new suburban housing provide new riders with little effort from the transit system.
That growth model goes back to the 1950s with brief interruptions for economic upheavals. Indeed, when the long post-war growth ended in the 1980s, an entire generation of TTC planners was unprepared for growth that didn’t simply fall in their laps.
Many activities including manufacturing, service industries and education still run on a conventional week, and the midweek peak is more pronounced in areas where work-from-home is common.
Reports of system recovery focus on total ridership, and this remains below the pre-pandemic level on a weekly average basis. Demand is not evenly concentrated, and service planned on that average will see mid-week crowding that will be the typical rider’s experience if they travel mainly on those days. There will be no room for growth on the very days when there is heaviest demand.
For a century or more, TTC service has operated on the traditional five-day work week with weekday, Saturday and Sunday schedules. Some routes would benefit from more midweek service, but this can be tricky. Unless the scheduled headways actually change, the typical behaviour of “extras” is that they do not even out service, but rather shadow scheduled trips leaving most vehicles and riders with the same crowding levels.
For example, if the regular service arrives every ten minutes, and a few extras are added, in theory there is an occasional five-minute headway where the extra buses are placed. In practice, these shorter headways quickly collapse as the extra, with a lighter load, catches up to a regular bus and runs as a second section.
This is further complicated by the TTC’s “on time” fetish which prevents ad hoc adjustments of vehicle spacing because this will screw up the performance stats. If there is to be a midweek service level, there must also be a midweek schedule providing even, measurable service.
Fleet and Staff Planning
The TTC plans its fleet based on modest growth in service, and similarly its hiring aims to fill expected vacancies and short-term additions to service. If the goals change, then the pipeline of vehicles, operators to drive them and mechanics to maintain them must grow, and this growth must start before we see one new bus on the road.
In the days leading to the original 2003 RGS, attempts to push for better service repeatedly hit these roadblocks: we have no buses, we have no operators. If management’s real aim is to throttle growth, there is no simpler way than to budget for minimal growth in fleet and staff. In turn, if the political will is to sound pro-transit but never quite deliver, budgets are the place where the true intent lies.
The 2024 version of the TTC’s capital plan includes provision for growth of the bus fleet and garage space in response to NZ2050, but without a projection of operating cost effects. There is no provision for streetcar growth beyond accommodation of 60 new cars now in delivery, and even these have only provision for maintenance, not additional service. Such growth requires funding that has not materialized at least in part because the true needs have not been priced into budget projections.
The long-term effects of the move to eBuses is still unknown, in particular whether they will replace existing hybrids on a 1:1 basis depending on reliability, ongoing maintenance needs and in service charging. As the fleet conversion to eBuses proceeds, there is a danger that for political reasons their performance might be exaggerated until problems become too severe to hide. Experiences in some other cities and with some of the test eBus fleets in Toronto are at best mixed.
If the TTC embraces a strong growth objective, this must include provision for fleet and facilities growth as current projects, not as something for the distant future. Property for new garages is hard to come by, and their location can be a delicate political issue.
A larger fleet is useless without operators and maintenance staff. Transit operators are hard to recruit, and many do not last long in the job. Senior operators look forward to retirement. Any plans for service growth must recognize that this will occur mainly on bus routes which will need more operators. Fiscal hawks who agonize over “head count” forget that somebody has to provide service and maintain vehicles. The TTC will need a plan for long-term staffing growth to match ambitions for more transit service.
Vehicle and Infrastructure Reliability
TTC reports vehicle performance using a common metric of mean distance before failure (MDBF). The higher the number, the better performing the vehicle. However, the reported values for several vehicle types are capped regardless of what the actual numbers might be. For eBus, hybrids and Wheel-Trans fleets, the cap is 30,000km while for diesel buses it is 20,000km. Diesels might out-perform hybrids, and hybrids out-perform eBuses, but the difference is hidden by the reported values.
For TR subway trains, the cap appears to be at 70,000km. It is simply not credible that a fleet will attain exactly the same reliability month after month.
The capping of reported values prevents comparison between the fleets that could reveal shortcomings.
Vehicle availability is reported against the amount of scheduled service – did 100% of the service actually leave the carhouses and garages. What is not shown is the proportion of the fleet that is active and available for service should it be needed or wanted. Plans for service changes routinely speak of them being tailored to the availability of vehicles, not to the total fleet size.
For several years, the ratio of spare vehicles to total scheduled service has been well above industry standards of 20-25%. For January 2024, the values are shown below. The situation arises mainly from service cuts during the covid era, but also from historic patterns of vehicle acquisition.
For example:
- After his election as Mayor, John Tory discovered that the TTC needed more buses, a topic during his debates with now-Mayor Chow. However, most of these went to increase the spare pool, not to provide more service.
- During the declining days of the former CLRV and ALRV streetcar fleets, service cuts and bus substitutions were common not for construction work, but because the TTC could not field enough streetcars. This set a “new normal” for capacity on streetcar routes and likely drove away riders.
- The Line 2 fleet is larger than needed for service both because of covid cuts and because, originally, some of these trains were to be used on Lines 1 and 4. The Automatic Train Control project made that impossible creating a surplus of trains.
What is not clear is whether the TTC could actually field service with a spare factor or 25% or less, or if part of the fleet has deteriorated through lack of use. Conversely, the MDBF values could represent the performance of only the best of the fleet undiluted by vehicles that never run in service. Any plans to substantially increase service over the next quarter century will be affected by the assumed fleet size required to support the higher service level, plus garage space for storage and servicing.
| Bus | Streetcar | Line 1 Subway Trains | Line 2 Subway Trains | |
|---|---|---|---|---|
| Total fleet | 2083 | 204 (*) | 76 | 61 |
| Scheduled Peak Service | 1571 | 146 | 55 | 40 |
| Spares | 512 | 58 | 21 | 21 |
| Spare % of Peak | 33% | 40% | 38% | 34% |
Any debate about service capabilities in the short term and fleet requirements in the medium-to-long term must take this factor into account.
A consideration specific to eBuses is the requirement for in-service charging. If eBuses must return to the garage more often than hybrids or diesels, or must take extended layovers enroute to recharge, that adds to the number of vehicles required to achieve service. This has not been discussed in the enthusiastic move to an all-electric fleet.
Infrastructure reliability is essential to service provision and safety. The SRT derailment of 2023 and the Russell Hill crash of 1995 both followed periods of constrained budgets. In both cases maintenance and poor training were culprits. Riders need to know that they can trust TTC vehicles and systems to operate safely.
Problems with cantankerous vehicles and infrastructure can lead to service delays and limit the system’s ability to achieve full capacity, not to mention being a strong discouragement to would-be riders. Infrastructure should be kept in peak condition year-round. The recent spate of subway slow orders show how much deferred maintenance affected system performance.
Transparent Capital and Operating Budget Planning and Prioritization
For many years, the TTC’s budgets appeared near year-end, but all of the important decisions were made well in advance. Preparation began in the summer, and management knew from the City how much subsidy the TTC would be given. The Operating Budget was drafted accordingly, sometimes with a few tweaks like ridership growth assumptions or the projected average fare. There was never a debate about budget priorities, nor about how “the sausage is made”, what cuts and compromises got the numbers to come out right.
The usual collection of public deputations for better service and lower fares would appear. They were tolerated for their five, but more often three minutes. Members of the Board would ask a few questions to suggest that they might have looked at one or two pages of the budget, and then the whole thing was passed with little or no change.
Similarly the Capital Budget appeared, wowed everyone with the breadth of TTC needs and the huge shortfall in available funds. New projects appeared on the growing list without any debate over their priority, how some just appeared out of thin air, or what others might lurk out of sight.
The gap between available and needed funding gives anyone who might have some spare change a shopping list of deserving capital projects. This does not happen with the Operating Budget, and has not since the original 2003 Ridership Growth Strategy.
The TTC has a strategy session planned, but not yet scheduled, for March 2024, and will strike a Budget Committee in early summer. Let us hope that the Board does more than listen to business as usual, self-congratulatory management presentations.
Part 3: Looking Back on the 2003 Plan
In 2010, I reviewed progress-to-date with mixed results. The tables below combine that 2010 review with a 2024 update. A lot of this will sound familiar, particularly things like transit signal priority which appears regularly in TTC wish lists.
| 2003 Goal | Status |
|---|---|
| Ongoing programs | |
| VIP Green Pass | By 2010: Implemented |
| Expanded signal priority | Ongoing … and ongoing … and ongoing |
| Surface commuter parking expansion | There is limited land available. By 2010 priorities were shifting away from parking operations, and by 2024 some lots have been closed/repurposed. |
| Bus purchases | By 2010, the bus fleet was expanded with an extra 100 vehicles, but the effect was offset by ridership growth and increased spare requirements for maintenance. |
| Upgrade to surface rapid transit on “The Avenues” | 2010: Partly addressed by Transit City, but most target routes have seen no change. Relationship to Transit City Bus Plan uneven. Maps of the Avenues, the Surface Priority Network and Transit City need to be reconciled. |
| Expanded SRT Capacity | 2010: Originally studied with Mark II ICTS cars. Transit City network proposal to convert to LRT as part of a Scarborough network. Delayed by funding. |
| 2004 Goals | |
| Improve off-peak service on major routes | 2010: Funding constraints. Transit City Bus Plan. Backlog of crowding-related service improvements has been eliminated. Service standard has been improved. |
| Improve afternoon peak service on major routes | 2010: Backlog of crowding-related service improvements has been eliminated. Issues of service regularity and line management remain. |
| Reduce Seniors/Students Metropass Trip Rate by 6 | Reduced from 66.7 to 60 in 2006. Age restriction for students will be eliminated in September 2010. |
| 2005 Goals | |
| Group 2 off-peak service improvements | Off-peak standard is seated load. Actual conditions vary from route to route, partly due to headway reliability. |
| Discount Metropass by $5 | 2010: Pricing multiple in 2003 was 52.0, is now 48.4. Metropass is now transferrable. |
| Senior/student day pass | Not implemented |
| Remove 9:30 am day pass restriction | Implemented |
| 2006 Goals | |
| Ten cent fare reduction pro-rata | Implemented. Farebox recovery ratio has been brought below 70% |
| Others Sine Die | |
| Full service on all routes from 6 am to 1 am | Implemented |
| Maximum 20-minute headway on all surface routes | 30-minute standard implemented. Costs of moving to a 20-minute standard on all routes may not be appropriate use of resources as compared to improved headways on core routes. |
Over the years, plans for surface transit priority have changed in many areas due first to the 2007 Transit City Plan, then the shift from LRT plans to the provincial subway expansion.
Although it is not in the list below, Jane Street from Eglinton to Steeles is well into the detailed study phase with implementation in late 2024 or 2025 if approved. Steeles between Bathurst and Pioneer Village Station is now on the short-term list for study.
Note that the headings re priority, etc., are from the original RGS document, not from current plans.
| Surface Transit Priority Network | Status |
|---|---|
| First Priority Corridors | |
| Downsview to York University | Completed. |
| Yonge: Finch to Steeles | 2010: Under Study 2024: Will be affected by the Yonge North subway construction |
| Dundas: Kipling to Etobicoke Creek | 2010: Regional terminal at Kipling under construction. Relationship to Mississauga busway uncertain. |
| Lawrence West: Spadina subway to Jane | No action. |
| St. Clair: Yonge to Runnymede | 2010: In progress Implemented to Gunn’s Loop. Widening of underpass planned. |
| Eglinton: Leslie to Kennedy Stn | Replaced by Eglinton LRT |
| Eglinton: Kennedy Stn to Rouge Hill GO | 2010: Replaced by Scarborough-Malvern LRT. On hold for funding. 2024: Replaced by RapidTO red lanes to Kingston Road & Morningside |
| Second Priority Corridors | |
| Sheppard: Don Mills to STC | 2010: Replaced by Transit City 2024: Sheppard subway extension under study for mid 2030s |
| Don Mills/Overlea: Millwood to Steeles | 2010: Replaced by Don Mills LRT. On hold for funding. 2024: South end replaced by Ontario Line. |
| Eglinton: Renforth to Weston | 2010: Replaced by Transit City network (western section on hold for funding) 2024: Replaced by Line 5 extension |
| Lawrence East: Victoria Park to Morningside | 2010: No action 2024: Under study |
| Corridors Where Road Space Is Not Available | |
| King: Dufferin to Parliament | 2010: Proposed central area transit mall. TTC proposal does not address congestion outside of the core, and is unlikely to be implemented due to the effect on other road users. Service issues remain due to capacity constraints of existing peak period fleet and failure to enforce existing traffic control bylaws. Nov 2017: King Street transit corridor Bathurst to Jarvis |
| Queen: Dufferin to Carlaw | As above |
| Carlton: Yonge to Parliament | As above |
| Dufferin: King to Bloor | 2010: Dufferin jog elimination completes in fall 2010. TSP has been added to this route. Service regularity is still an issue. 2024: Dufferin from Wilson Station to Dufferin Gate will be studied in 2024-25. |
| Eglinton: Weston to Leslie | Replaced by Eglinton LRT |
| Pape: Danforth to Millwood | 2010: Replaced by Transit City Don Mills Line or Relief Line North. 2024: Replaced by Ontario Line |
| Victoria Park: Danforth to St. Clair | 2010: No action 2024: Lawrence to Gerrard under study |
| Finch: Yonge to Warden | 2010: No action 2024: East from Victoria Park to McCowan |
| Steeles: Yonge to Don Mills | 2010: No action 2024: Focus is on Steeles west of Yonge |
Back in 2003 there was not much subway planning on the table. Transit City was not released until March 2007, four years after RGS was published. It arose in part from the problem of expensive subway construction and the challenge of building a wider suburban network.
| Subway Expansion | Status |
|---|---|
| Spadina to York University | 2010: Under construction to Vaughan 2017 (Dec): Opened |
| Sheppard to STC | 2010: Replaced by Transit City 2024: Sheppard East subway extension under study for 2030s delivery |

There are four things that would increase ridership that could be done today.
LikeLiked by 1 person
It was former City Councillor Howard Moscoe, back in 2007, who asked for and got designs for a possible streetcar tracks under the Scarlett Road underpass at St. Clair Avenue West. They were to be putting in foundations for a later streetcar tracks in the underpass. Work on the underpass and the Dundas/Scarlett/St. Clair intersection is alleged to start later in 2007.
It’s now 2024. Wonder if the foundation was redacted from the plans because it was so long. Currently, utility work is being done (allegedly) around St. Clair, Scarlett Road, and Dundas Street West. Don’t know about any streetcar foundations, however.
Will the 512 ST. CLAIR streetcar ever be extended west of Gunns Loop this century? The section between Keele Street and Scarlett Road is currently served by the 189 STOCKYARDS, 40B JUNCTION-DUNDAS WEST, 79B SCARLETT ROAD buses, and 512 ST. CLAIR streetcar (allegedly).
Steve: I very much doubt that we will see this extension. The whole idea was to shift operation of St. Clair to Finch West carhouse via the planned Transit City line on Jane Street. This line is not in anyone’s plan, and in any event TC was changed to standard gauge which is incompatible with the TTC gauge 512.
LikeLike
One way the TTC could make better use of data when creating/assessing routes is to use Presto data on where each card’s trips originate and end. Especially for industrial areas where maybe nearest subway station isn’t where people actually come from. By using the Presto data one could design routes and schedules that better fit where people come from and what time they get there. Perhaps then some of the routes that go into these “rush hour” destinations can perform better financially.
After all this data is stored, given that by accessing my account I can see where I tapped each day. Stands to reason that TTC must also be able to get access to this data. Especially in the post-COVID work-from-home paradigm this data would be more useful than ever. One could even use it to alter schedules on routes where Monday and Friday flow is different from Tuesday-Thursday (if such routes exist).
I have heard that TTC contract with Presto doesn’t provide for Presto to share this data. If that is the case, TTC should look at renegotiating those contracts to have access to this data.
Steve: From taps they will only know the last route you tapped on to, not your destination. If that last transfer happened in a paid area like a subway station, there won’t even be a tap.
There have been ideas of matching up trips taken by the same card on the basis that the end of trip “n” can be inferred from the start of trip “n+1”. It’s not a perfect model, but probably on a large scale the stats will be fairly good especially for repeated trips.
As you say, the TTC’s contract does not give access to this data. However, it is something Metrolinx should be doing region wide rather than leaving the analysis up to individual transit systems. This would also allow any concerns about privacy (the tracking of an individual card’s movement) to be kept within the agency that owns the data. This has always been a concern for Presto, and there is a specific protocol for obtaining an individual card’s info for bona fide police purposes.
LikeLiked by 1 person
This is what I was trying to imply. If Monday through Friday, a card is tapped on in the morning at say Finch and Bathurst and in the evening it is tapped on at Don Mills and Lawrence it is a fairly reasonable assumption that the person is commuting to/from work.
In industrial areas there tends to be a congregation of specific diasporas due to the fact that once a person gets in they let their friends know of more positions and friends happen to be from the same group (and likely live in the same area). At least that was my observation 25 years ago when I worked in a factory for a couple of years (as well as observing the old route 117 at rush hour as it travelled through Alness industrial area).
So by analyzing taps even at morning/evening origin through the week could provide very useful information.
LikeLiked by 1 person
I absolutely agree with Mike, who wrote: “One way the TTC could make better use of data when creating/assessing routes is to use Presto data on where each card’s trips originate and end. …by analyzing taps even at morning/evening origin through the week could provide very useful information.”
Further, Steve wrote: “There have been ideas of matching up trips taken by the same card”
This is a job for a human analyst. Every TTC route is unique. While there would be some broad rules, the analyst would need to understand the particulars of each route individually. Some routes loop at subway stations, others do not. Some routes have a major destination (a mall, a school, a manufacturing plant, hospital, etc.) along the way, others do not. (Destination = origin in reverse.) Some routes run along major streets and may have express buses, others serve neighbourhoods (I am thinking Christie, Vaughan, Forest Hill, Leaside). Some routes are a blend of different types, such as Lawrence West.
Every Presto tap provides the following information for route analysis:
Route & Direction
Vehicle
Date, day of week, and time of day – were there excessive delays or conga lines?
Card ID#
Factor in weather, subway/surface closures, diversions, and miscellaneous delays.
Every Presto tap is a customer. What do they want, including the obvious? Can you tell if the customer was most likely satisfied or not? What went well, what did not?
If one were to attempt to write a computer program to analyse all routes all at once automatically and run updates on a regular basis, the human analyst would have to write the rules for each TTC route. In this case, spreadsheets are the best tool. And they need some intuition!
As data comes in, the analyst(s) can both update and do comparisons with previous.
If I understand correctly, nobody is doing this yet!?
NEWS FLASH – Today Feb. 21, 2024, no buses on Wellesley East in EITHER DIRECTION between 4:15 pm to 4:35 pm. Six (6) buses lined up on 512 route at St. Clair station at 4:45 pm.
Steve: You are correct, nobody is doing this. TTC does not have the data, and Metrolinx isn’t doing the analysis. I agree that each route would have to be “profiled”, but that’s a one-time job that would only need to be tweaked now and then for route changes or creation of a major new origin or destination. In a different context, I have to go through this when setting up my own software for route analyses every time the TTC changes the configuration.
LikeLike
NEWS FLASH –Feb. 21, 2024, 6:22 pm, from an on-scene correspondent, eight (8) 512 buses at Gunn’s Loop, some waiting on the street.
LikeLike
I was puzzled by wklis’s comment. There would be zero reason to put steetcar tracks at the Scarlett Rd underpass south of St Clair. It’s barely adequate for one lane of cars each way plus sidewalks.
Jane underpass between Dundas and St. Clair, sure. That’s a modern and spacious underpass. There’s no obvious streetcar track provision, but I suppose it wouldn’t be visible while asphalted motor traffic lanes take up the entire underpass.
LikeLike
The Scarlett Road underpass is being rebuilt and widened this year, although no allowance for streetcar tracks has been planned in, and I’m not sure what kind of route or demand it would actually serve
LikeLike