
This post reviews travel times on bus routes, primarily those that either have or are planned to get RapidTO red lanes for all-day transit priority. This continues from earlier examinations of the effects of changing traffic conditions on travel times over the course of the pandemic.
These articles will be the last in which I will present data for multiple routes to track post-pandemic recovery of traffic levels. I will continue to collect data, but will publish updates only if a specific route is actively under discussion for RapidTO treatment.
This article deals with routes west of Yonge Street: Dufferin, Keele, Jane, Steeles West and Lawrence West. In Part II I will turn to routes east of Yonge.
Note that an analysis of 35/935 Jane is in a separate, more extensive pair of articles in light of the current review of that corridor for RapidTO red lanes.
The format of charts used here is different from previous articles which summarized data on a weekly or monthly basis, subdivided by hour of the day. As the number of data points grew, these charts were no longer workable. Here I have adopted the style used in, among other things, my tracking of travel times on King Street which include day-by-day data, but only for a single hour of the day on each chart.
The values shown are the 50th and 85th percentiles. The 50th is the median value within a set of points where half of the trips took longer, and half of them a shorter time. The 85th is a value which captures the higher values but discards outliers that might only represent one trip within a group.
For the most part, these charts cover the period from March 2020 to May 2023, with some additional data from earlier months where I have it. My purpose in collecting the data was to monitor travel time changes with reduced traffic congestion and stop service times of the pandemic era.
Although there is no way to definitively prove this without actual implementation of red lanes, my premise is that conditions during the worst months of the pandemic show the most that is likely to be achieved by getting traffic out of the way. Additional changes such as traffic signal priority or selective elimination of stops is not specifically a red lane gain, but might be implemented concurrently. Those are beyond the scope of comparisons here.
As a general note, the onset of the pandemic travel restrictions in mid-March 2020 is quite clear in the data, as are other events such as changes in lockdown severity. Also quite clear is the effect of the mid-January 2022 and February 2023 snow storms, and on some routes, a lengthy return to then-normal travel times probably due to inadequate snow clearing.
Each set of charts is presented with data for the same period but opposite directions side by side. These charts can be quite different reflecting both geographic differences and loading patterns by direction. Charts are shown for the hours beginning at 8am (am peak), 1pm (midday), 5pm (pm peak), 8pm (early evening) and 10pm (late evening).
Where local and express routes operate together, the stats for the two services are shown separately, and a comparative set of charts shows the median values for each service.
In all cases, the Y-axis starts at 20 minutes, not zero, because data values are higher than 20 and this tactic gives charts more “elbow room”. In some cases the values drop to zero because there are no data for a specific date. This was particularly noticeable in November 2021 after the cyber attack on TTC systems.
Conclusions
- Based on the drop in travel time in March 2020 and other subsequent covid-related changes in road traffic and transit demand, the potential for reduced travel times through transit priority varies considerably from route to route, by time and by direction. The amount of improvement through red lanes will not be uniform over each route.
- Many trip times recovered to pre-pandemic levels or higher well before the city as a whole was “open”, and some times are now higher than they were three years ago. This accentuates the need for transit priority because longer trip times affect:
- the cost of providing service (more buses to provide the same service),
- frequency of service (the same buses running further apart), and
- rider wait and travel times.
- Express services, when they operate, offer a relatively small change in travel time versus the corresponding local services based on median travel times.
- By analogy to the King Street pilot, the reduction in variability of travel times is at least as important in improving service reliability as any absolute reduction in the time required for trips.
- Any proposal for transit priority should take these factors into account both for selective versus blanket implementation, and to ensure that the potential benefits are not oversold.
For those who want the details (and a lot of charts), read on.
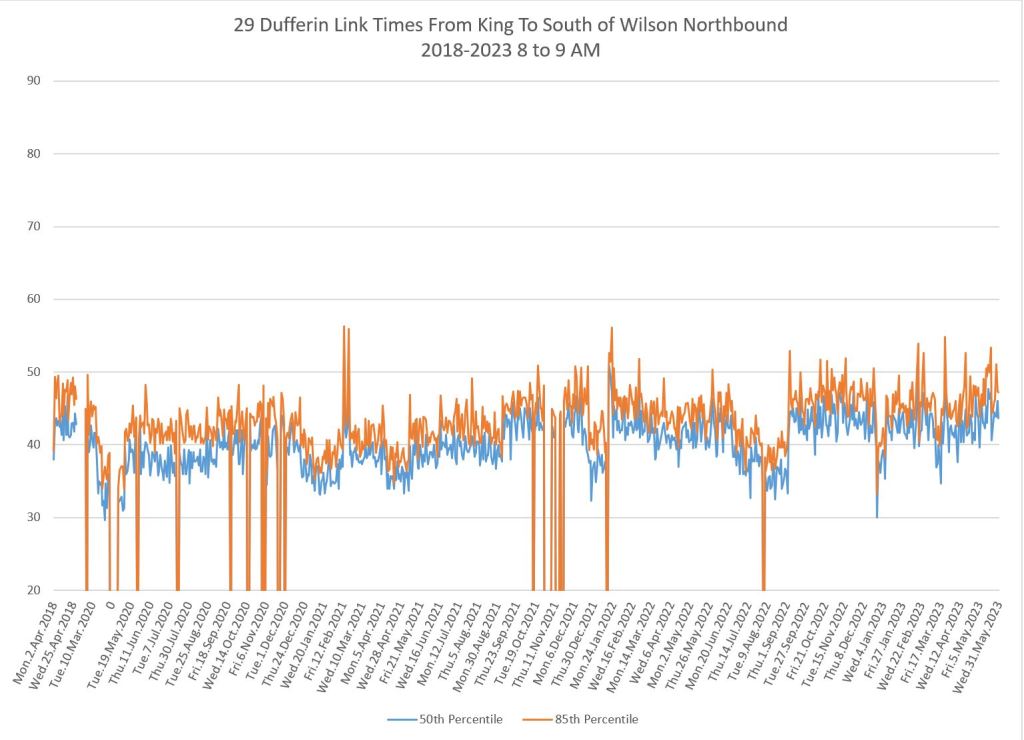
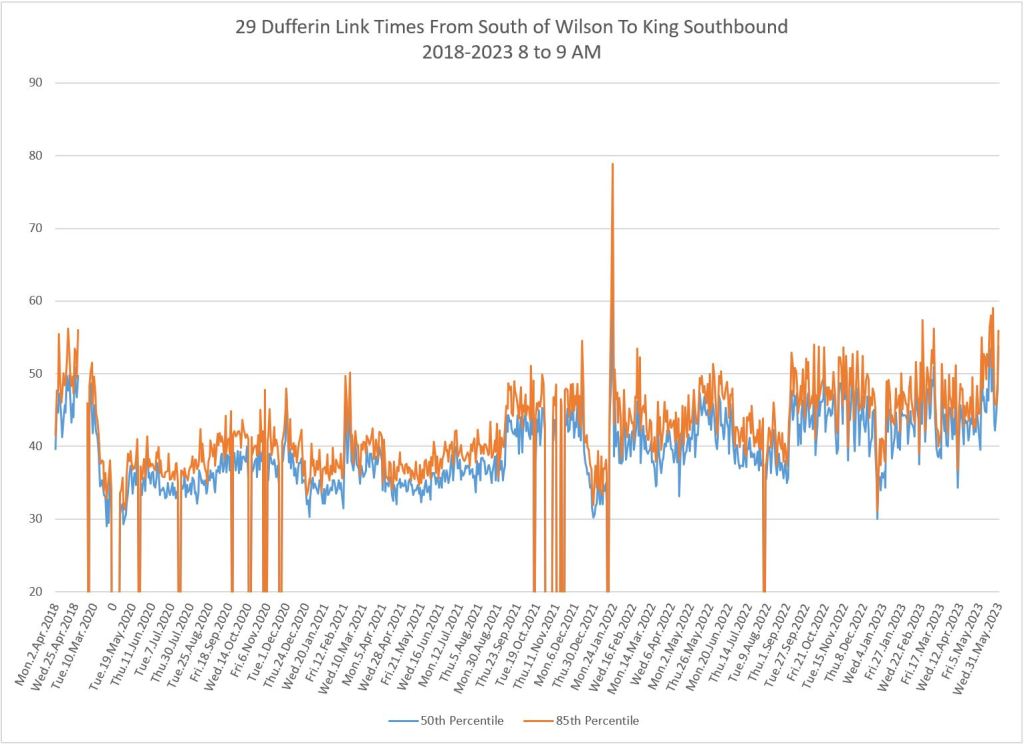
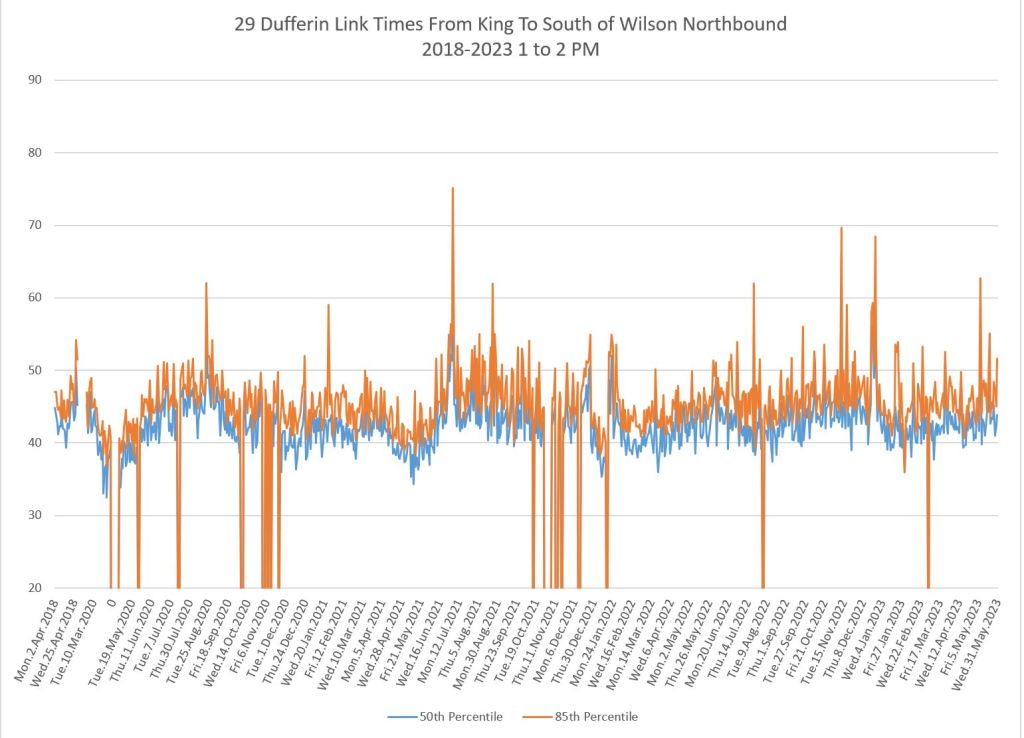
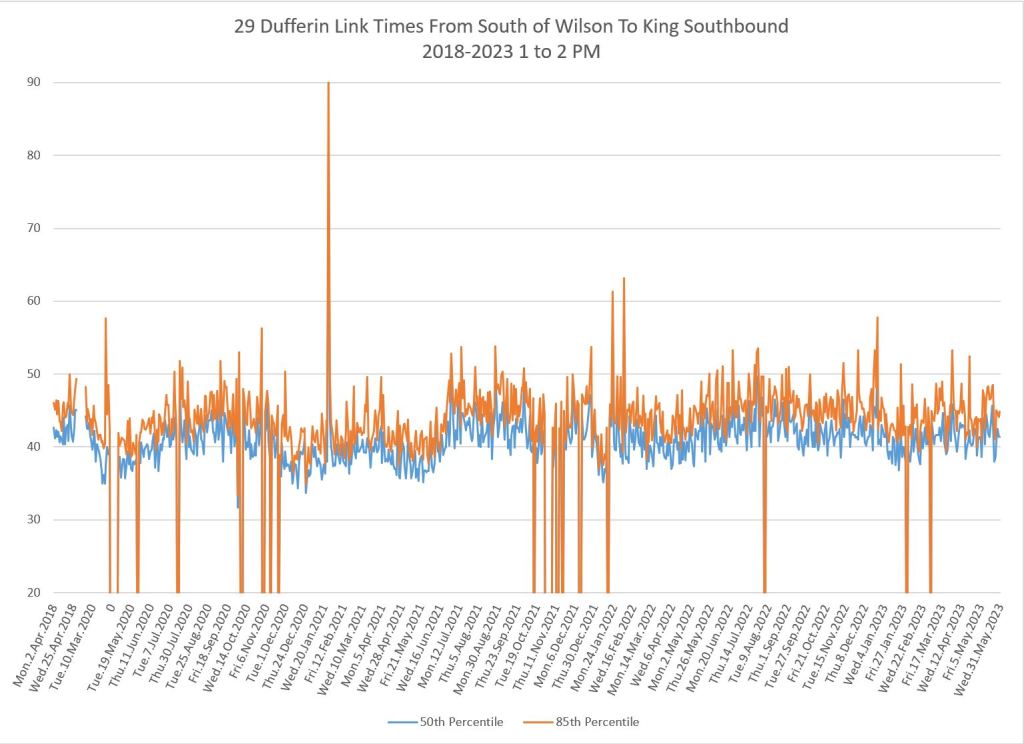
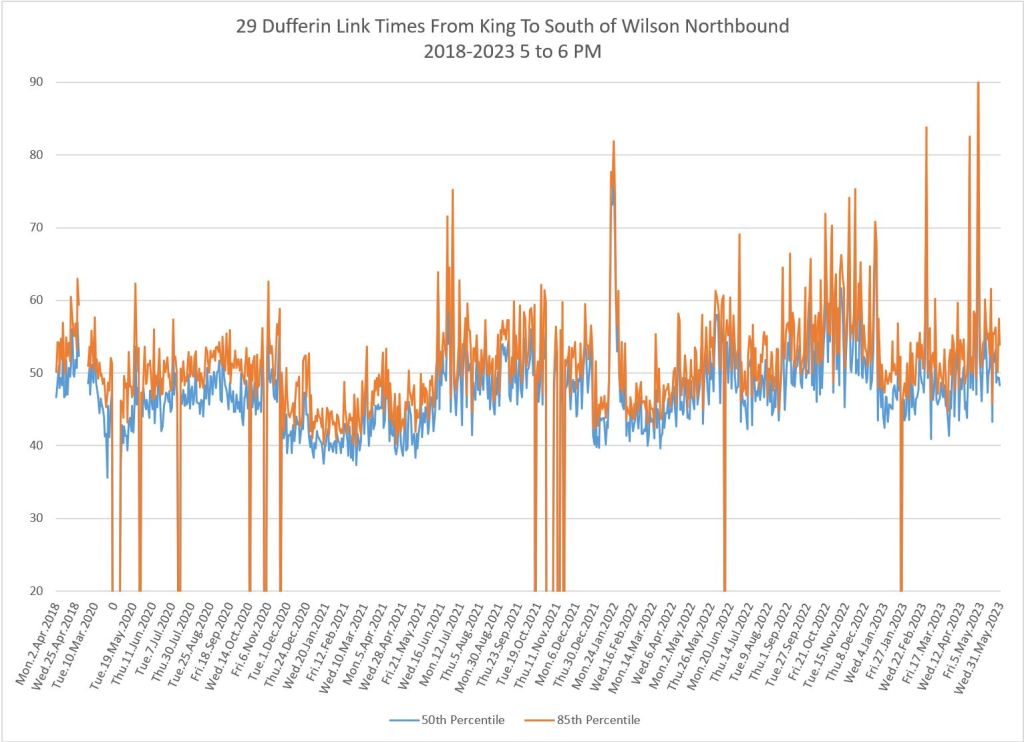
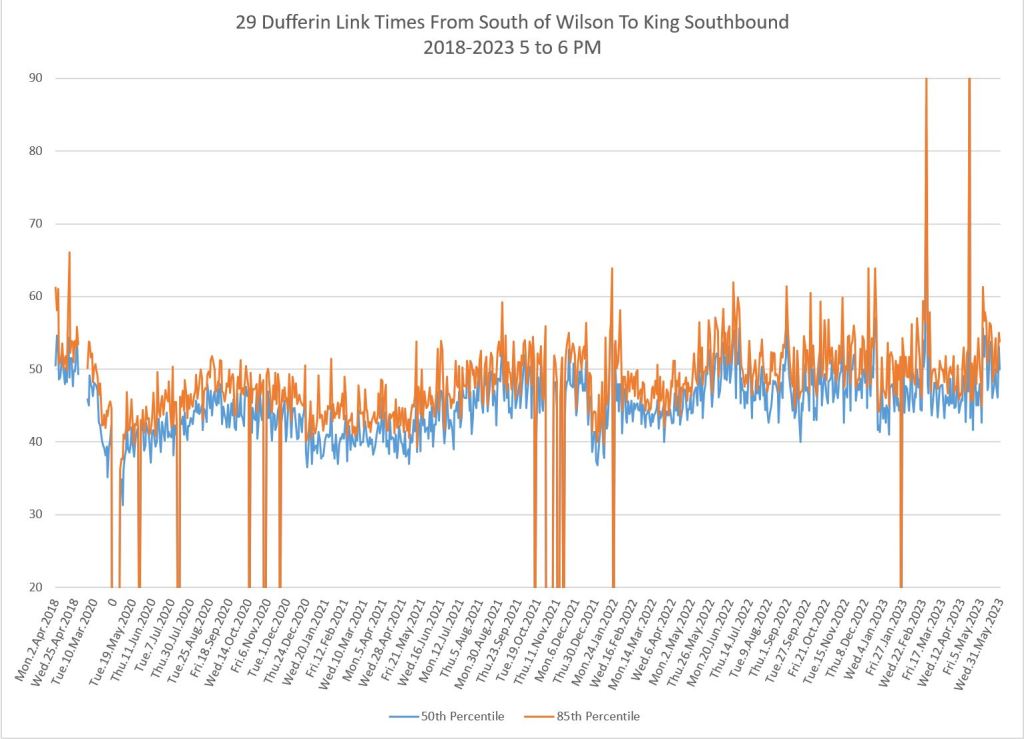
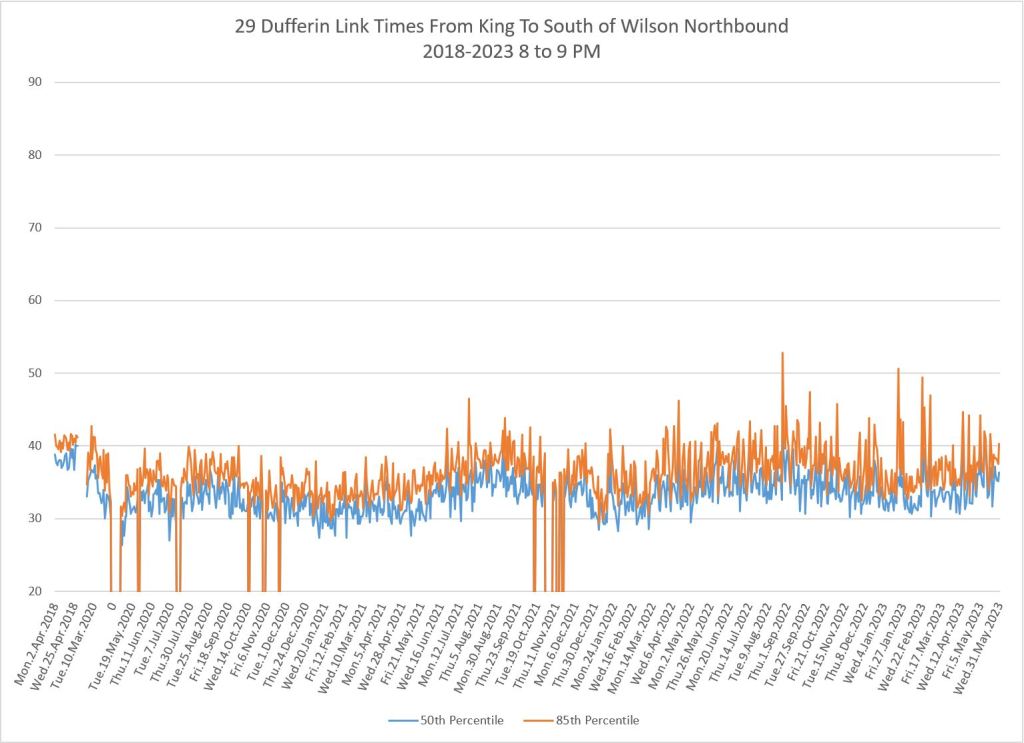
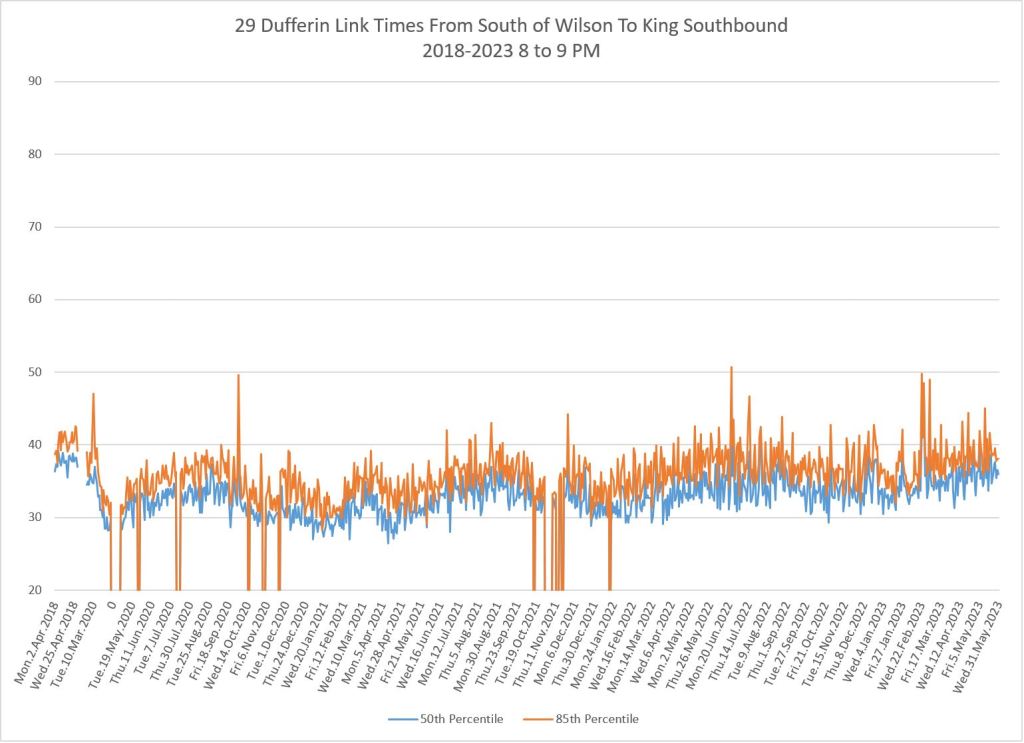
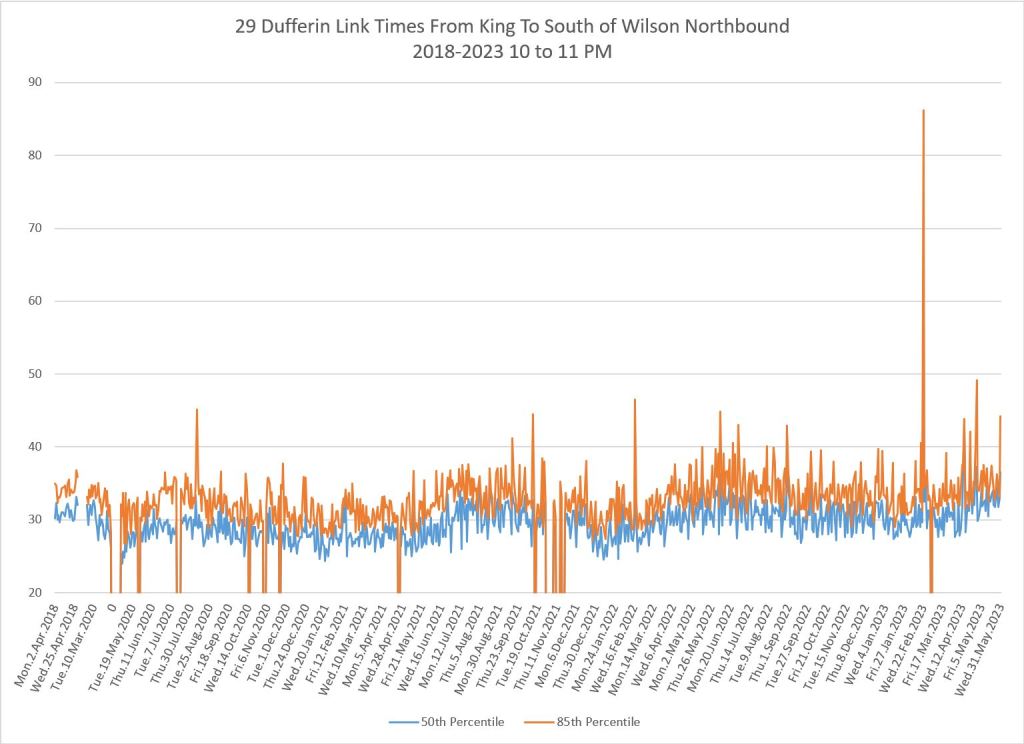
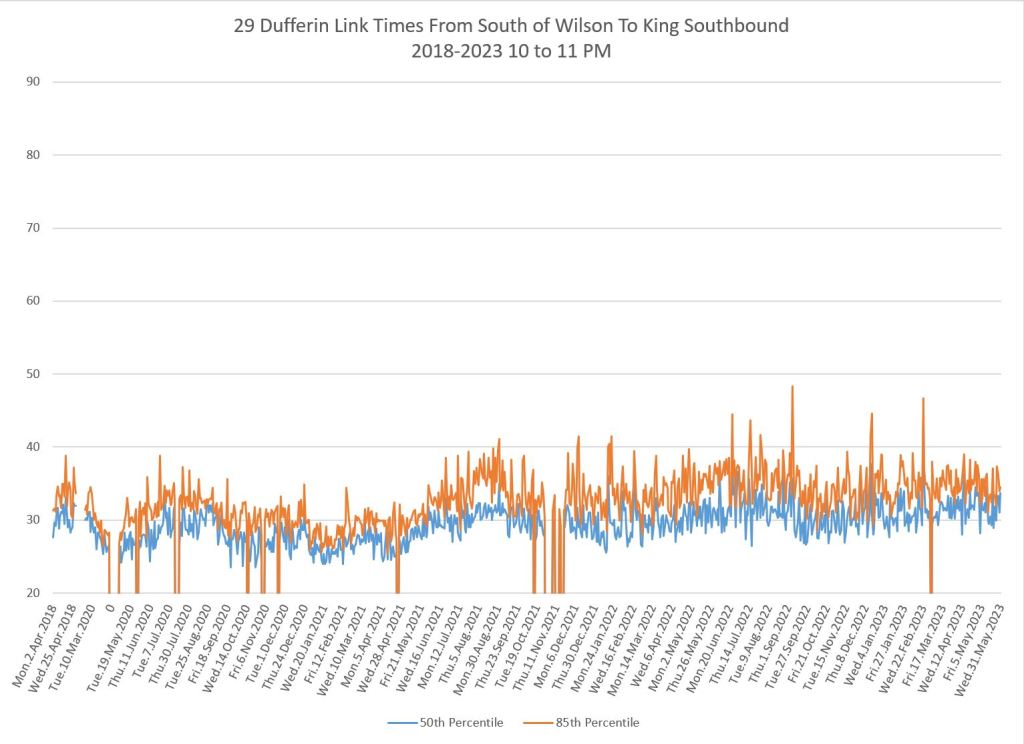
29 Dufferin
The drop in travel times on Dufferin is strongest southbound and in the peak hours. These periods took the longest to grow back to pre-pandemic levels. A few notes about these charts:
- There is a second drop in travel times in Dec-Jan 21/22 coinciding with both the usual holiday lull and the resumption of stronger restrictions on movement due to the pandemic. This disappeared fairly quickly.
- The shorter travel times had less effect both in the amount of change and the longevity in off peak periods. This suggests that the benefits of transit priority will be felt more during the peaks unless there is a major change in how the road operates (e.g. lane allocation and parking).
- At some peaks in the 85th percentile values are quite high. By analogy to the King Street project, shaving these peaks and achieving consistent travel times will be an important effect, if it can be achieved, of any priority scheme.
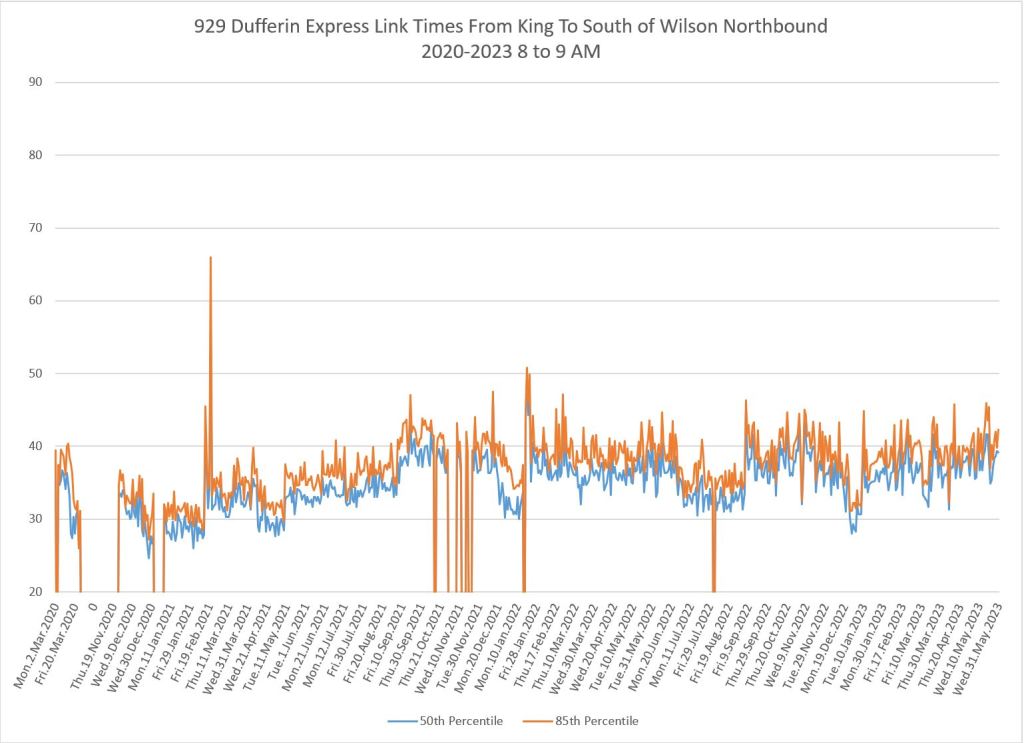
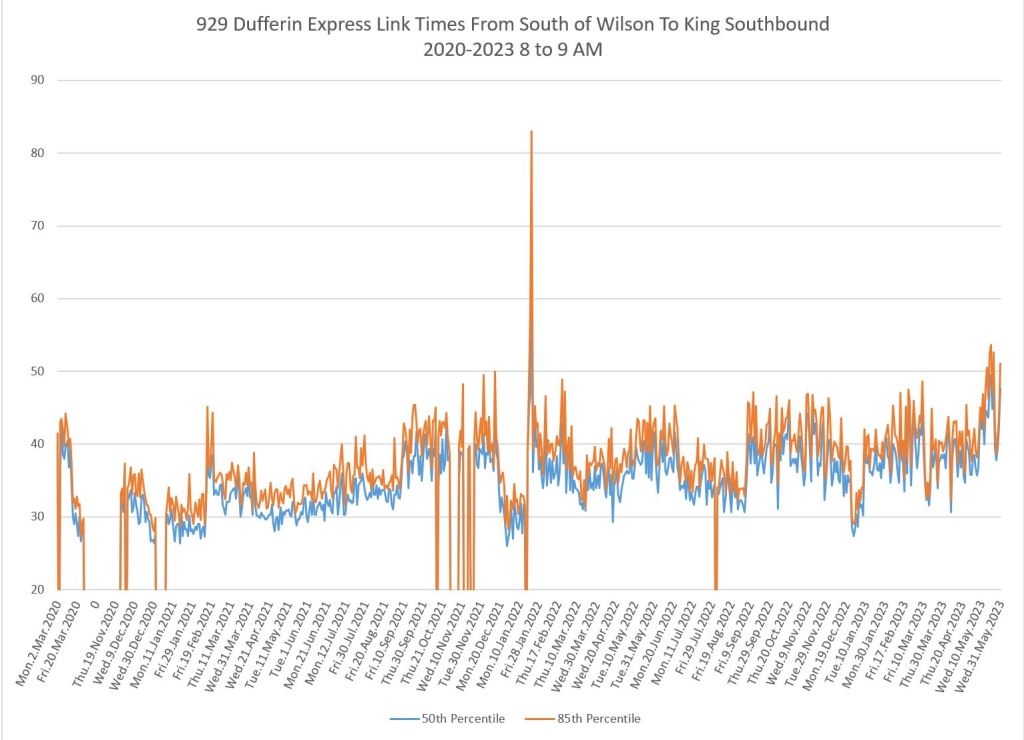
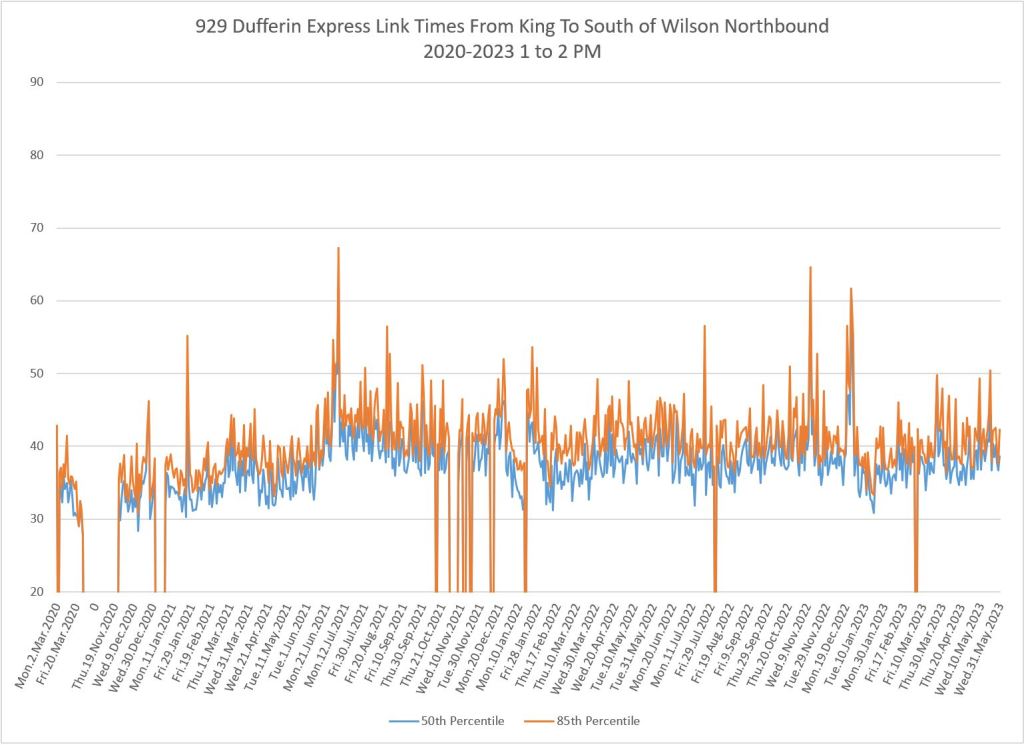
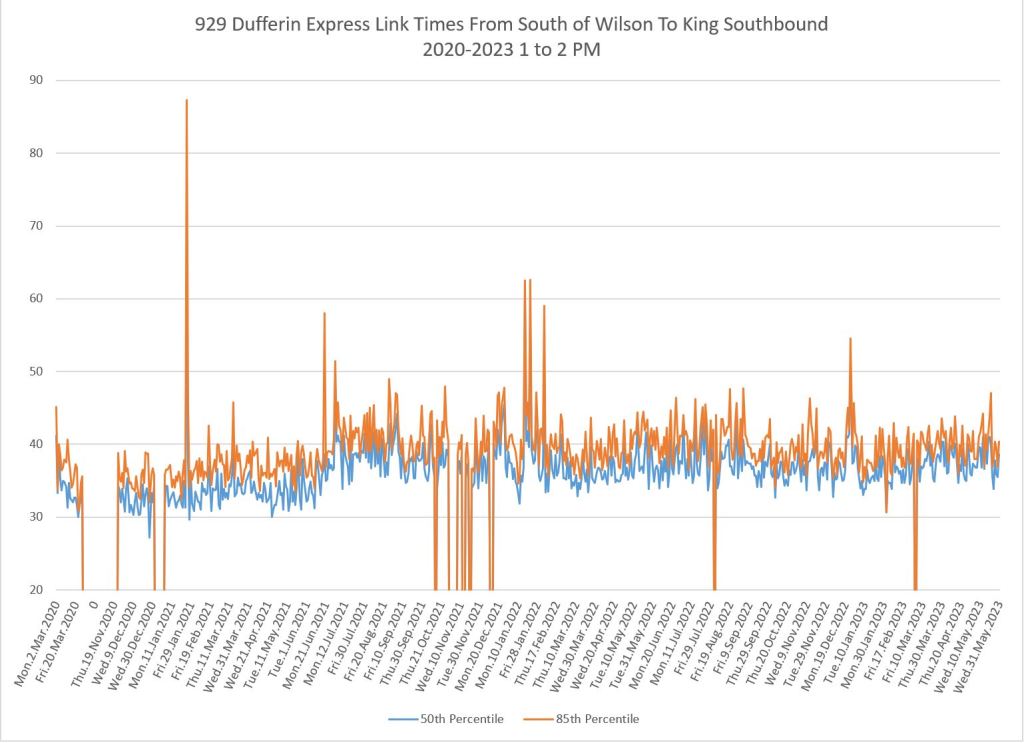
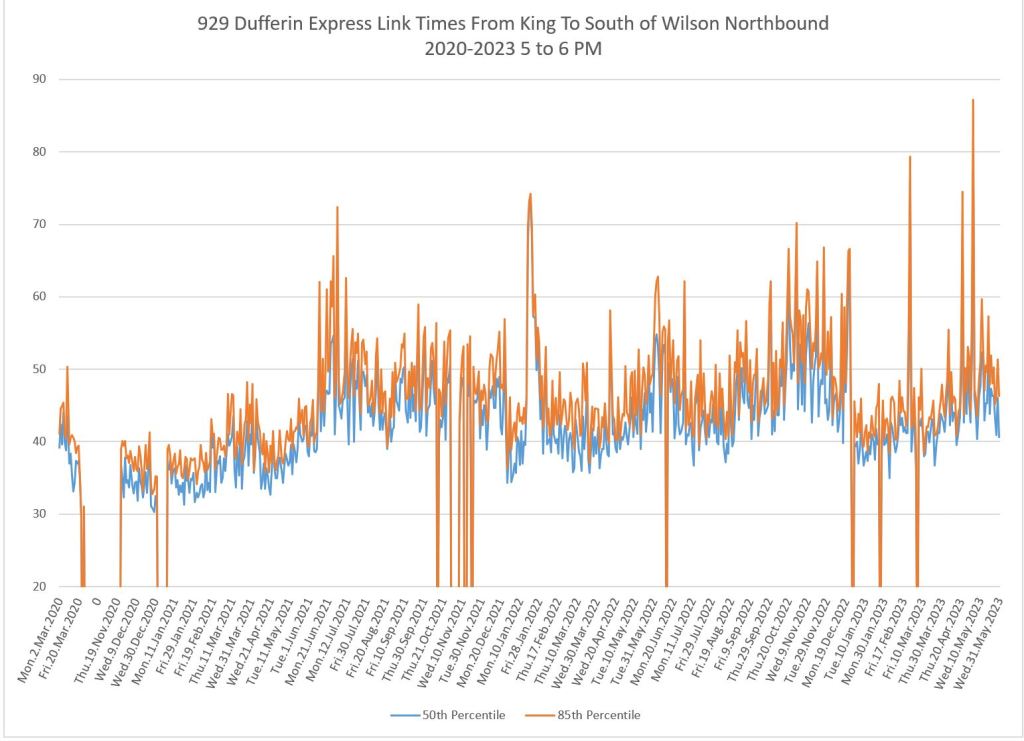
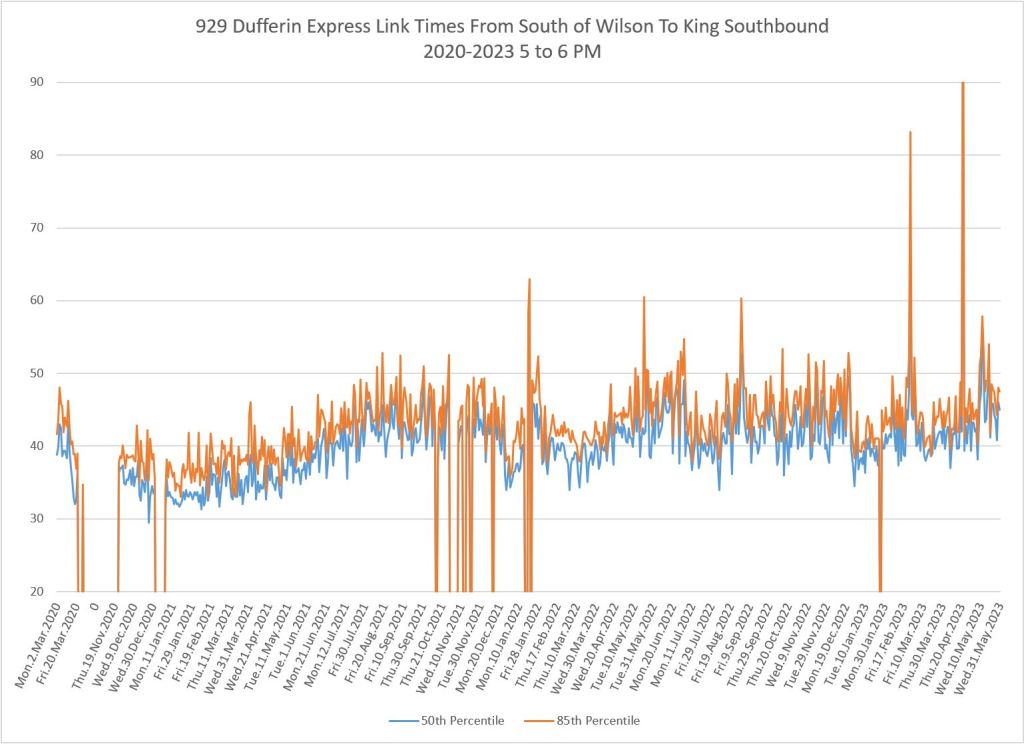
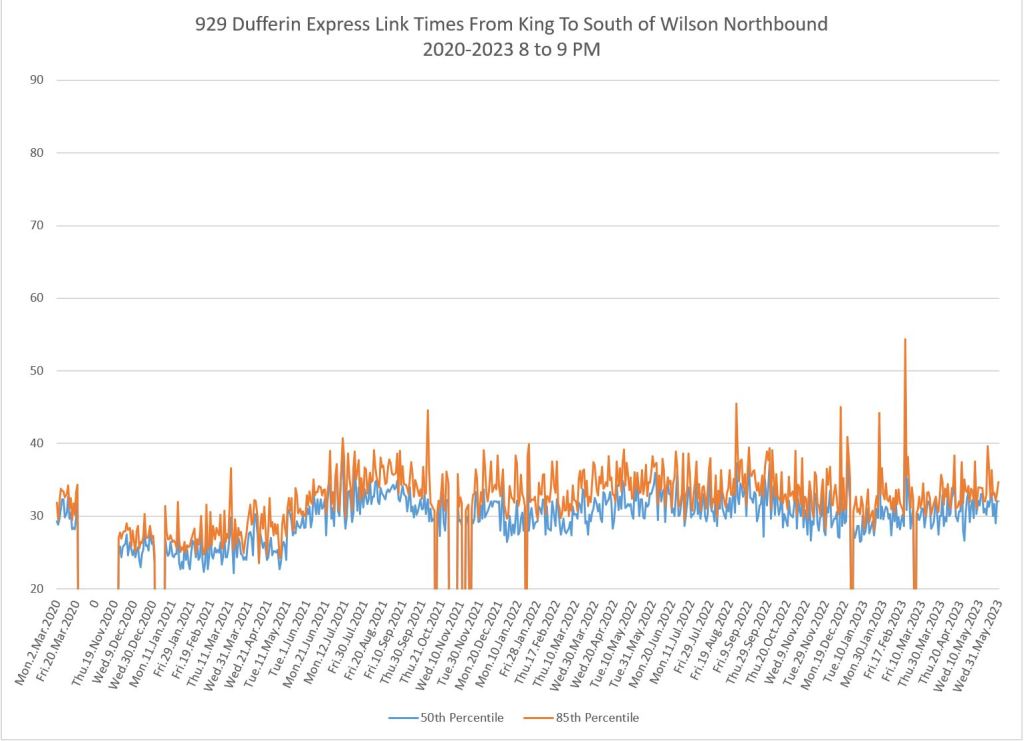
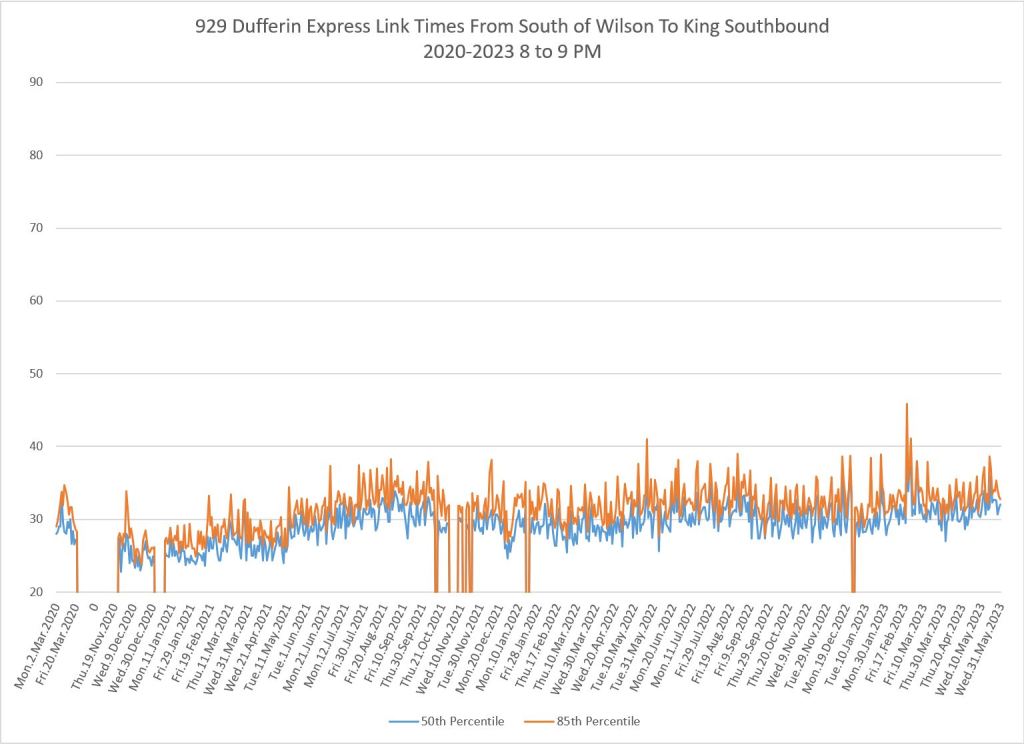
929 Dufferin Express
The express service on Dufferin did not operate through mid-2020 and resumed only in late November. For a comparison of local and express services with the operating dates aligned, see the next section.
The pattern of rise and fall in travel times shows the same general effect as with local service.
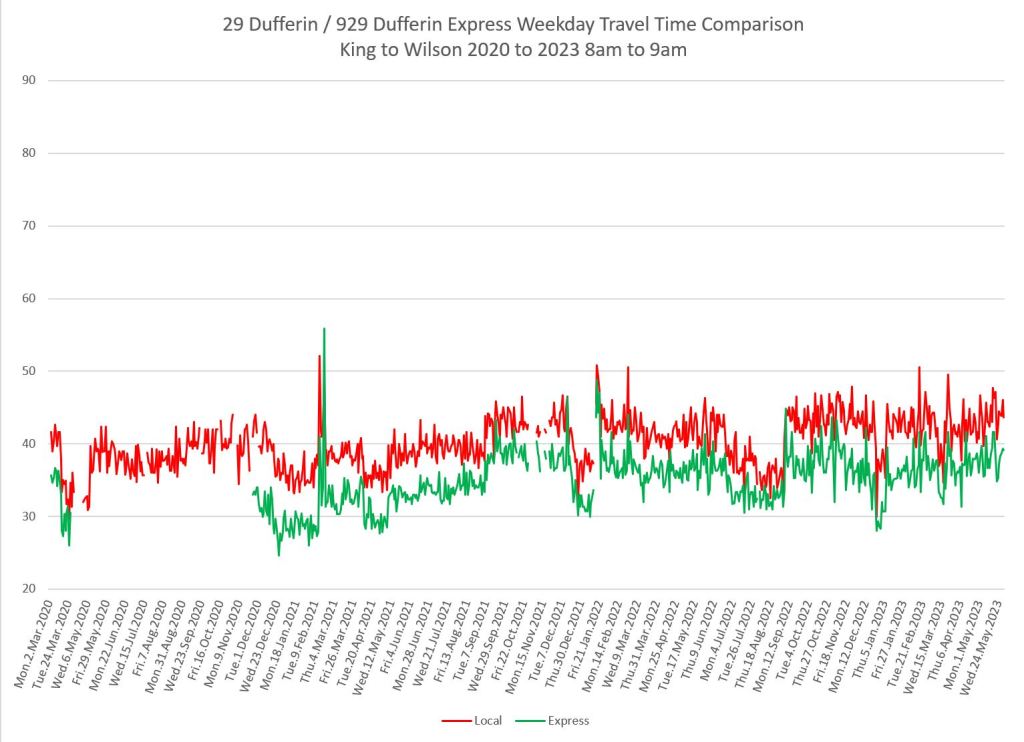
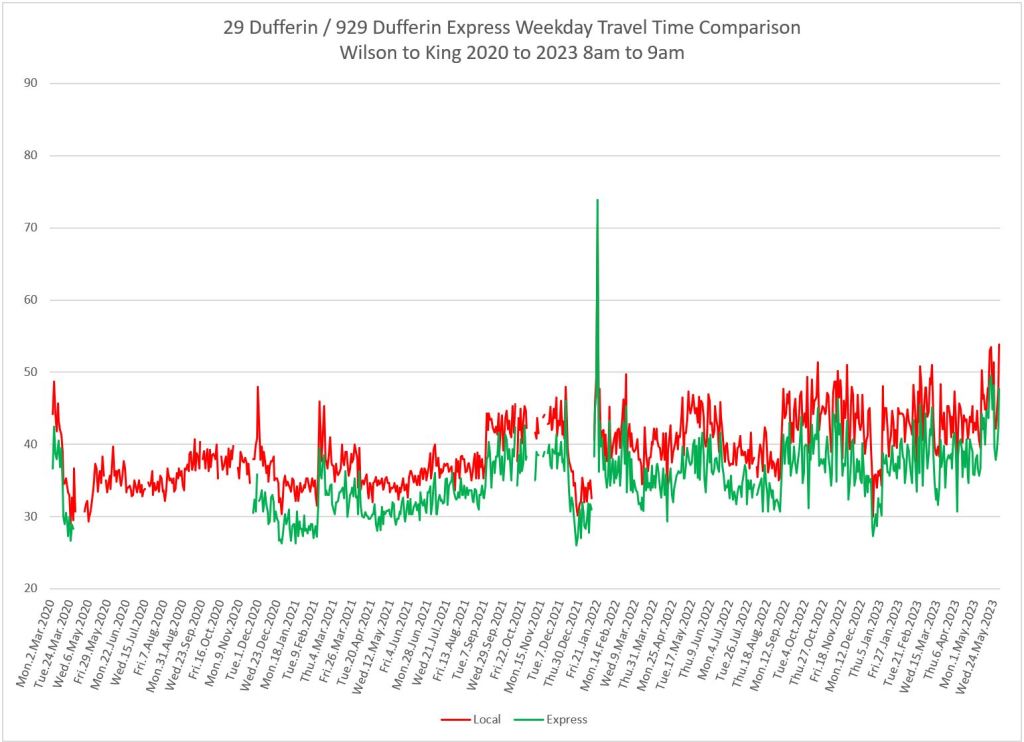
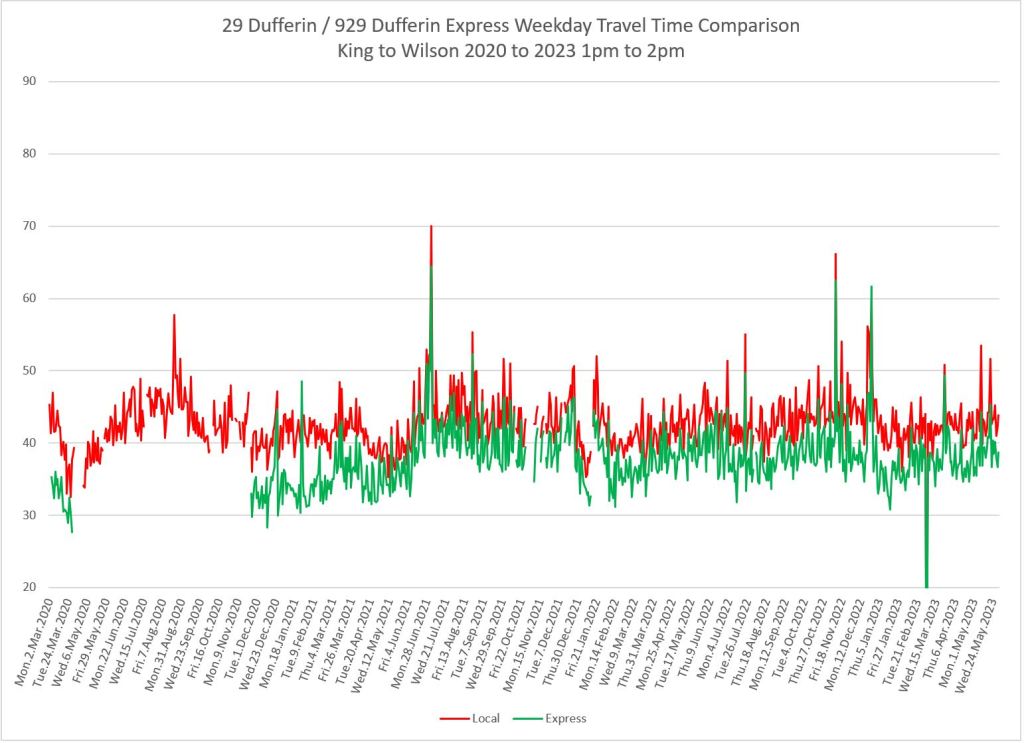
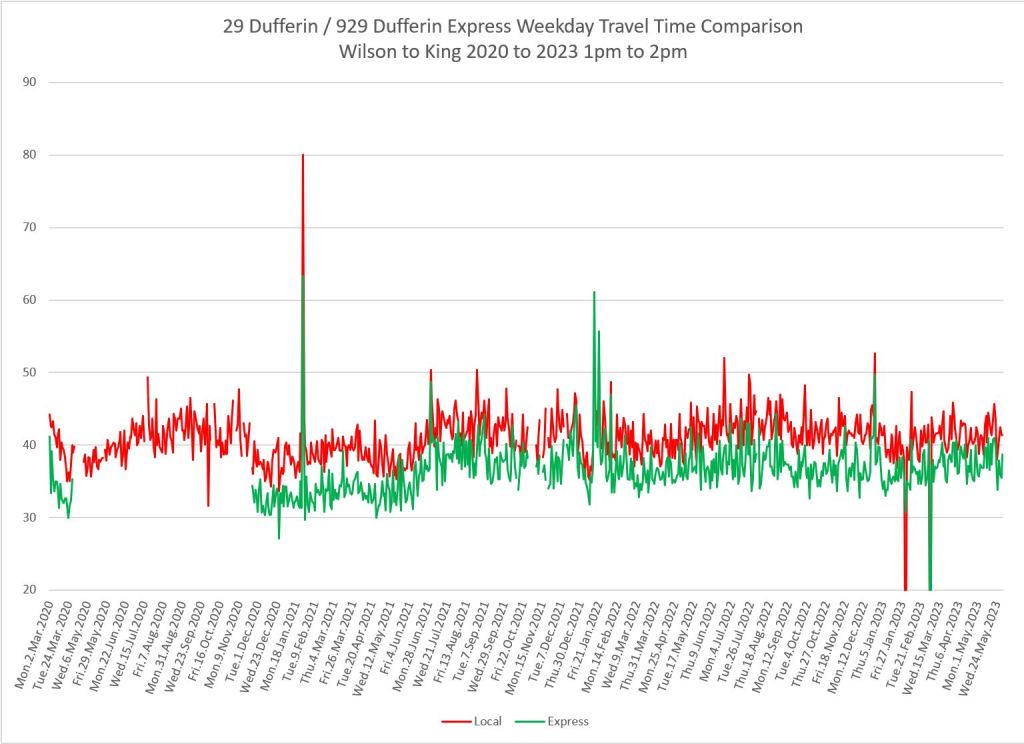
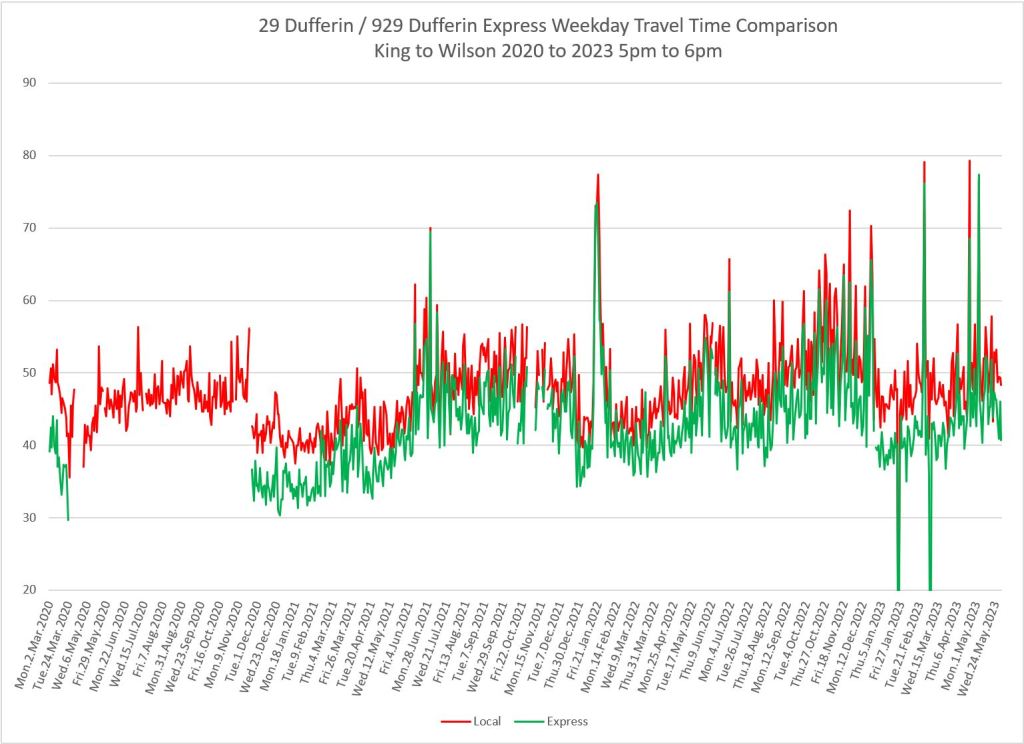
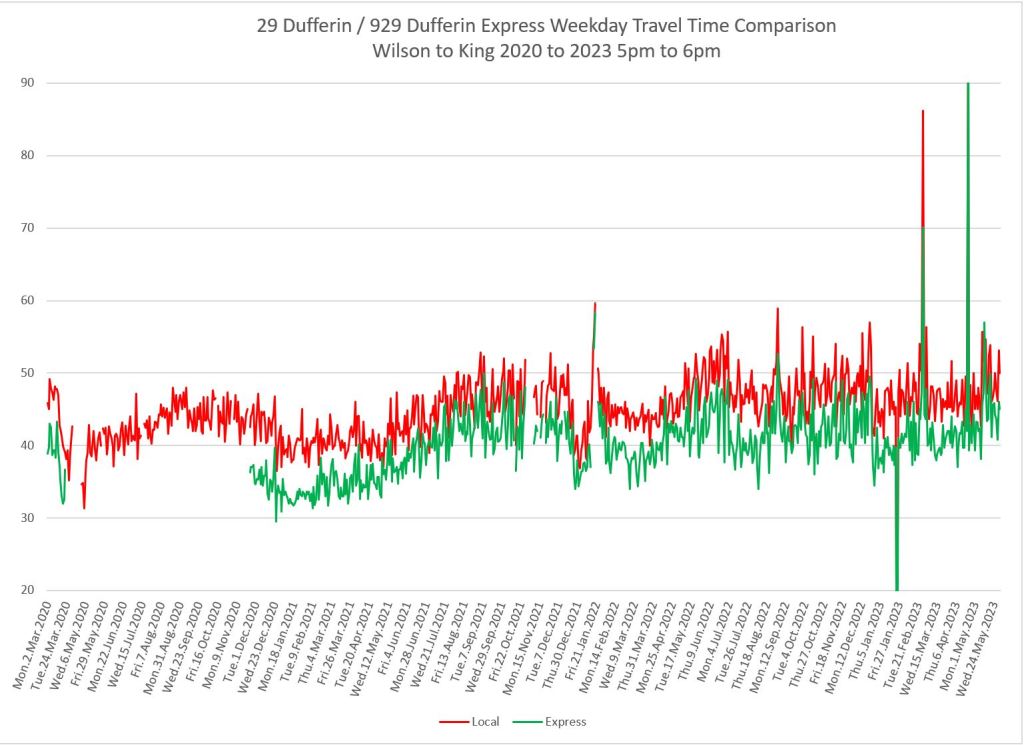
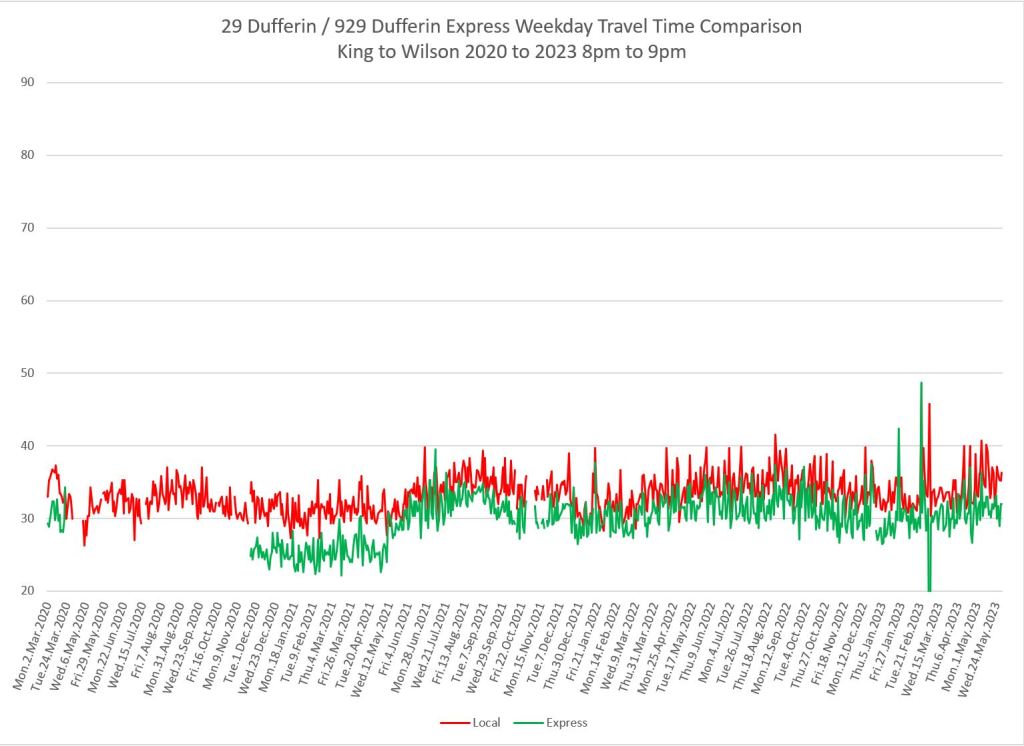
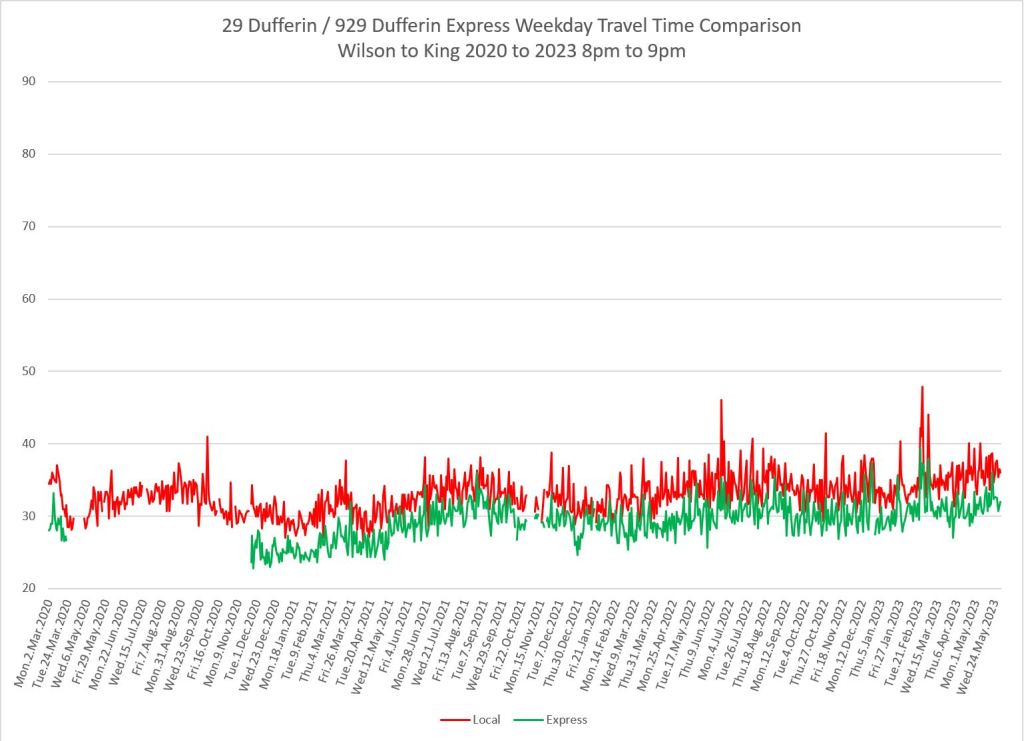
29/929 Dufferin Express vs Local Travel Times
These charts combine the median values for the local (red) and express (green) services. Gaps in the express data correspond to periods when it did not operate during the pandemic.
The median travel times for the two services are generally within five minutes of each other.
The chart for 5pm northbound shows that this has the most volatile travel times. Note also the width of the spike in January 2022 where it took several days for travel to return to normal after a major snow storm. This implies that road capacity was hindered by delays in snow clearing, although the effect was only visible under the peak, uphill conditions.
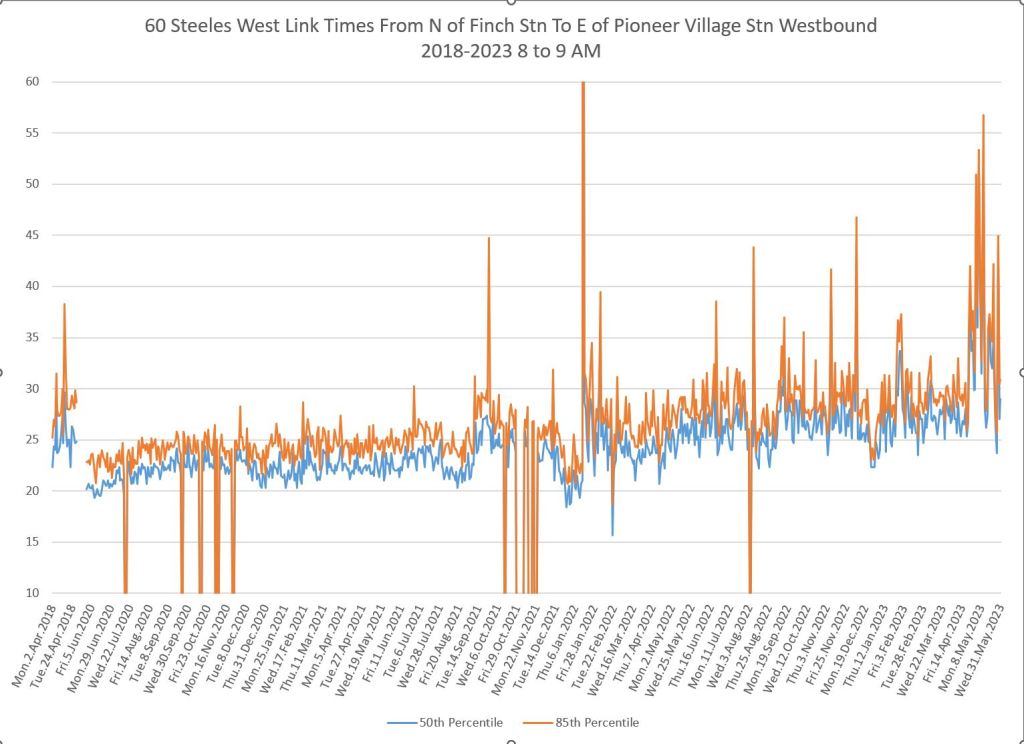
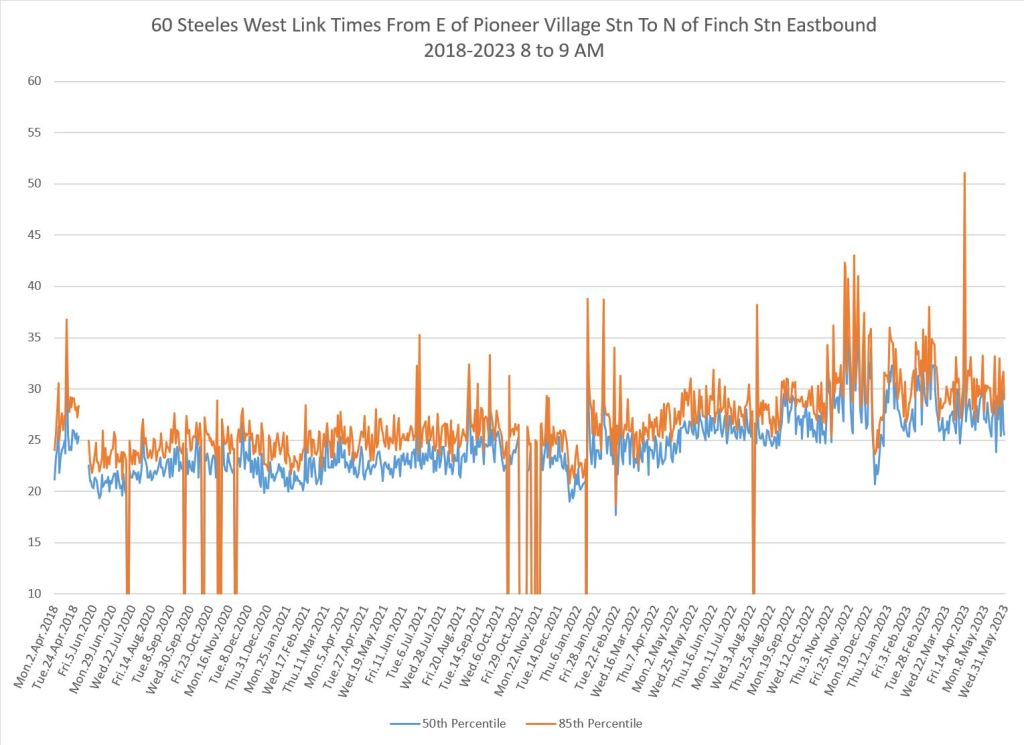
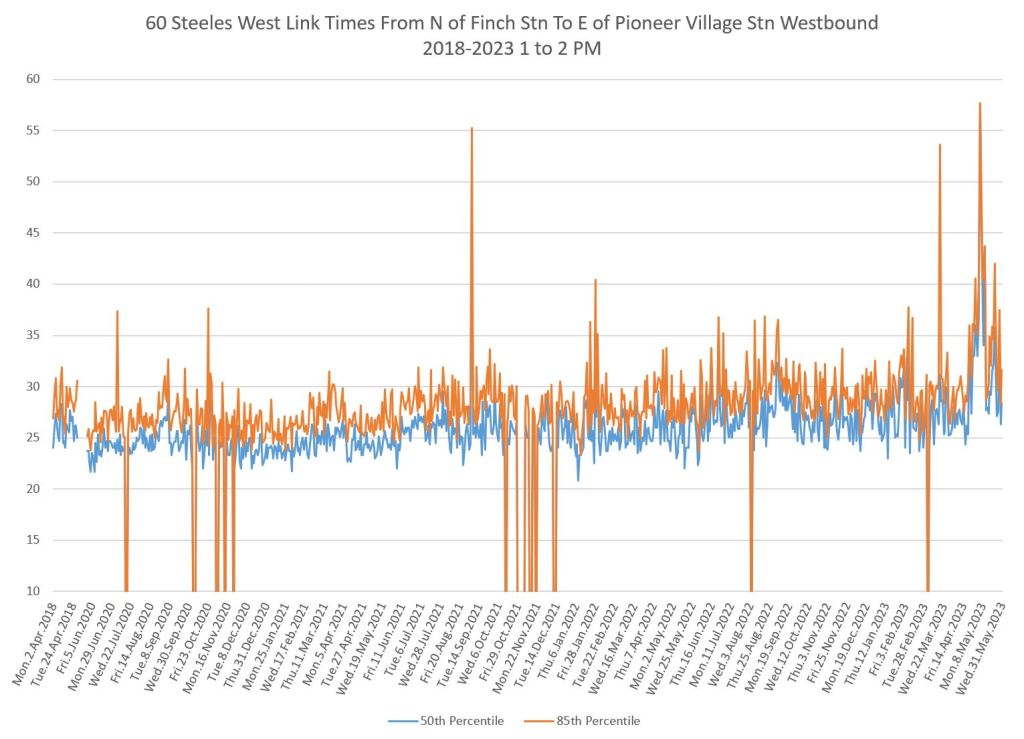
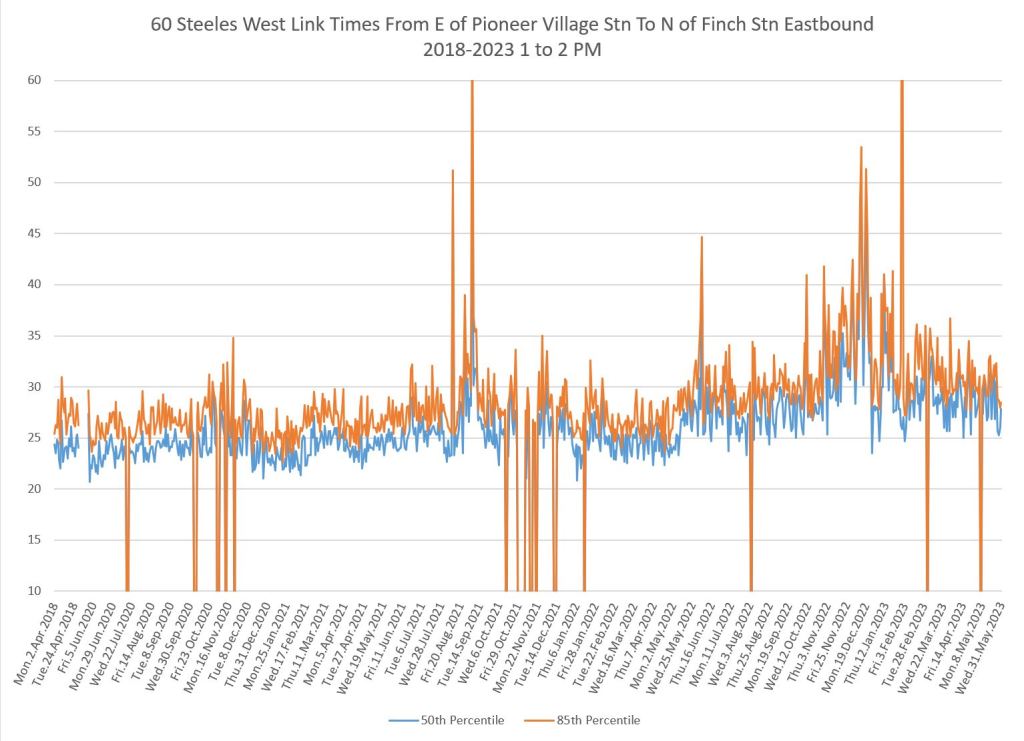
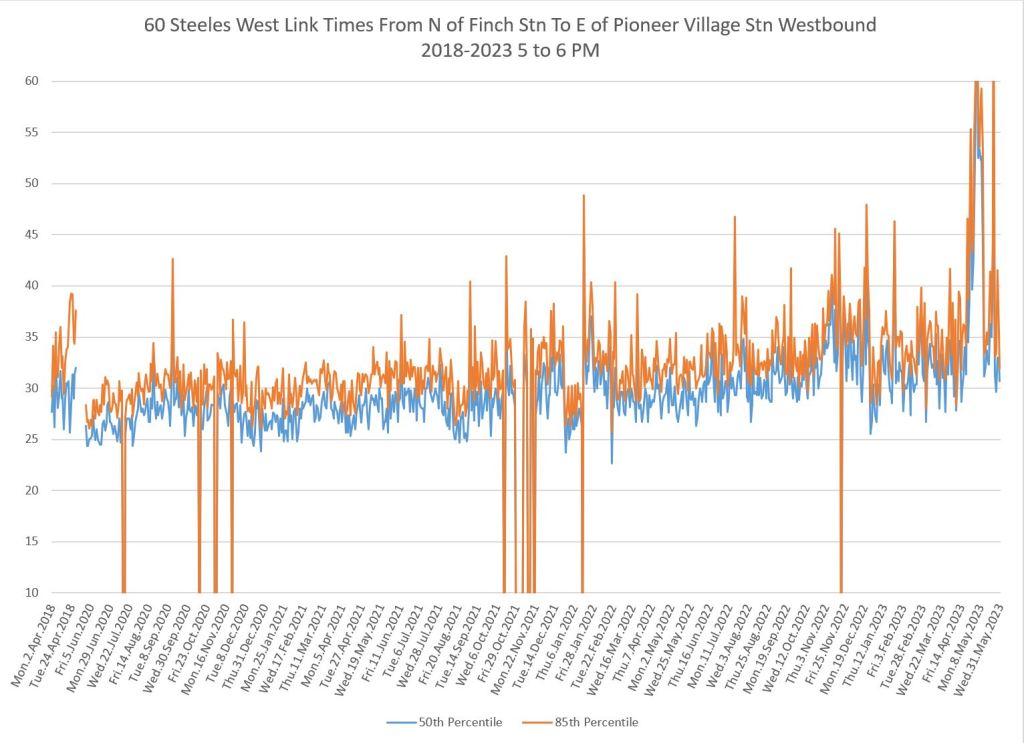
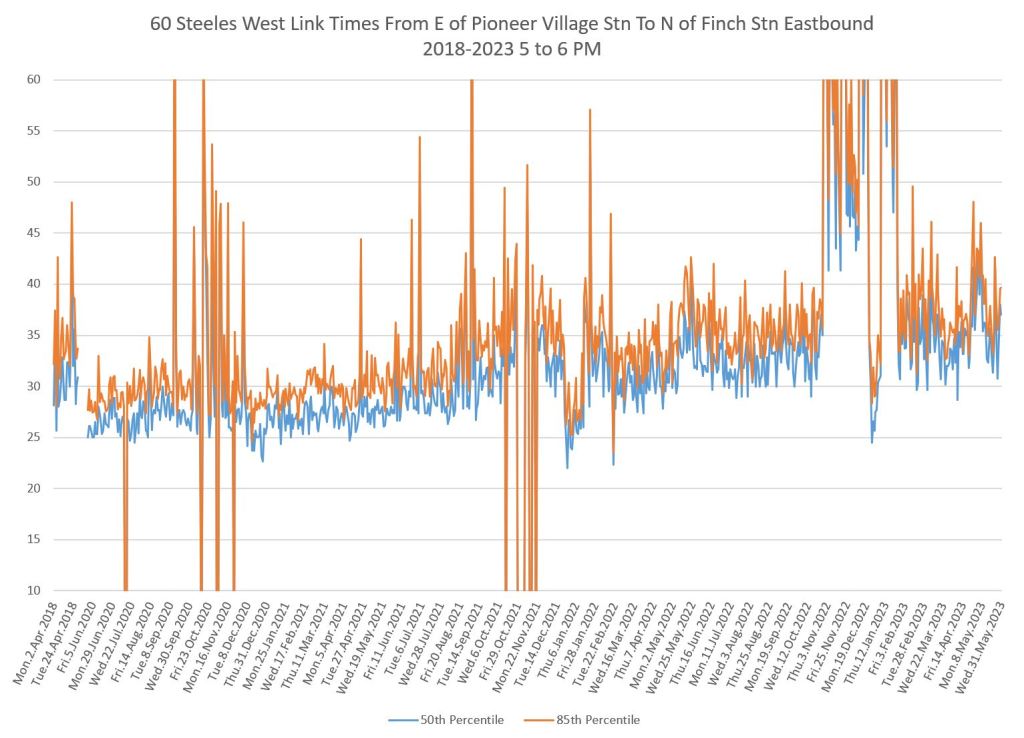
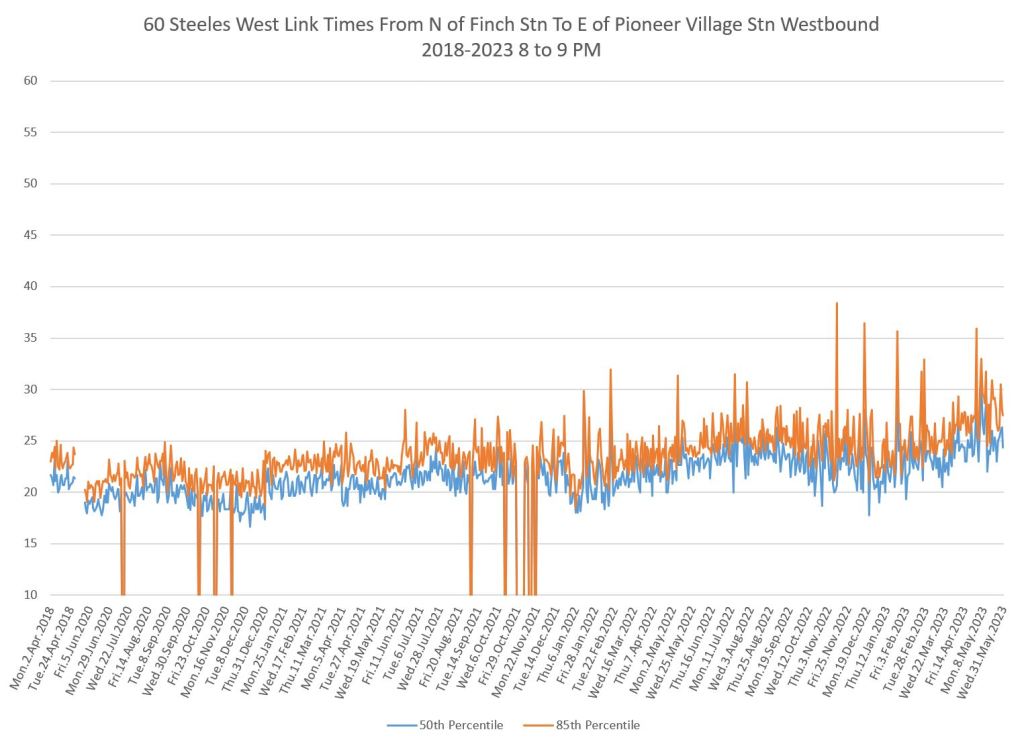
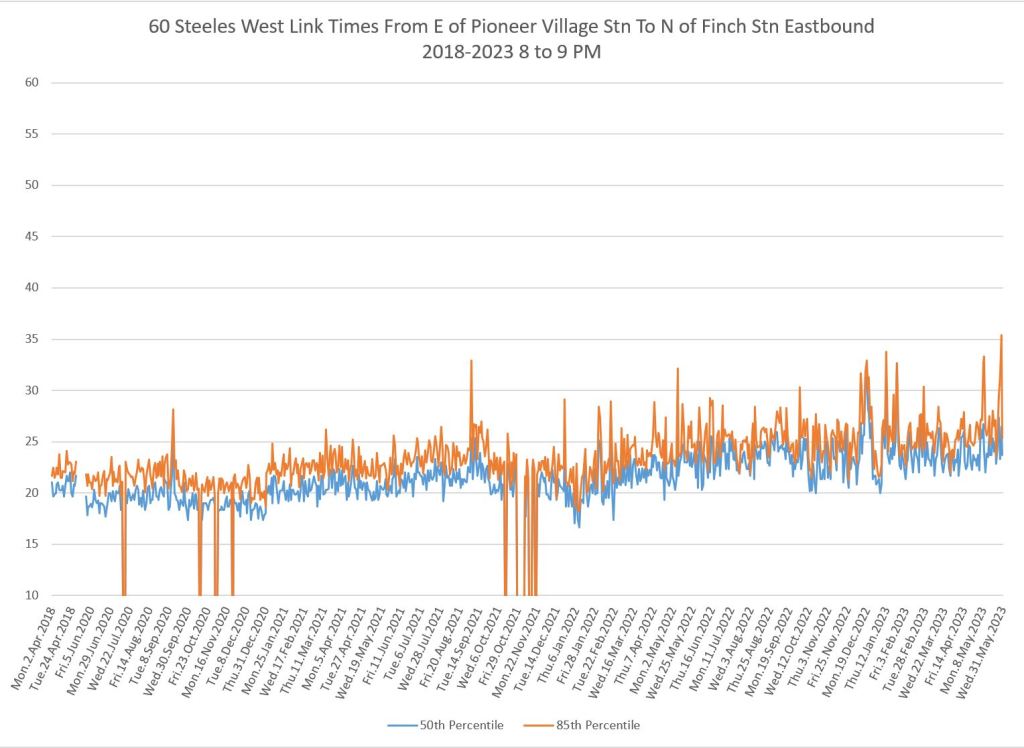
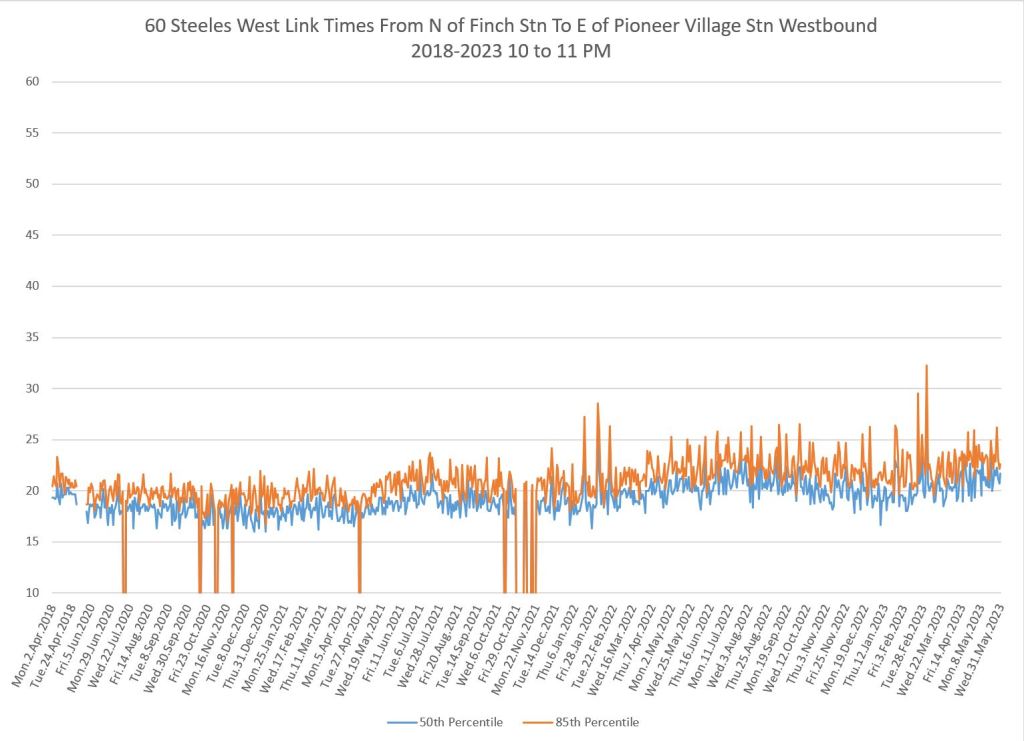
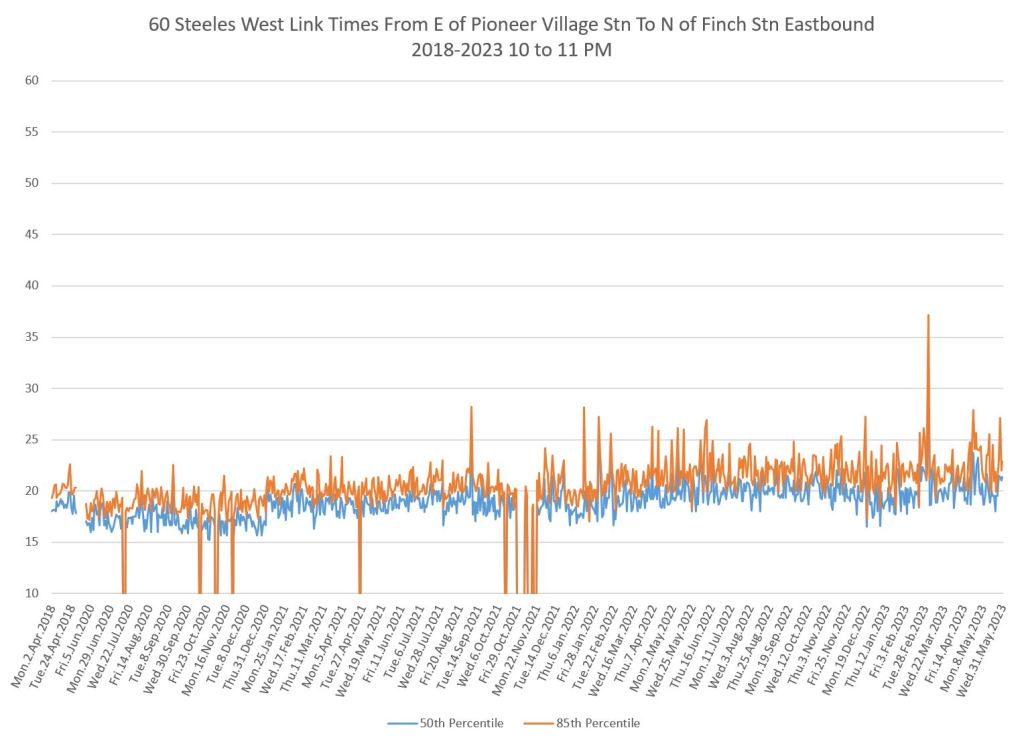
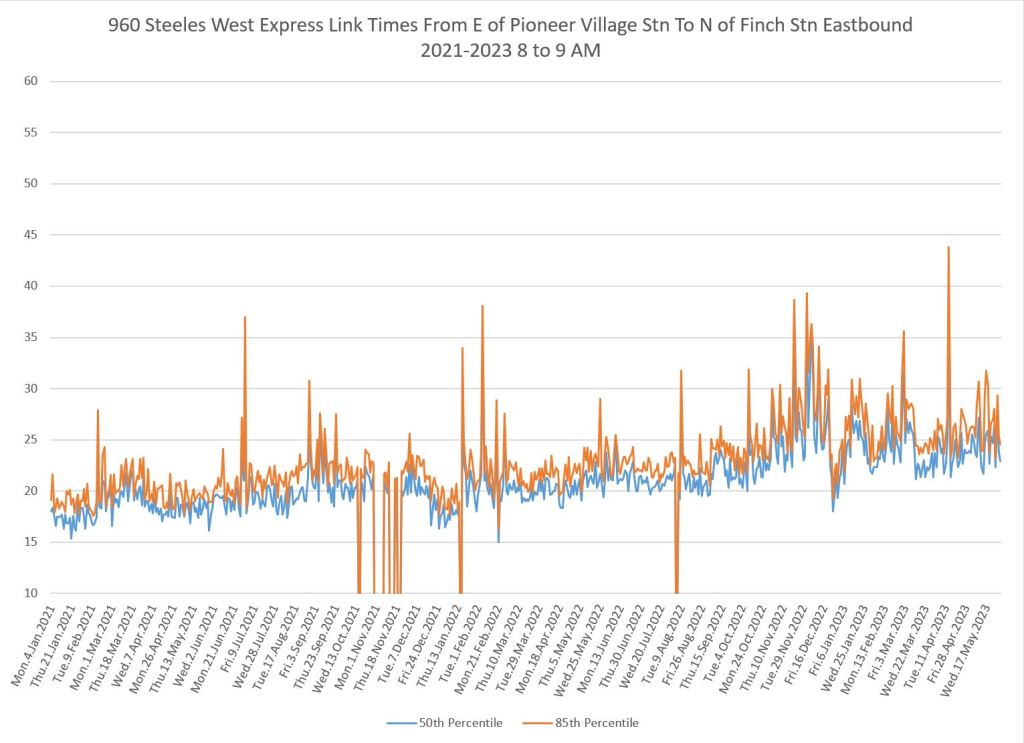
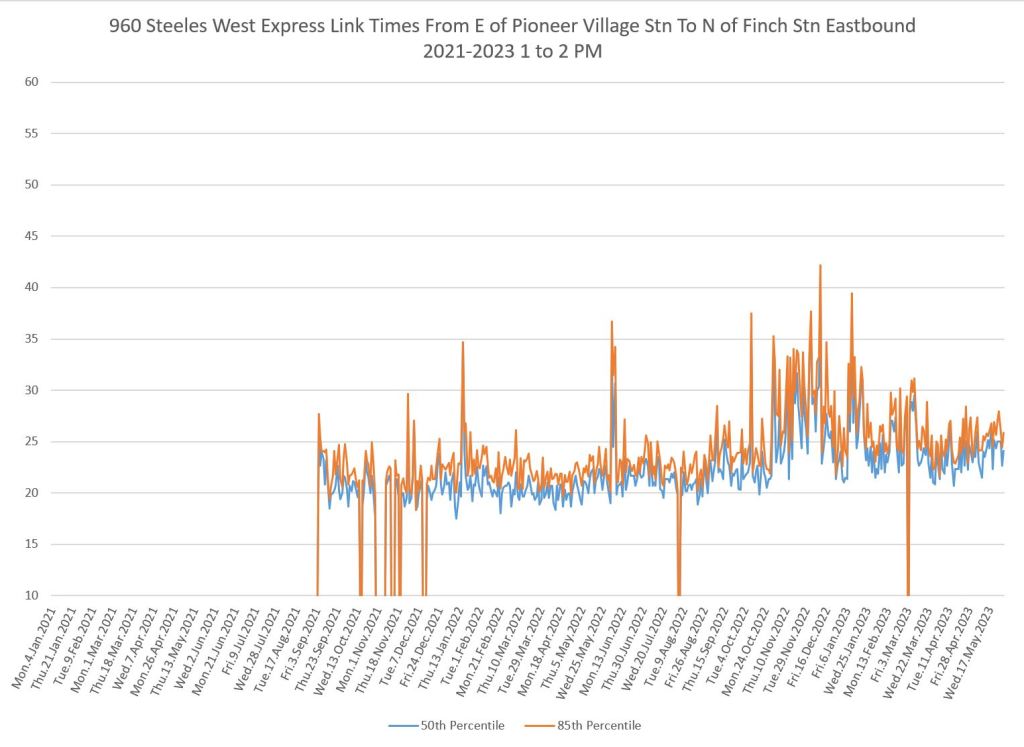
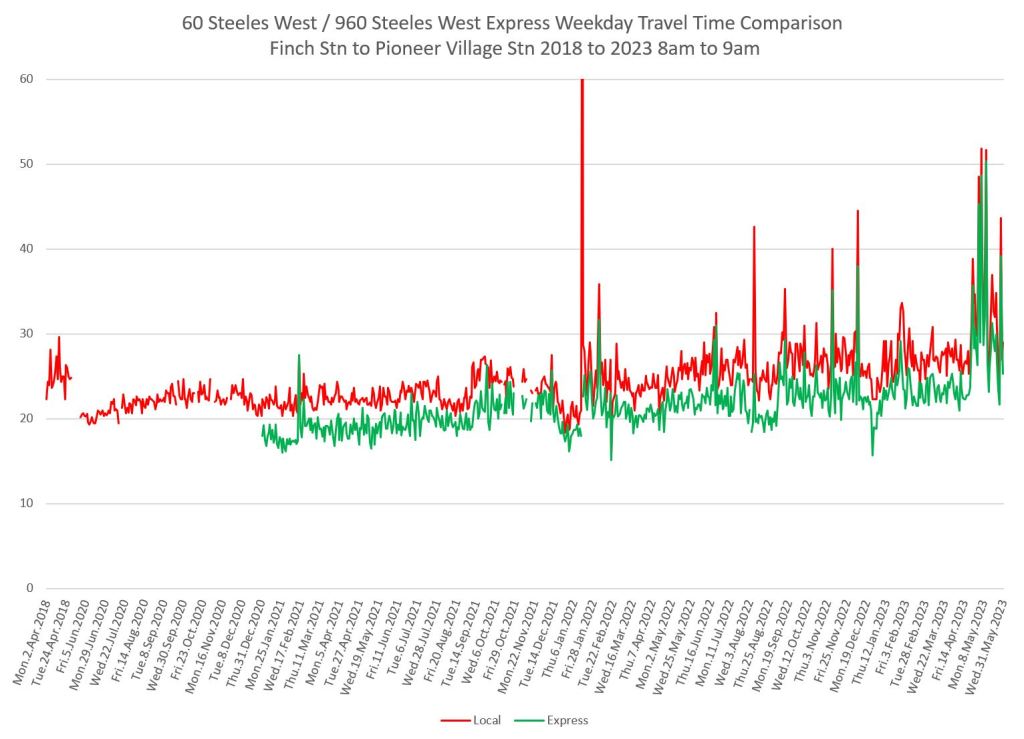
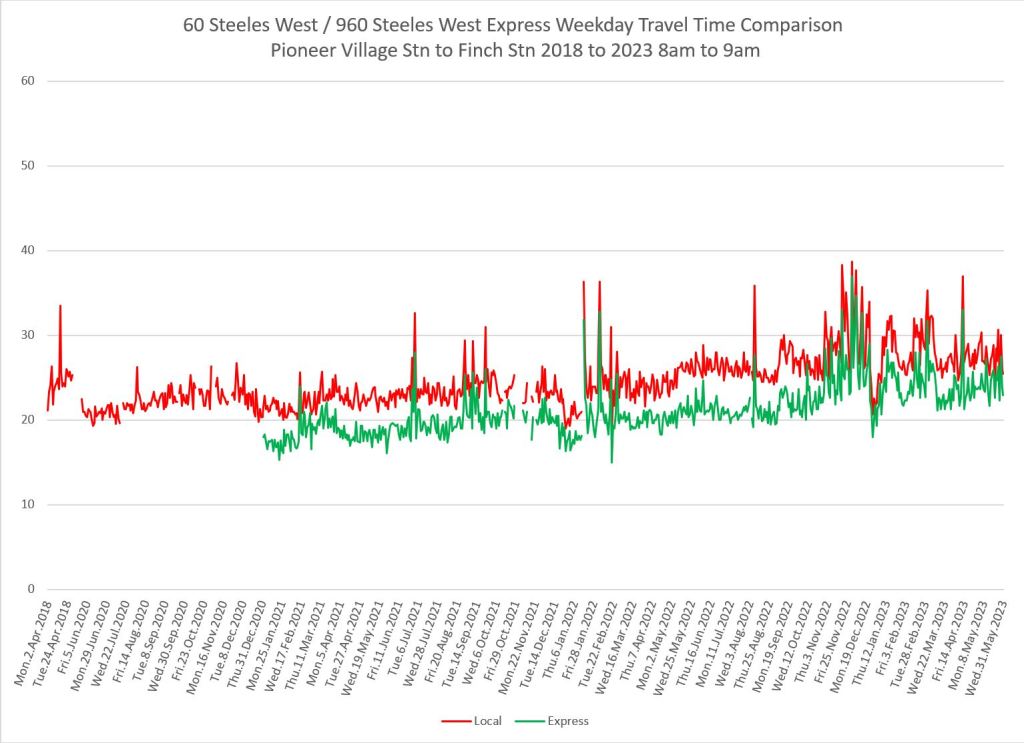
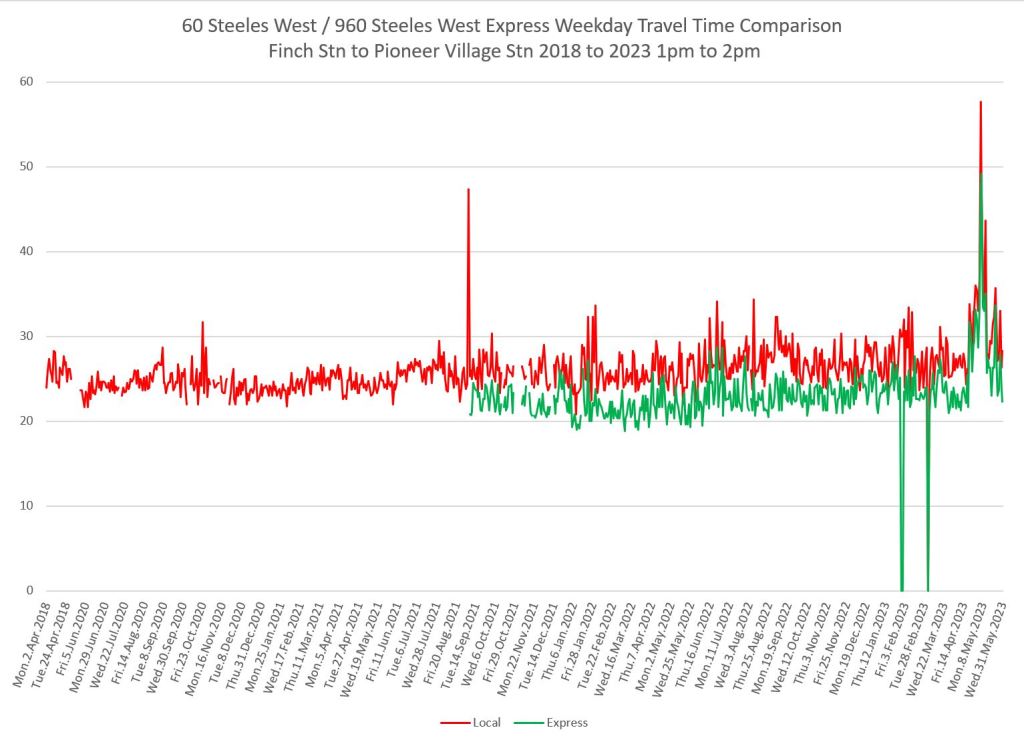
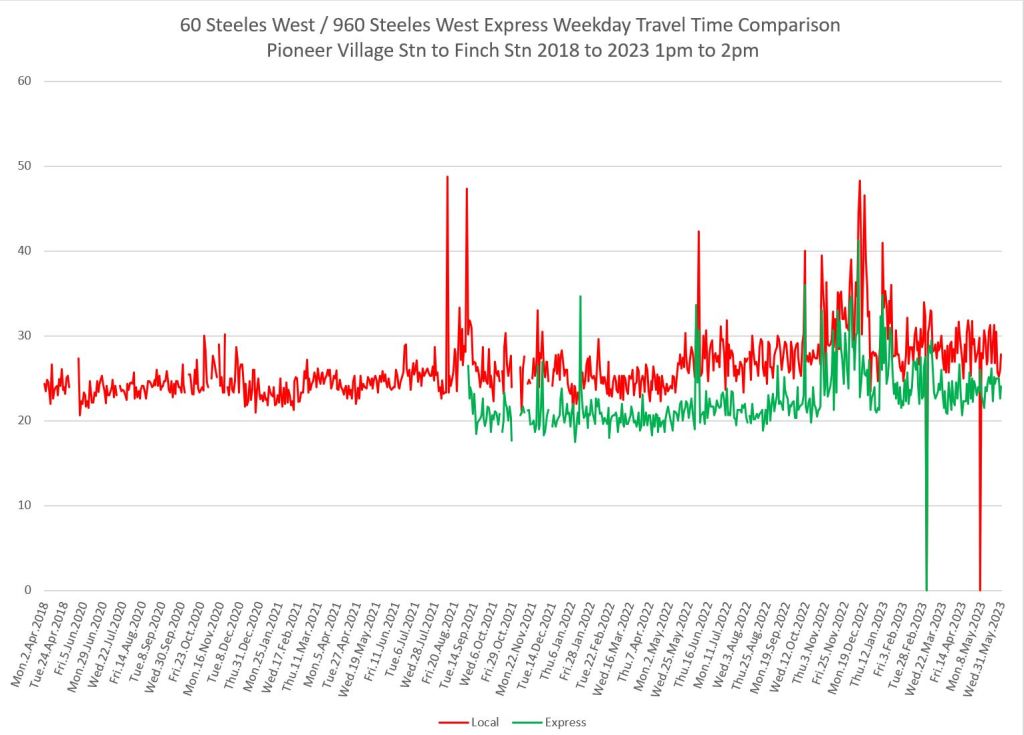
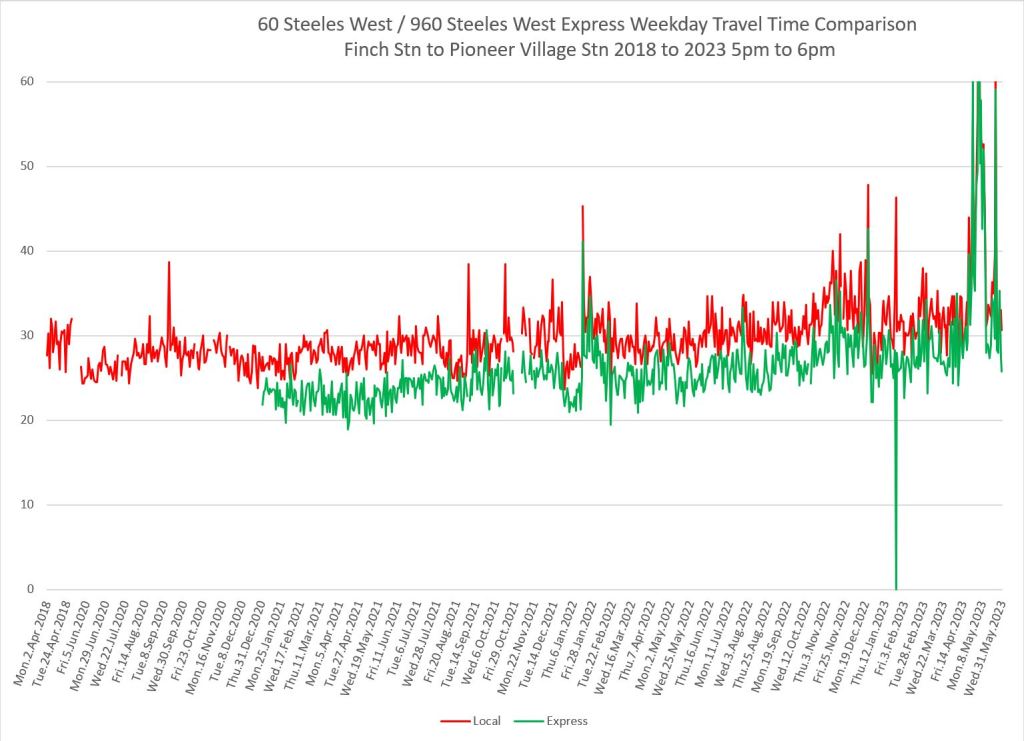
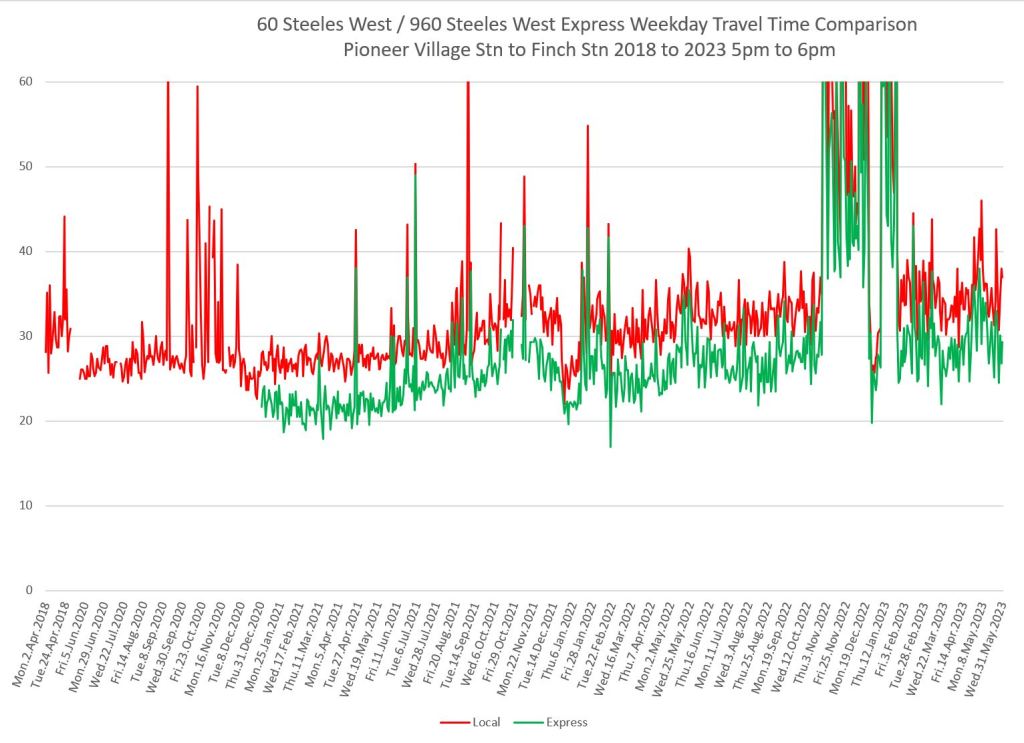
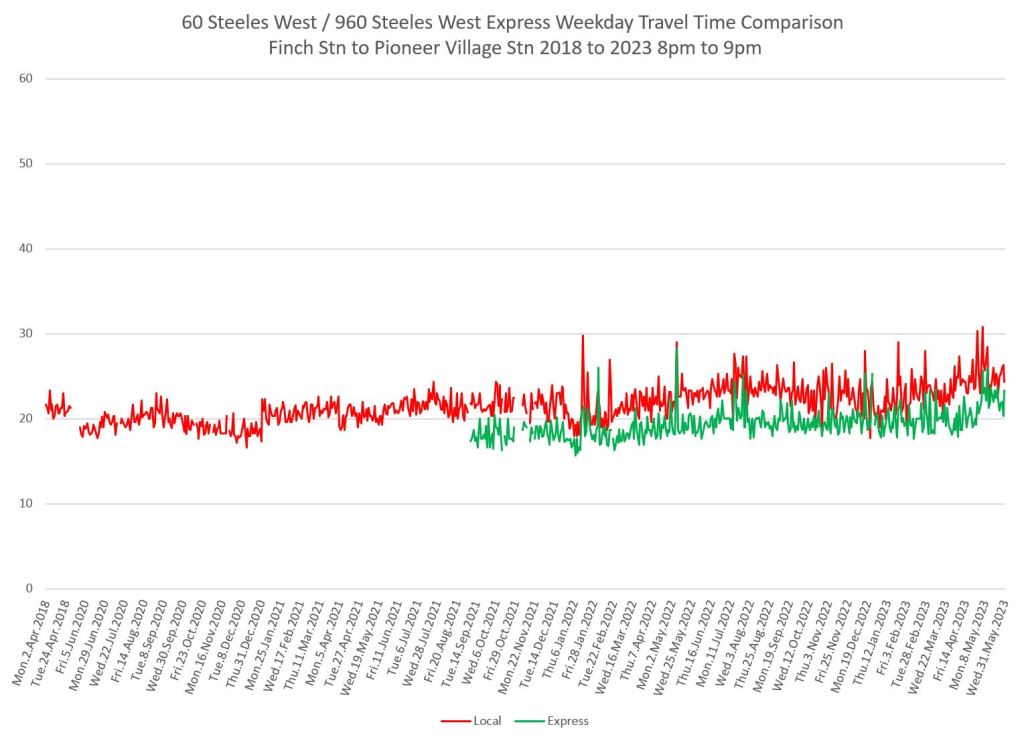
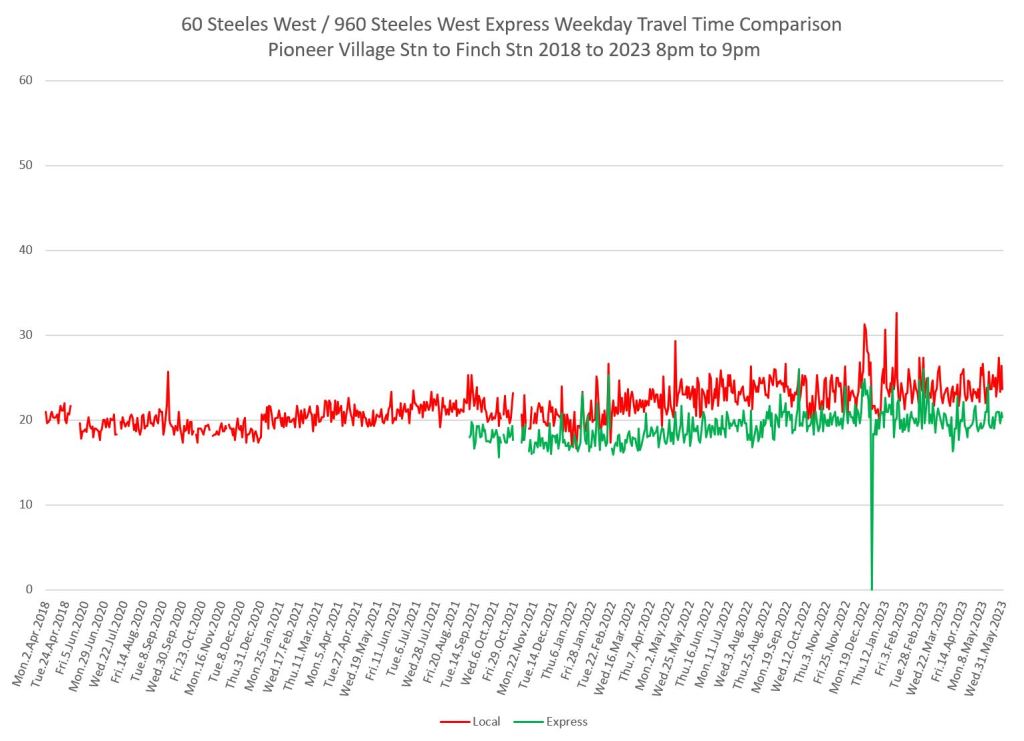
60 Steeles West (Eastern Segment)
This segment covers the route from north of Finch Station to east of Pioneer Village Station. The choice of screenlines is intended to eliminate variations in bus behaviour and local traffic congestion at the terminals.
The drop in travel times in early 2020 is most notable in the peak periods, less so in the off-peak. Through 2022 and 2023, travel times have grown in some cases above pre-pandemic values, with a notable spike upwards in Fall 2022 eastbound caused by severe congestion between Keele and Dufferin. This also appears in January 2023 data between the 9th and 25th of the month.
This is an example of a long-running disruption of a route for which there was no provision in the schedule.
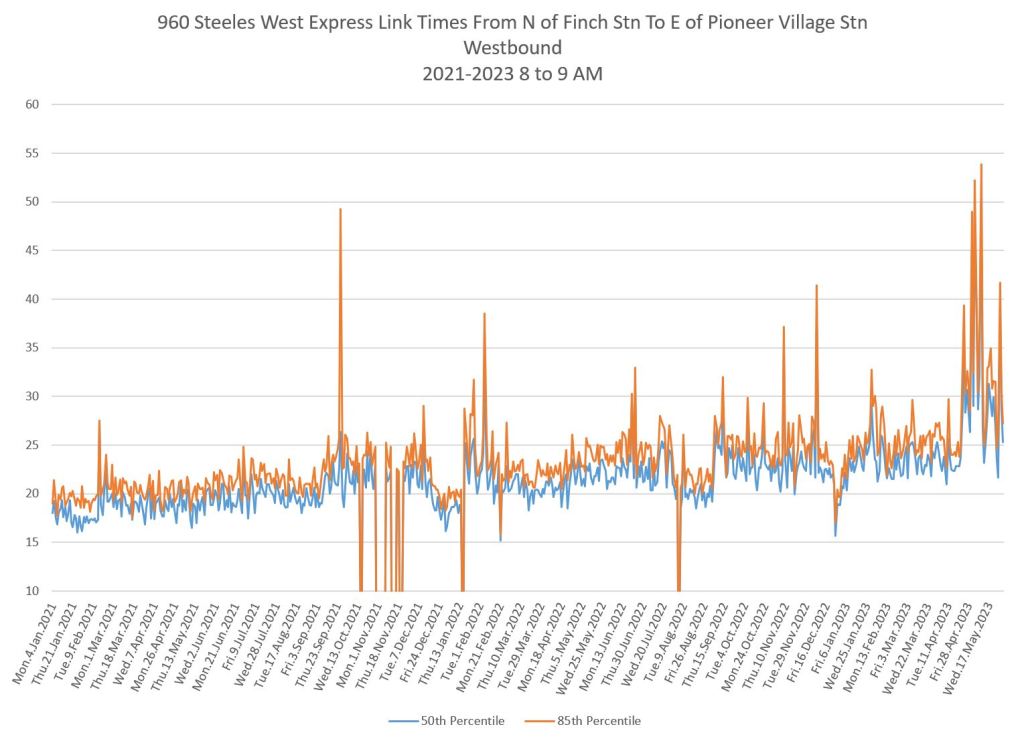
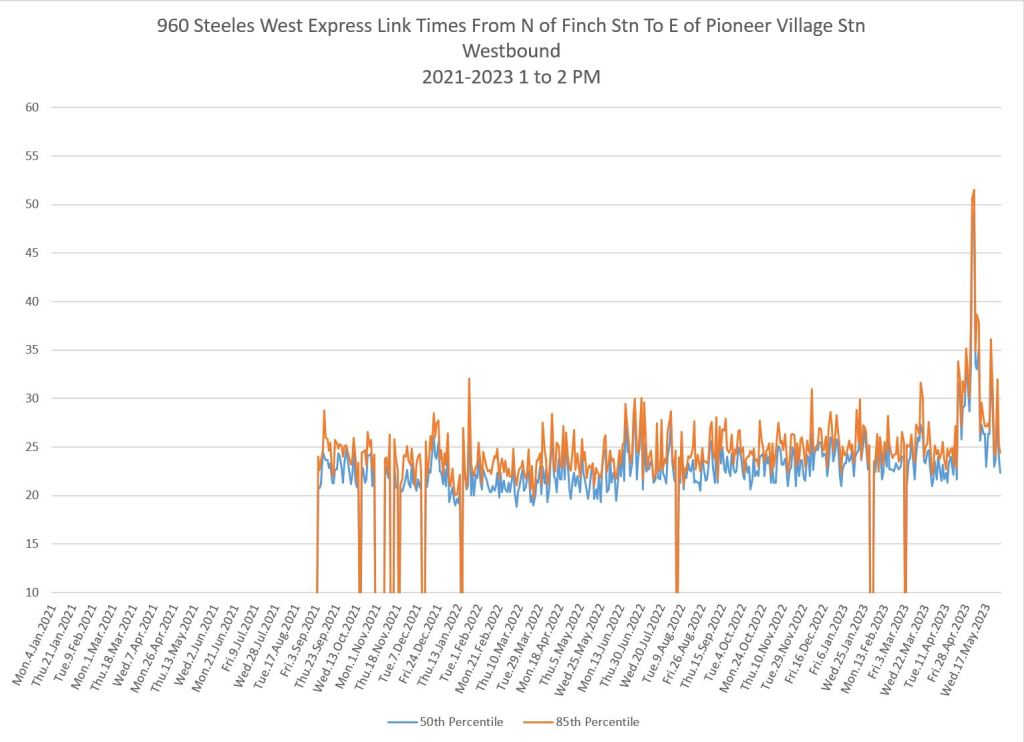
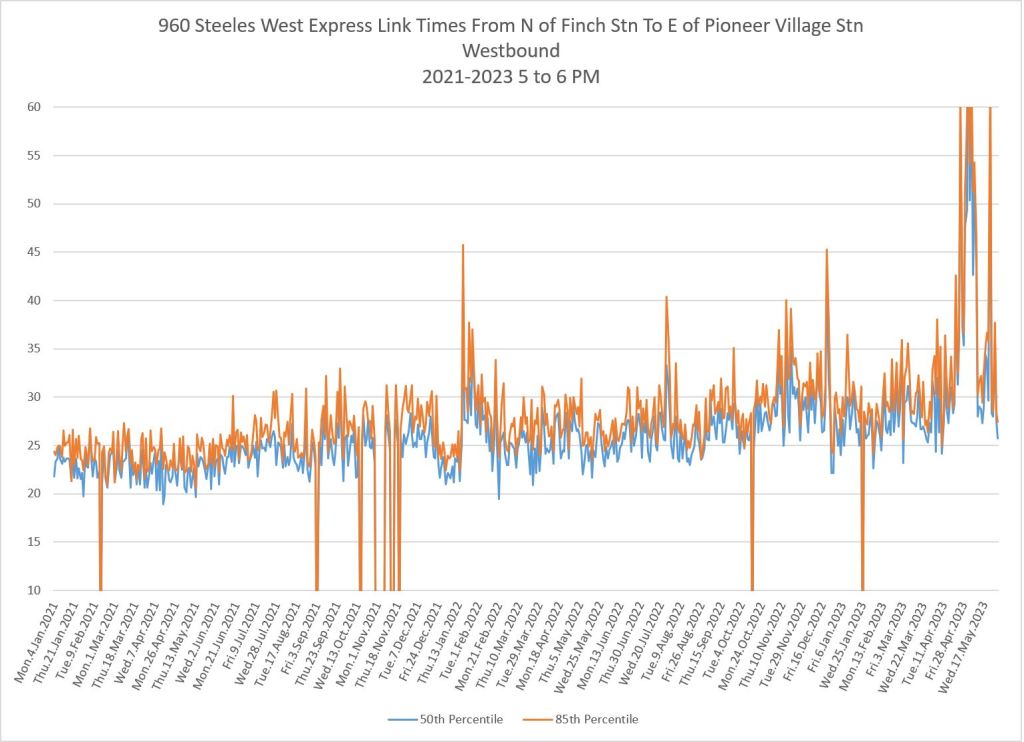
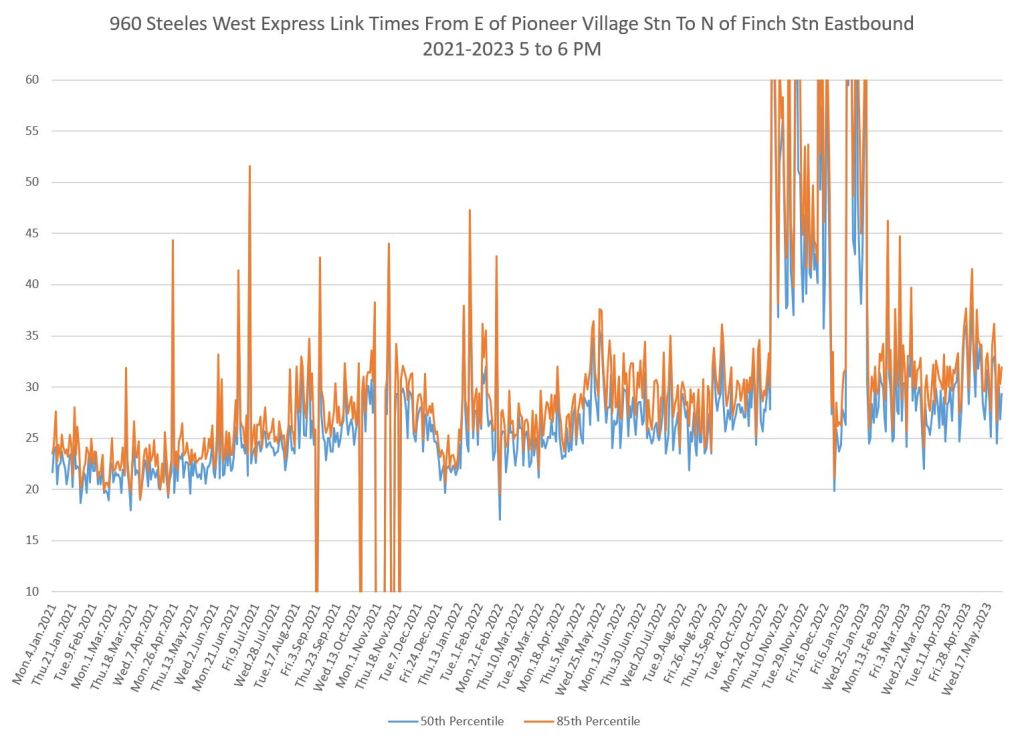
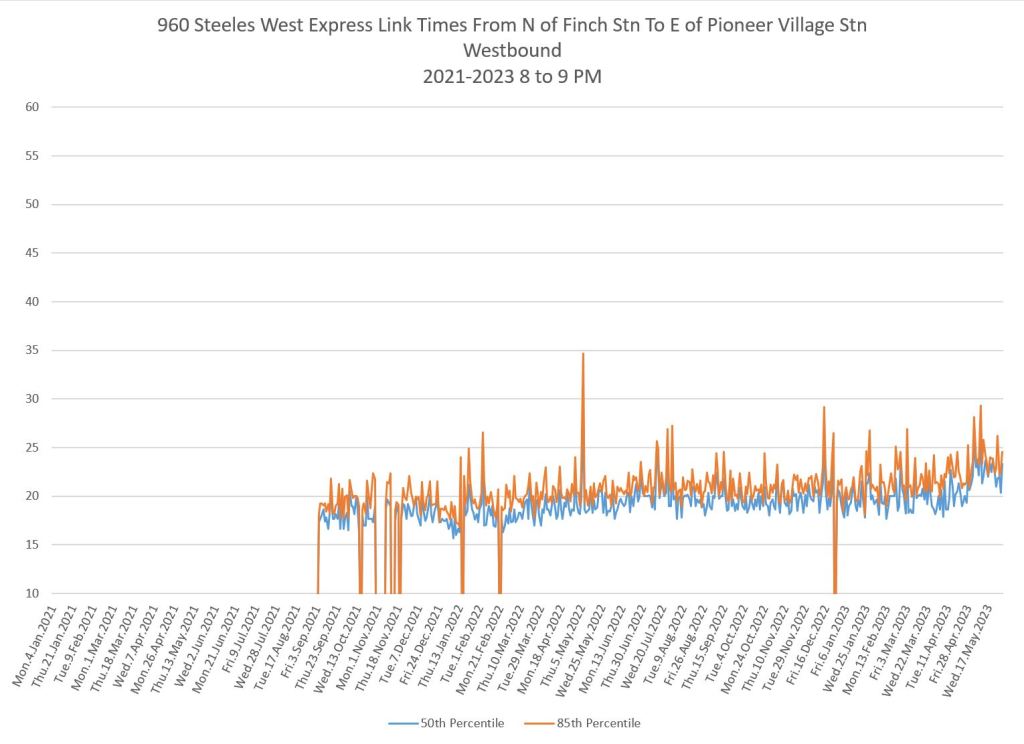
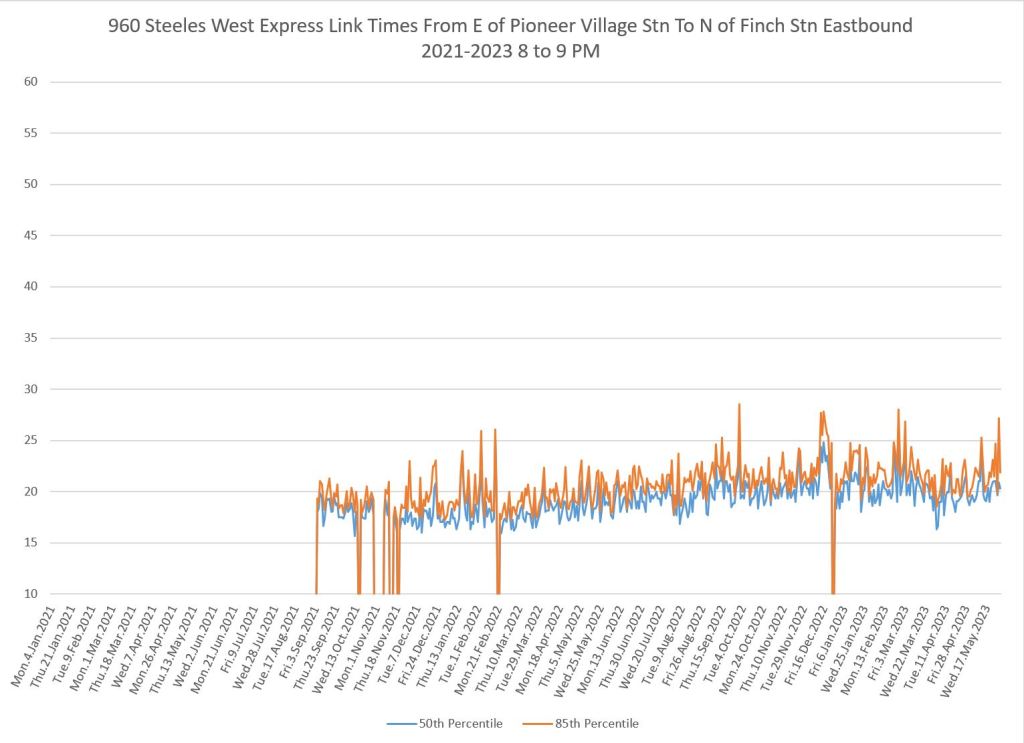
960 Steeles West Express (Eastern Segment)
The express service shows the same pattern as the local service in recent months. Note that I have no pre-pandemic data for the express service. The 960 was suspended until January 2021, and that is where the charts below begin. Off peak service was restored in September 2021.
60/960 Steeles Express vs Local Travel Times (Eastern Segment)
During many periods when both local and express buses operate over this segment, the difference in their median travel times is under five minutes. Both were affected by the congestion eastbound near Dufferin in the PM peak from October 2022 through January 2023.
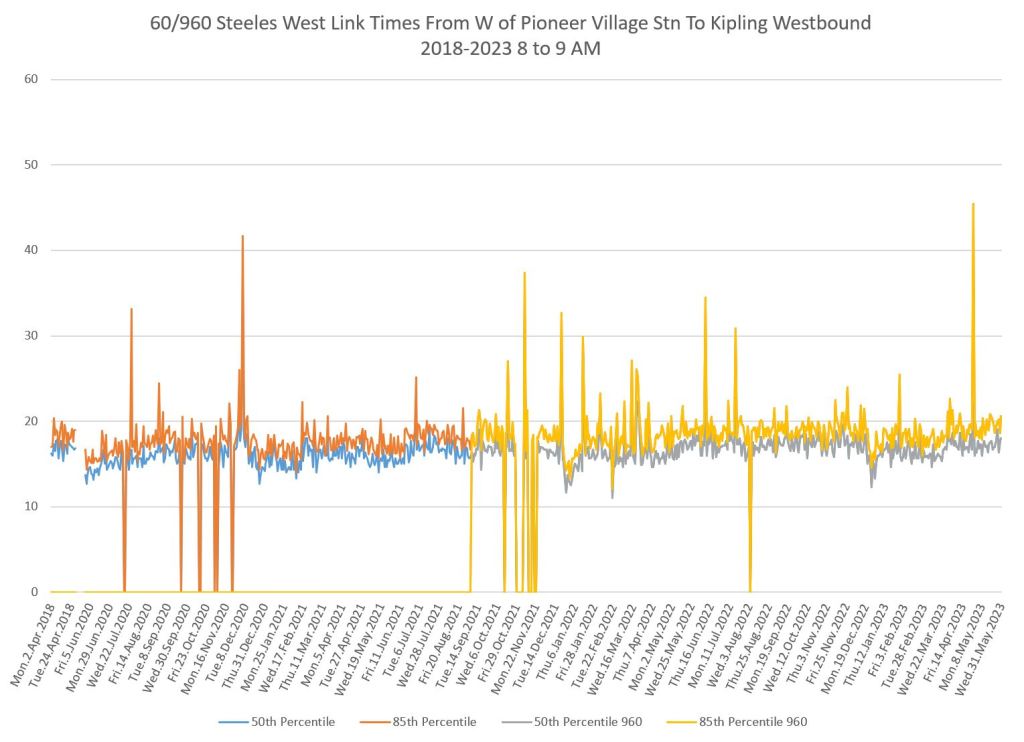
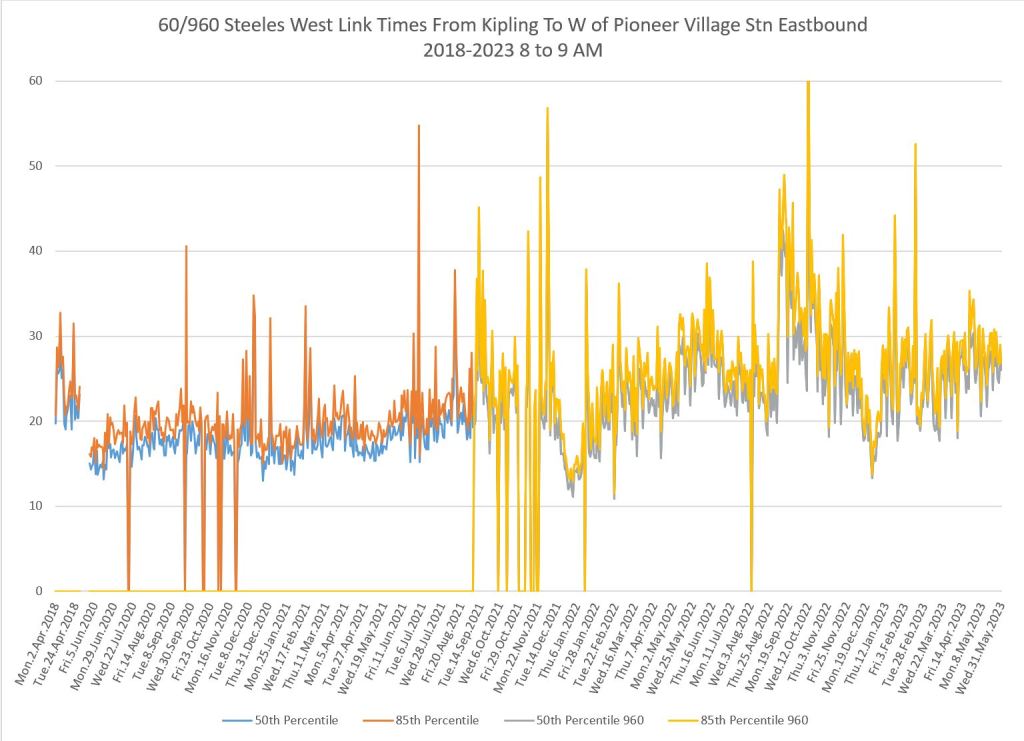
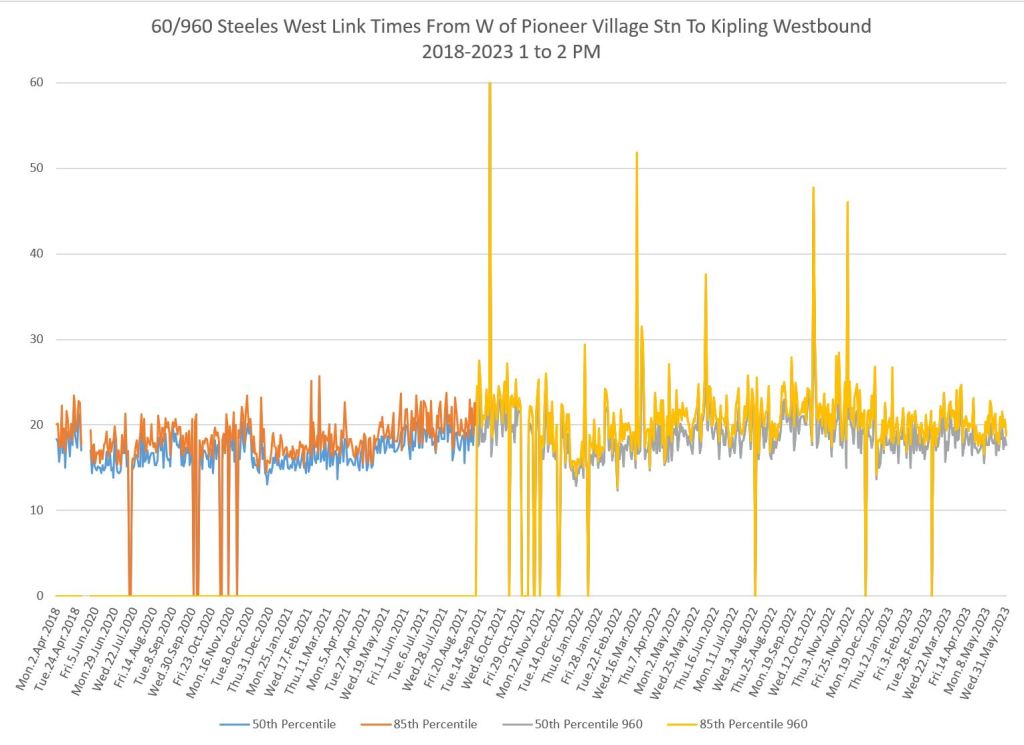
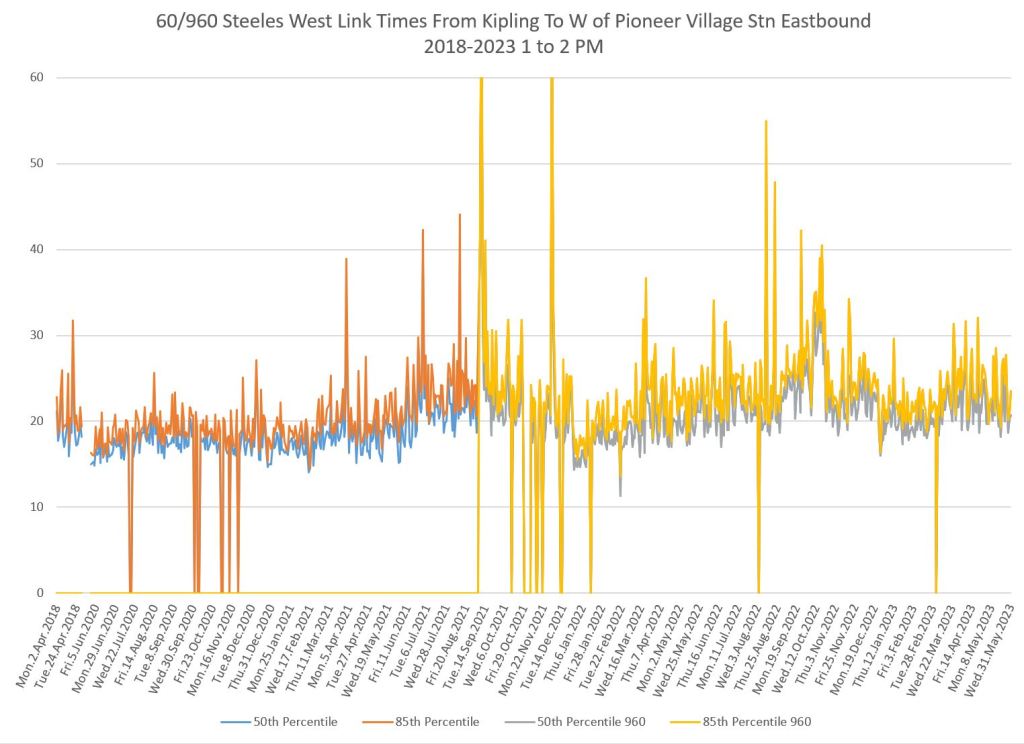
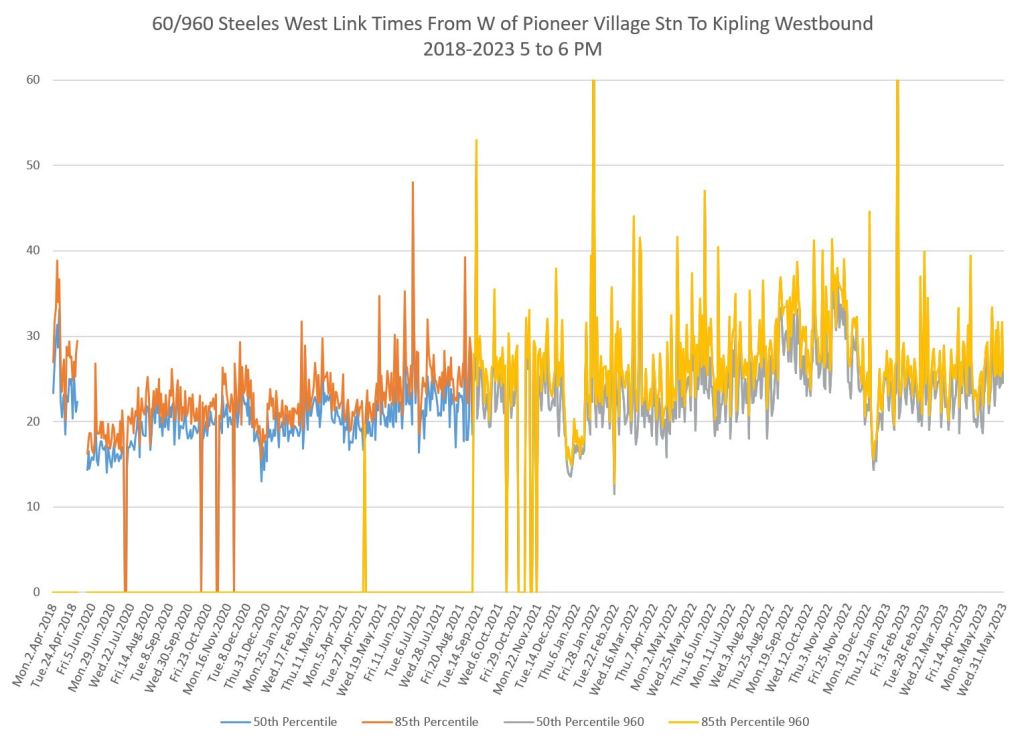
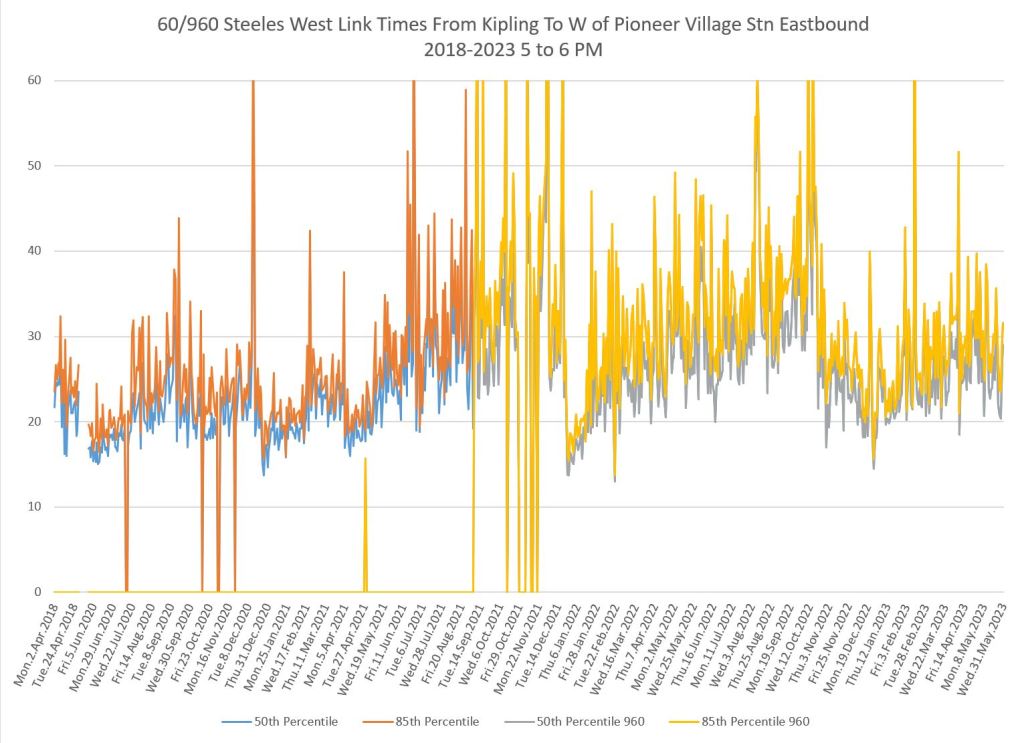
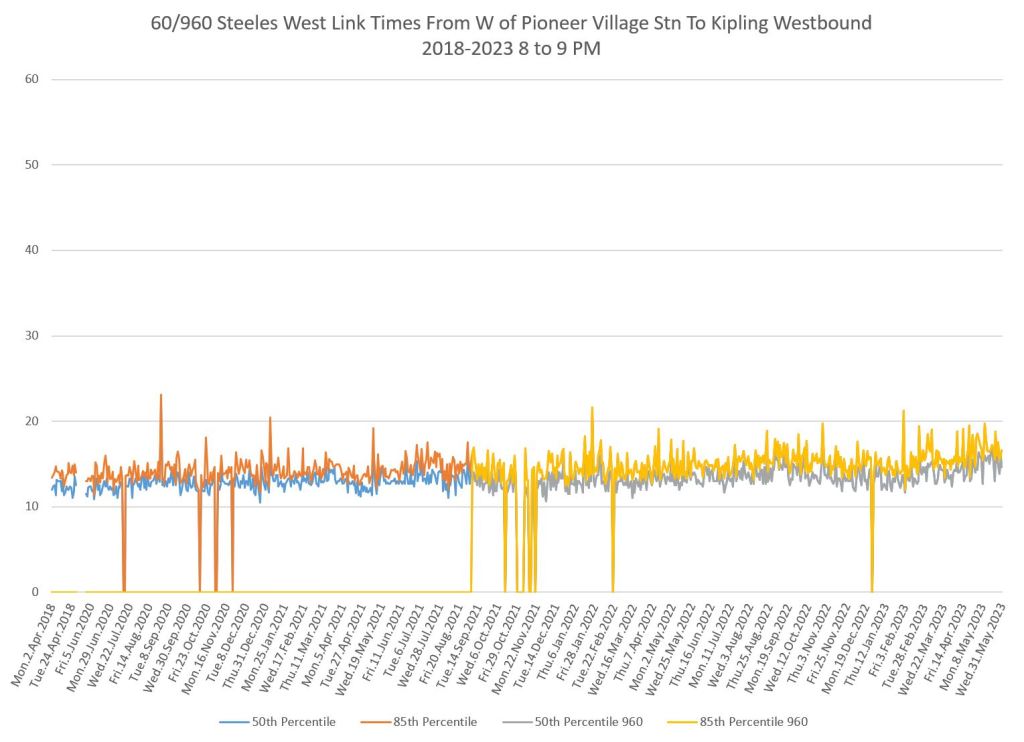
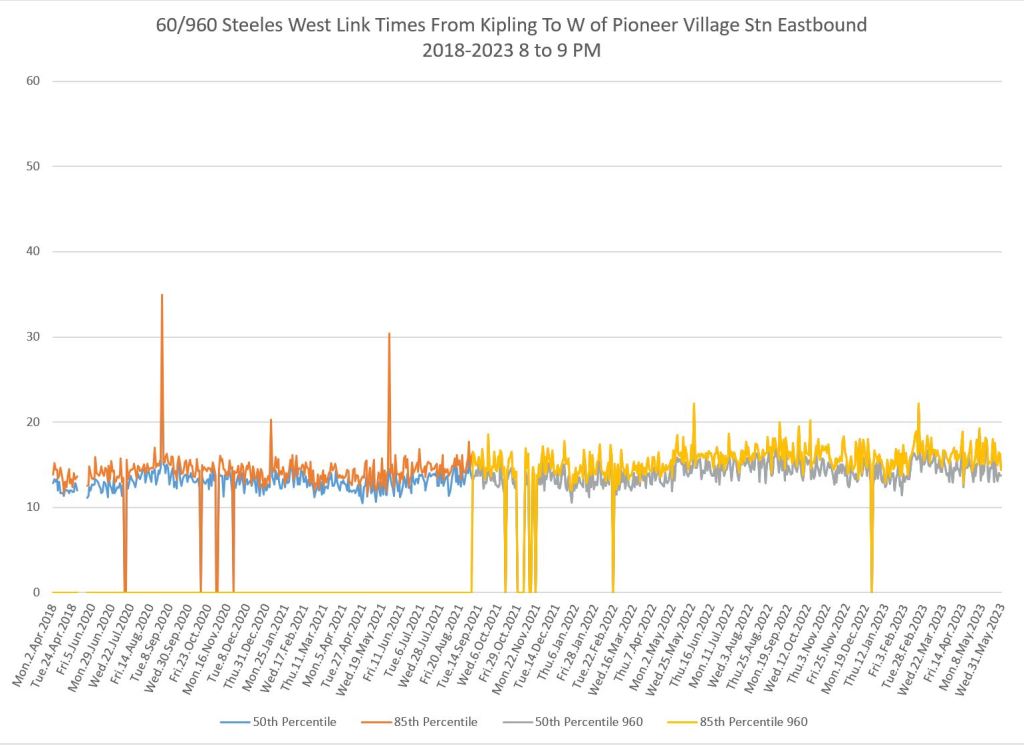
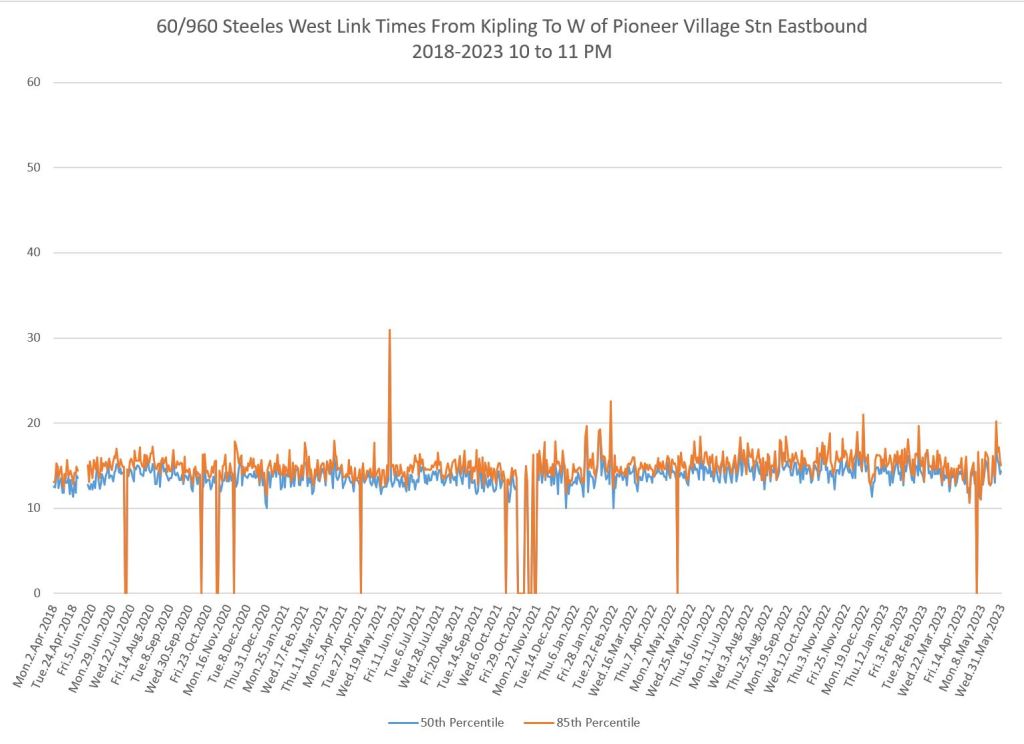
60/960 Steeles West (Western Segment)
The western segment of the Steeles routes runs from west of Pioneer Village Station to Kipling. Note that service here is provided during many periods by the 960 “express” branch to provide a transfer-free trip for riders travelling between the eastern and western halves of the route. At other times, the 60 local service covers the entire route rather than ending at Pioneer Village Station westbound.
Quite visible in these charts is that there was only a small drop in travel times early in the pandemic, and that during some periods, travel times are now well above pre-pandemic levels. Moreover, the values have greater variation resulting in less reliable service.
It is ironic that congestion is a greater problem on the west end of the route where no transit priority is planned compared with the east end of the route.

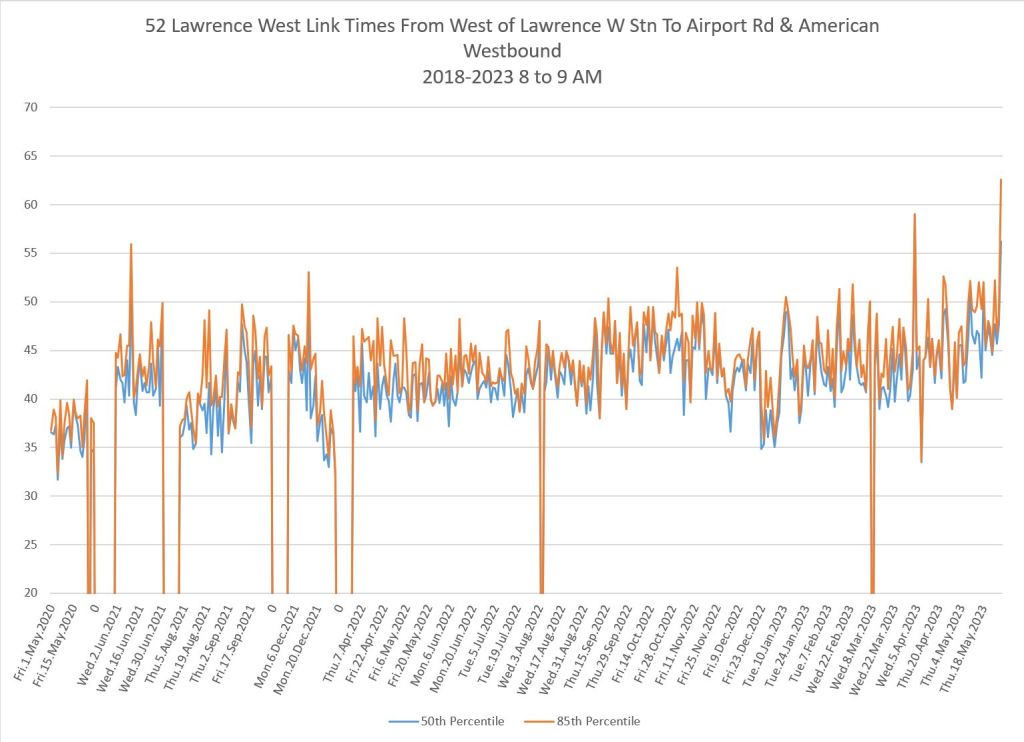
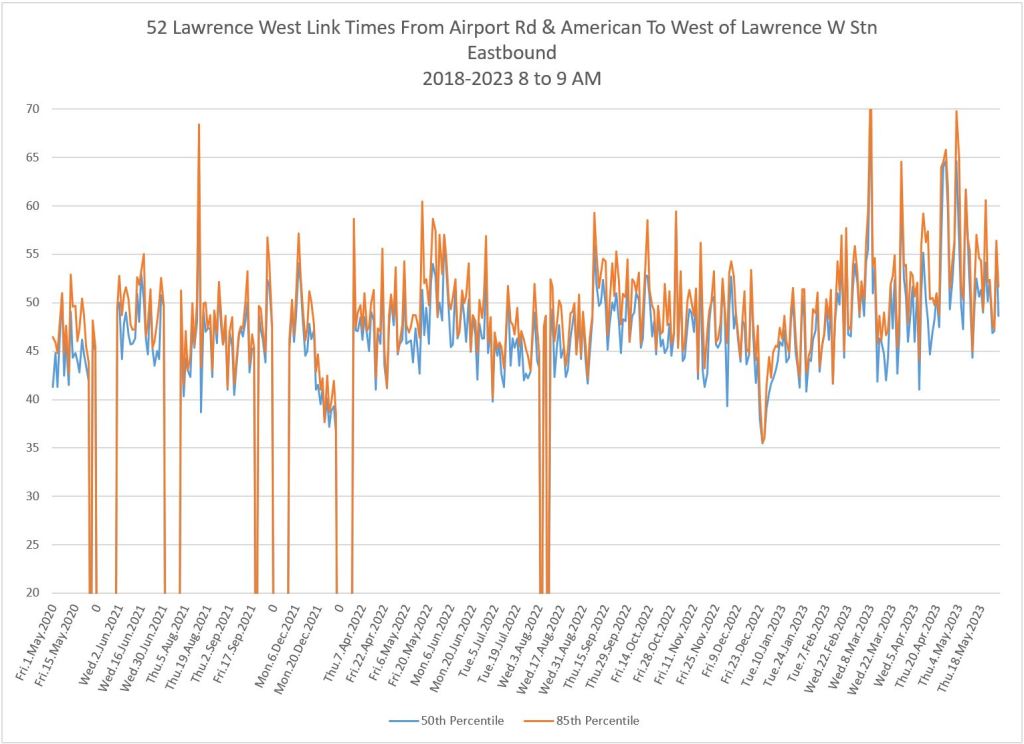
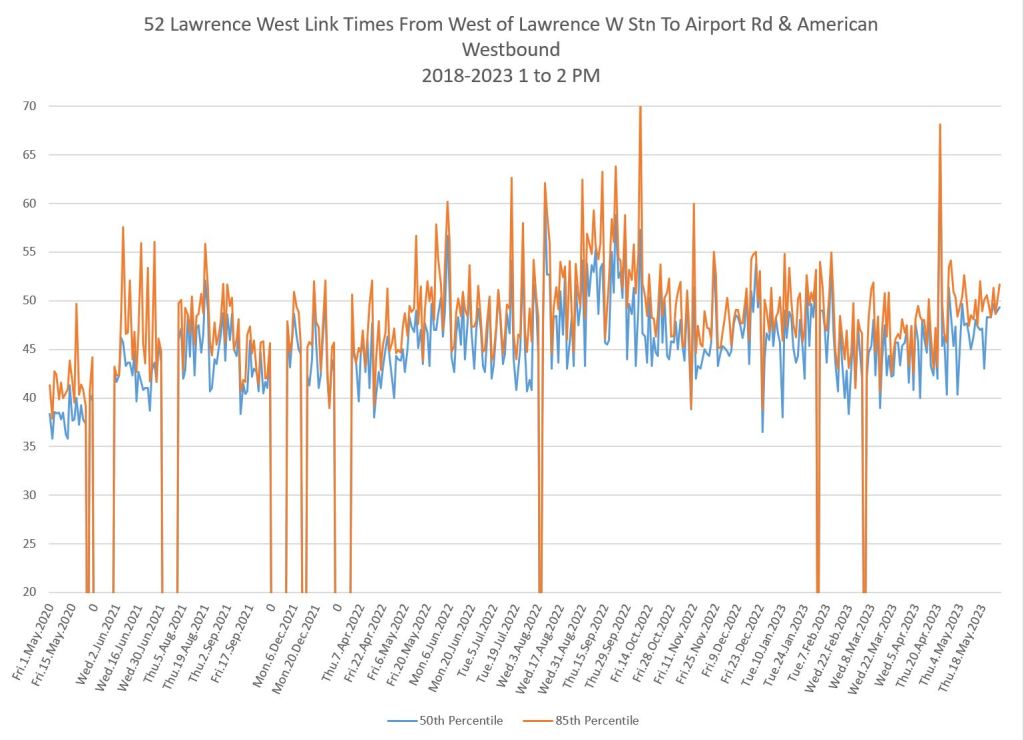
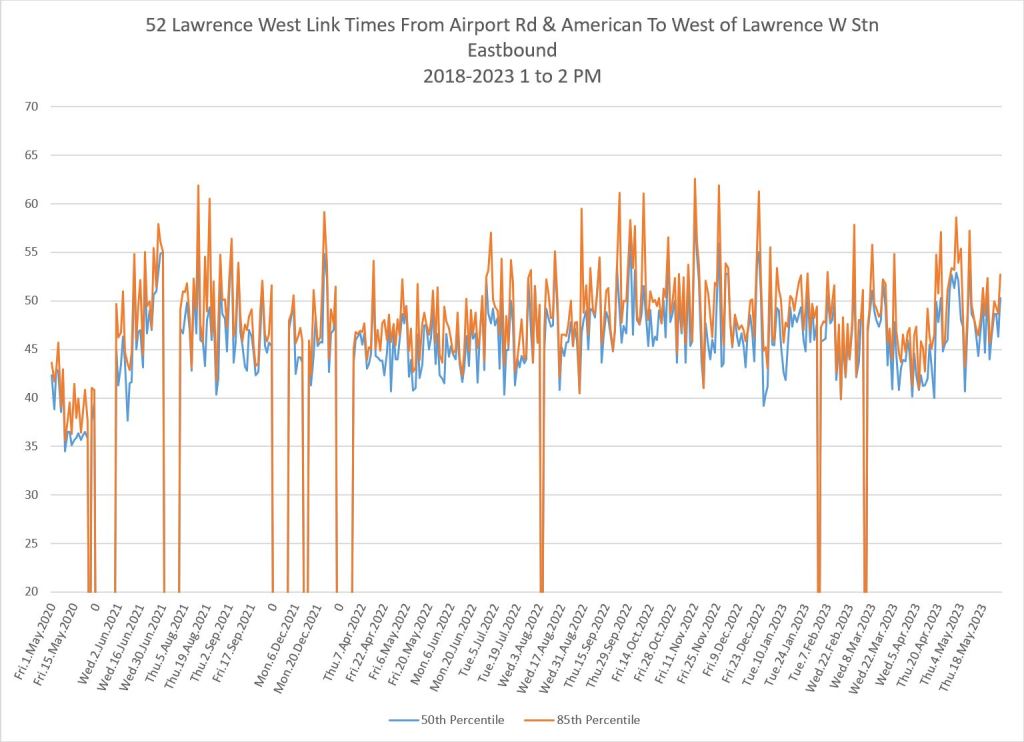
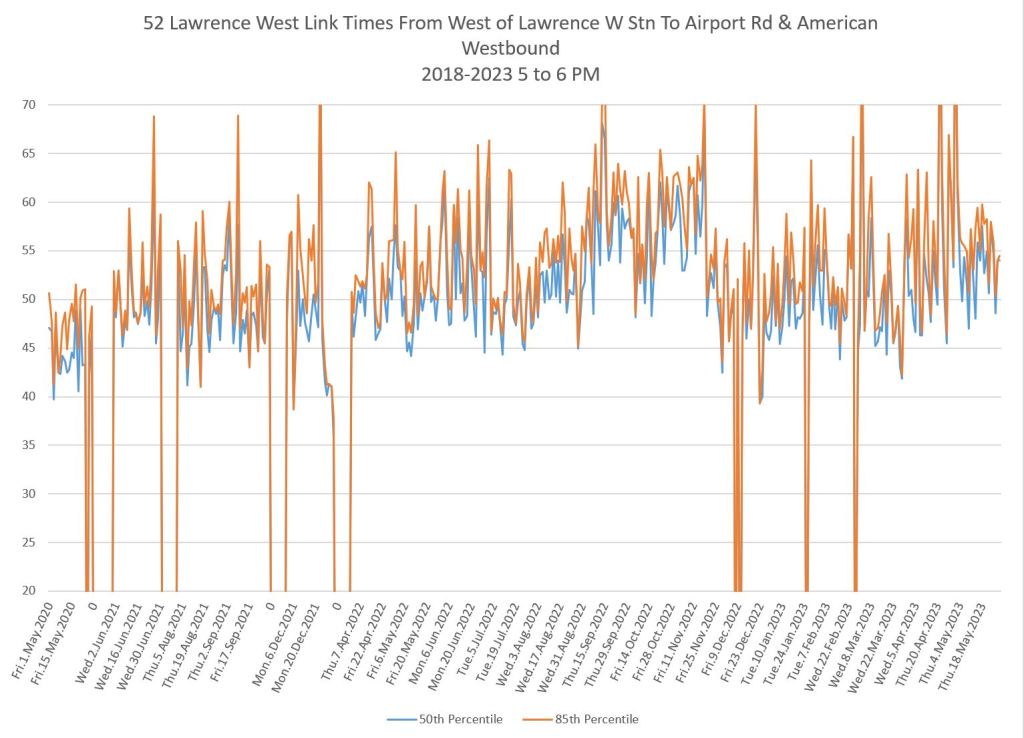
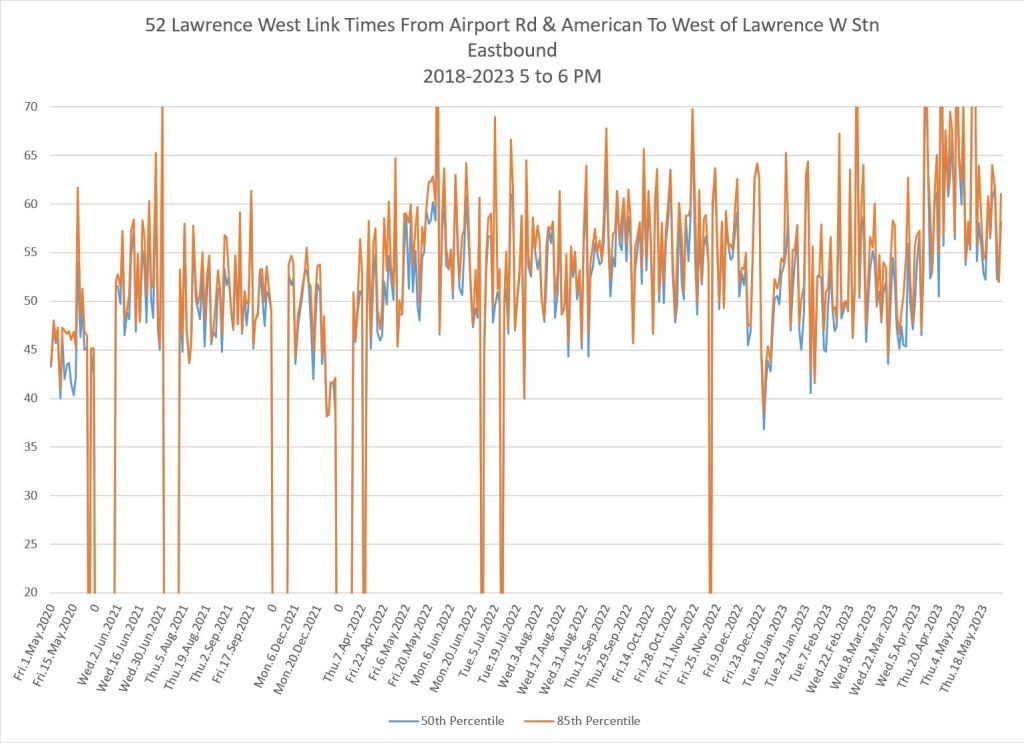
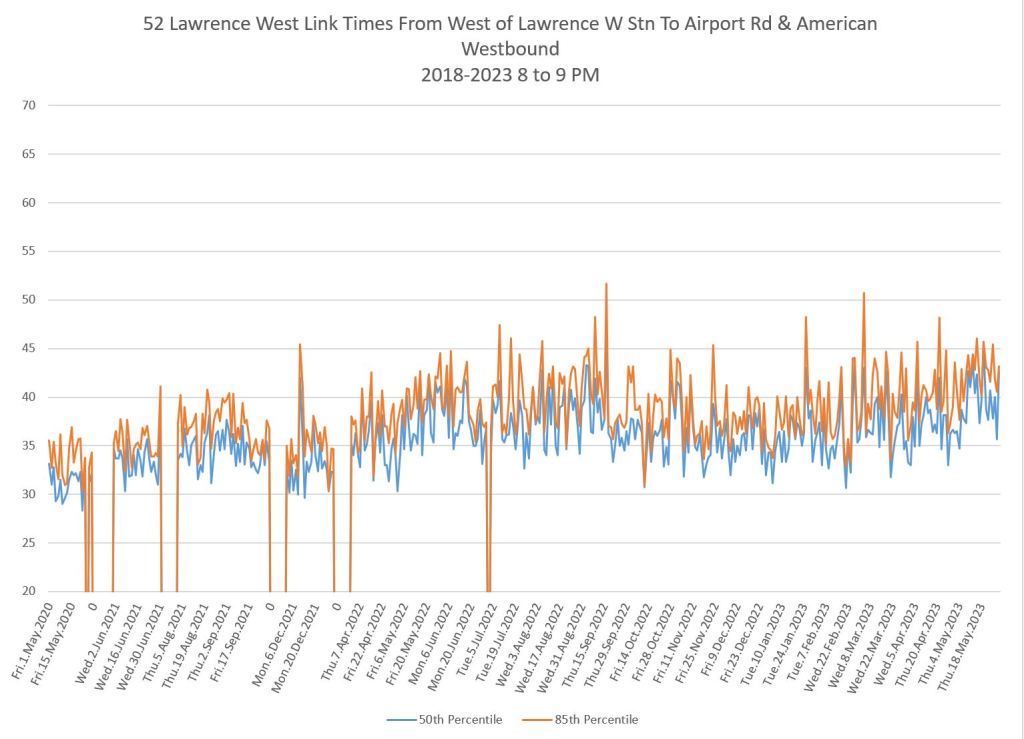
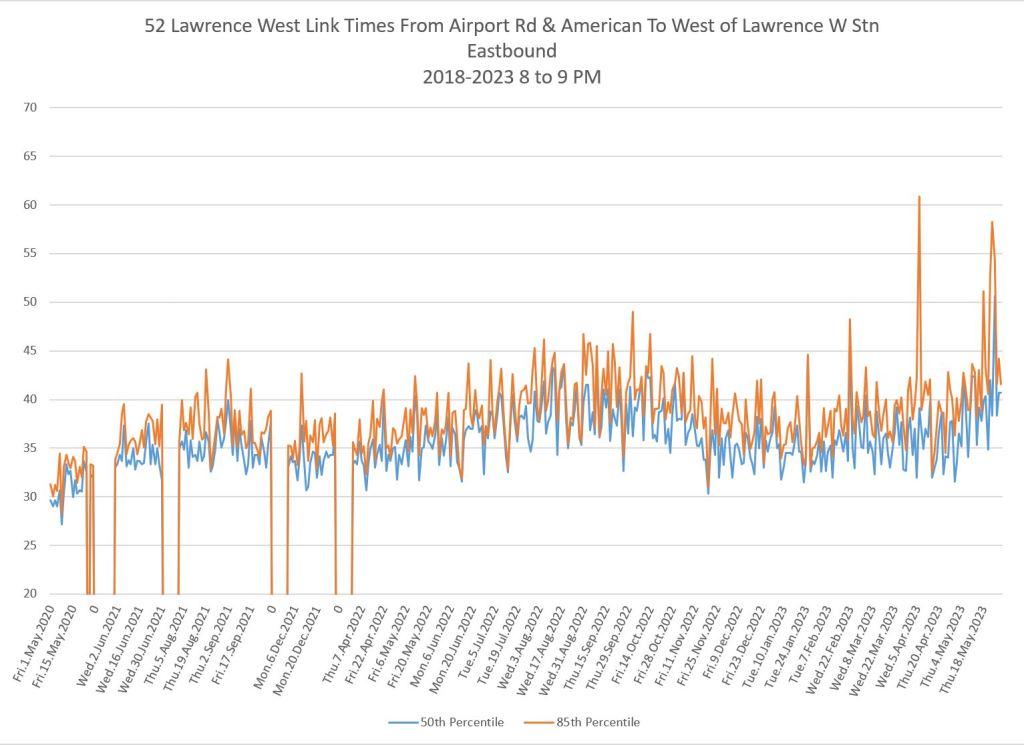
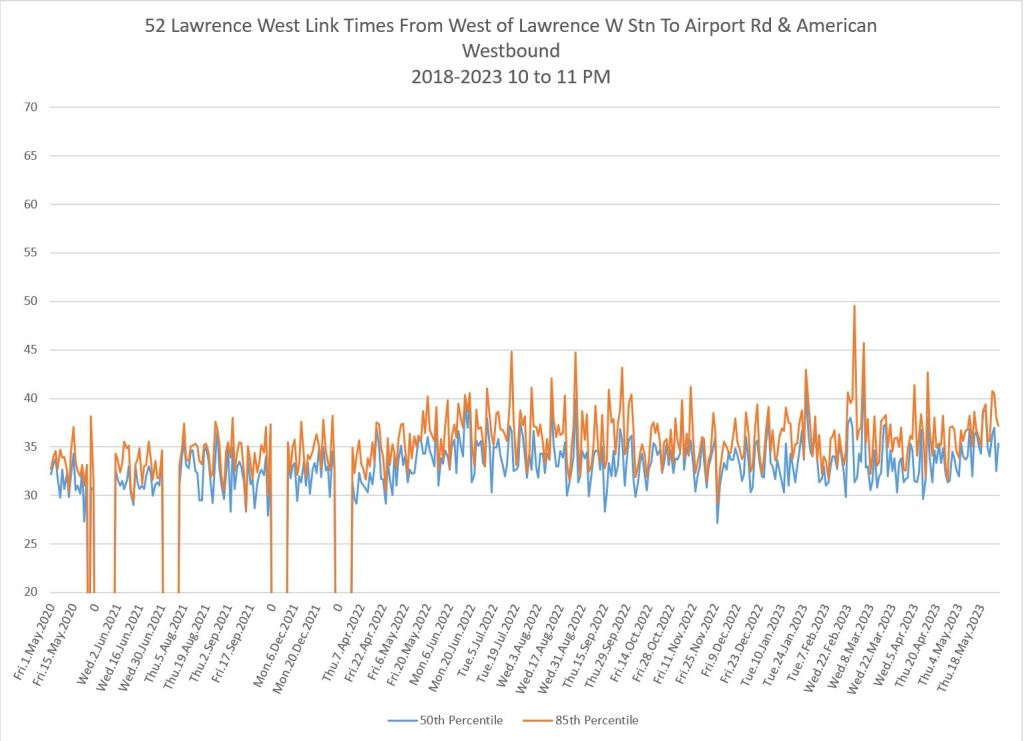
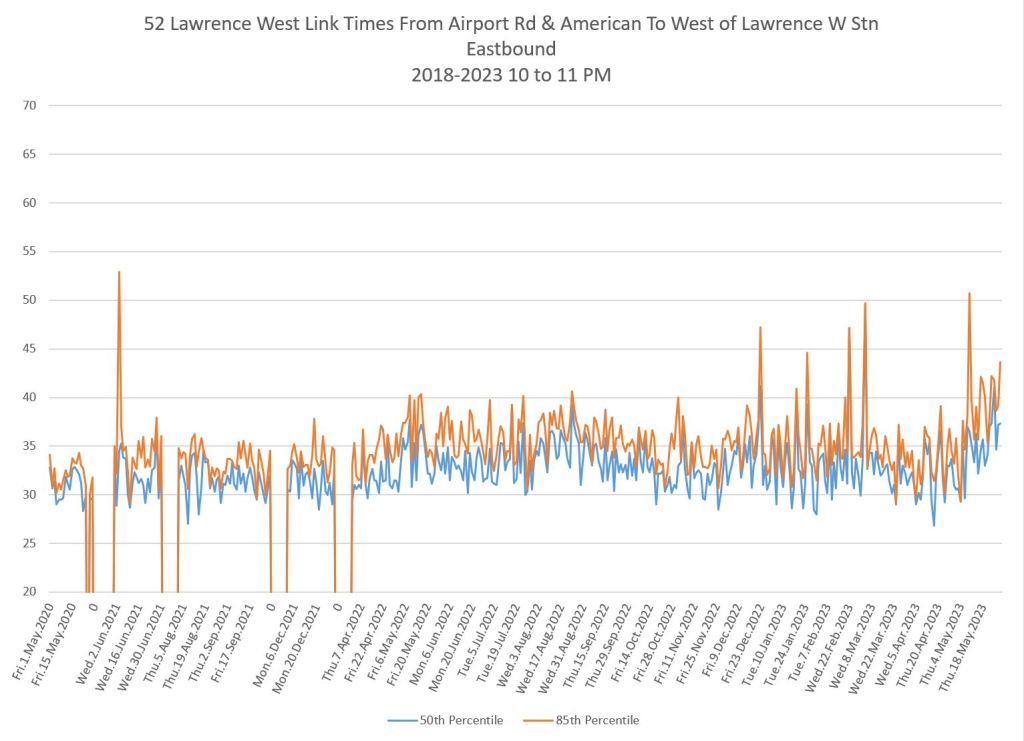
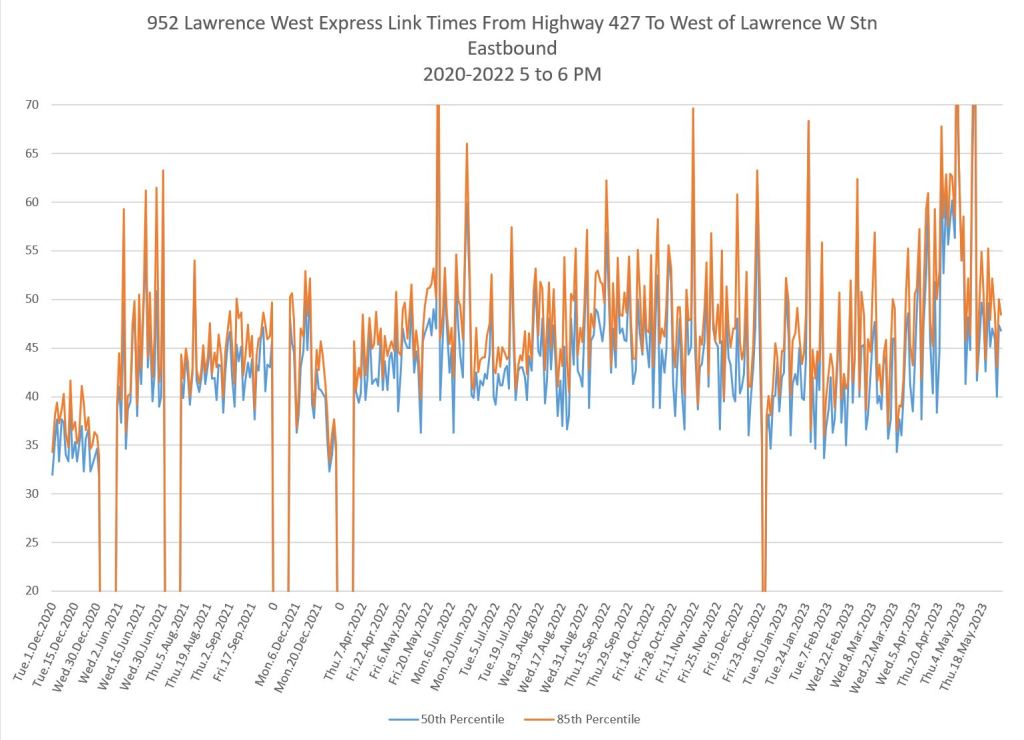
52 Lawrence West
Lawrence West is not a proposed route for RapidTO red lanes, but I have been tracking it on and off as a major route comparatively unaffected by construction (such as Eglinton West or Finch West). I have included the data here to show the pattern over the past three years.
Travel times across the route have grown since 2020 notably in the midday and PM peak. There is also considerable day-to-day variation in travel times shown by the sawtooth pattern in some charts. The “lows” do not correspond to any specific day of the week and so the pattern is not, for example, the result of different, but predictable conditions on certain days.
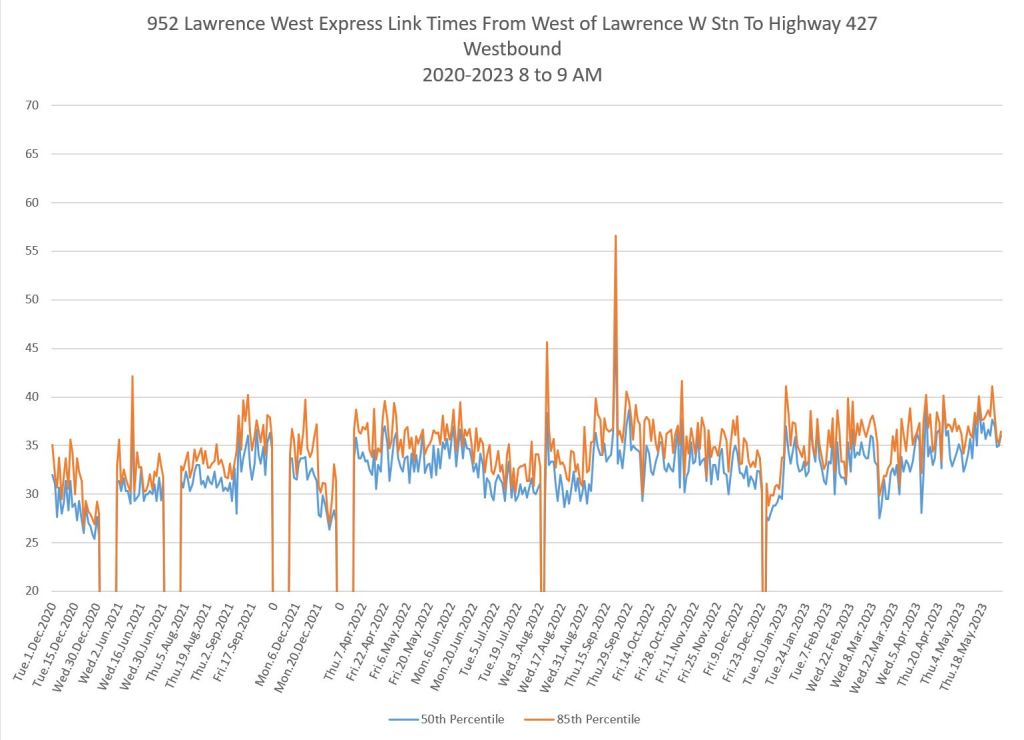
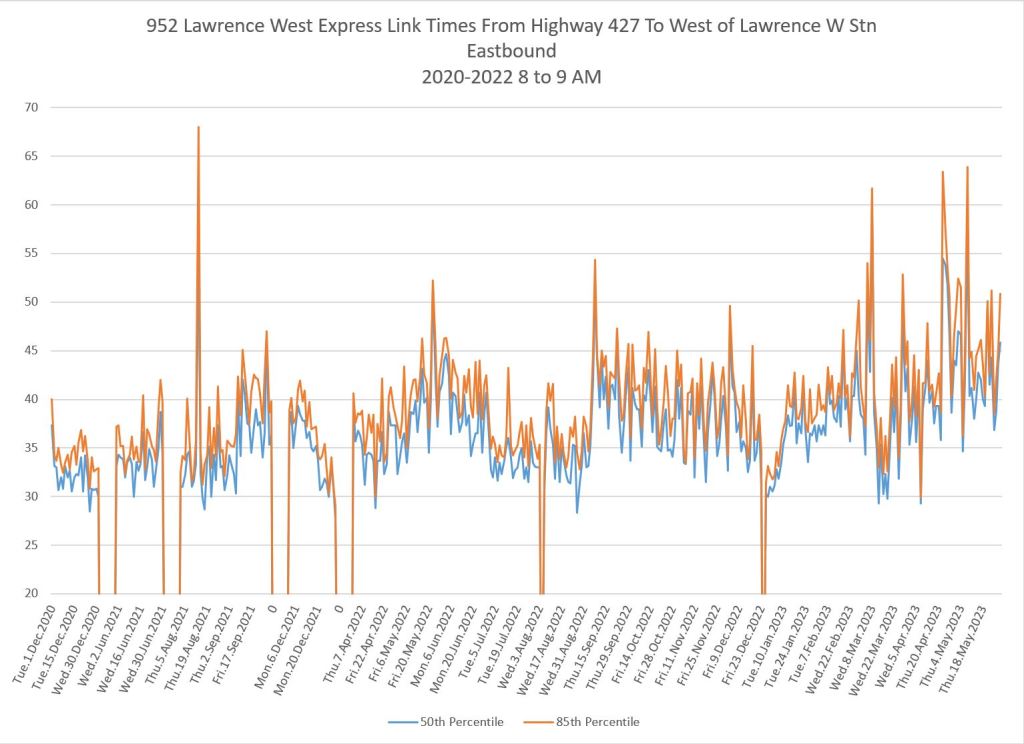
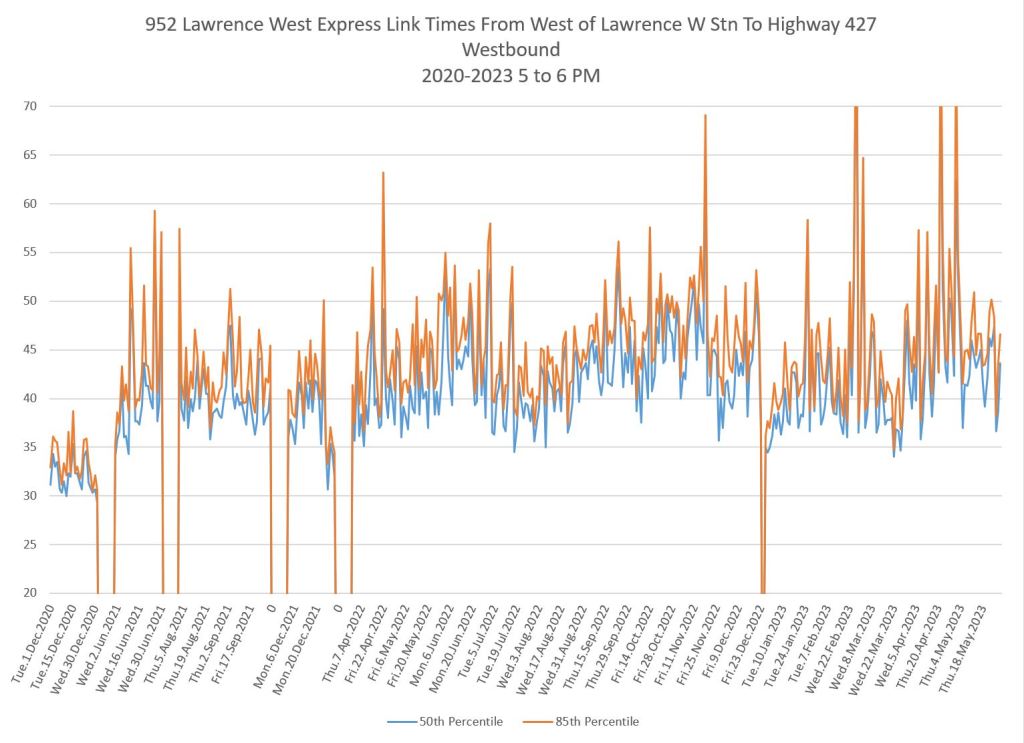
952 Lawrence West Express
As with the local service, travel times have grown over past years.
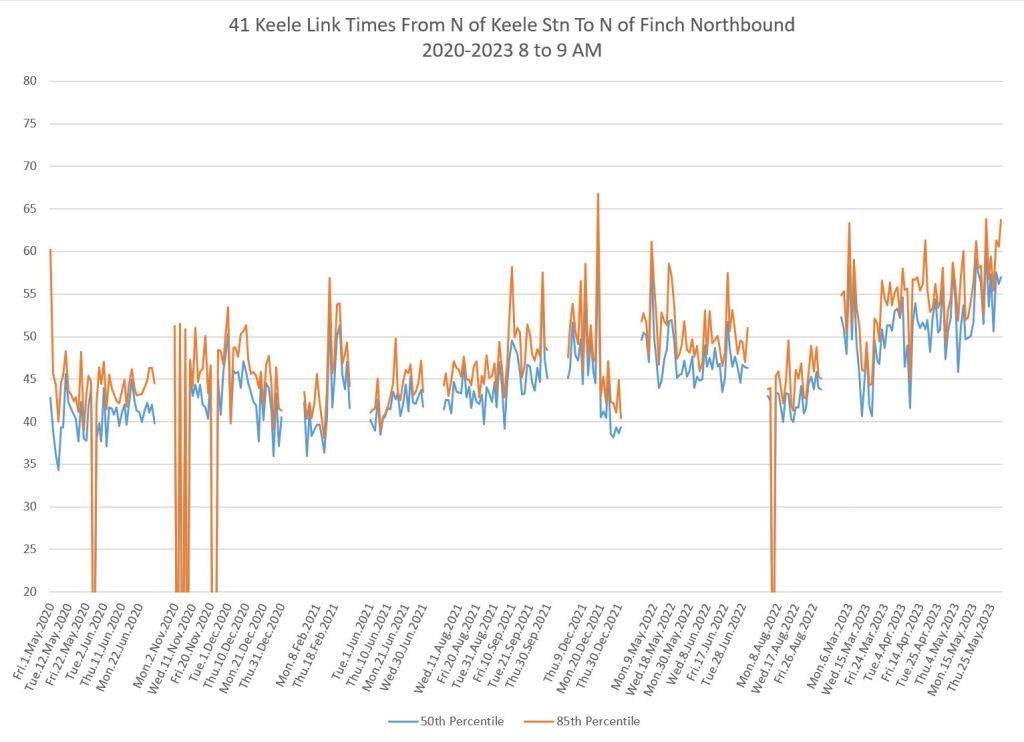
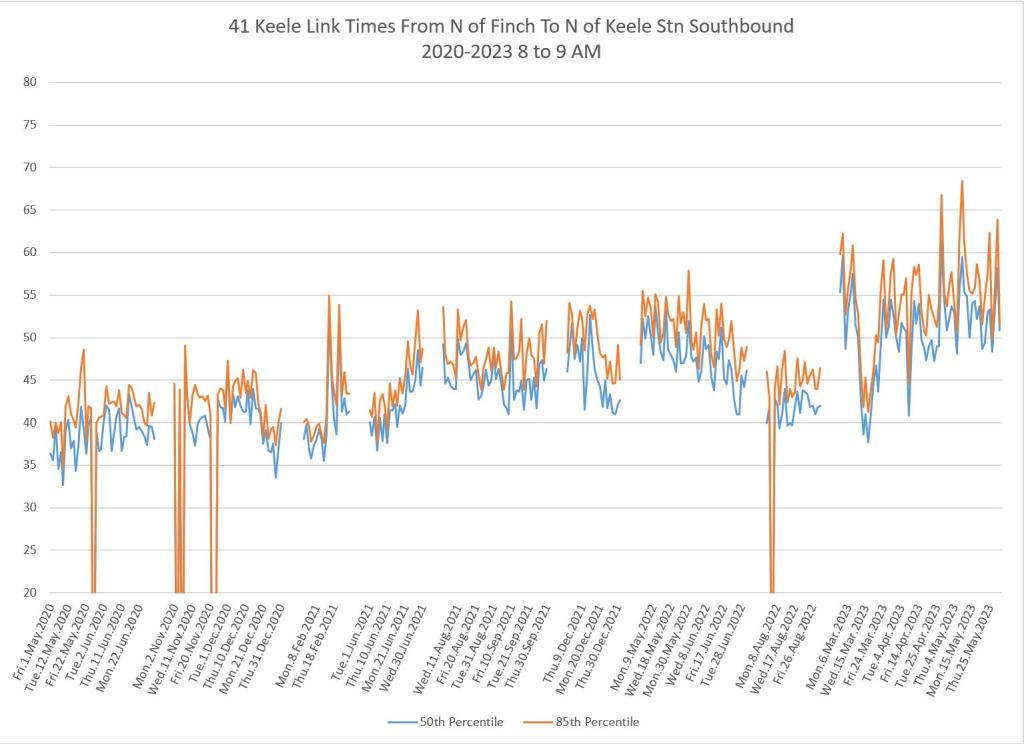
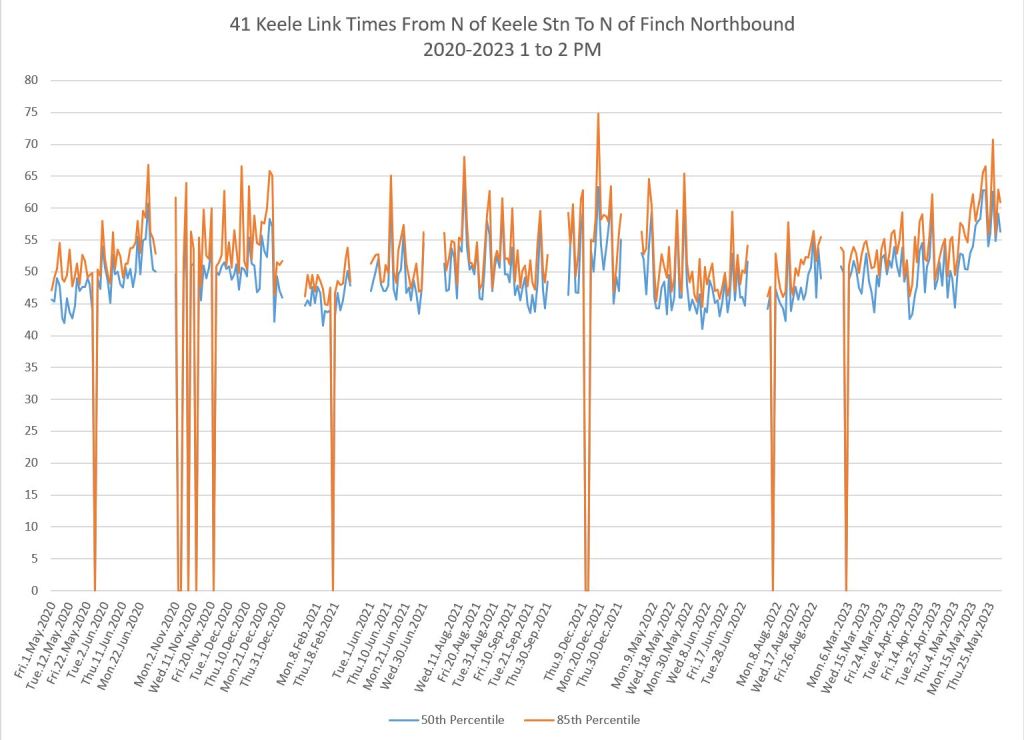
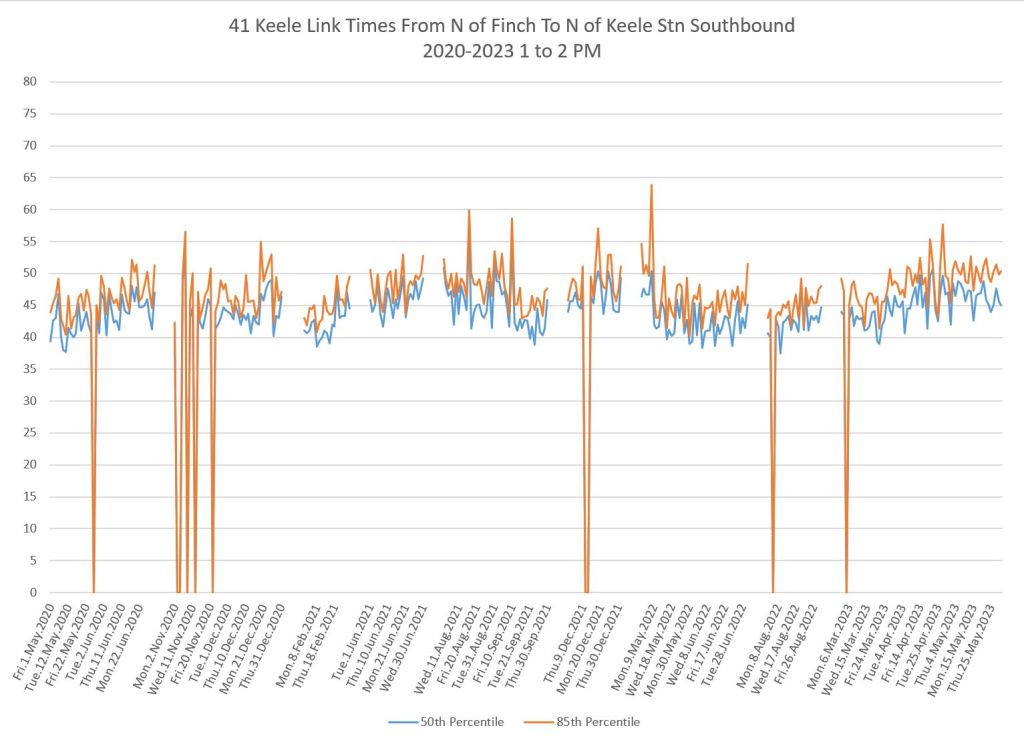
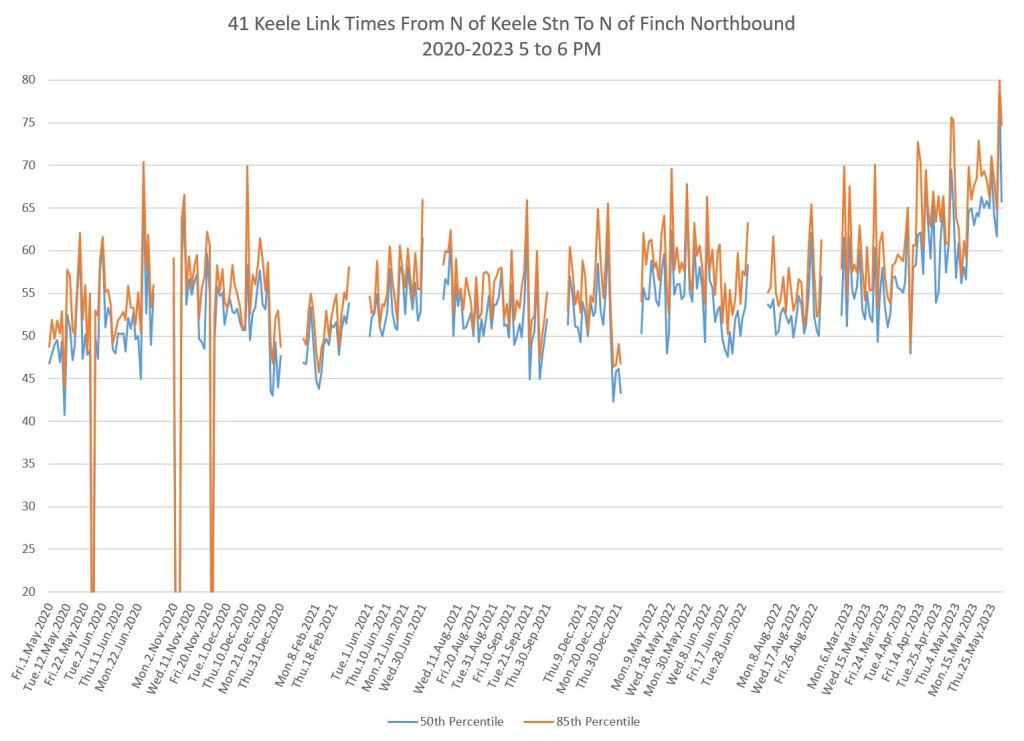
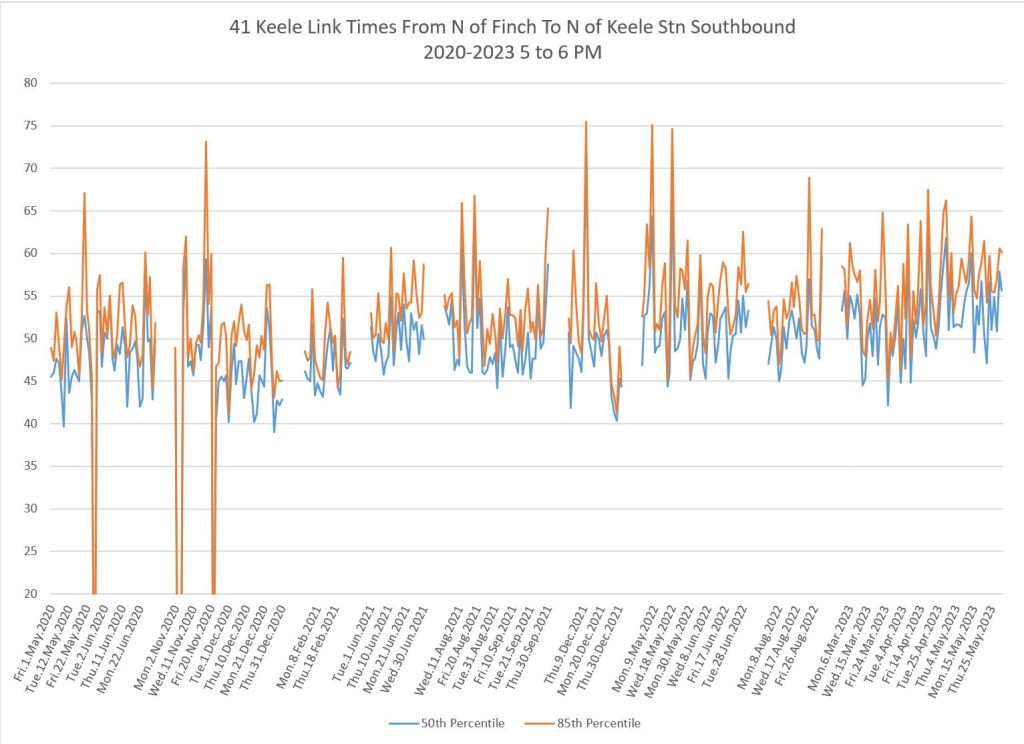
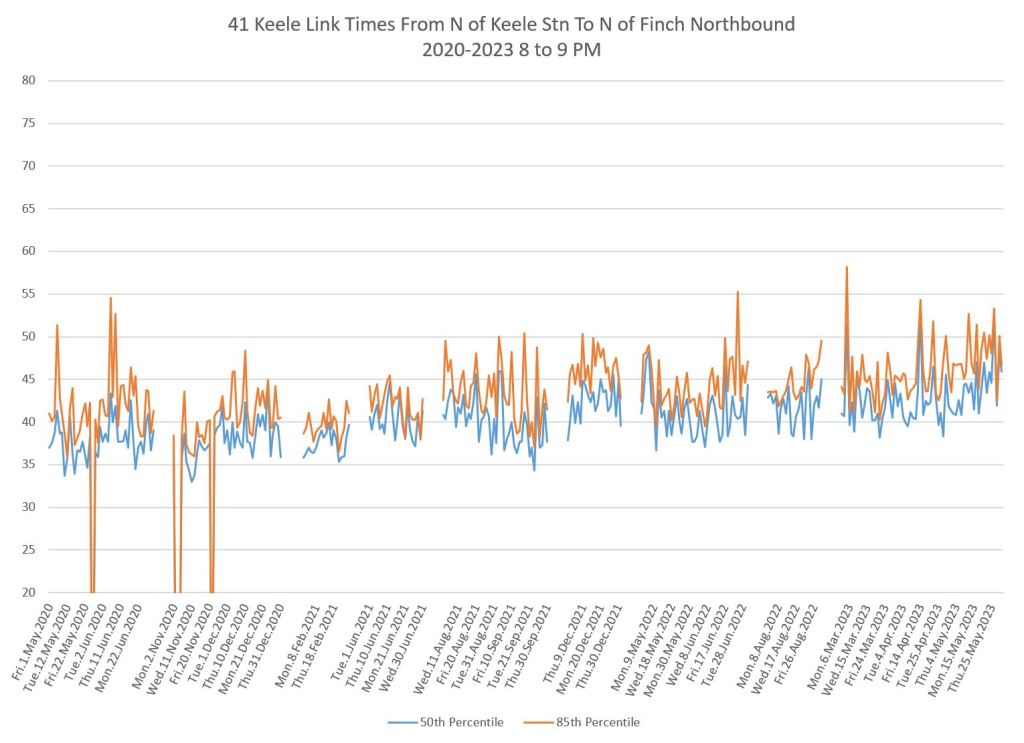
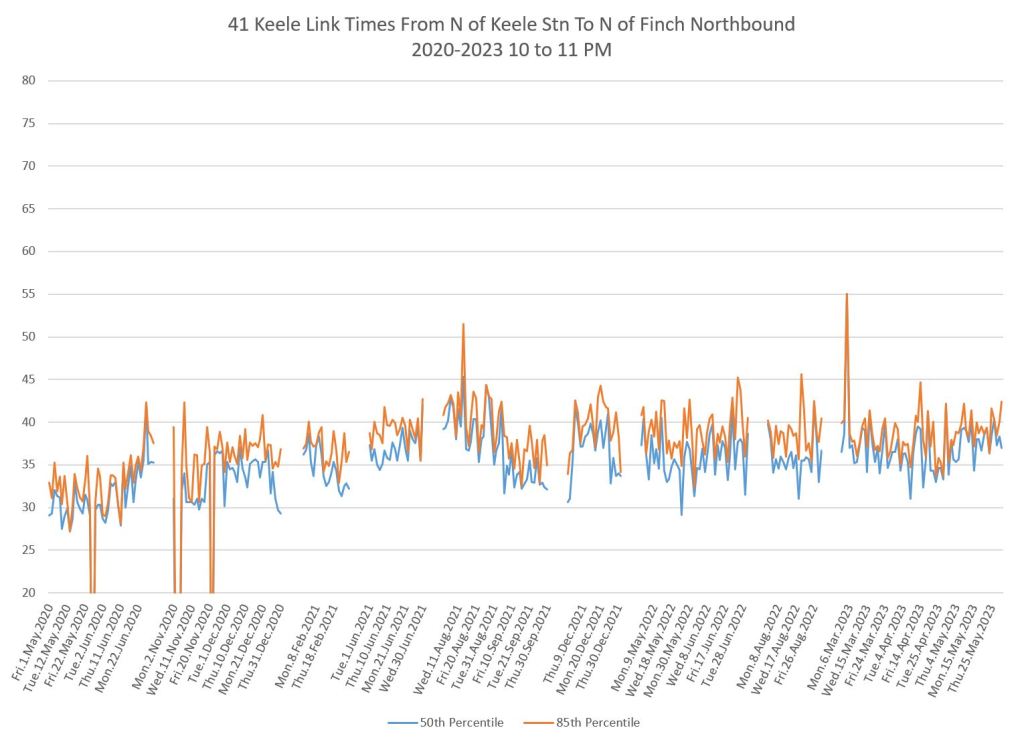
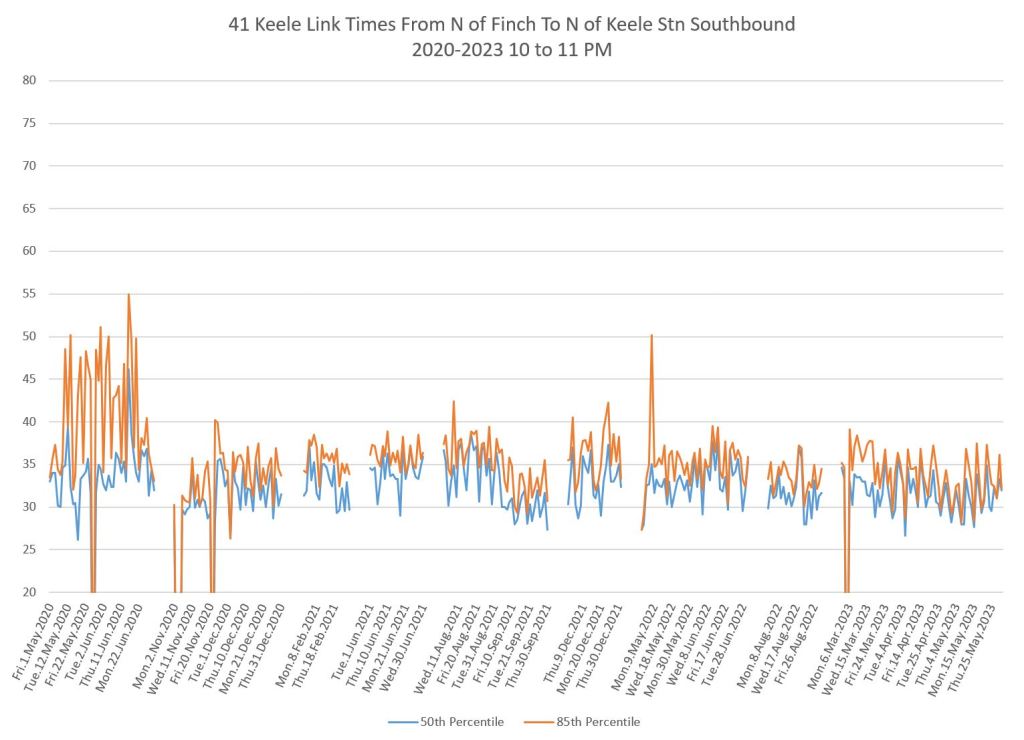
41 Keele
Keele is another corridor I have been tracking on and off in recent years. There is a clear growth in travel times over the route, especially in peak periods.


First Thank you for tireless analysis of the TTC.
Steve: You’re very welcome.
A question: could AI controlled traffic lights in conjunction with real time GPS tracking of individual transit vehicles help speed up service on these routes?
Steve: In theory, but a lot depends on what you “teach” the AI to prioritize. Many transit priority schemes give preference to vehicles that are “late”, but the schedule is almost meaningless on the TTC. When vehicles divert, there isn’t even a schedule for reference and yet these are specific times when vehicles need all of the priority they can get. There are many locations where vehicles make turns, again typically for diversions and short turns, where there is no priority signalling at all. The “intelligence” required is not of the IT variety, but to decide on engineering and political priorities to use tools that are already available.
LikeLiked by 1 person
Hi Steve, Do you see reliability and wait times differing by day of the week. I use 29 Dufferin and see that crowding and bunching is much worse on Wednesday and Thursday, and much better on Monday and Friday. Would you suggest we should have different time tables and service frequency for these buses by day of the week? The whole hybrid situation has resulted in crowding on 2-3 days of the week, mostly Tuesday, Wednesday, Thursday.
Steve: These articles concentrate on travel times, but I will turn soon to reliability issues and will definitely be looking for day-of-the-week effects. My recent articles about how to chart these data was a prelude so that I could settle on a workable scheme before I’m half way through the project and people are screaming about the format 😉
LikeLike
Do you have the memo for the June 18 board period service changes?
Steve: Not yet.
LikeLike
I’m just wondering how much of the congestion along the western segment of Steeles is due to traffic avoiding Finch while the LRT construction is on-going, I’m hoping that it does improve when construction is done, nearly every afternoon it’s just a crawl from where I get on at Signet Drive to Jane Street.
LikeLike