
Beginning March 26, 2023, the 905 Eglinton East Express bus will run less frequently due to a combination of the new TTC Service Standards and the route’s conversion from standard sized to articulated buses.
The vehicle change was not included in the information in the TTC’s overview report discussed at the February 28 Board Meeting, and service comparisons published by me and others were based on a reasonable assumption of equal vehicle capacity.
New Service Standards
The new standards were included in the 2023 Operating Budget [p. 26]:
Route adjustments will be based on ridership demand in the busiest portion of the route, in the busiest direction and hour within each time period of service.
The realigned service proposes to:
1) Resume pre-COVID vehicle crowding standards in peak periods, which were temporarily suspended during the pandemic to provide more physical distancing. (50 customers per bus, 130 customers per streetcar, 1000/1100 customers per train on average during the busiest hour)
2) Increase the pre-COVID vehicle crowding standard at off-peak periods with capacity for each route and time period planned based on the busiest hour for 45 customers per bus, 90 customers per streetcar, and 600-650 customers per train on average.
There is no reference to articulated bus capacities. In the previous service standards, the peak crowding value was 50% higher for artics, but the offpeak value was only 28% higher. The offpeak ratio was lower because the old standard was based on a seated load, and the artics have proportionately more standee space.
In the table below, the “new” values are based on the budget quotation above with the articulated bus values set at 50% higher than those for standard buses.
| Period | Standard Old | Standard New | Artic Old | Artic New |
| Peak | 51 | 50 | 77 | 75 |
| Offpeak | 36 | 45 | 46 | 68 |
The TTC cites 50/bus peak and 45/bus offpeak in the quote above. Therefore the new artic standards would be 75/bus peak and 68/bus offpeak using a 50% capacity increase over standard buses.
The old and new hourly route capacities below are based on vehicle types and planned headways. Note that offpeak capacities generally go up because of the substantial increase in standees. Reductions in peak capacity are very small and could be due to assumptions I have made about the TTC’s vehicle capacity standards.
| Period | Old Hdwy | Old Bus/Hr | Old Cap | New Hdwy | New Bus/Hr | New Cap |
| AM Peak | 9’15” | 6.5 | 293 | 16’00” | 3.75 | 281 |
| Midday | 7’30” | 8.0 | 368 | 10’30” | 5.7 | 388 |
| PM Peak | 8’00” | 7.5 | 338 | 14’00” | 4.3 | 322 |
| Early Eve | 11’00” | 5.5 | 198 | 14’00” | 4.3 | 292 |
| Sat Morning | 10’00” | 6.0 | 216 | 14’00” | 4.3 | 292 |
| Sat Afternoon | 10’00” | 6.0 | 216 | 17’00” | 3.5 | 238 |
| Sun Morning | 12’00” | 5.0 | 180 | 17’30” | 3.4 | 231 |
| Sun Afternoon | 10’00” | 6.0 | 216 | 15’30” | 3.9 | 265 |
Service Reliability
However, the problem with 905 Eglinton East is not confined to the capacity, but to the reliability of the service. We hear a lot about the wonders of Red Lanes for service, but it does not take long to find examples of erratic spacing between buses.
The following sections review January and February 2023 headways in detail looking at service departing eastbound from Kennedy Station and southbound from Ellesmere. The vital point here is that headway reliability is already not good on this route (as on many others in the network), and past experience shows that when scheduled service is reduced problems like this only get worse. Laissez-faire approaches to service management might work tolerably (at least in management’s eyes) for frequent service, but they fail when service is less frequent.
Service standards accept a six minute window (from -1 to +5 minutes) of “on time” performance relative to the schedule. Combined with the new headways proposed above, this will allow gaps of 20 minutes and more to be counted as “on time”. This is a severe penalty for riders, and can undo much of the benefit of “express” operation.
In many of the charts showing individual headways (left column in the collections below), note how often the data points are spread over a range from 0 to at least 15 minutes or more. The TTC routinely fails to attain the quality of service it claims as a target.
As the TTC adjusts schedules to its new budget limitations, the biggest problem for riders will remain the quality of service as shown in reliable headways (or not). Service quality could deteriorate and further inflame riders who already complain about unpredictable waits for and crowding on buses, or the TTC could actually make good on its claims of better service management.
I will return to this in May after the new schedules have been in operation for six weeks.
The remainder of this article contains detailed charts showing service quality on 905 Eglinton East for those who love all of the details.
January 2023
Eastbound From Kennedy Station
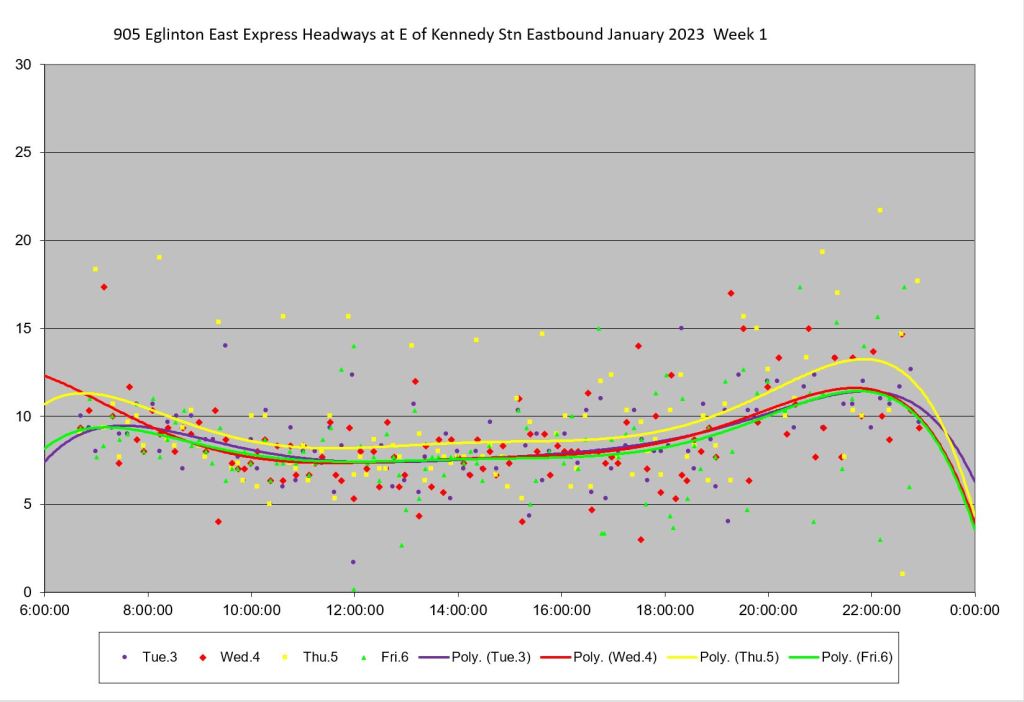
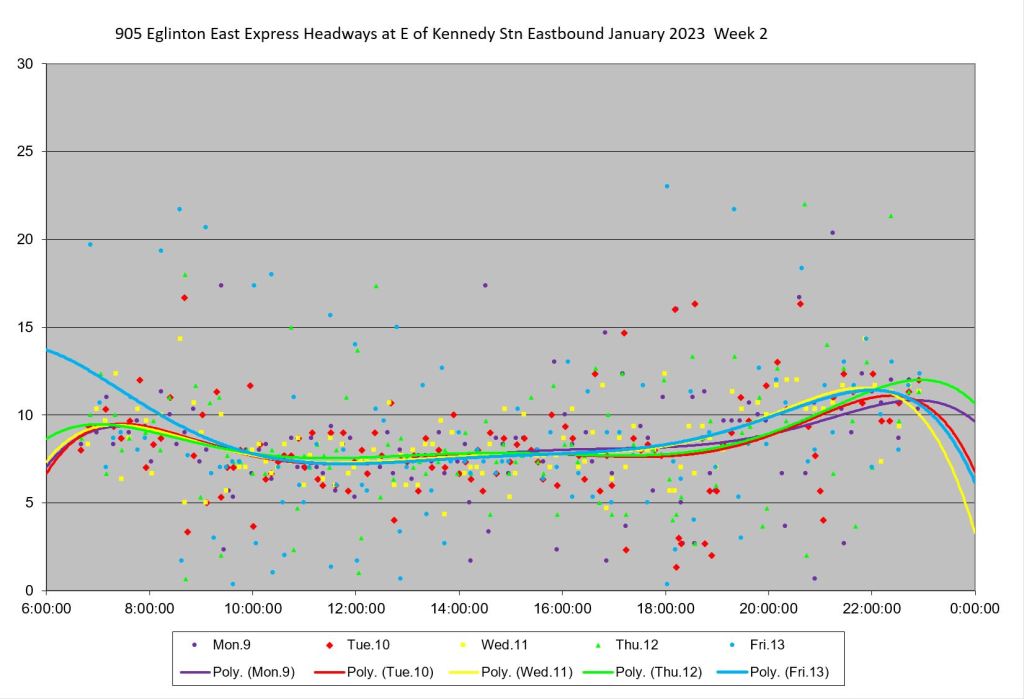
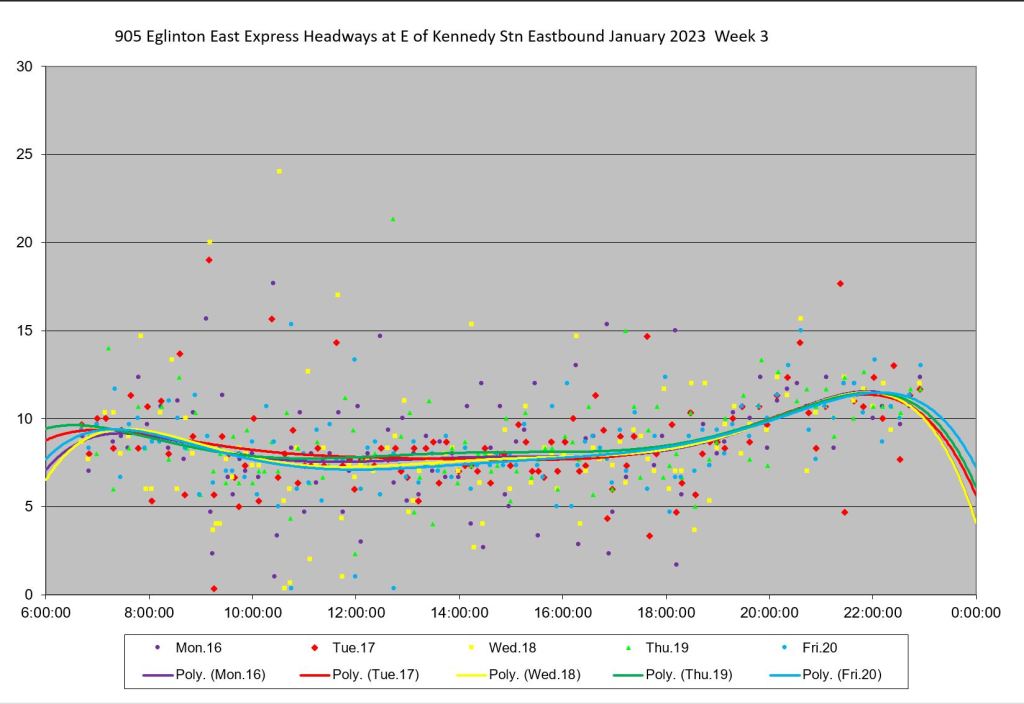
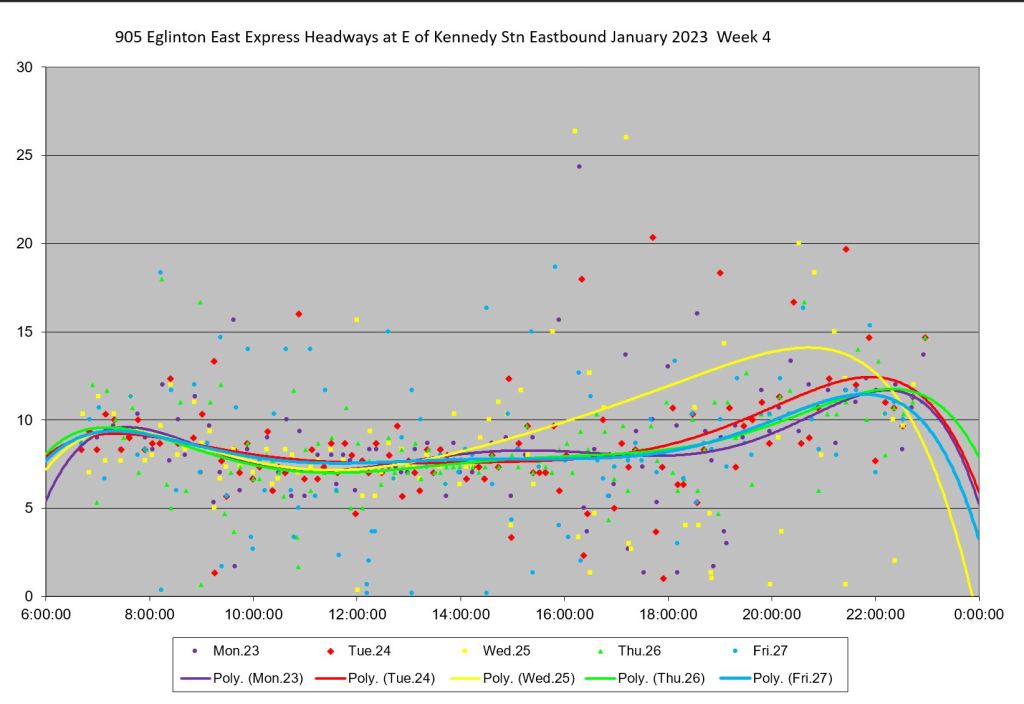
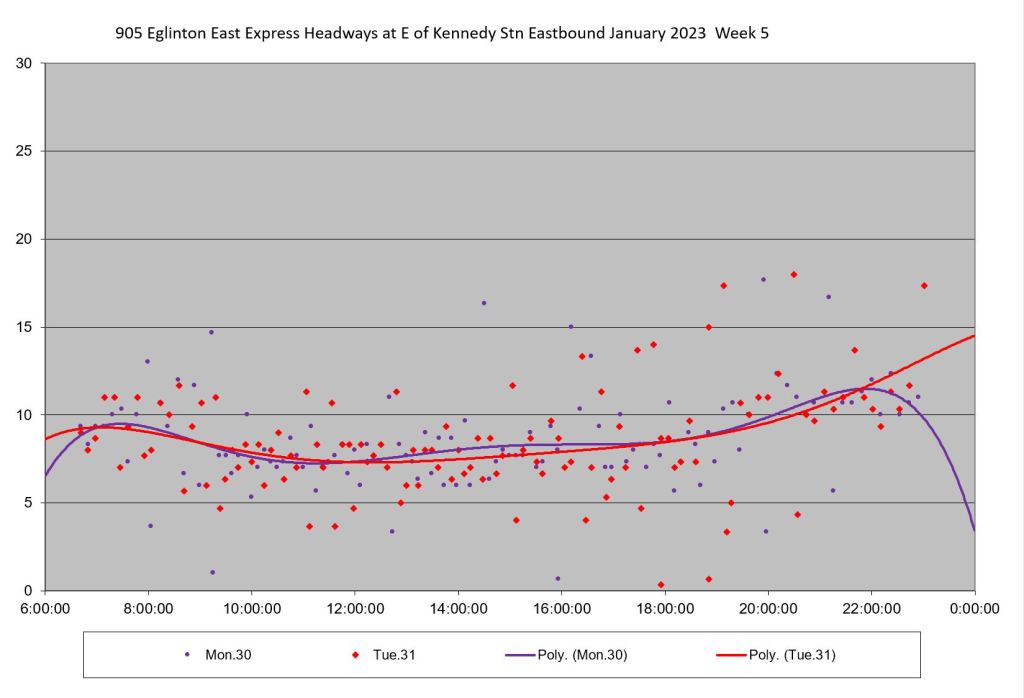
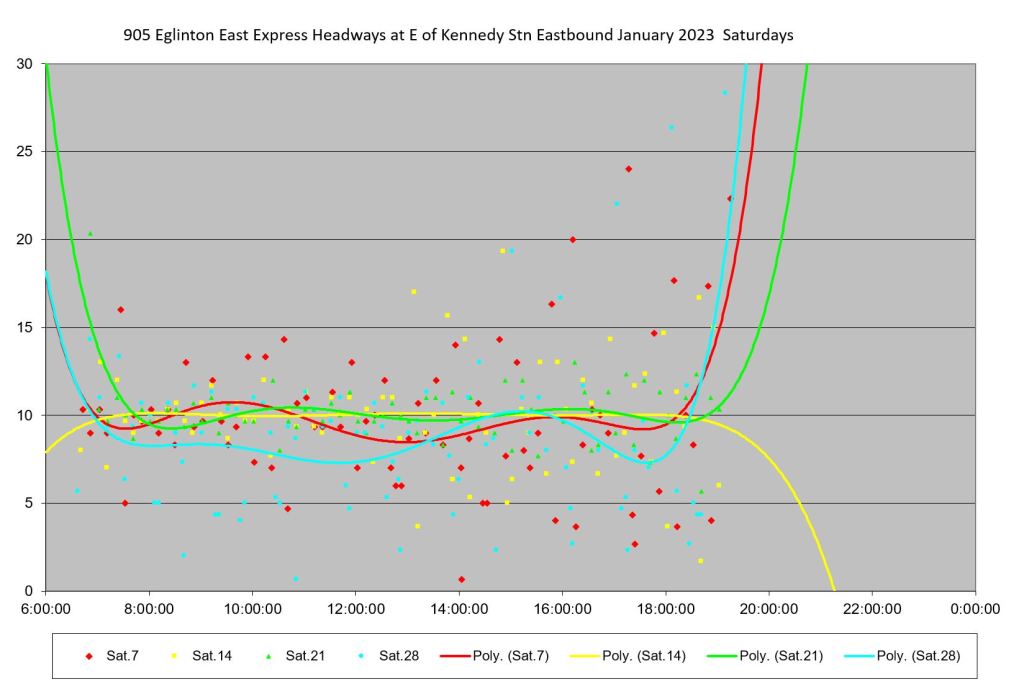
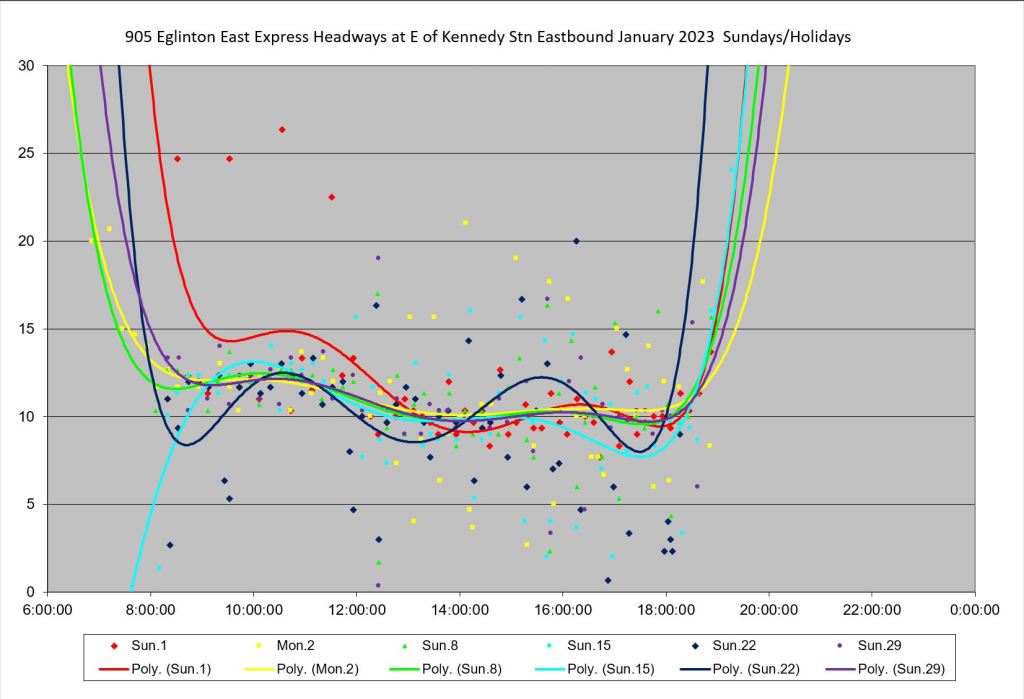
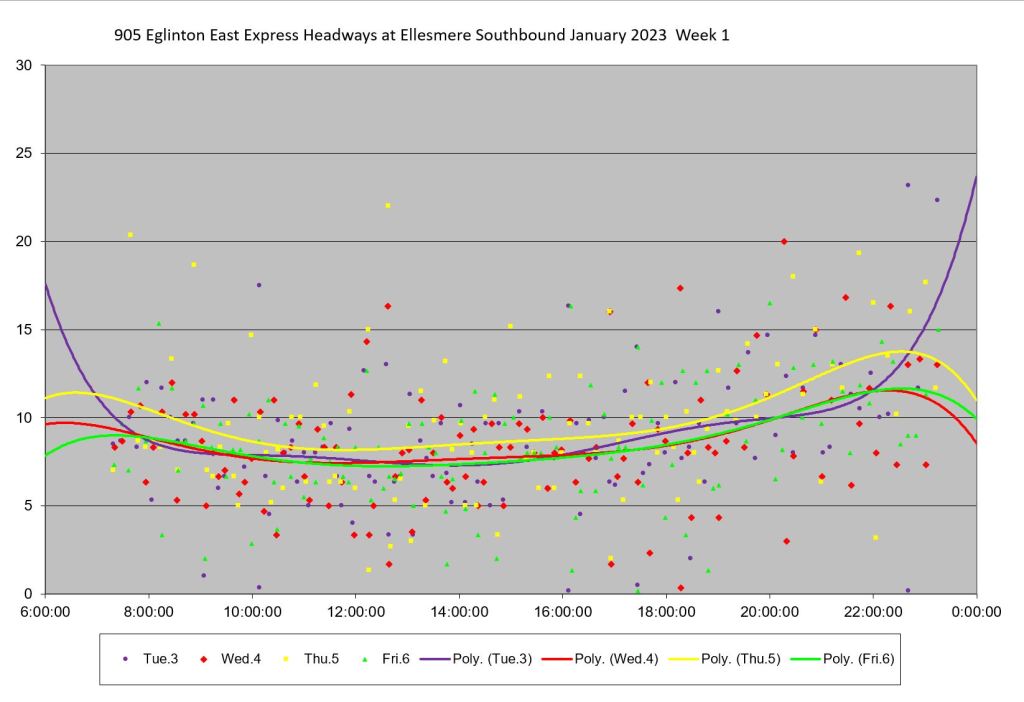
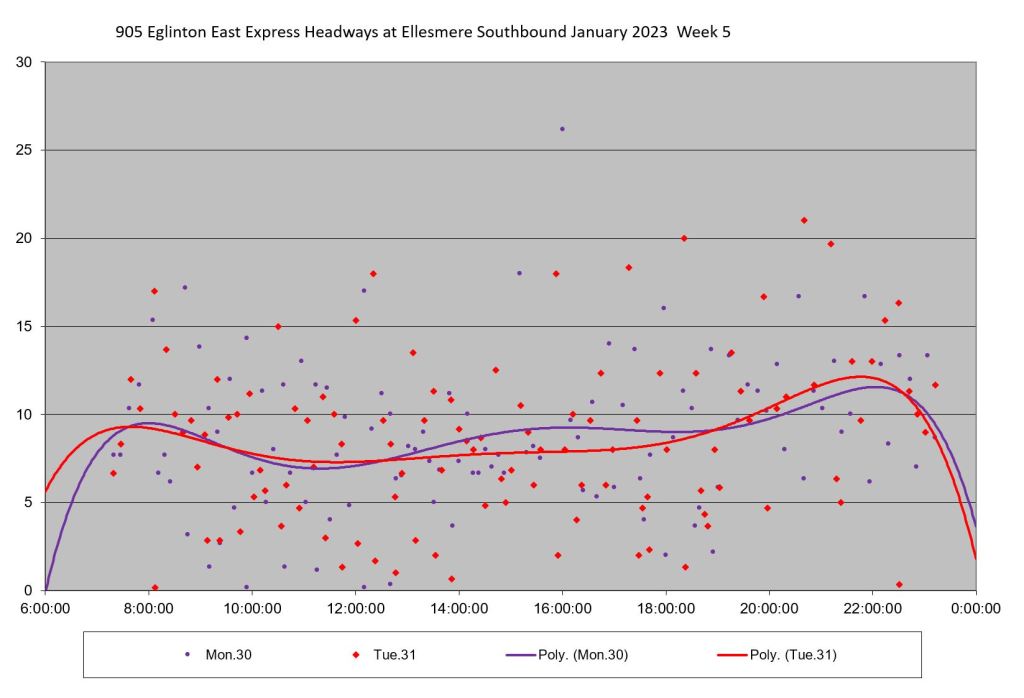
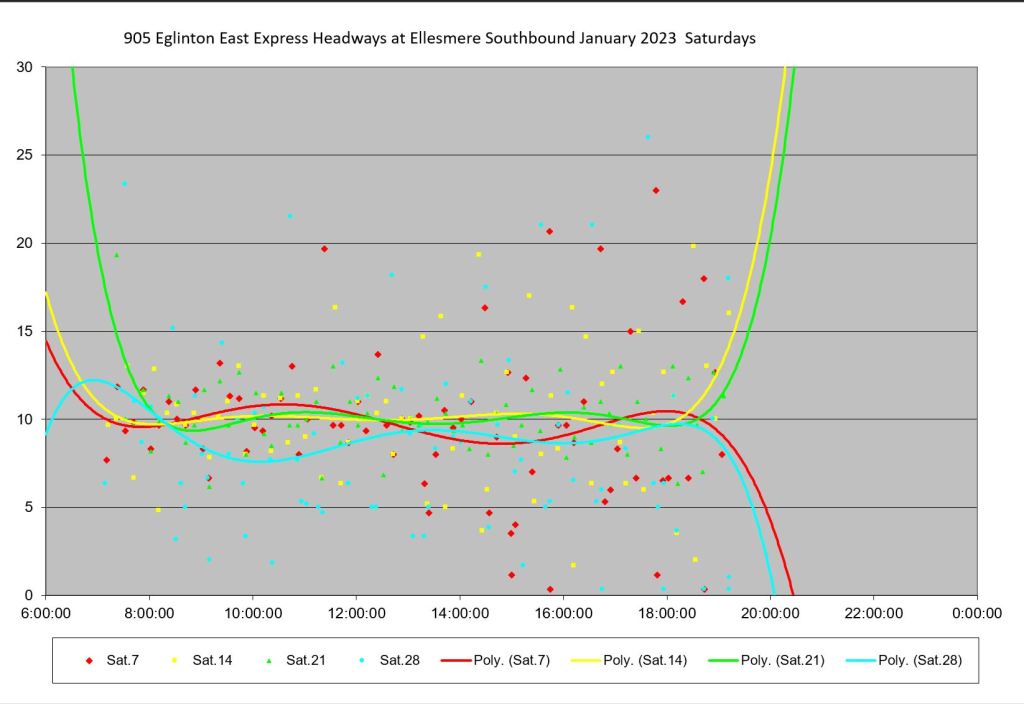
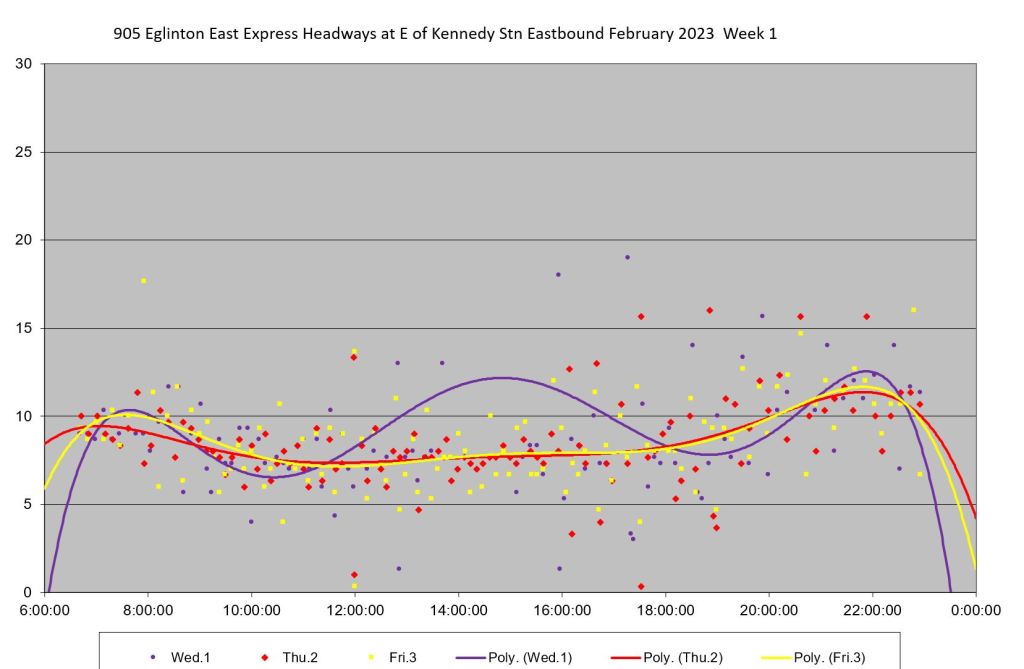
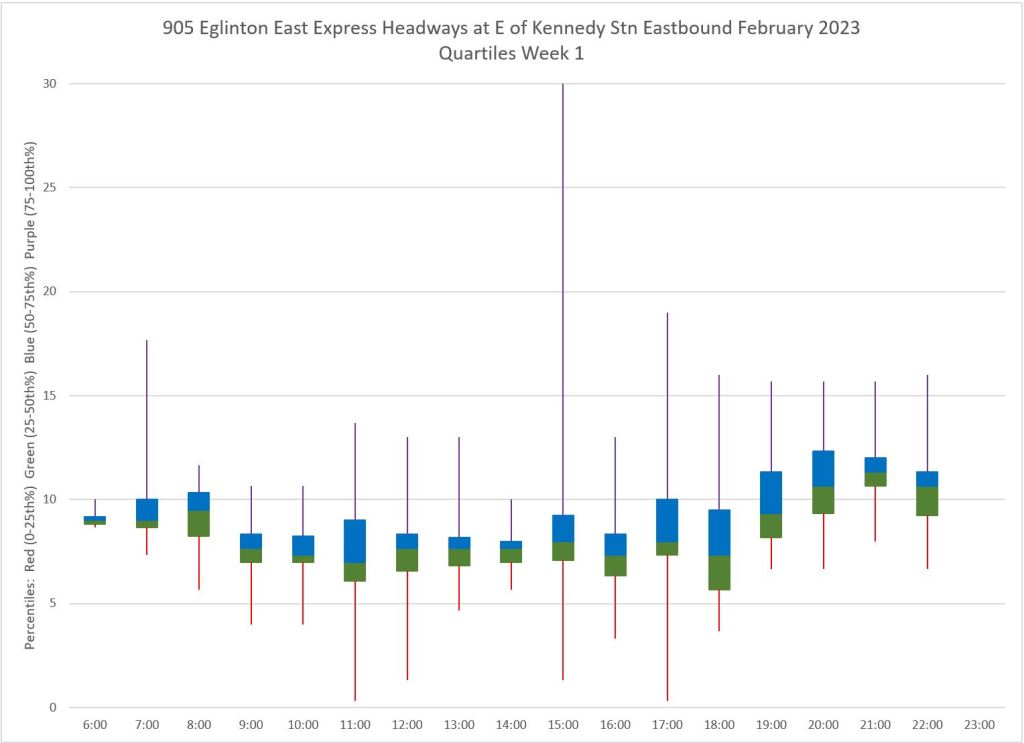
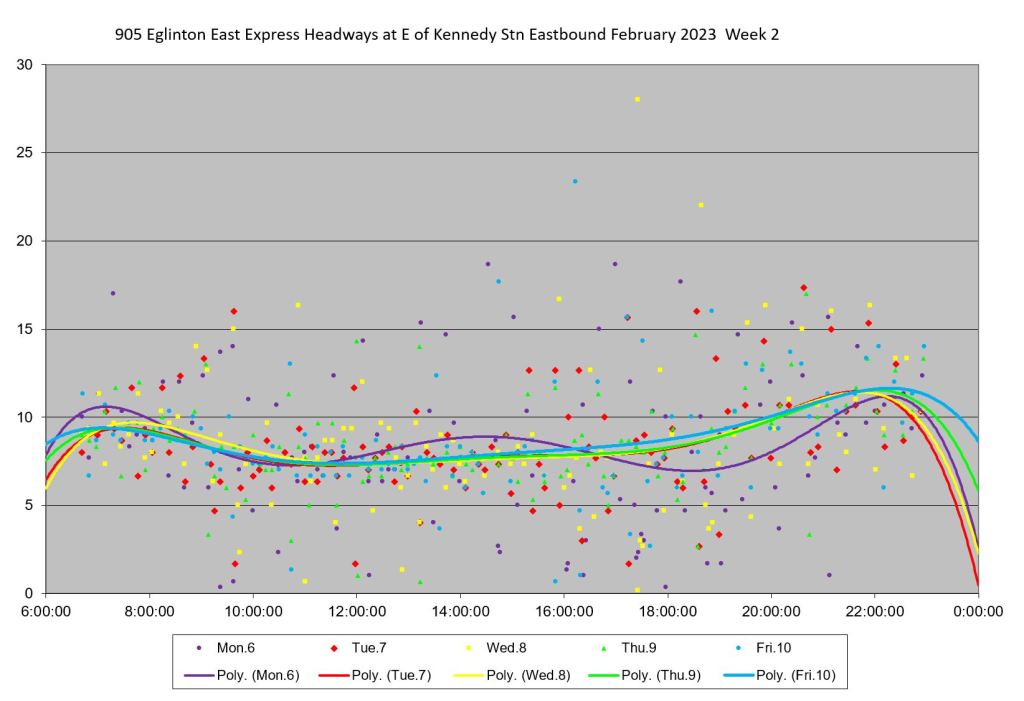
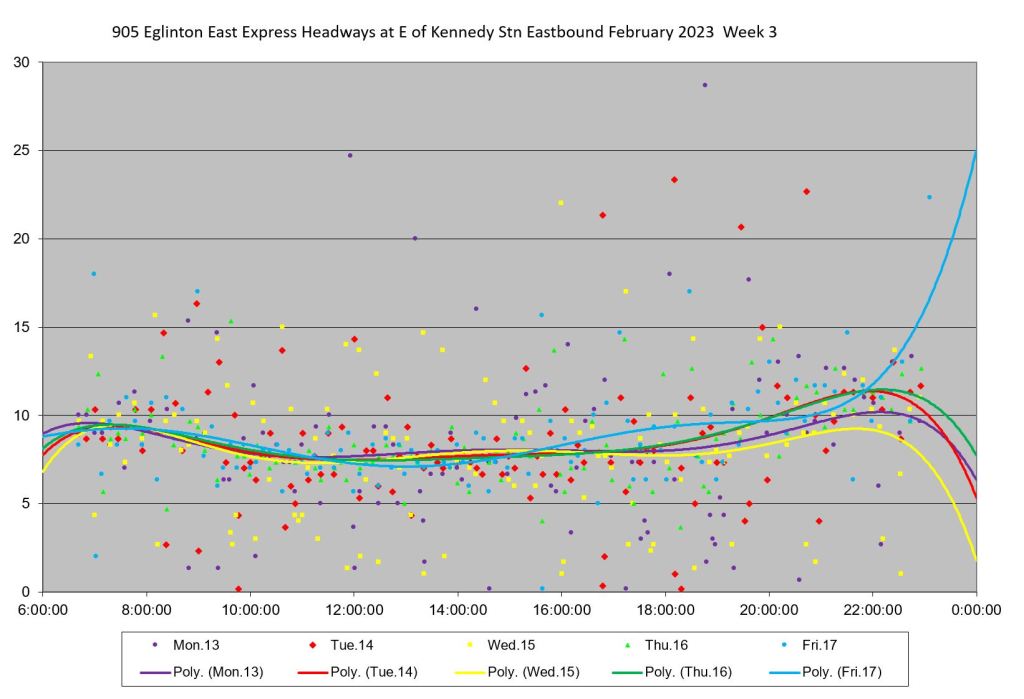
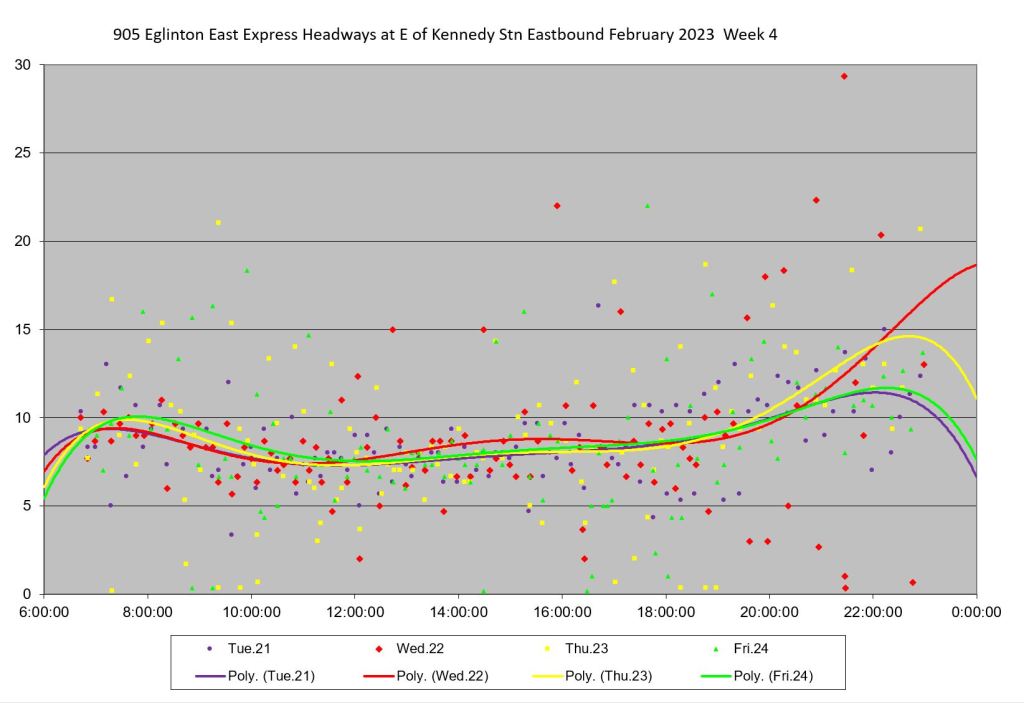
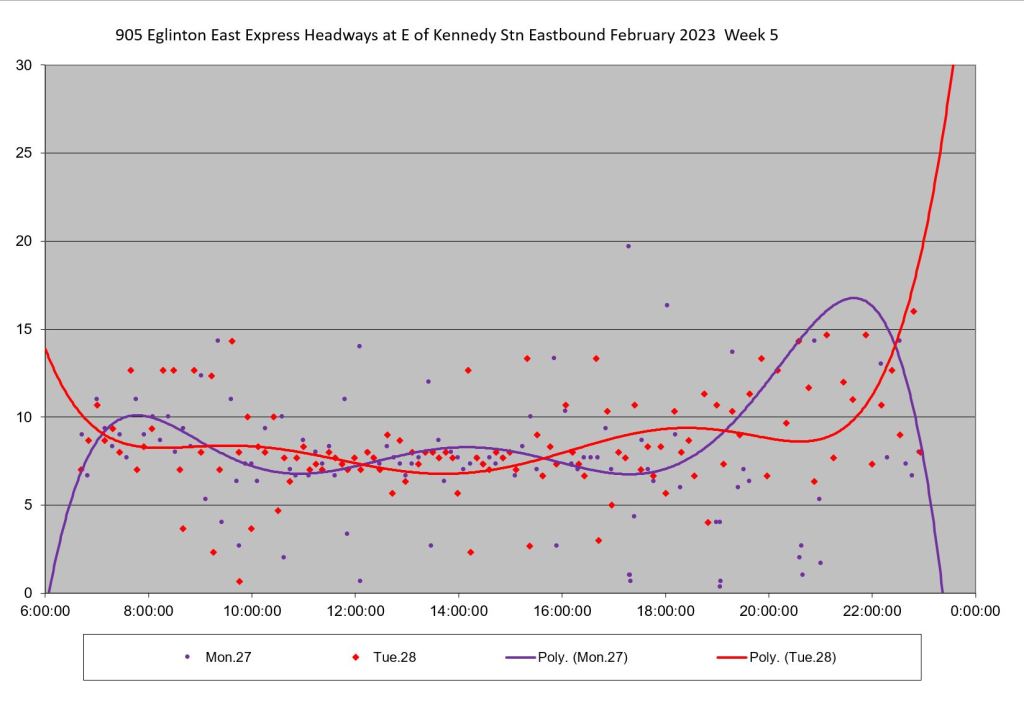
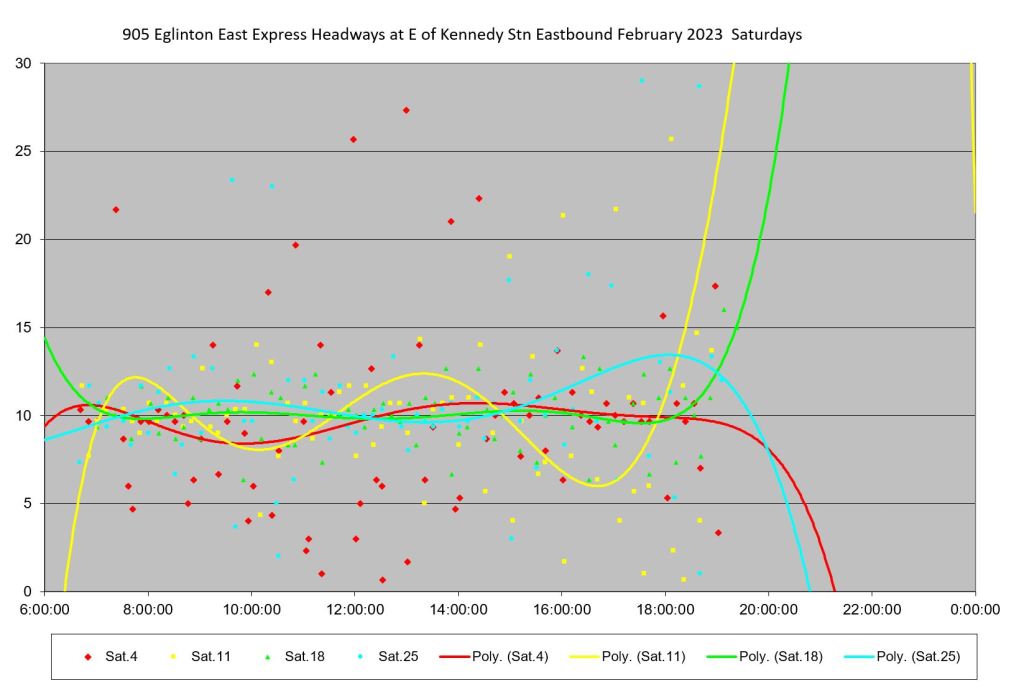
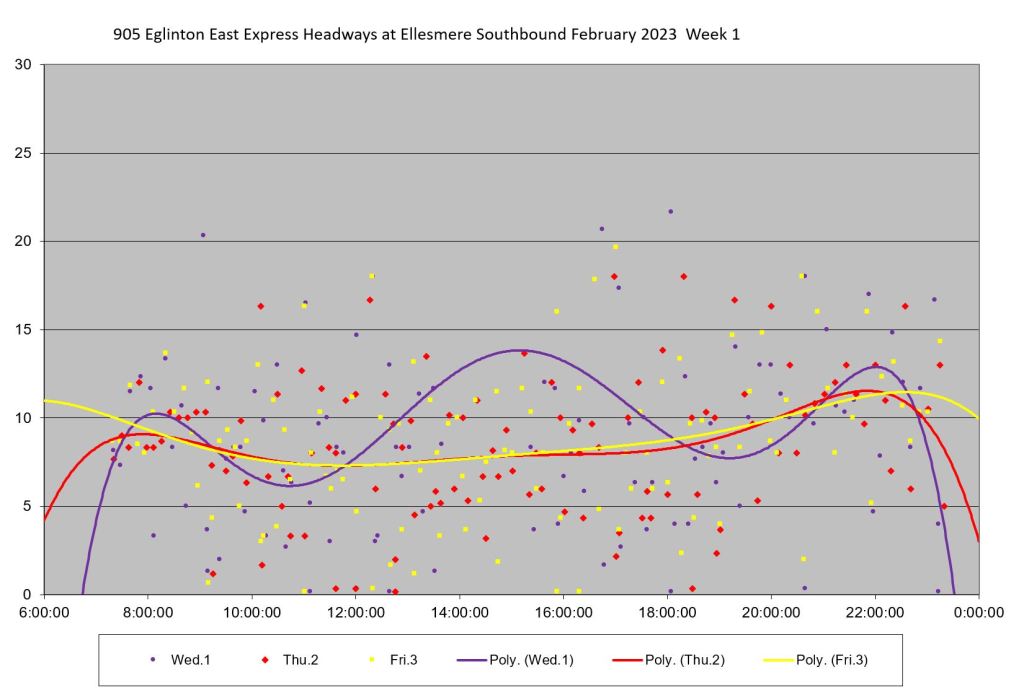
The charts below show the range of headways actually operated east from Kennedy Station during January 2023.
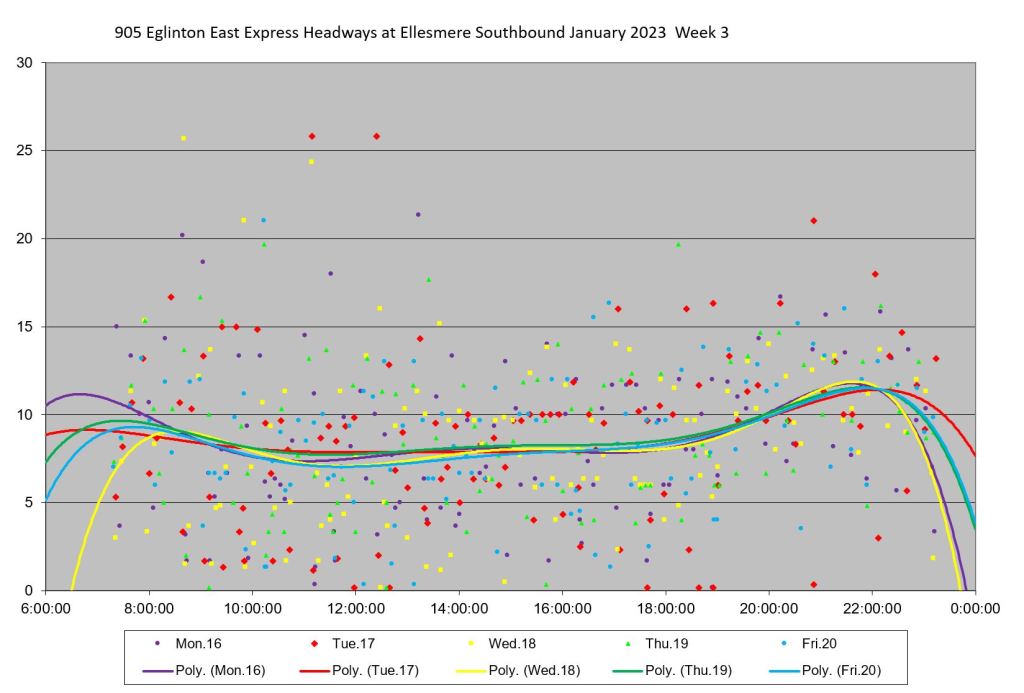
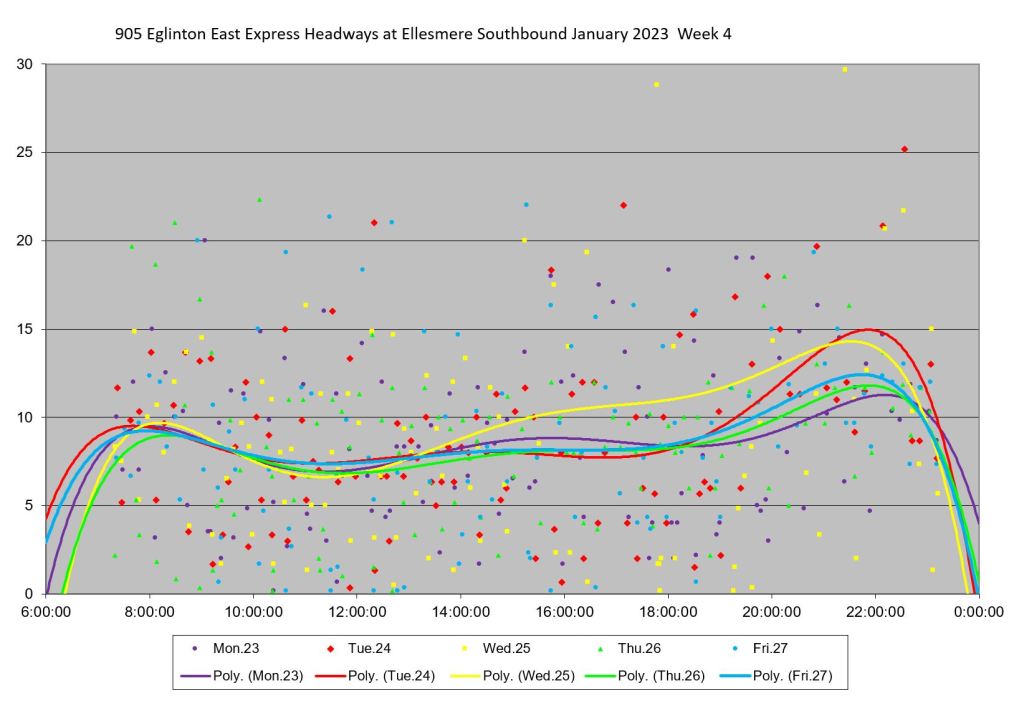
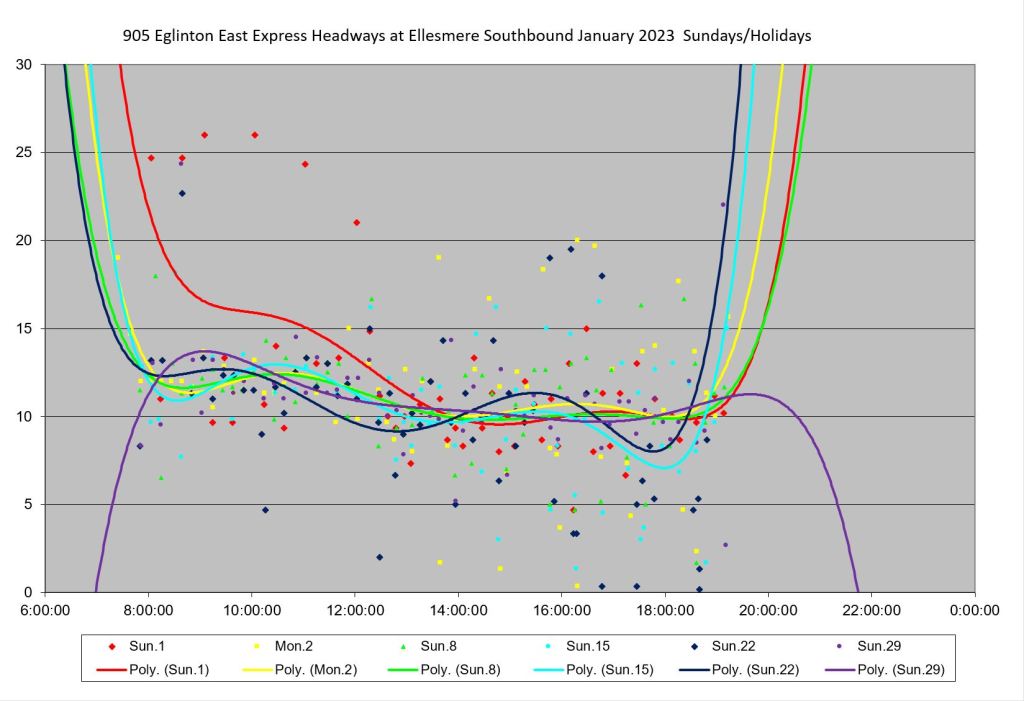
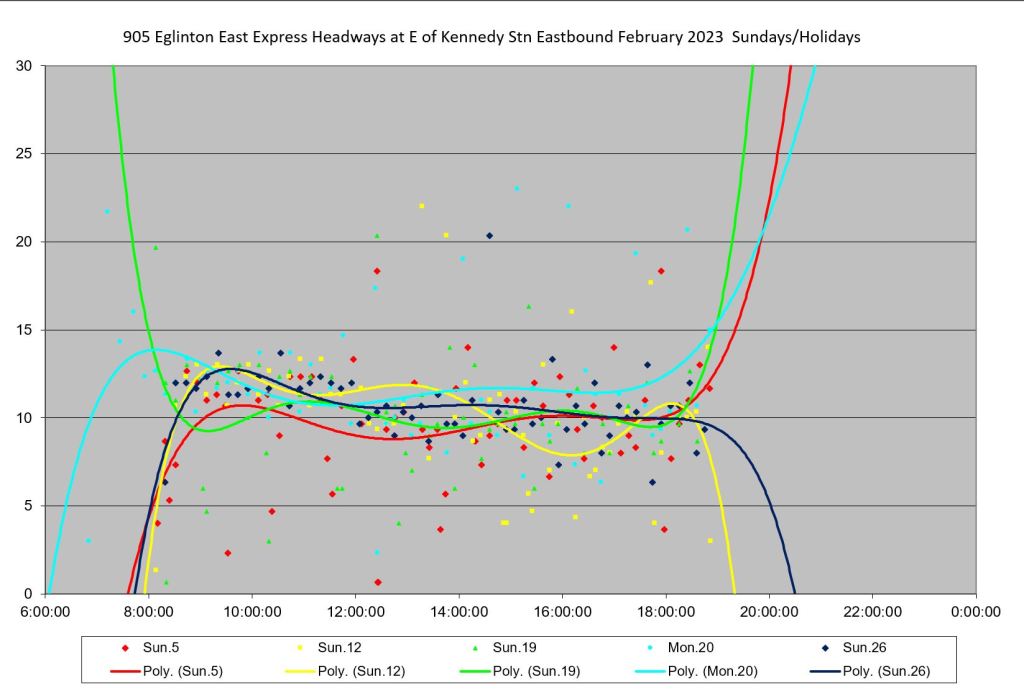
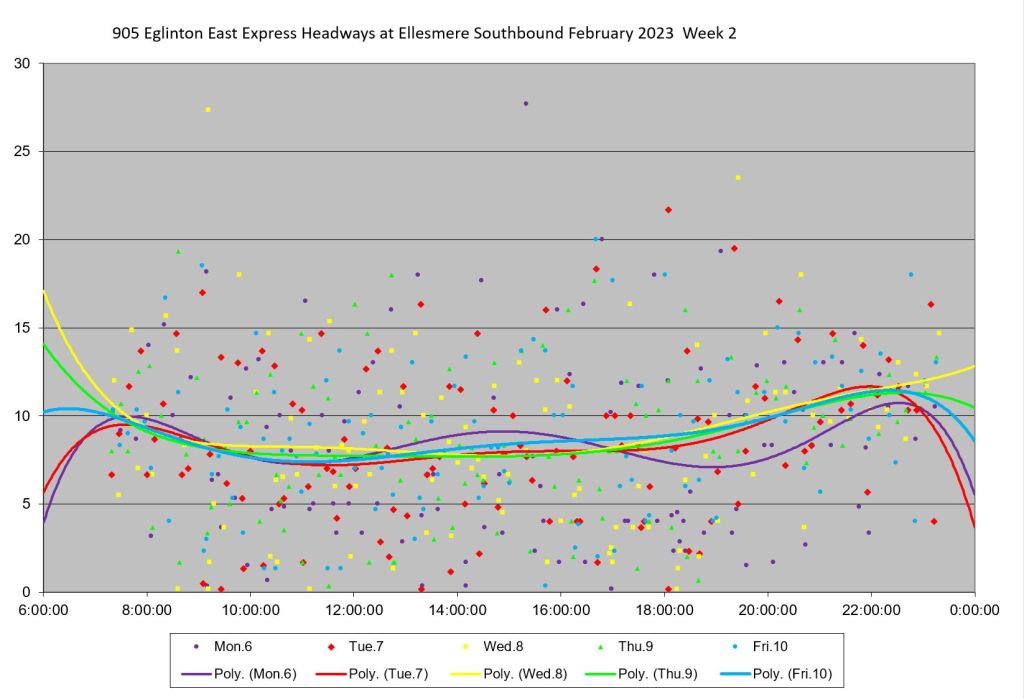
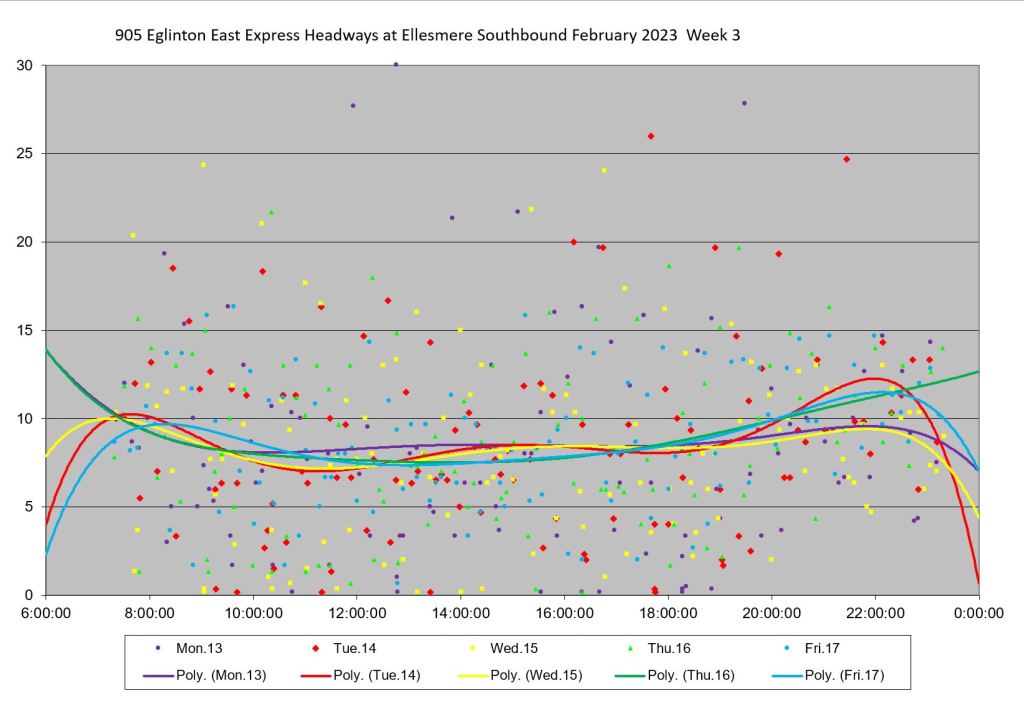
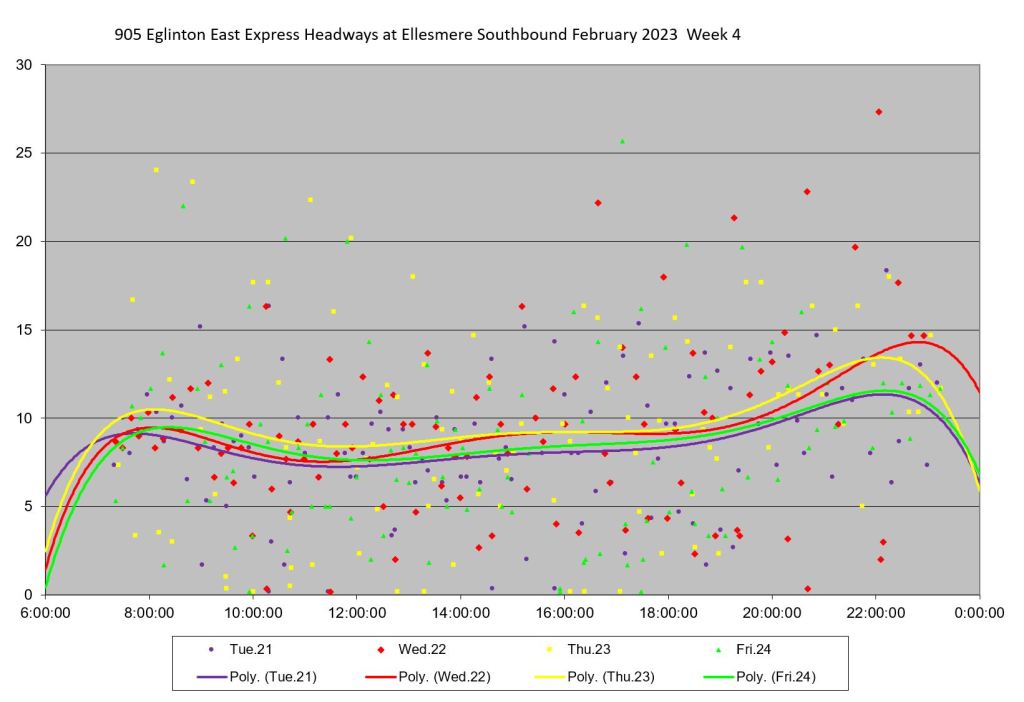
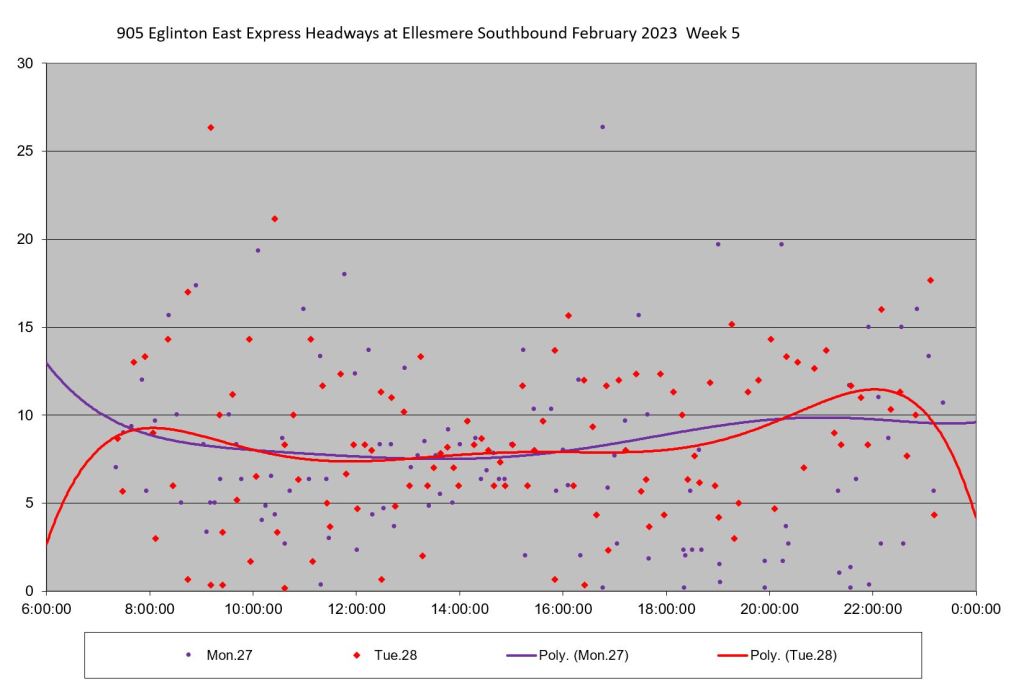
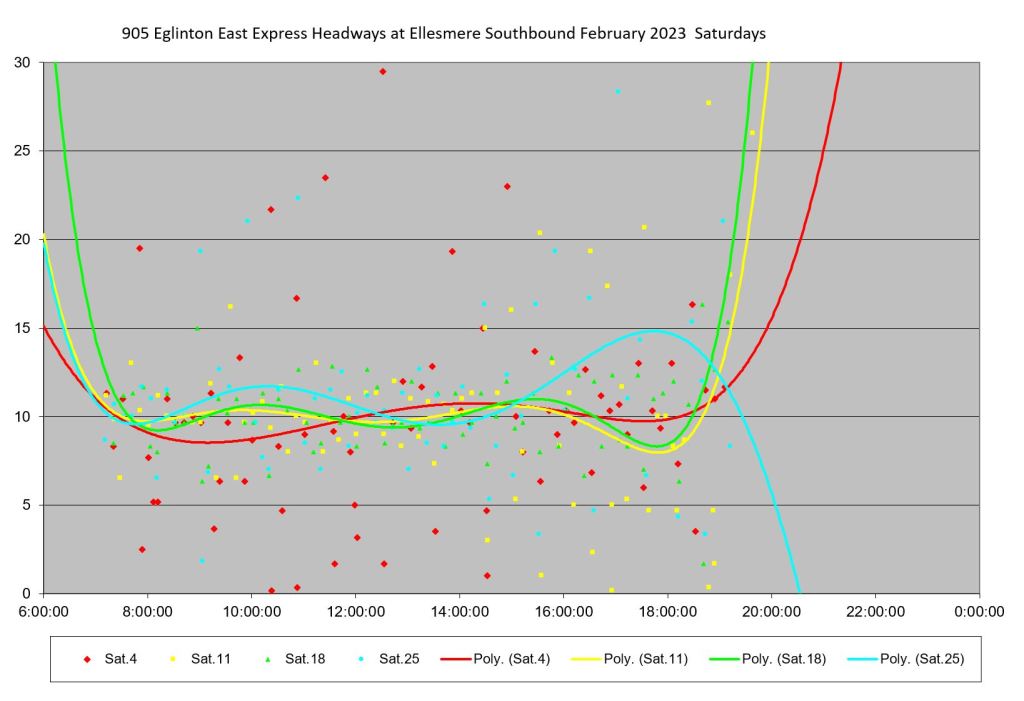
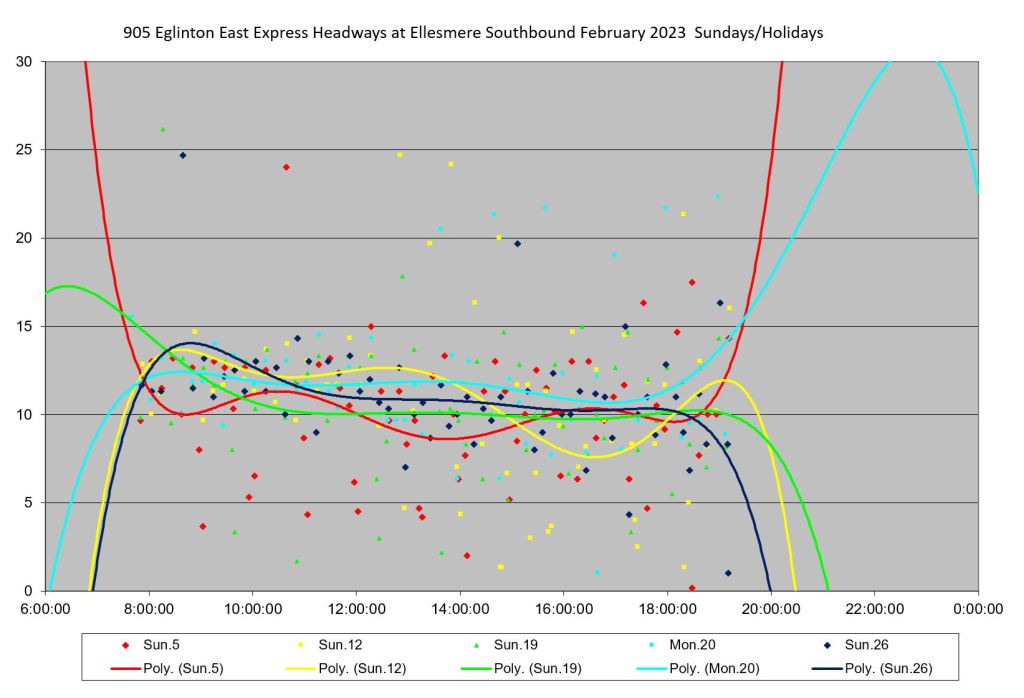
On the left, the charts show the individual headway values with a different colour for each day, and with trend lines plotted through the points. Note that the trend lines generally lie together indicating similar overall values for each day. One day, Wednesday, January 25, stands out because of weather-related problems.
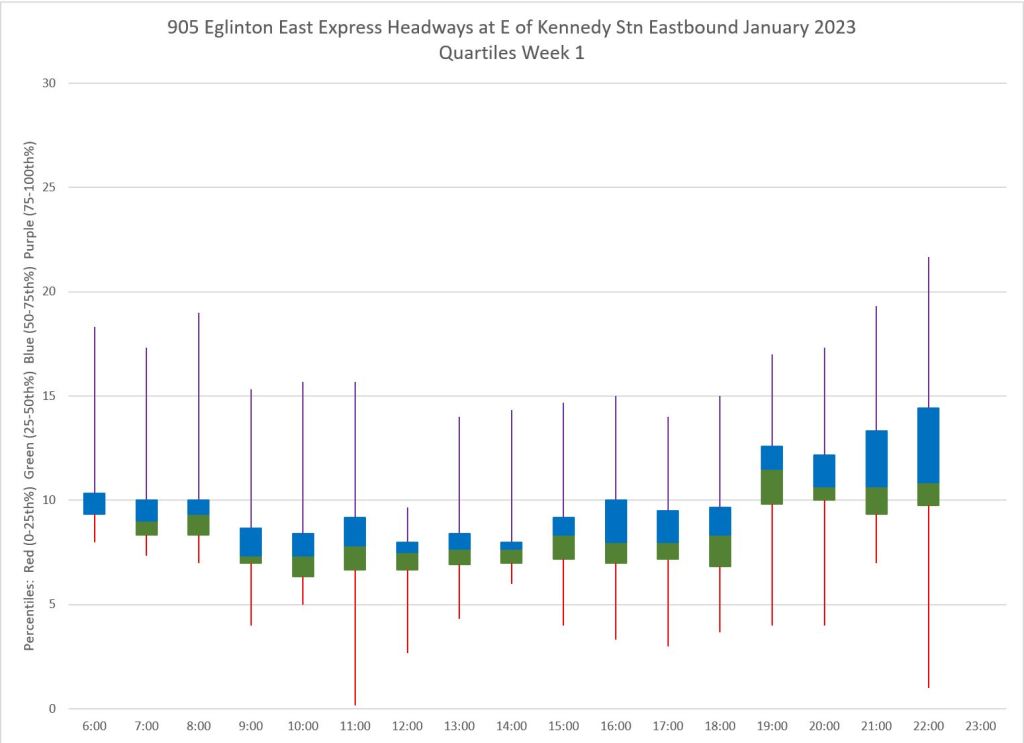
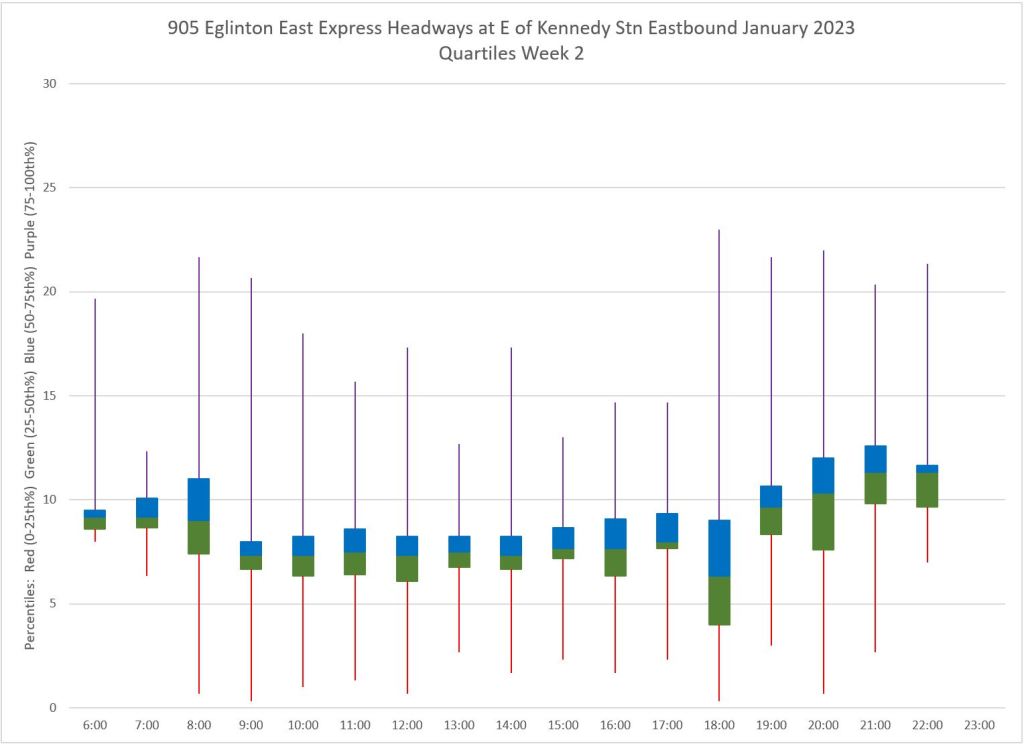
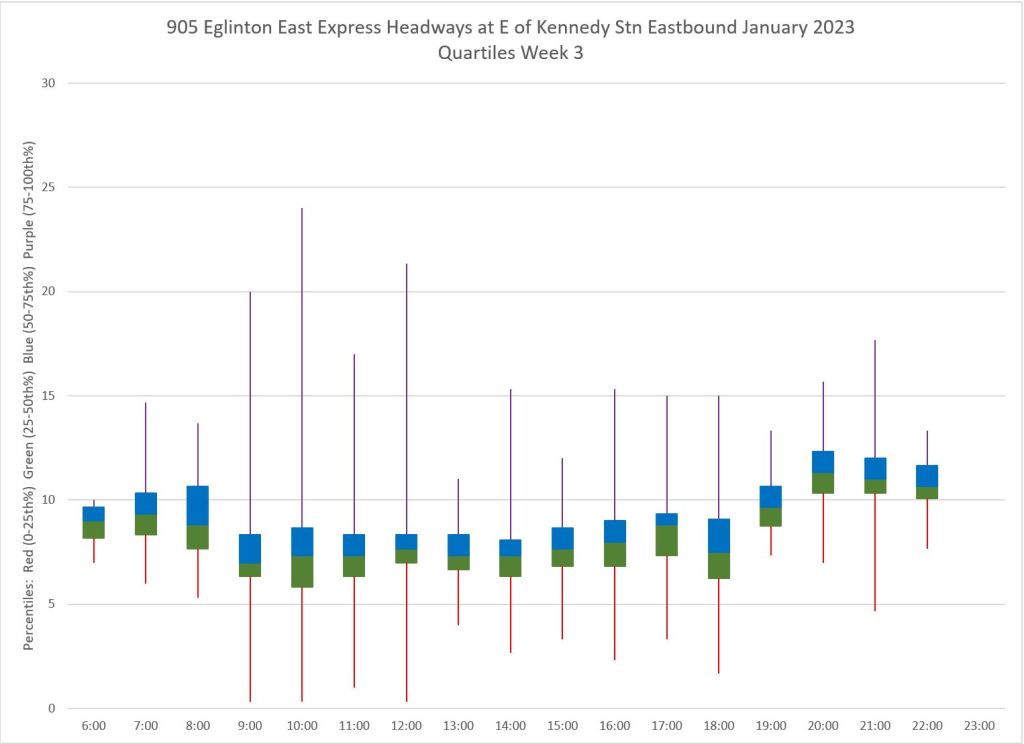
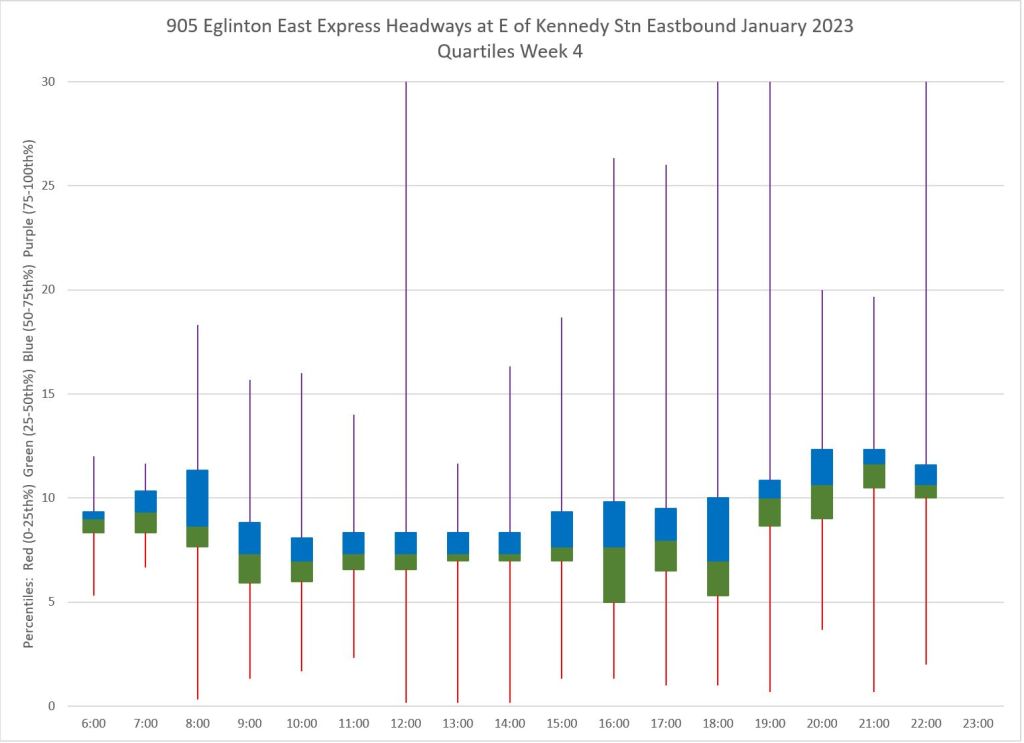
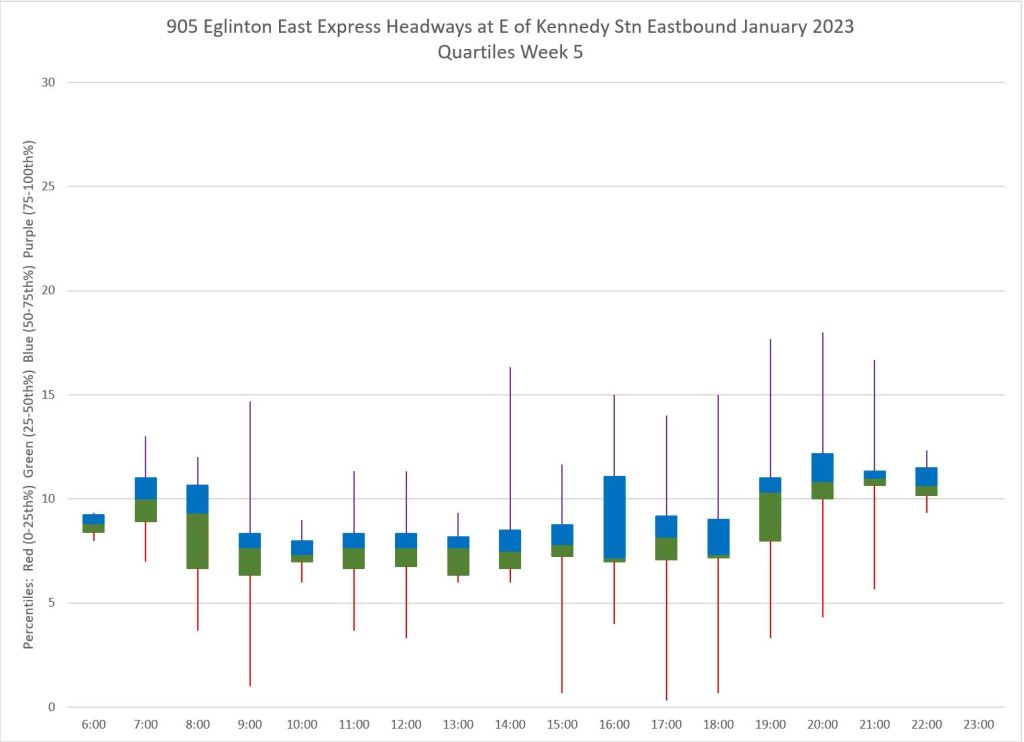
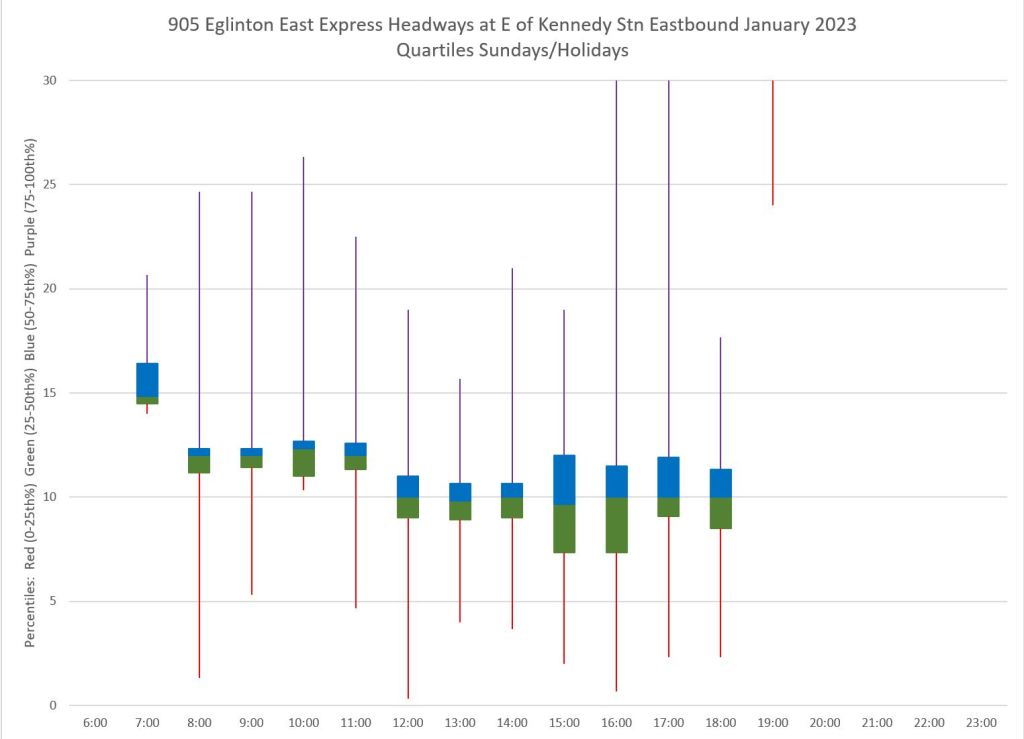
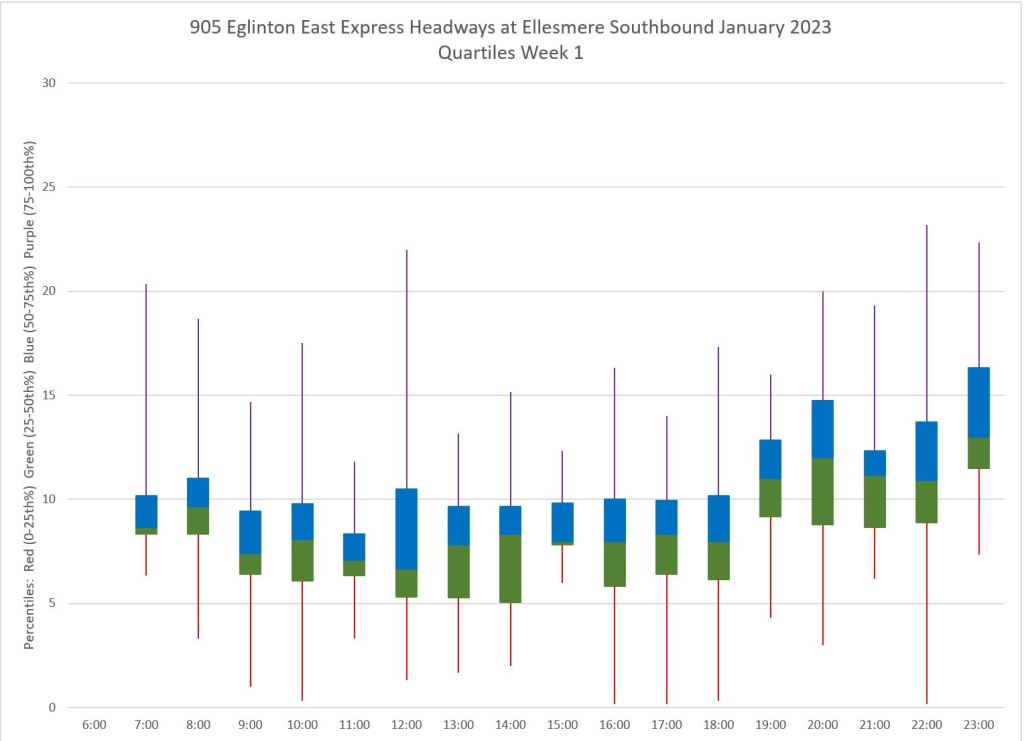
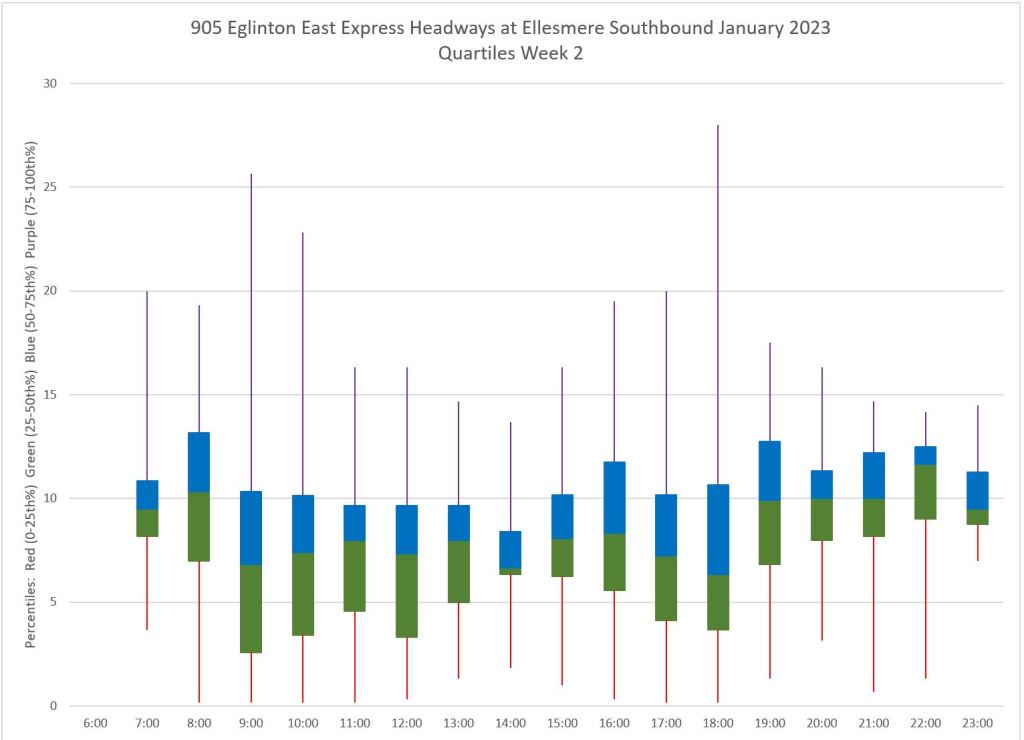
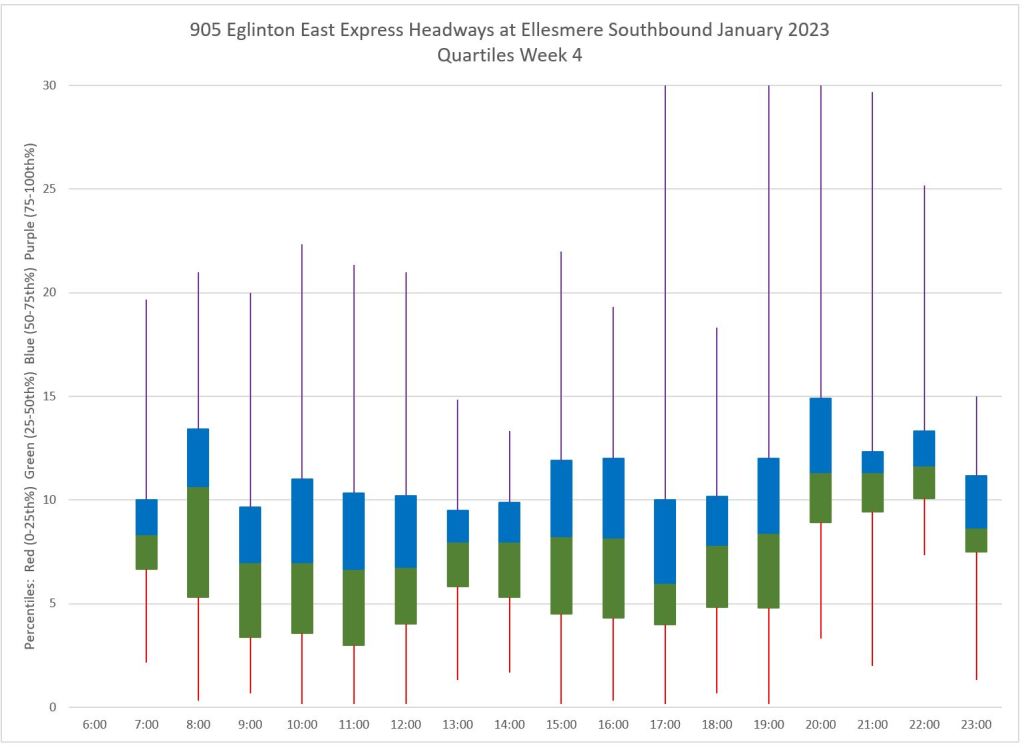
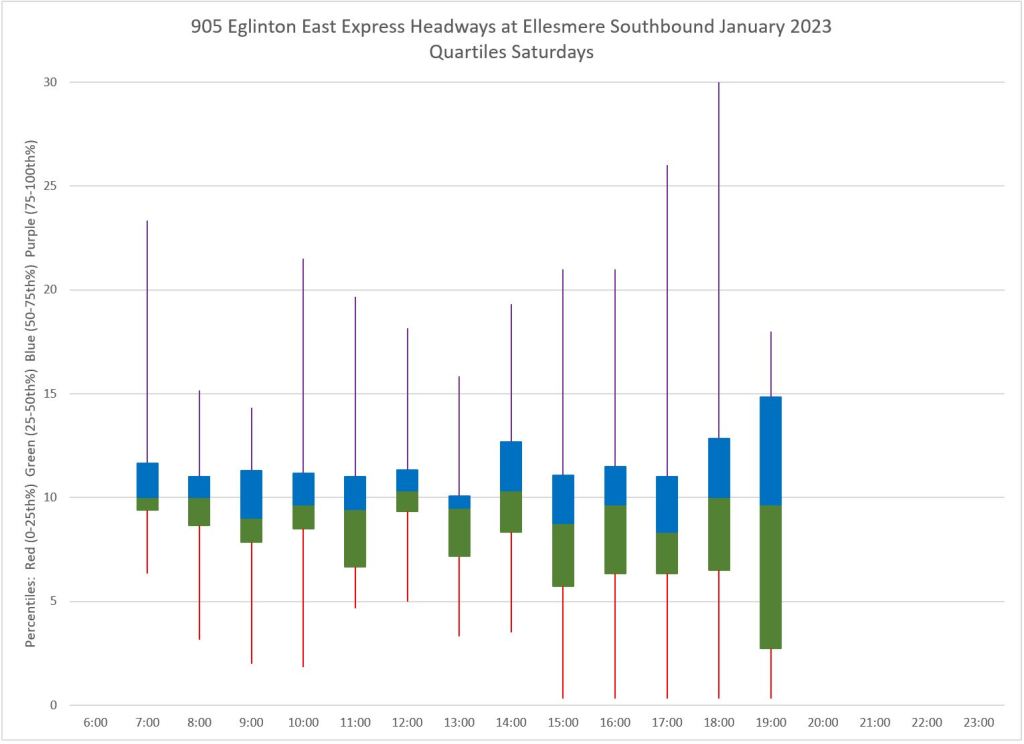
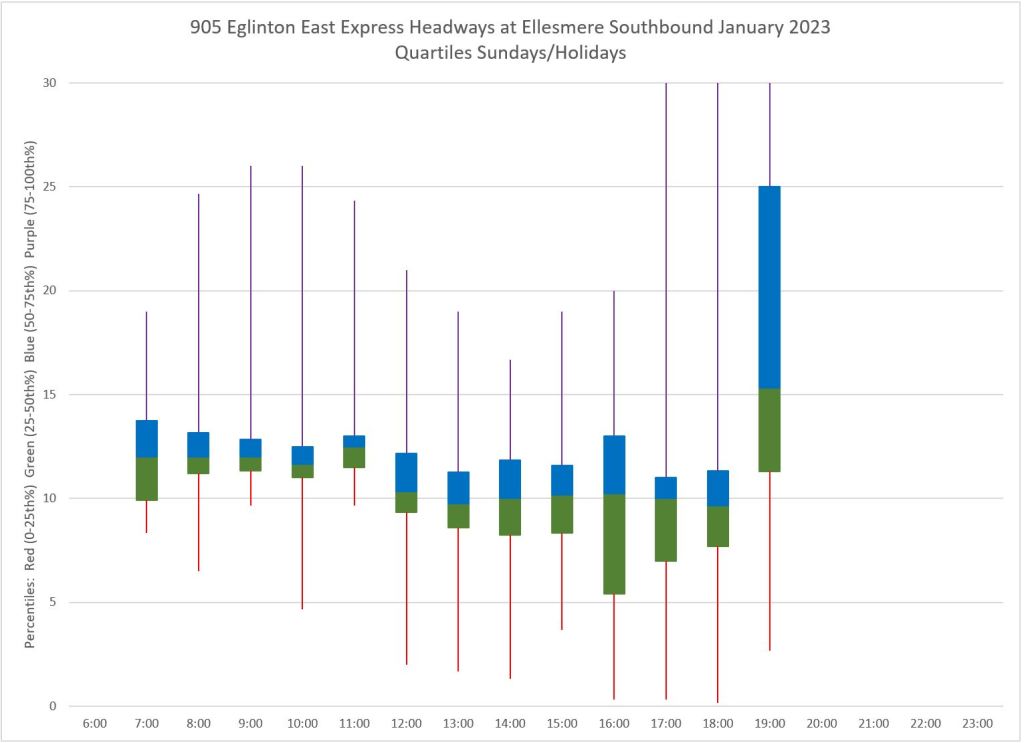
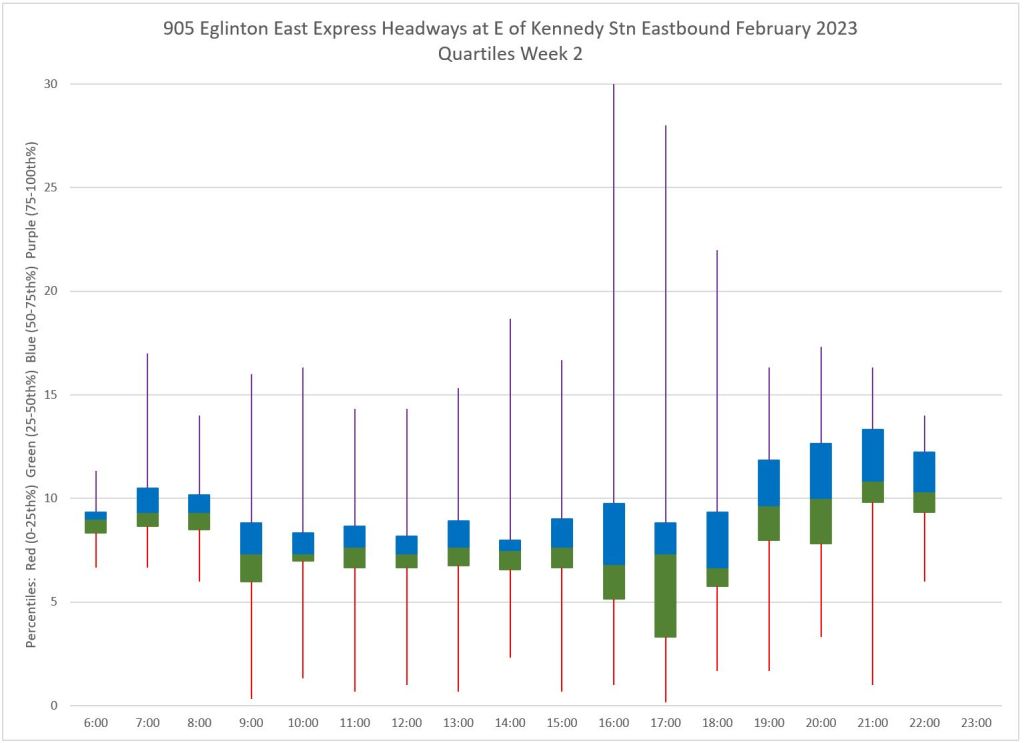
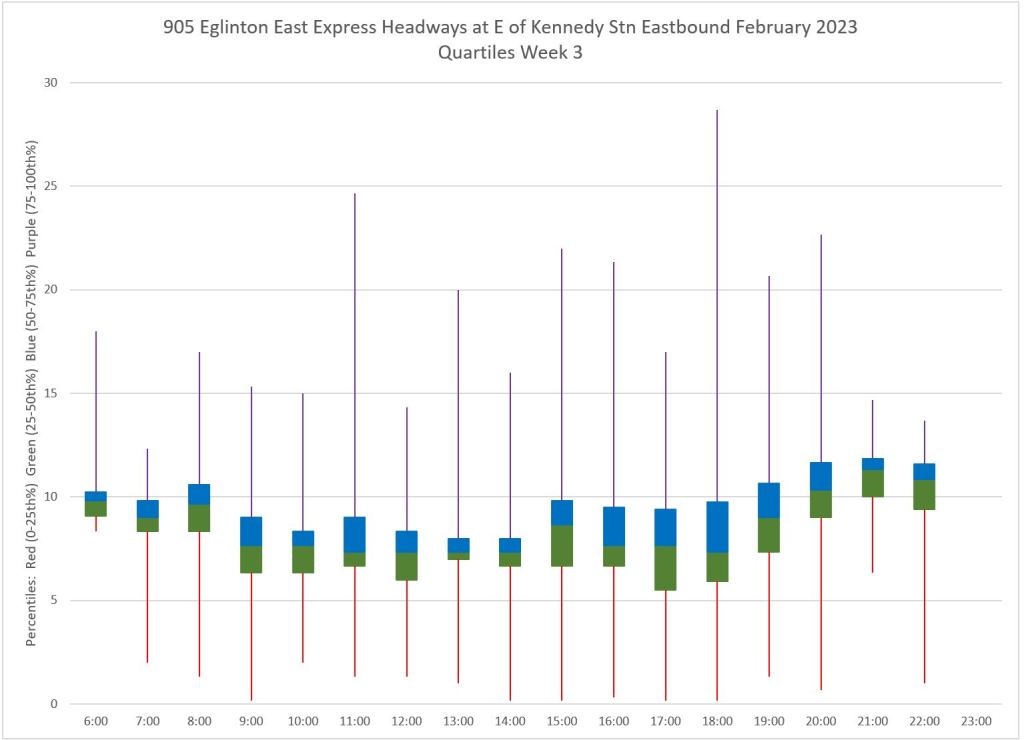
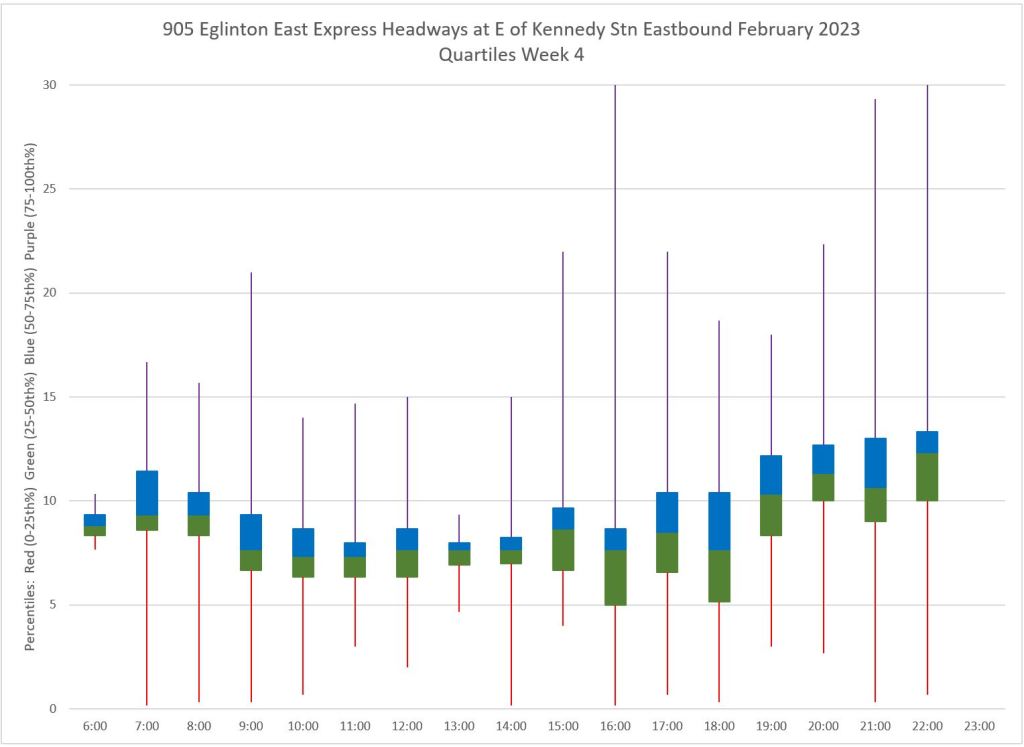
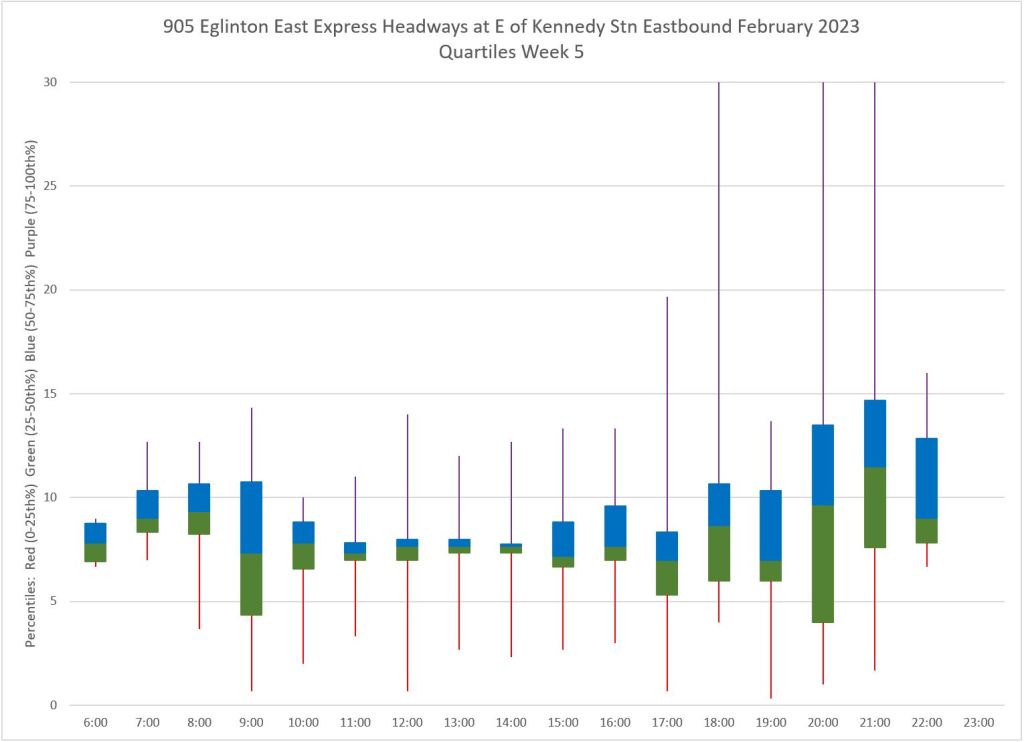
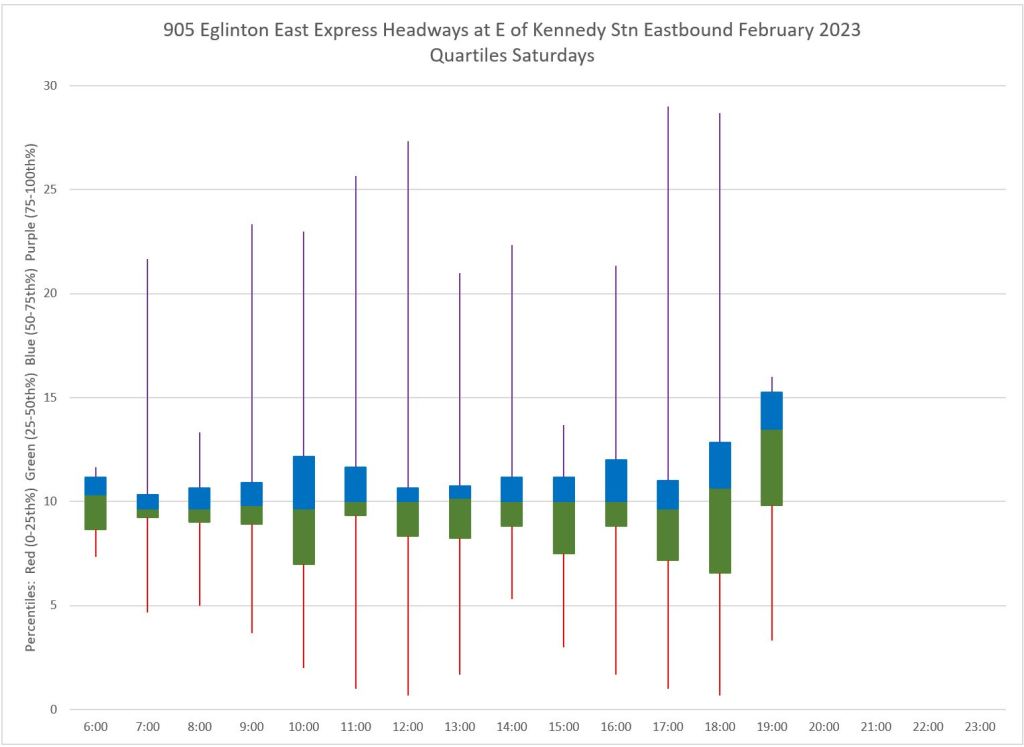
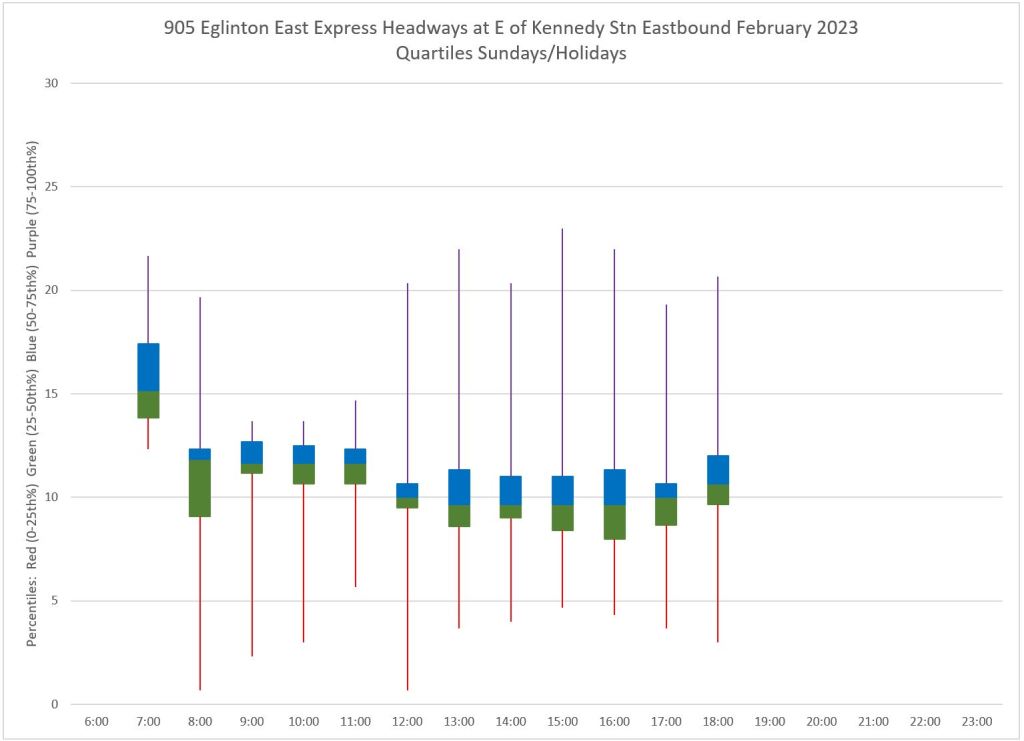
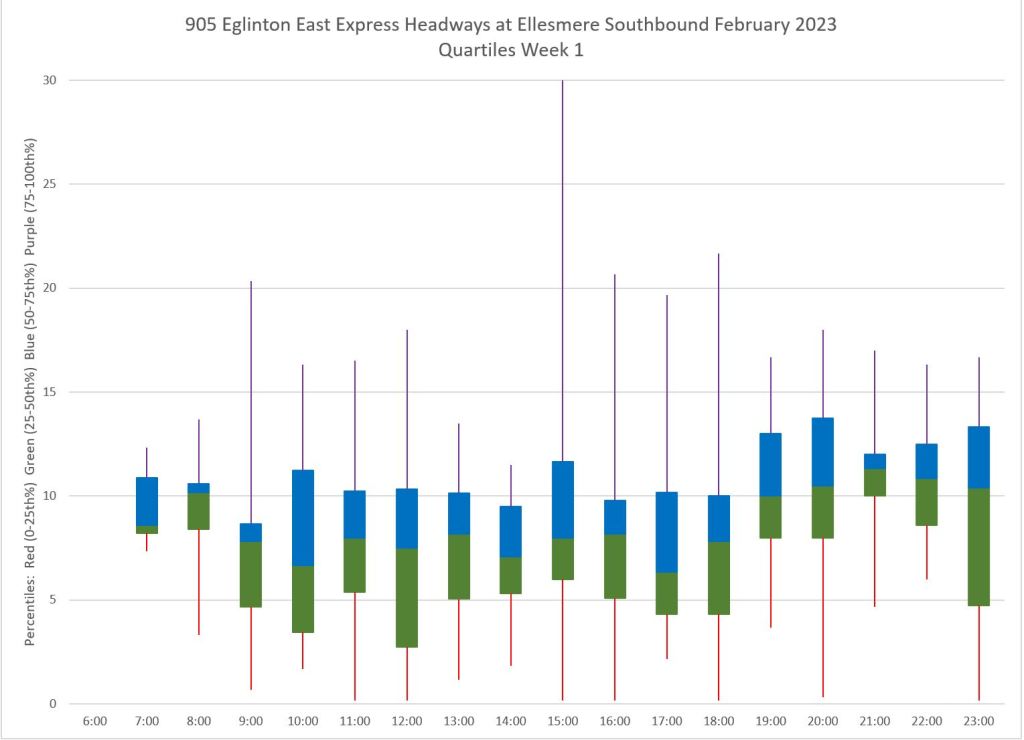
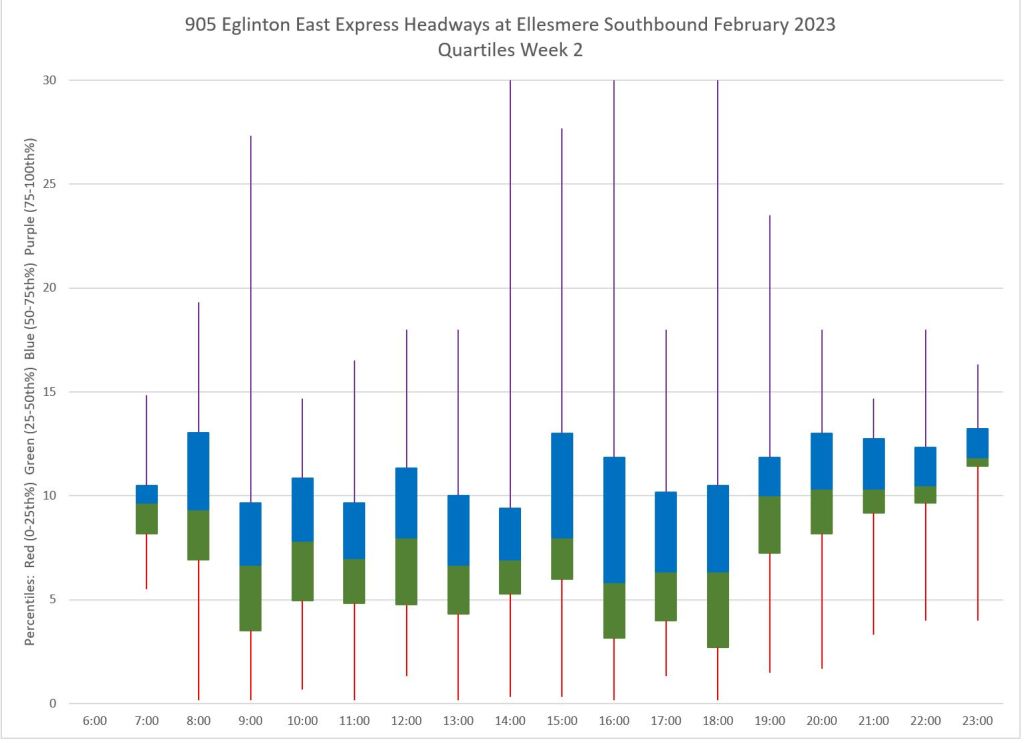
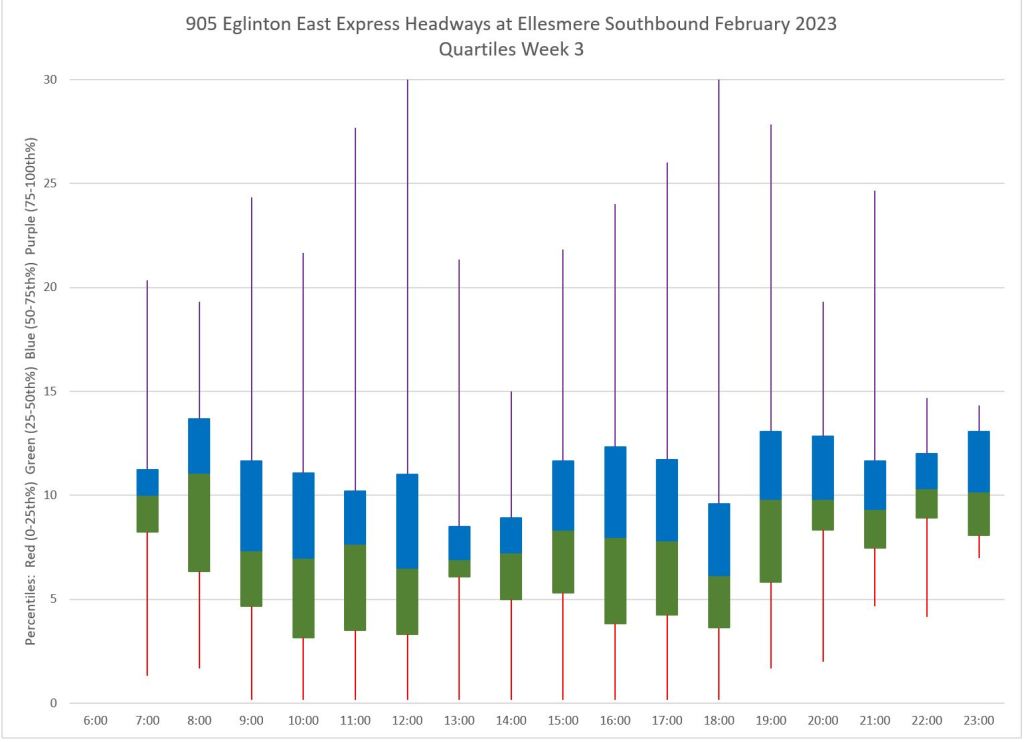
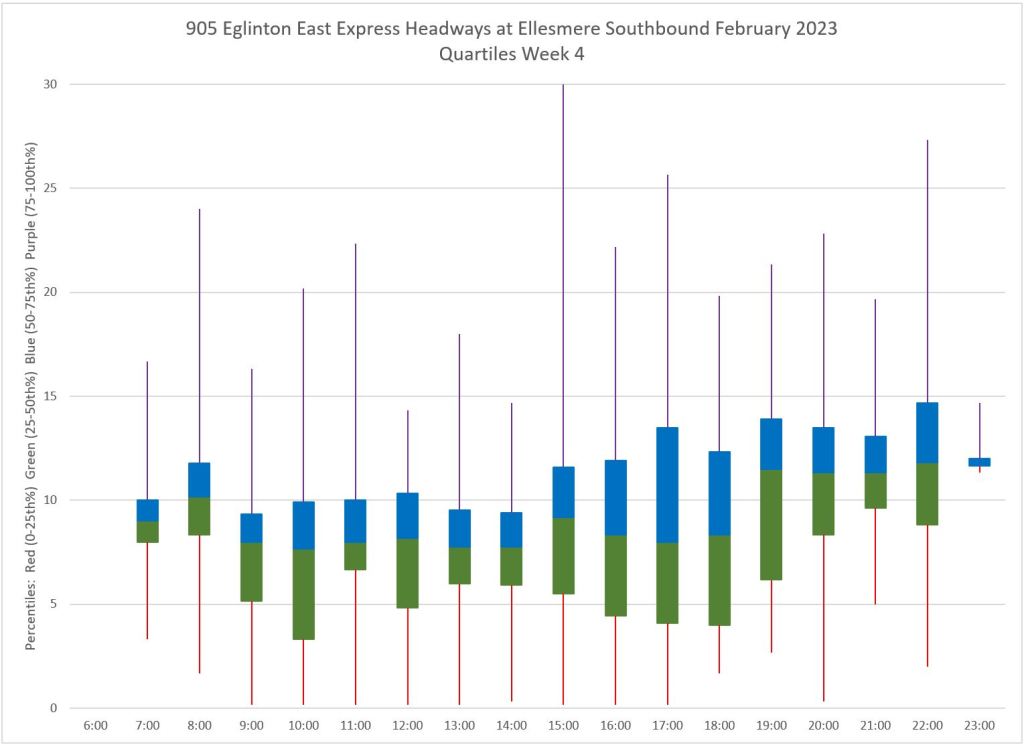
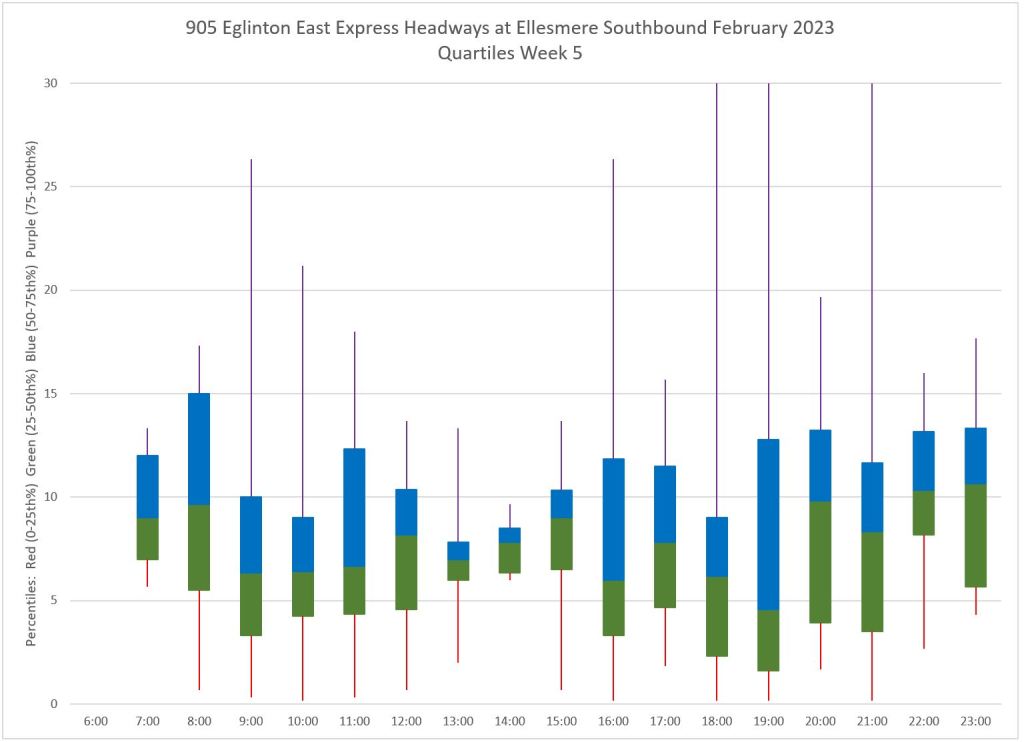
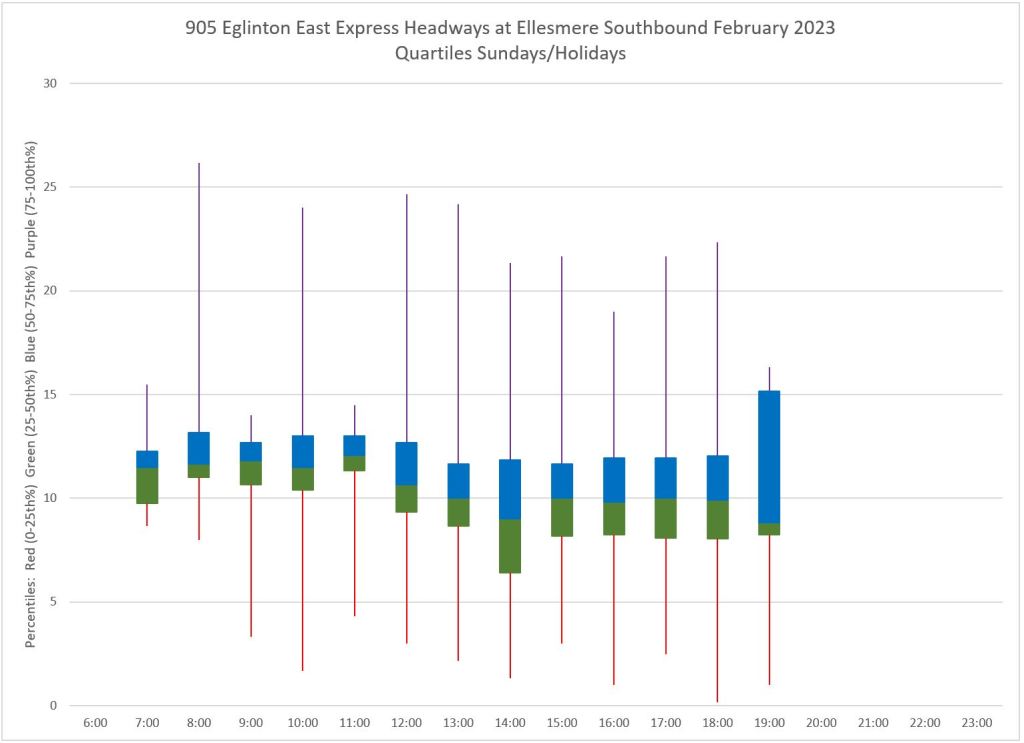
On the right, the charts show the range of values for each hour within each week subdivided by quartile. When the central blue and green blocks are small, this indicates that the values of half of the data (the middle two quartiles) are concentrated in a small range. The tails up (purple) and down (red) show how far the outliers range in very wide and very short headways. Ideally, all of these quartiles should be small with the headway values clustered around the median (the boundary between blue and green) which, in turn, is the scheduled headway.
Quite clearly visible are cases where two or more buses run close together (dots near the horizontal axis) or far apart. The first week of January is comparatively well-behaved because this is a continuation of the New Year’s holiday period.
Not visible in these charts are any “run as directed” buses because they are not tracked like scheduled service. The TTC often refers to them when people complain about service, but they have no way to prove that they actually existed or how they might have helped riders.
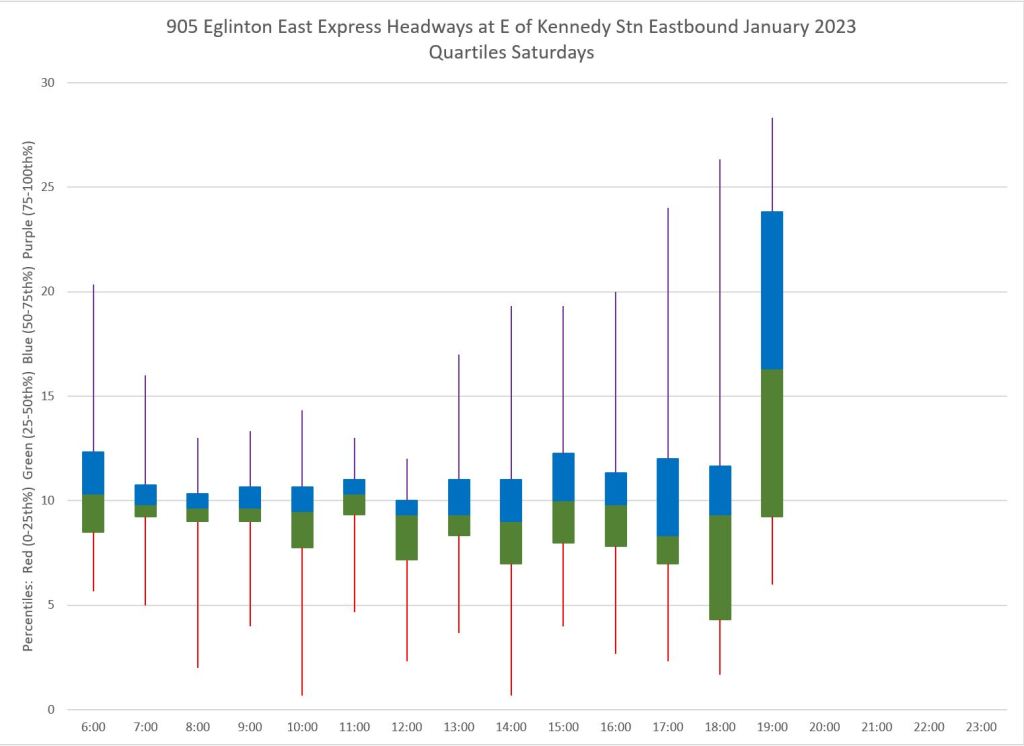
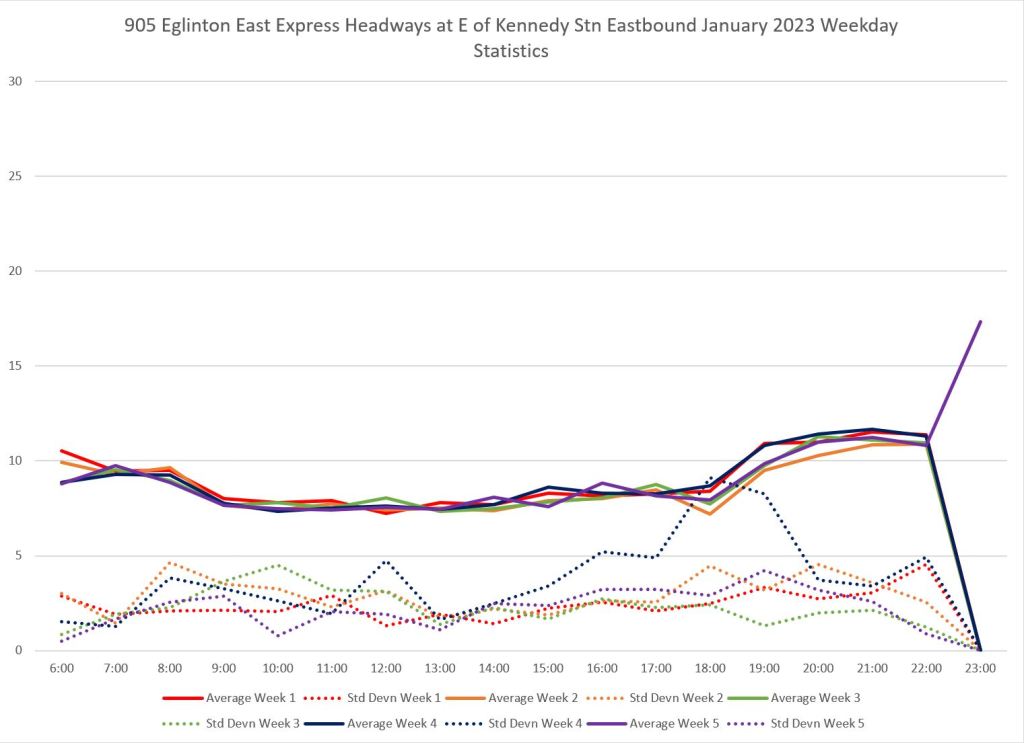
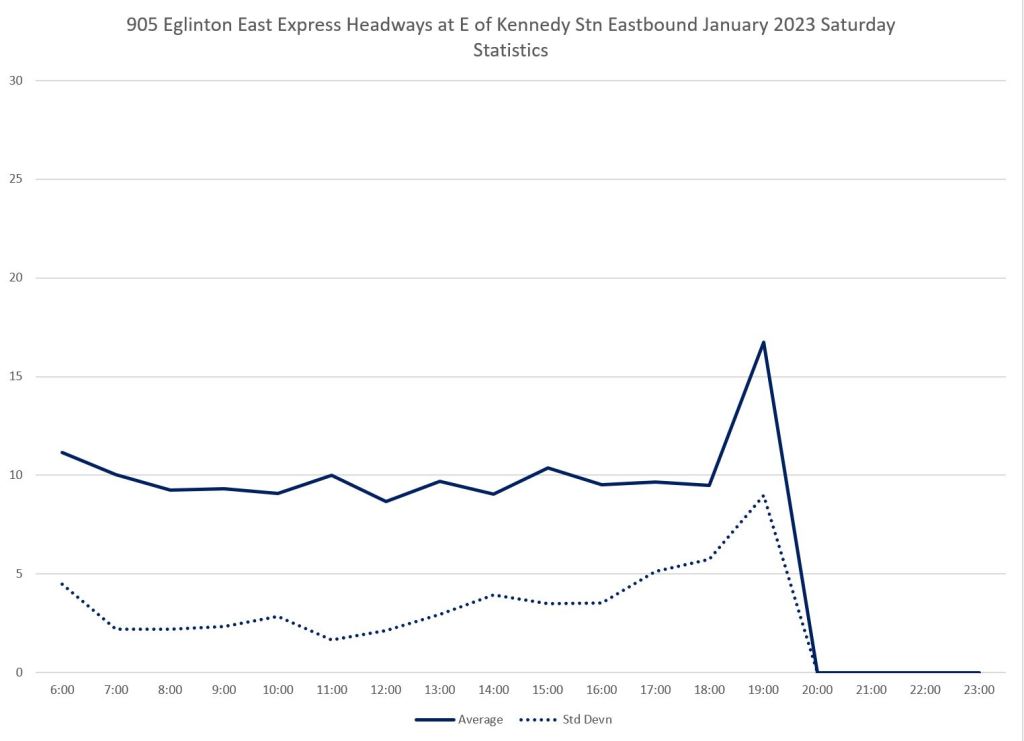
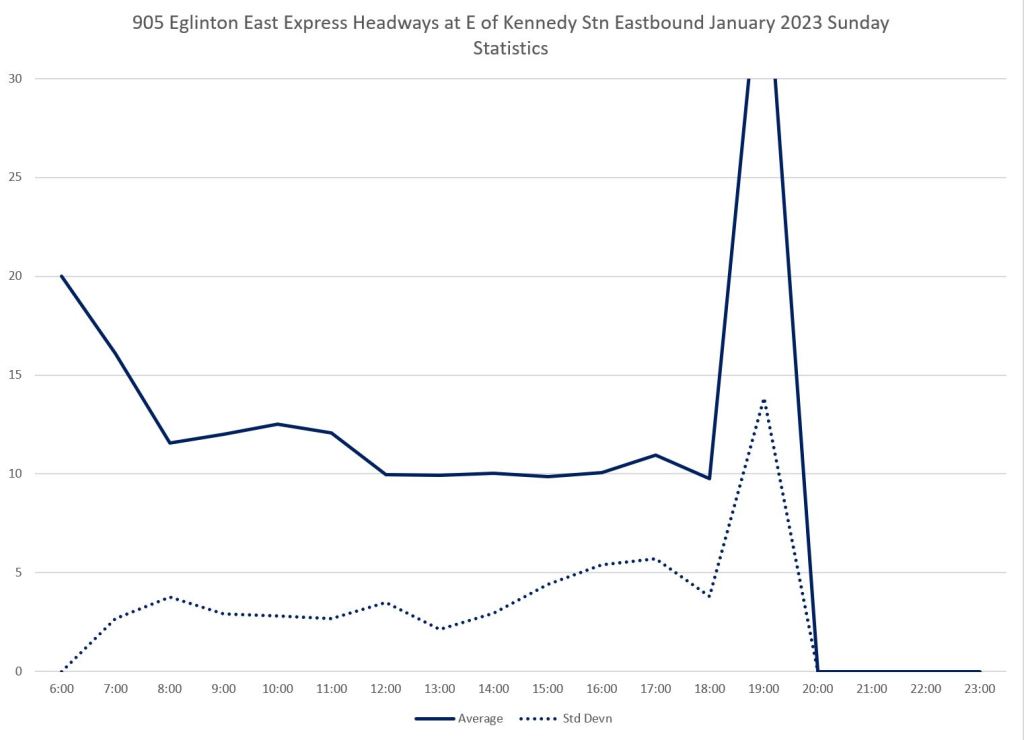
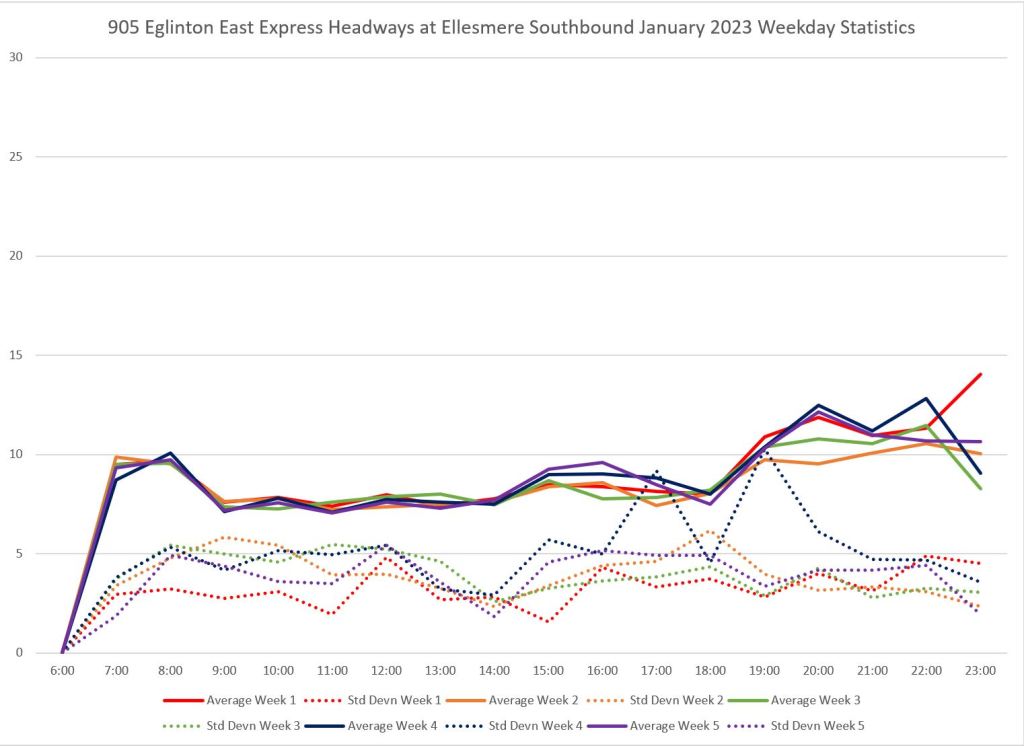
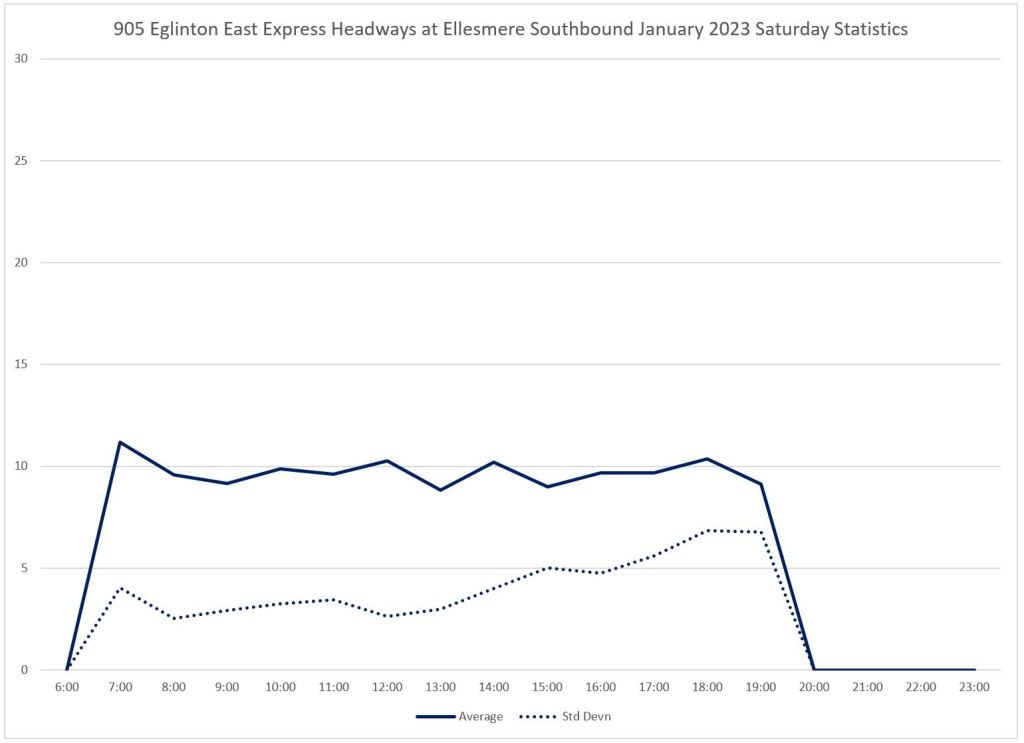
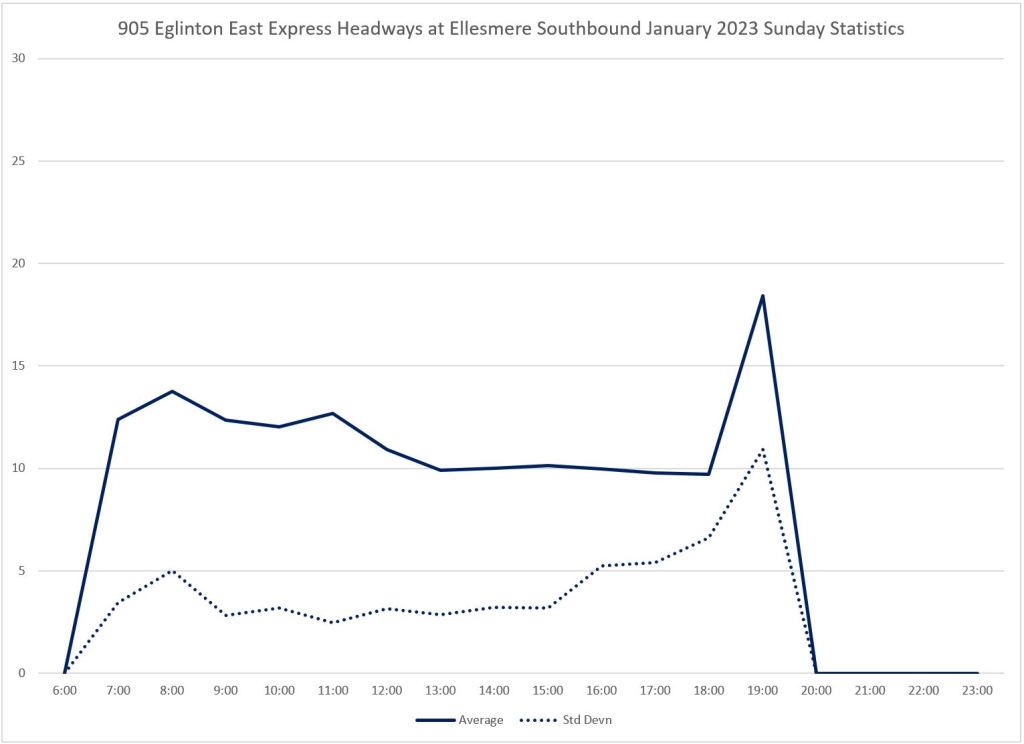
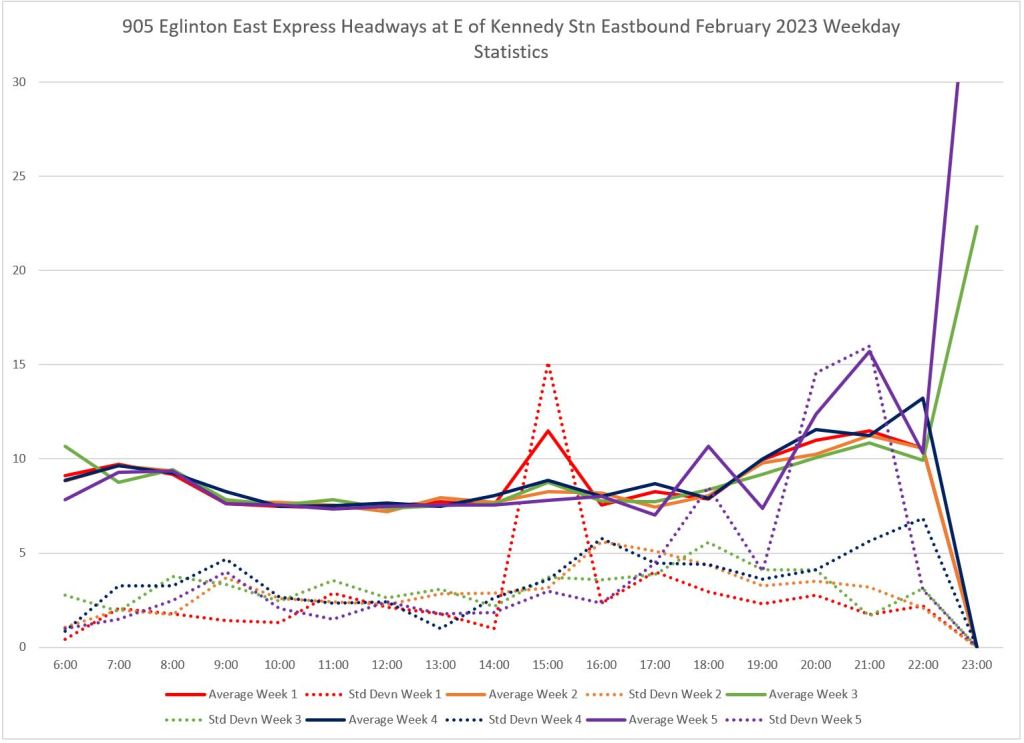
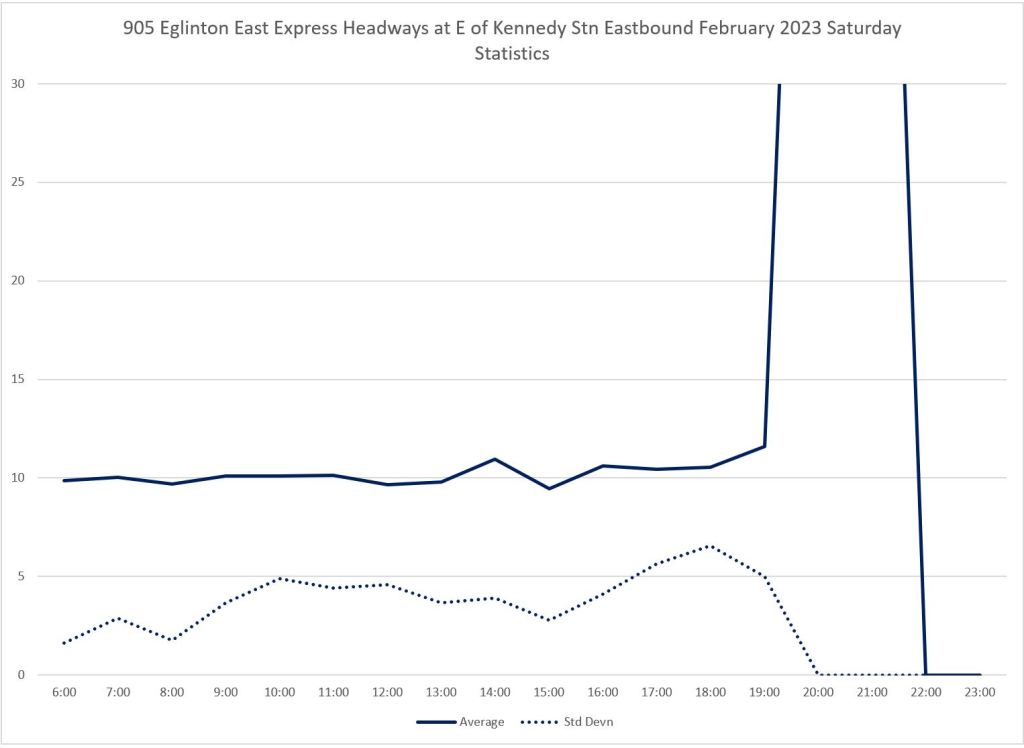
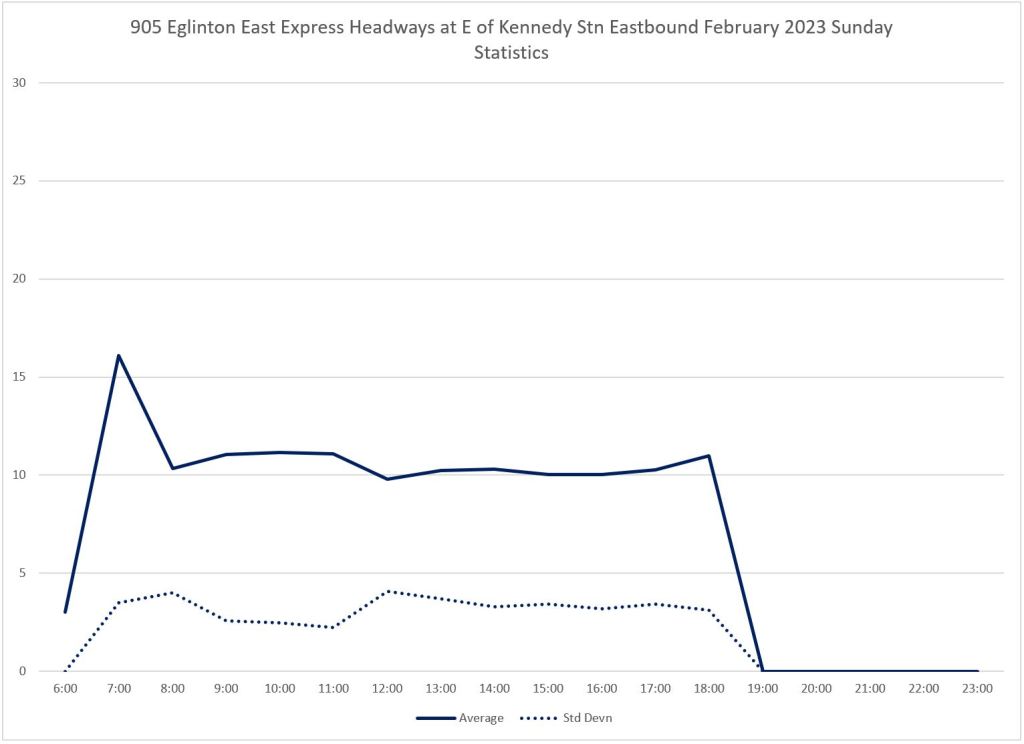
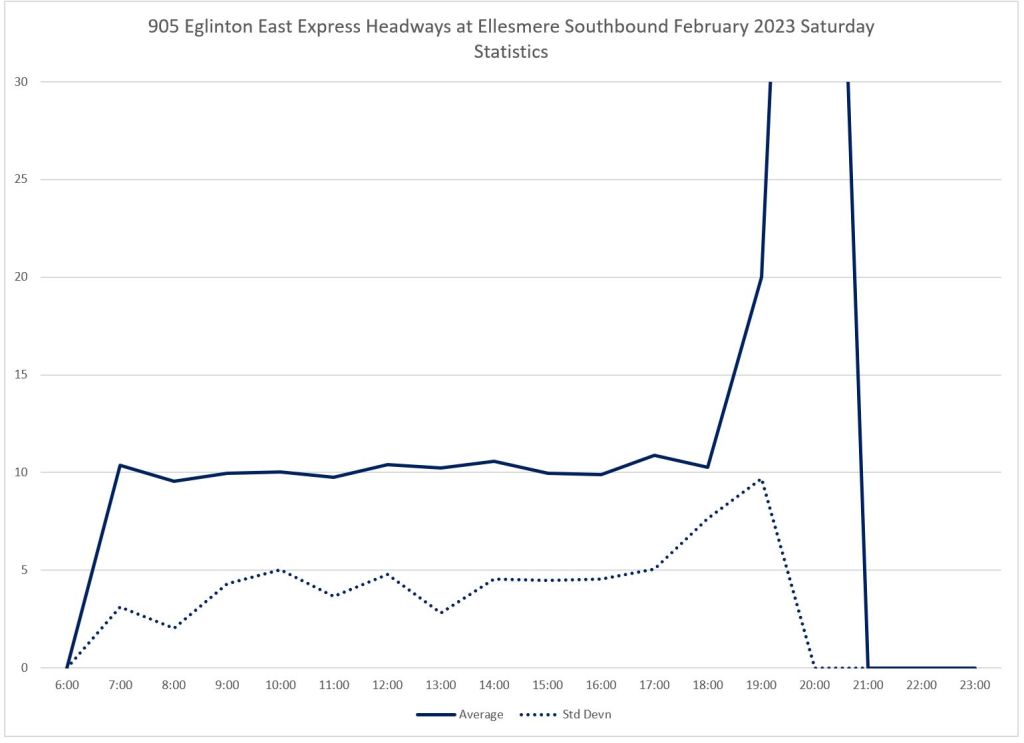
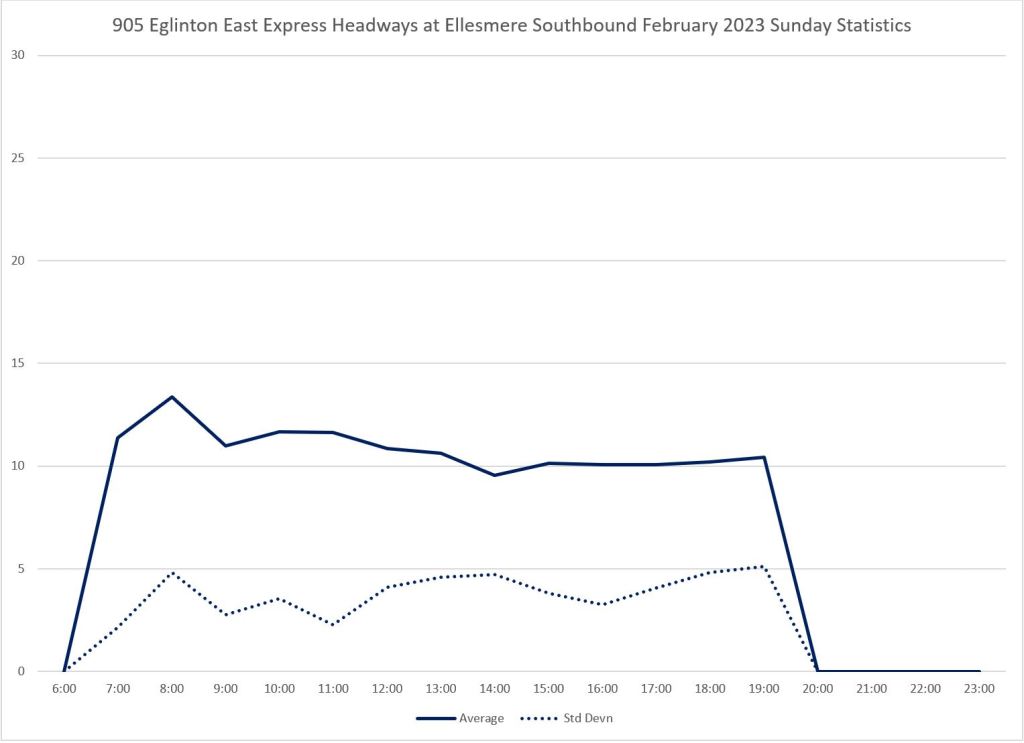
The statistics for the month are consolidated in the charts below. These show the average headways and standard deviation of values by week (left chart) and for weekend days (middle and right). If the dotted line (SD) is close to zero, then the headway values are tightly clustered around the averages. Note how particularly on weekends the SD values climb through the day as service reliability degrades.
The TTC makes a big fuss about on time departures from terminals, but this shows what they actually achieve.
Southbound From Ellesmere
The outer part of route 905 changed over the past three years, and in order to present consistent historical data in later sections, I have used a screenline at Ellesmere & Morningside. This measures the service leaving UTSC regardless of the route configuration.
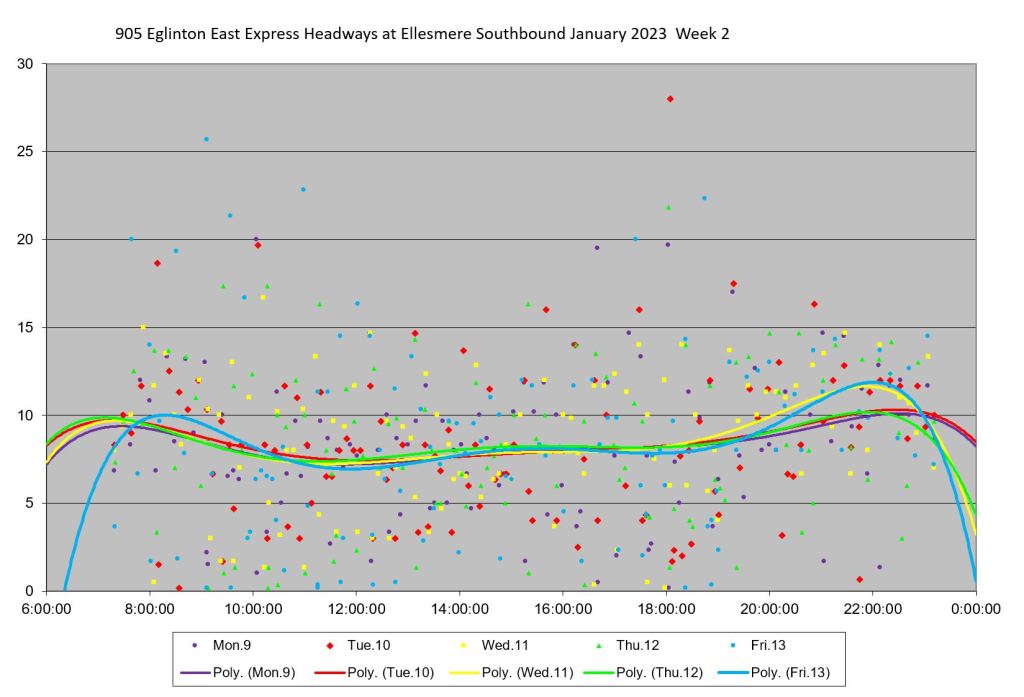
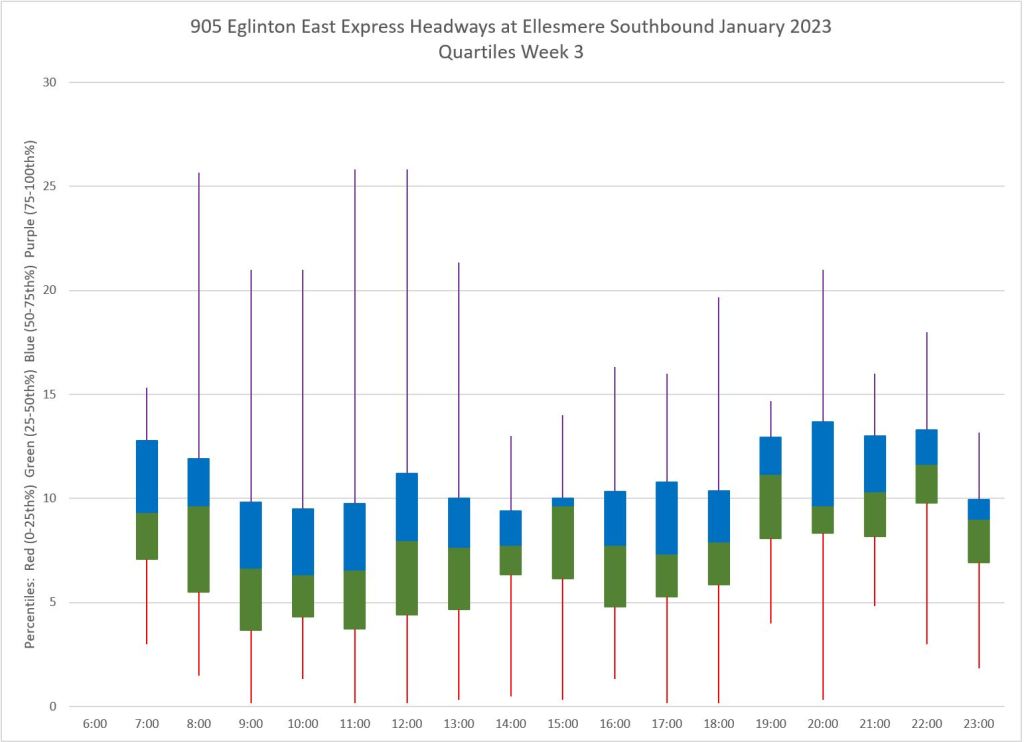
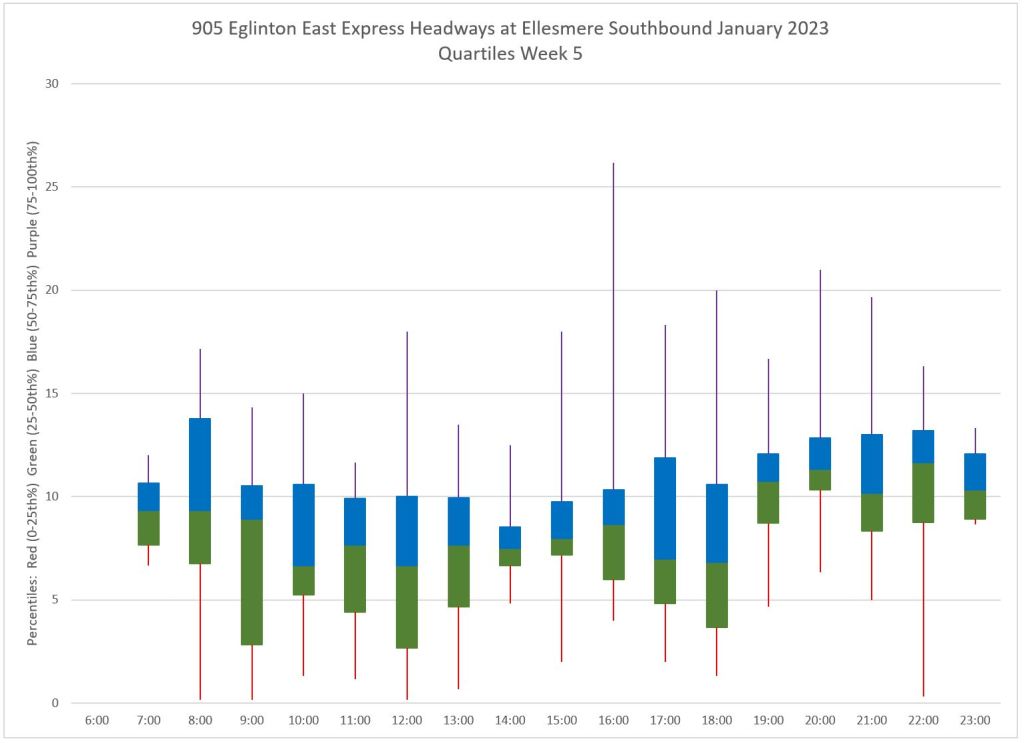
Here are the summary stats. The weekday SD values are higher than those at Kennedy Station showing a greater variation in westbound headways compared to eastbound service. This is also reflected in the quartile charts above where the middle 50% of headways lies over a wider span for westbound data.
February 2023
Here are the same charts for the month of February. As in January, very short headways (points near the horizontal axis) show that bunching is common within the month on weekdays and weekends.
Eastbound From Kennedy Station
Summary statistics:
Southbound From Ellesmere

Summary statistics:

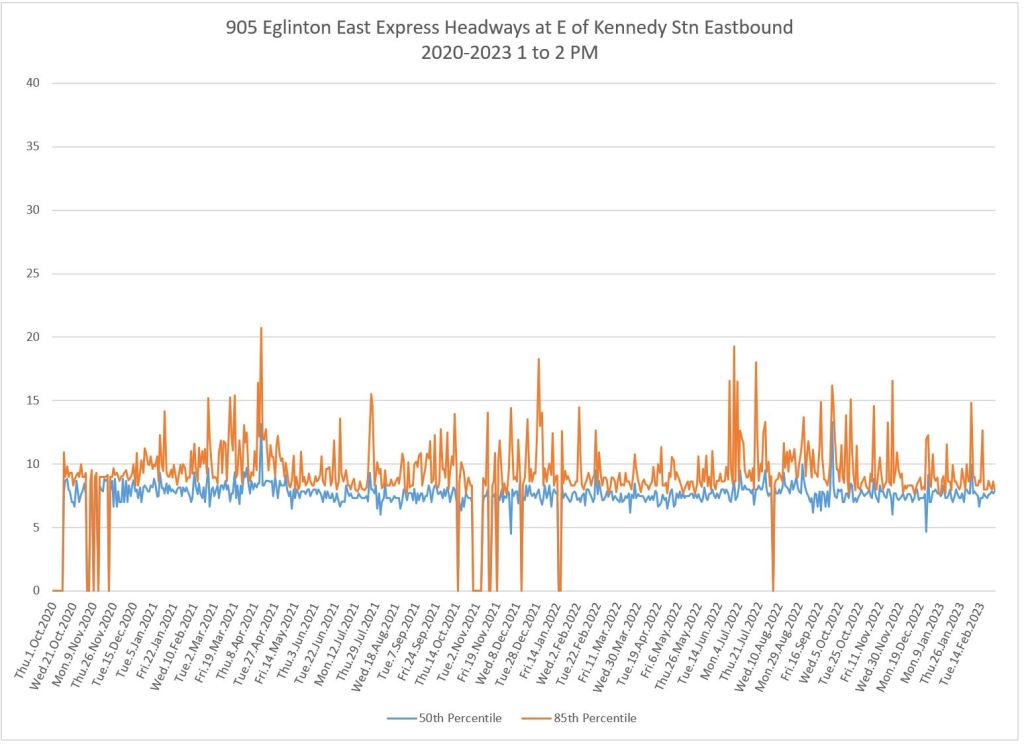
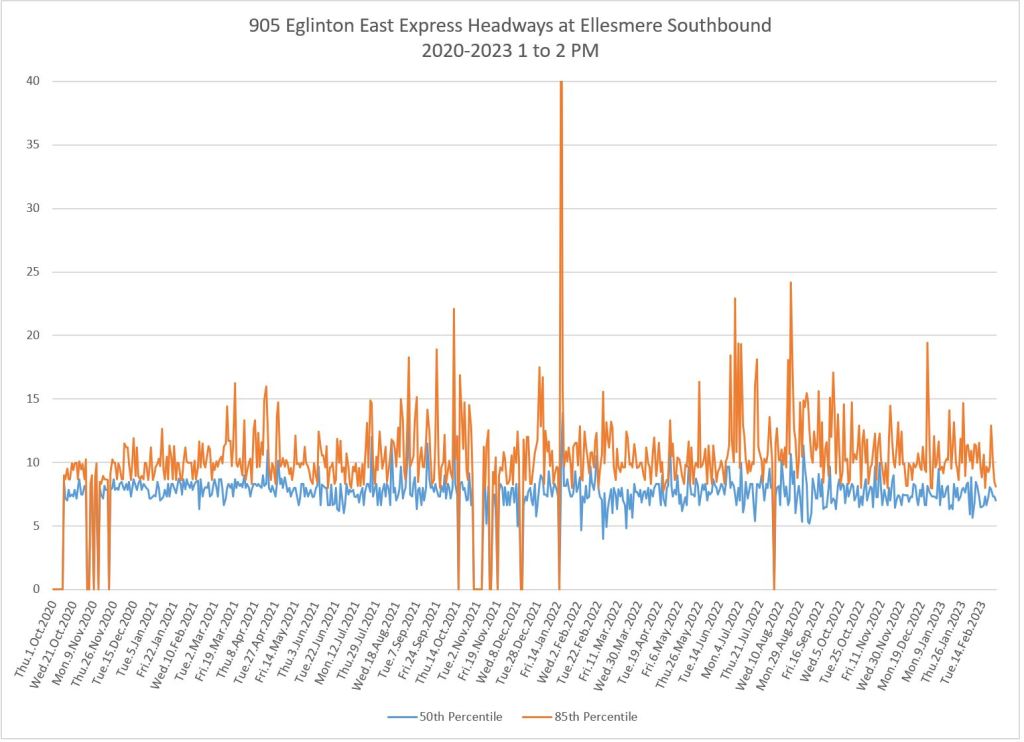
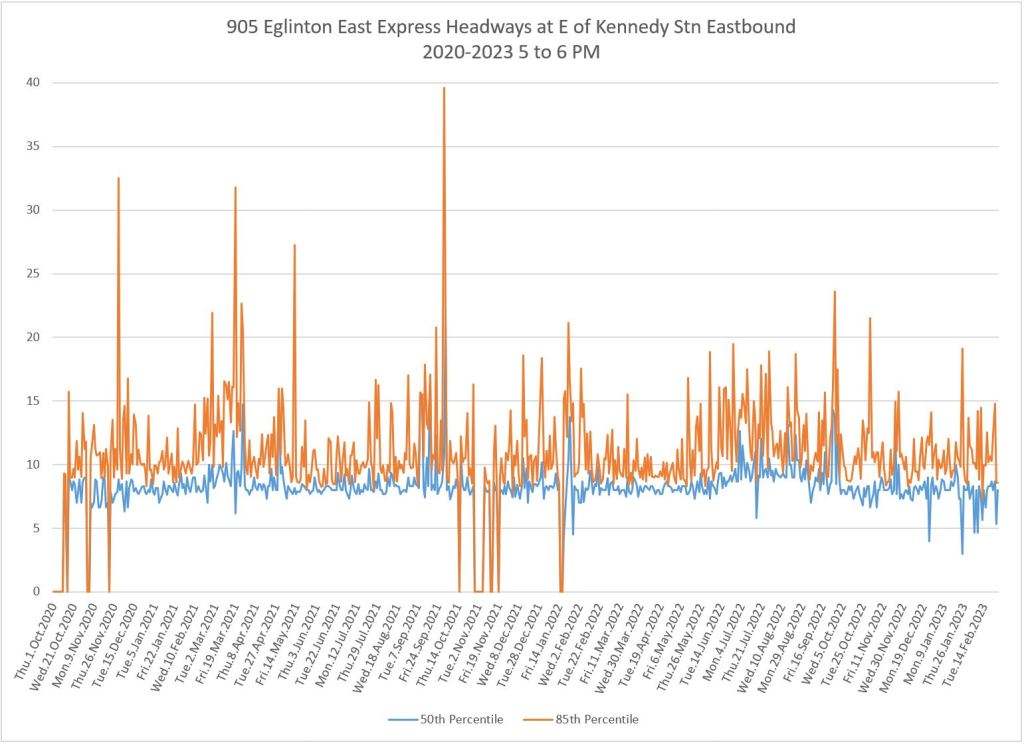
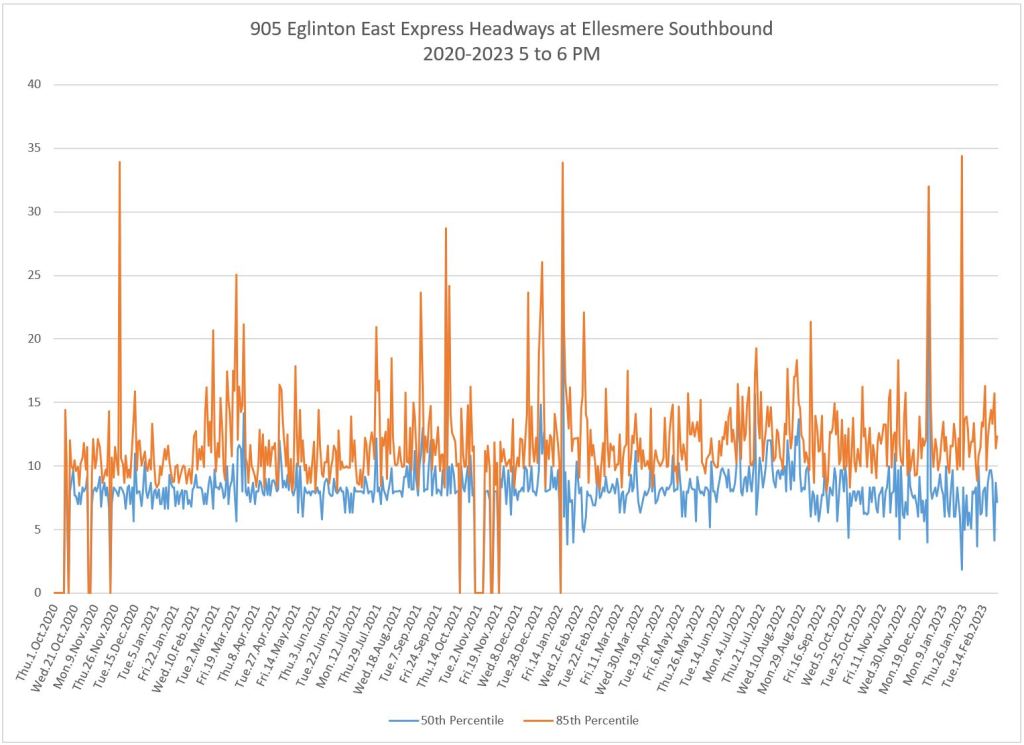
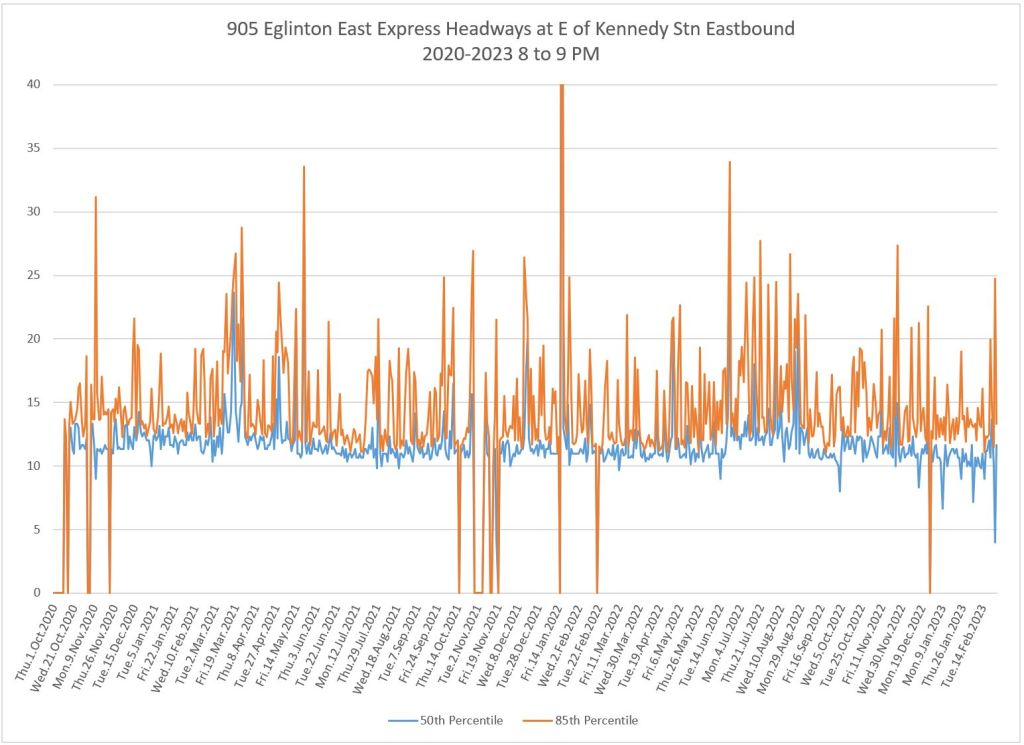
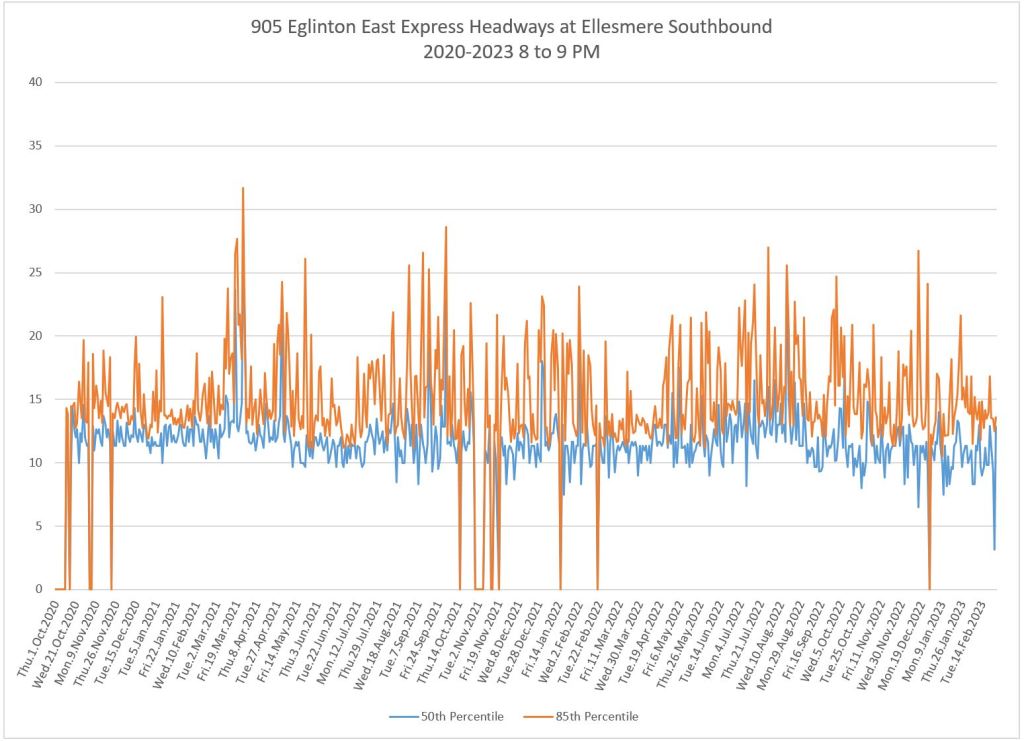
Evolution of Headway Values From 2020 to 2023
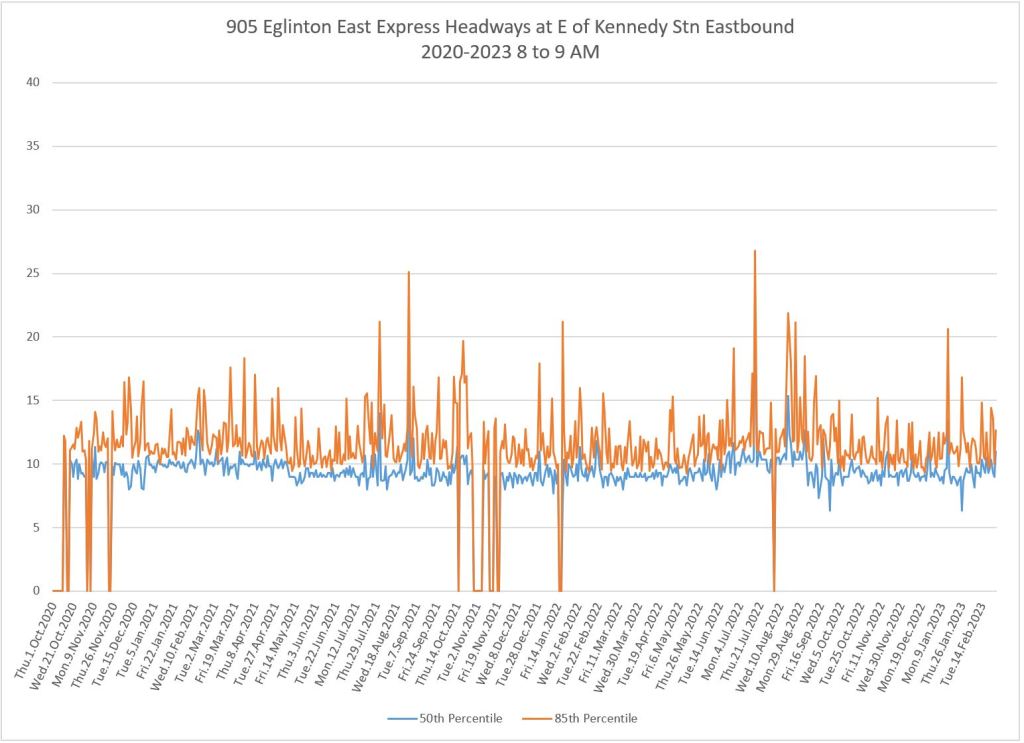
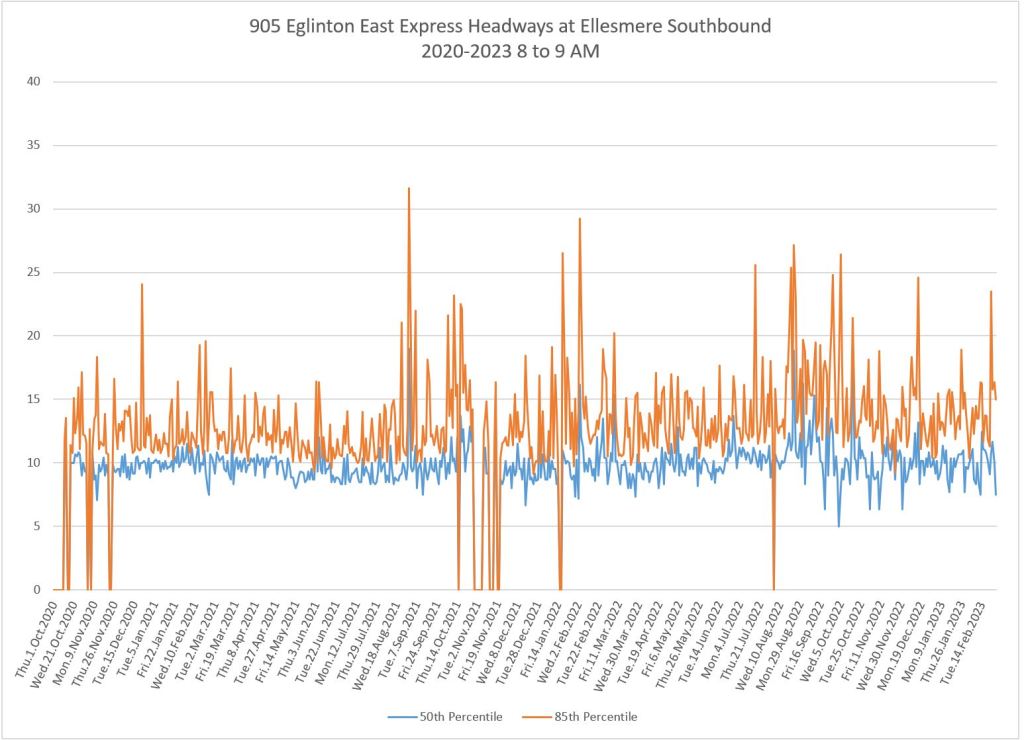
The following charts show the headways on a day-by-day basis for weekdays from October 2020 to February 2023. There are two lines on each chart:
- The blue line shows the median value of the headway. Half of the buses are closer together, and half are further apart than this line.
- The orange line shows the 85th percentile of the values. About 1/7 of the headways are higher than this value, and the rest lie below.
The degree to which these two values are close are further apart gives some indication of the spread in values and how this changes from day to day. Where the values are zero, there is no data on the day and for the hour in question.
The scheduled headway has not changed much over the interval. Of note is the degree of “spikiness” in some charts particularly in the 85th percentile line. This shows that there can be substantial fluctuation in rider experience from one day to the next. Moreover, the 85th percentile runs well above the median particularly in the PM peak and evening.
The charts below are arranged with eastbound service on the left, westbound service on the right.
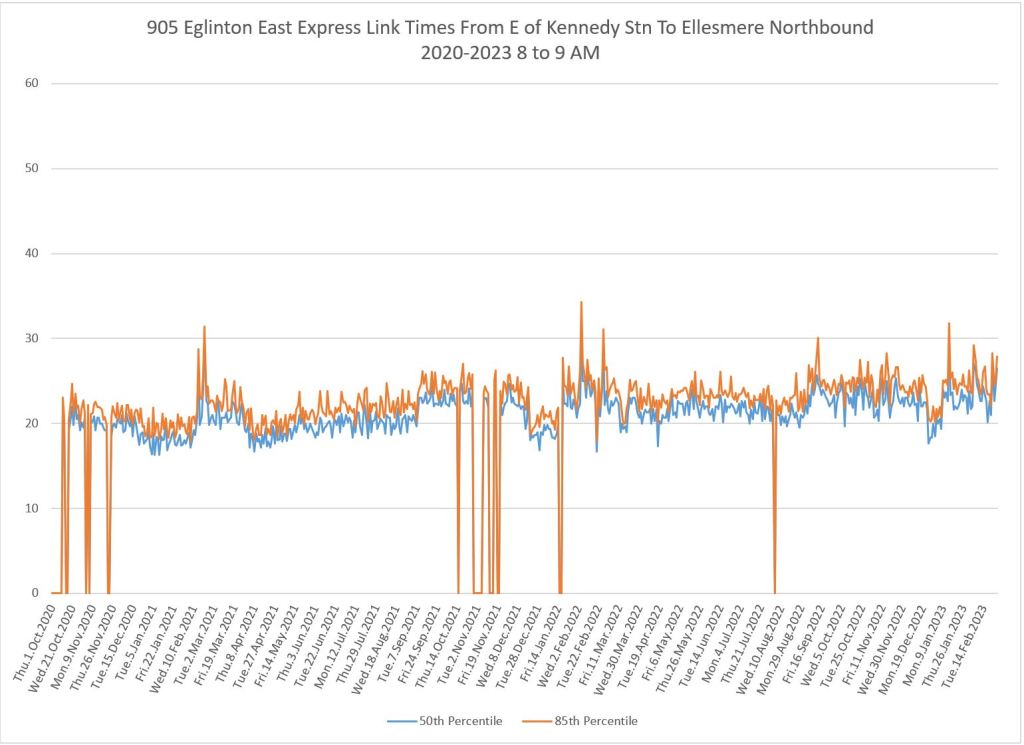
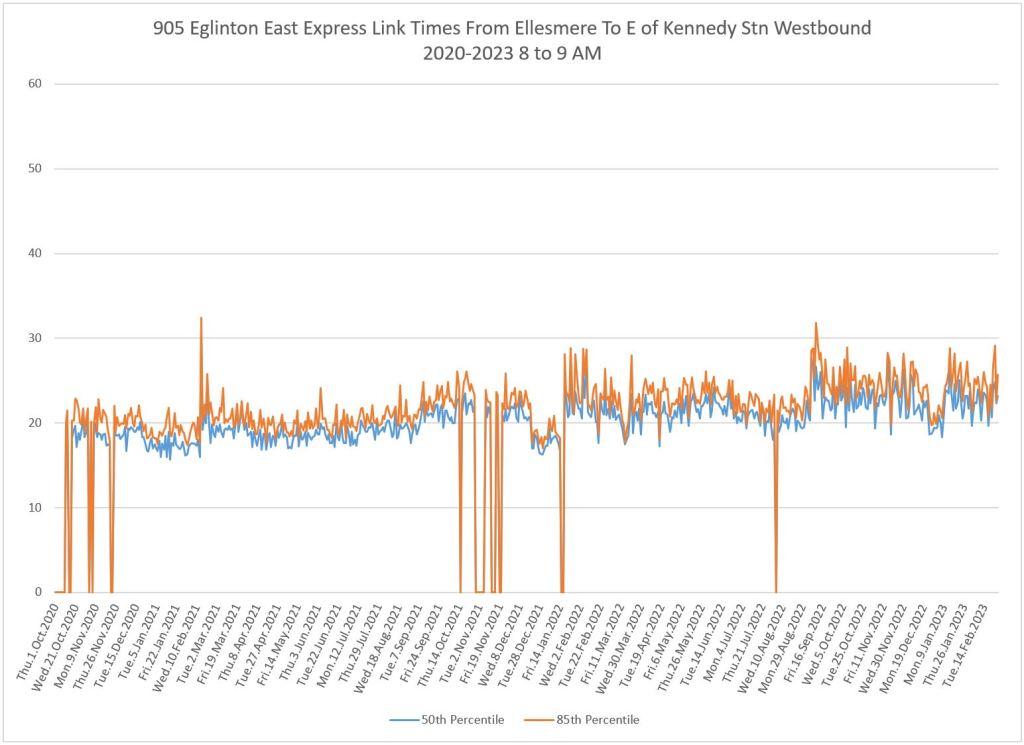
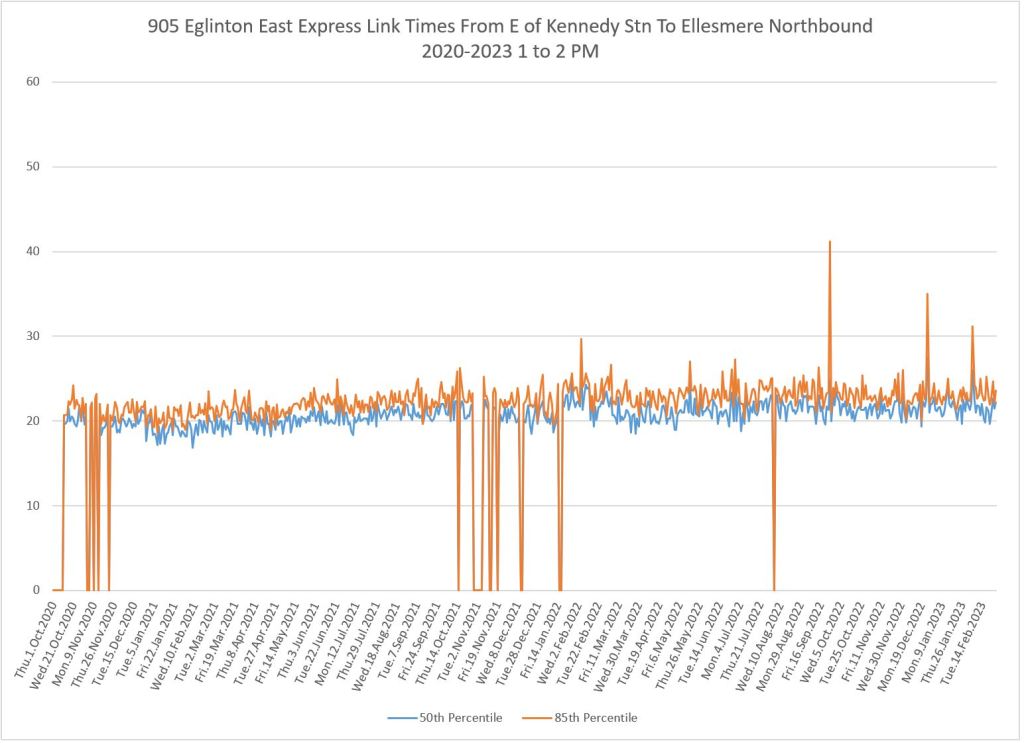
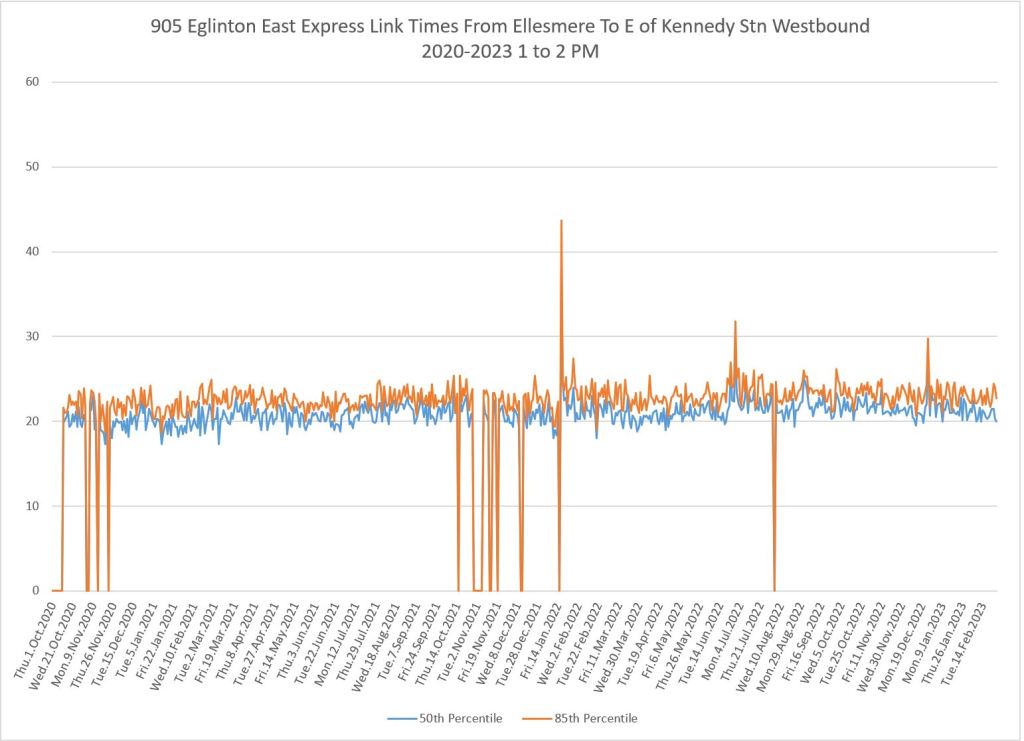
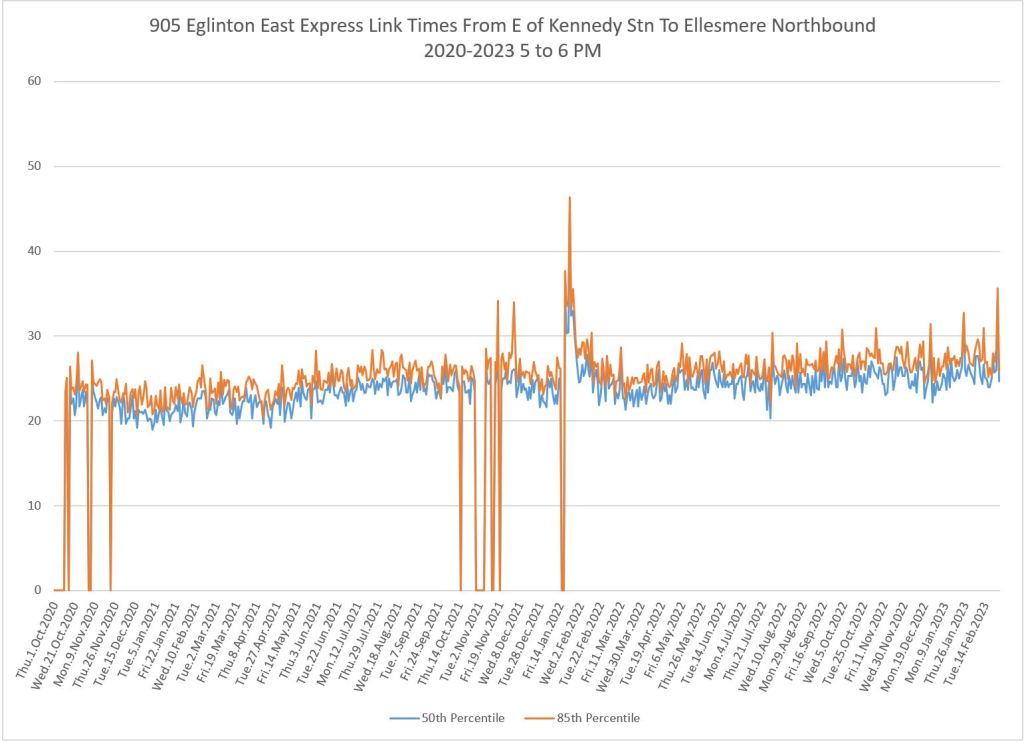
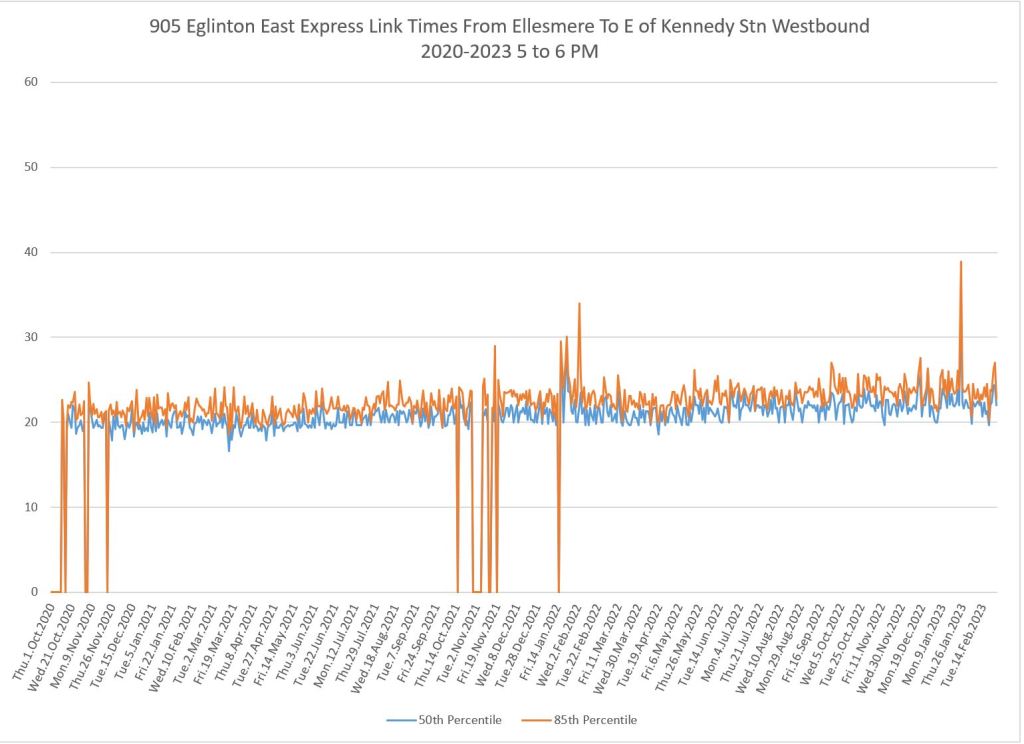
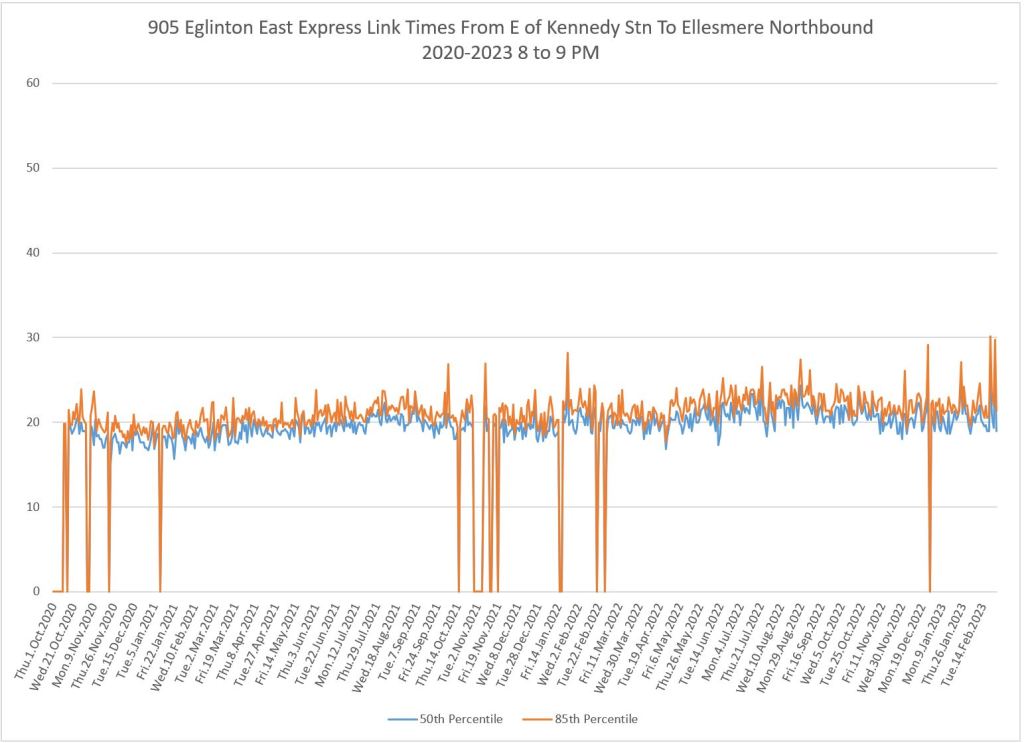
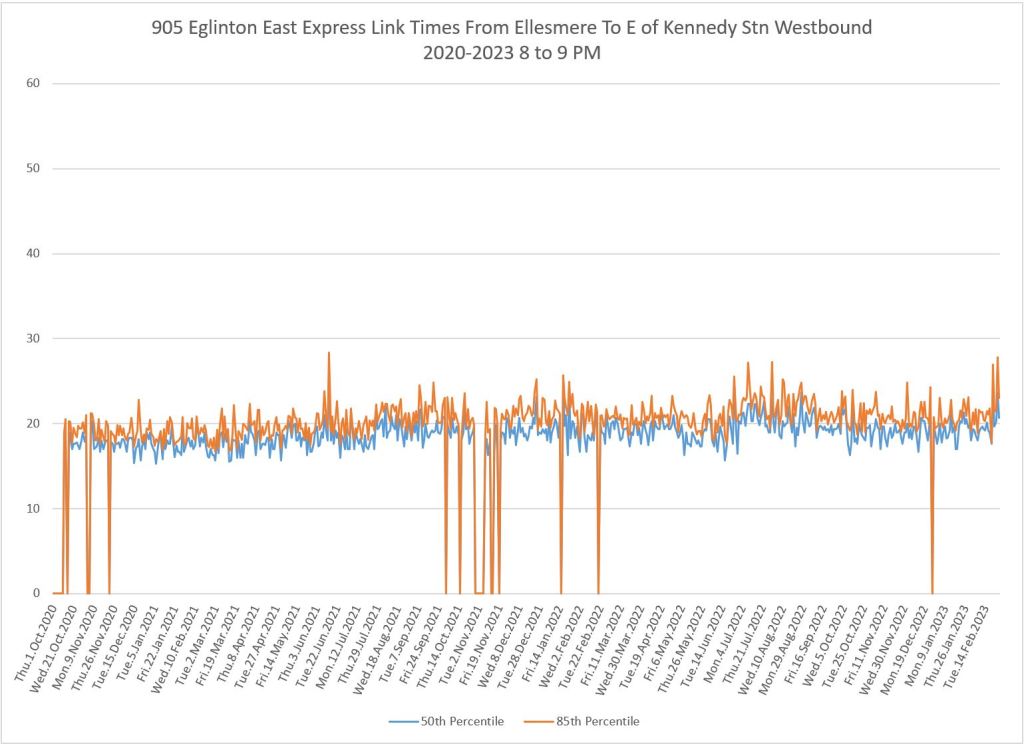
Travel Times
The Eglinton East Express operates for much of its length on the RapidTO red lanes in Scarborough. The charts below show the median and 85th percentile of travel times between Kennedy Station and Ellesmere in the same format as the headway charts above. A few points of note:
- There are marked drops in AM peak travel times for the Christmas and New Year’s holiday period especially in 2021. The drop in 2022 is visible, but smaller. In 2021 there was the combined effect of the holiday and the onset of a new lockdown period.
- The spike in January 2022 particularly in the PM peak was due to a severe storm. Even with the red lanes, some weather overwhelms transit’s ability to operate. The effect lasted for several days probably due to a combination of slow snow clearing and of express buses operating as local service during the storm and its aftermath.
- The effect in 2023 is much less than for the 2022 storm.
- Travel times have grown consistently but only slightly over this period. By contrast, other routes saw a bigger covid era drop and a more robust recovery of typical traffic conditions. This shows the leavening effect of the red lanes on variations in travel times. (Analysis of this will appear in future articles.)

I hoped someone in Planning also looked at moving the 905 platform. The current platform is sandwiched in the middle of the station. It’s already tight for standard 40ft buses to get in and out. Also layover space is limited as is, buses are using the Green P lot and or north/south service roads to wait for departure times.
LikeLike
Which garage will be is it at? Birchmount division?
Steve: No. Malvern.
LikeLike
Will this route move to Malvern from Birchmount for using articulated buses?
Steve: Yes.
LikeLike