
Effective in mid-October the City of Toronto began implementation of reserved bus lanes on the Eglinton-Kingston-Morningside corridor between Brimley Road and University of Toronto Scarborough Campus (UTSC). This is intended to be the first of several transit priority measures that will be rolled out over coming years.
I will address the City report listing the various candidate routes in a separate article. This piece reviews the behaviour of the 86/986 Scarborough local and express services as the BRT lanes, dubbed RapidTO, came into effect.
Work to install them began at the outer end on Morningside, and then worked south and west. The full extent to Brimley on Eglinton is not yet in service and so the effect will continue into November. The data presented here show results to the end of October 2020.
Concurrently with the transit priority lanes, the TTC reinstated the 986 Express service that had been suspended in the spring. True to TTC form, the express buses are faster than the locals, but the headways are quite irregular making the saving from a faster trip a tradeoff against a potentially long wait for an express bus to appear at your stop.
This article reviews service on the 86/986 Scarborough routes. I will turn to 116 Morningside in a separate article.
Summary
The introduction of reserved lanes and the removal of stops in the Eglinton-Kingston corridor has resulted in a small reduction in travel times for 86 Scarborough buses over this portion of the route.
The effect increased slightly from week 3 to week 5 of October, and it somewhat offset the growth in travel times as road traffic returns to “normal” pre-Covid levels.
The travel time saving provided by the 986 express service is considerably greater than the saving provided by the reserved lanes.
The variability in travel times on this route did not show the same “before” level seen on King Street (often used as an example of what might be achieved) and the lanes did little or nothing to alter this.
Headway reliability is a severe problem on both the local and express services, and service gaps continue to bring more delay to rider journeys than the time saved by the reserved bus lanes.
Travel time savings, such as they are, are due in part to the removal of stops, not to transit priority per se. Claims made for the benefits of the BRT arrangement should be tempered by the fact that two major changes — reserved lanes and stop removals — were implemented at the same time.
Future transit priority proposals should avoid concurrent changes where the “priority” component’s effect might be artificially enhanced. If the TTC’s desire is to remove stops, this can proceed without waiting years for detailed design and approval of the RapidTO scheme. There must be full public consultation, not a masquerade under the rubric of a “transit priority” scheme.
Removing Stops
One major problem with evaluating the benefit of transit priority is that the TTC simultaneously removed several stops along the corridor. Their argument was that this would make the bus setup akin to a proposed future LRT line, but that scheme is so far in the future, and its funding so uncertain, that the buses will be stopping at the “LRT” stops for a long, long time.
Eliminating stops has different effects depending on the nature of the stop and the road configuration. If a stop is lightly used, then getting rid of it does not represent much of a time saving on average because most buses do not stop there.
If a stop is not at a traffic signal, serving the stop may have less of a penalty for a transit vehicle than at a signal because even if the bus falls out of the “green wave” of traffic, it may lot lose an entire cycle. The same consideration applies to farside versus nearside stops.
Responding to rider complaints, the TTC reinstated three stops and will monitor usage. An important consideration is that a stop could be busy at certain times of day, but not for the entire 18-hour cycle of service. There is a danger in saying “only x riders per hour” used a stop on an all-day basis. Other important concerns are the walking distance to stops, the layout of nearby housing or jobs, and the challenges of mid-block crossings for would-be riders on fast-moving arterial streets.
Travel Times Between Kennedy Station and Morningside
For the 86/986 Scarborough services, the BRT lanes cover the portion of the route as far east as Morningside. For the purpose of tracking the evolution of travel times and speeds, the charts in this article cover the route from Kennedy Station eastward although the BRT lanes will only come as far west as Brimley. The reason that the lanes end short of the terminal is that construction of the Scarborough Subway Extension, possibly beginning in 2021, is expected to disrupt traffic and road lane layouts between Kennedy Station and Brimley road.
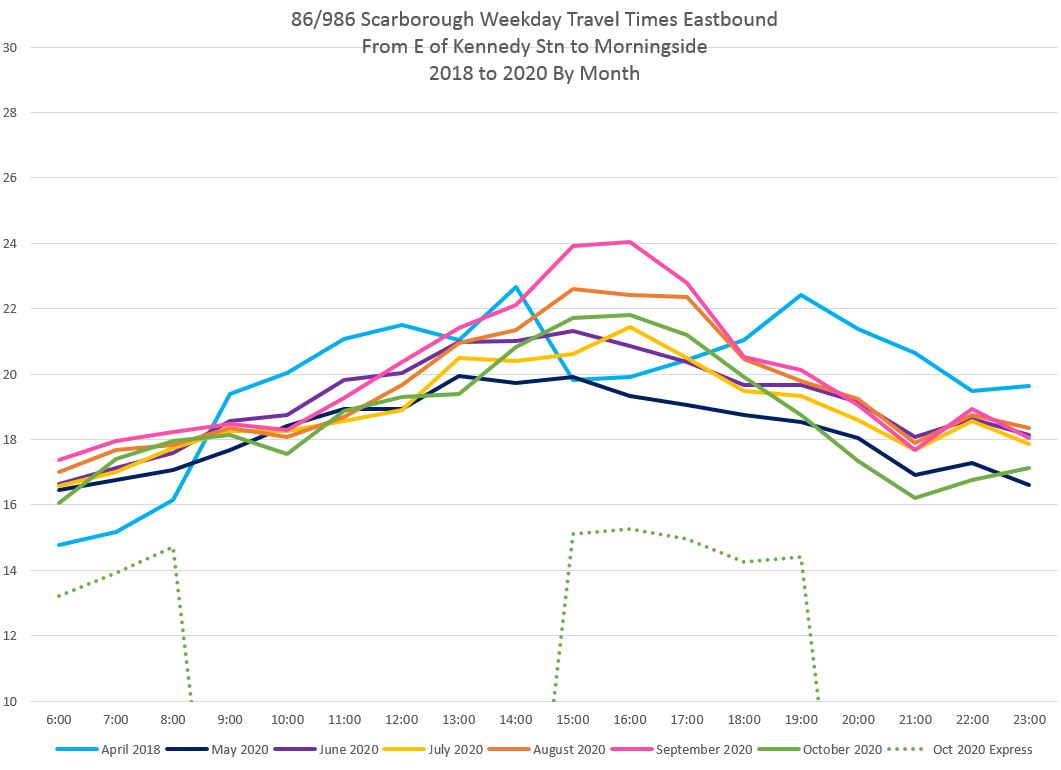
The chart below shows the evolution of weekday travel times eastbound from May to October of 2020 with April 2018 as a comparator. Several points should be noted:
- The data for express service in October is shown separately as a dotted green line. This service only operates during peak periods.
- The April 2018 data combines local and express services because, at the time, they all ran under “route 86” and it is difficult to distinguish these trips in the available tracking data. The effect is that the turquoise line in the chart below dips down in peak periods because the average travel time includes some faster express trips.
- In the 2020 data, there was no express operation until mid-October, and that was under its own route number “986”.
- The May 2020 data have generally the lowest values and corresponds to the trough in traffic levels during the early part of the Covid era. Since then, travel times grew, particularly in the PM peak, to September (pink) but then fell back in October (green) thanks to the BRT changes.
- The saving in travel time for the express service versus the local is considerably larger than the saving to the local service due to the BRT changes.
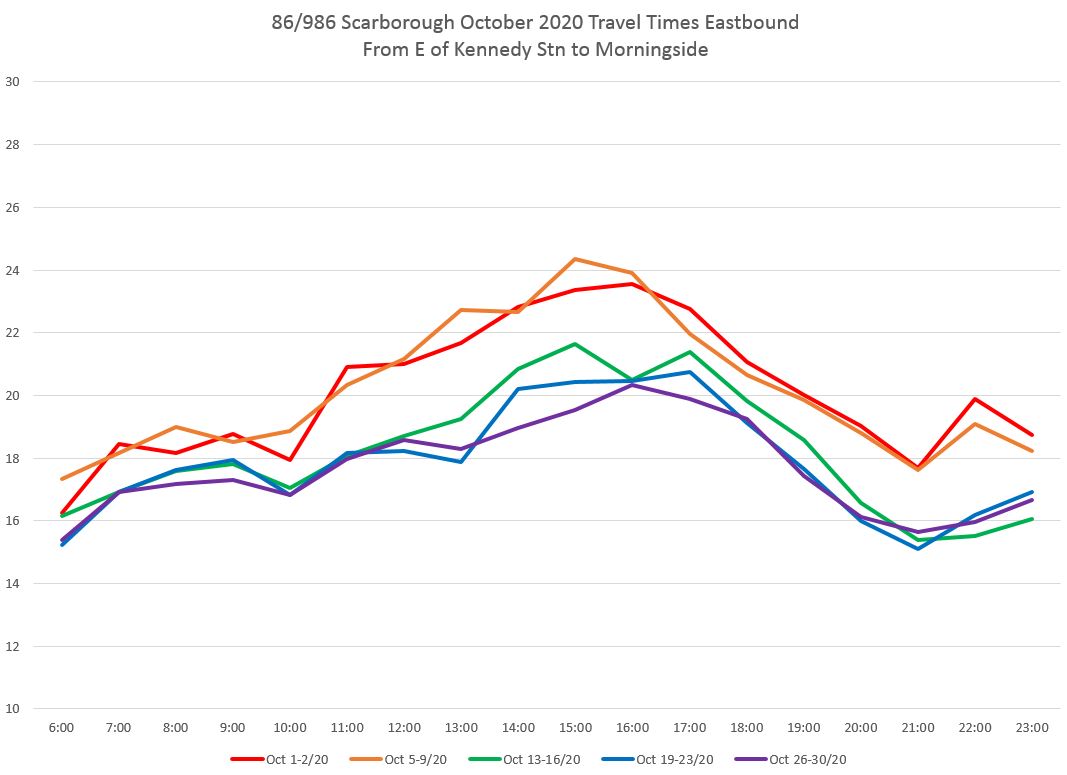
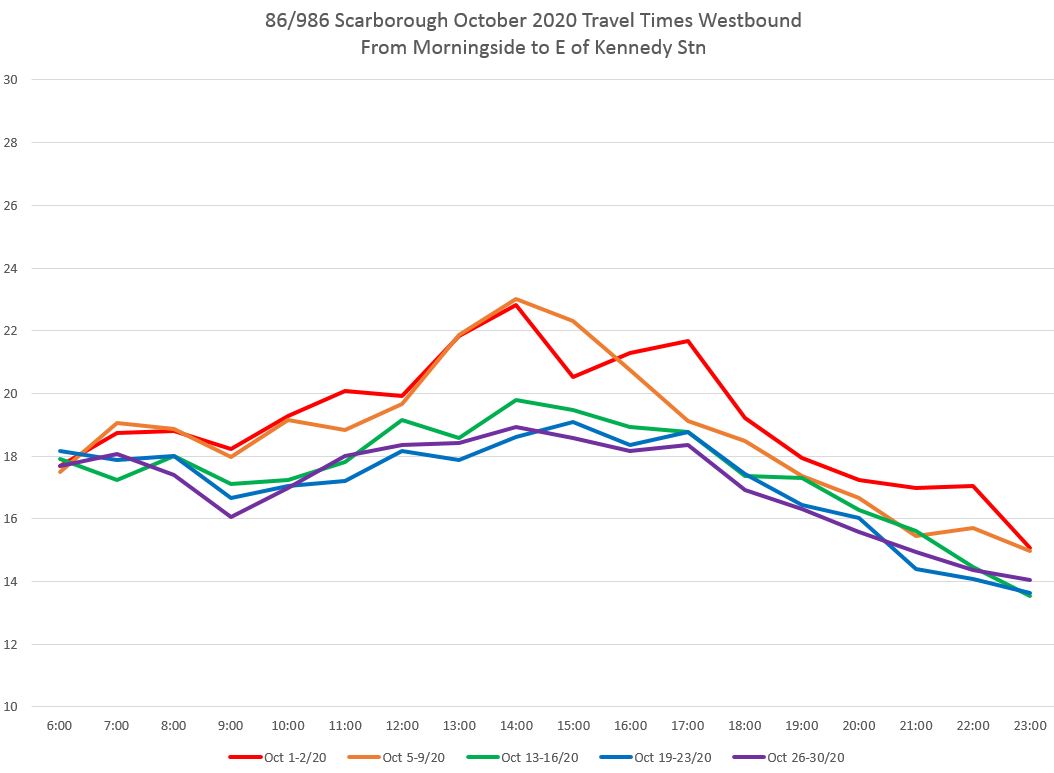
The local service during October shows the change in running times of 2-3 minutes with the pre-BRT weeks in red and orange, while the post BRT weeks are in green, blue and purple.
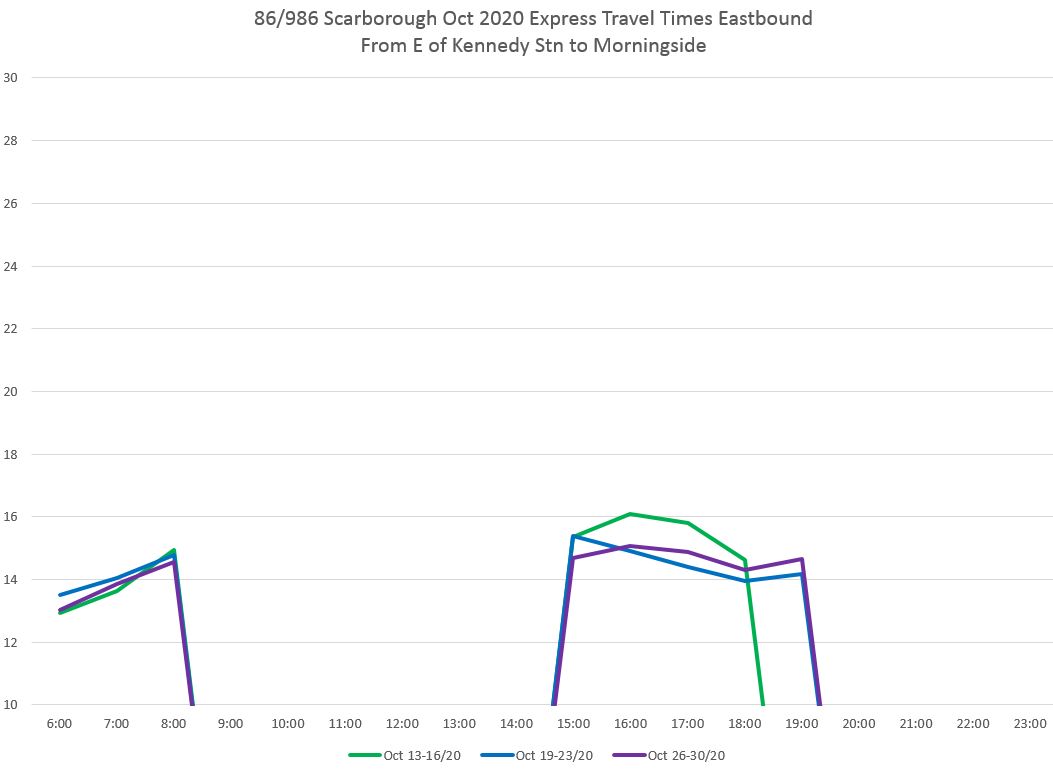
Here are the data for the 986 express service for the three weeks that it operated.
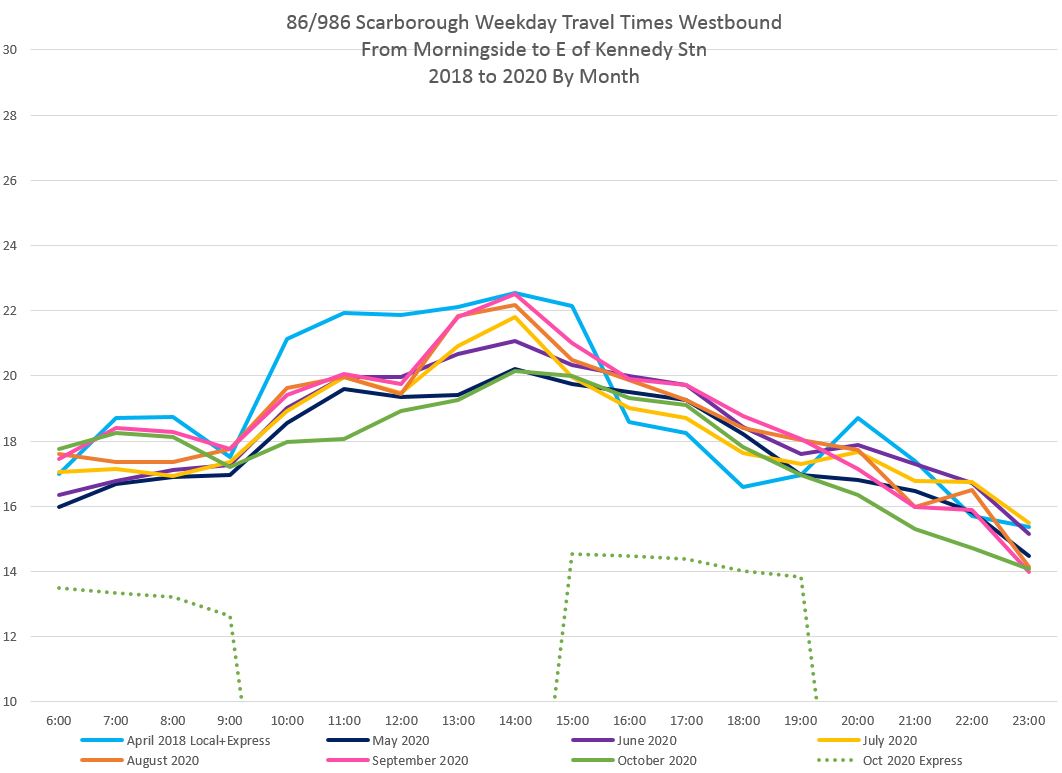
The corresponding charts for westbound service are similar.

The charts above average the date over weekly or monthly periods and do not show the day-to-day variation in route behaviour, if any.
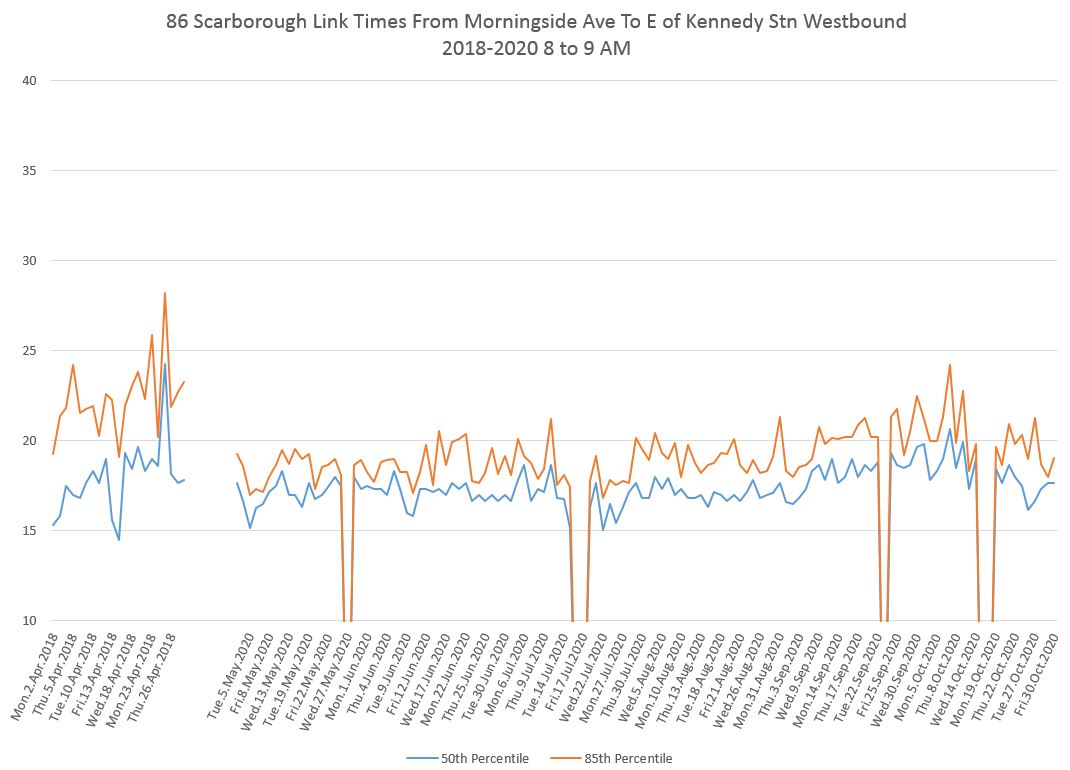
The chart below shows the 50th (median) and 85th percentile values plotted on a daily basis for four representative periods of the day.
- Eastbound in the hour between 8-9 am is counter-peak and there is very little change in travel times.
- Note that the 50th and 85th percentiles are further apart in April 2018 because this includes both the local and express services, and the data points are spread over a wider range.
- The downward notches in 2020 data correspond to periods of outages in the VISION tracking system.

There is a notable change in the midday travel time eastbound.

PM peak travel times show the gradual buildup from May to September followed by some dropoff, but not back to May levels, in October.

As with the midday data, there is a drop in running times in the evening.

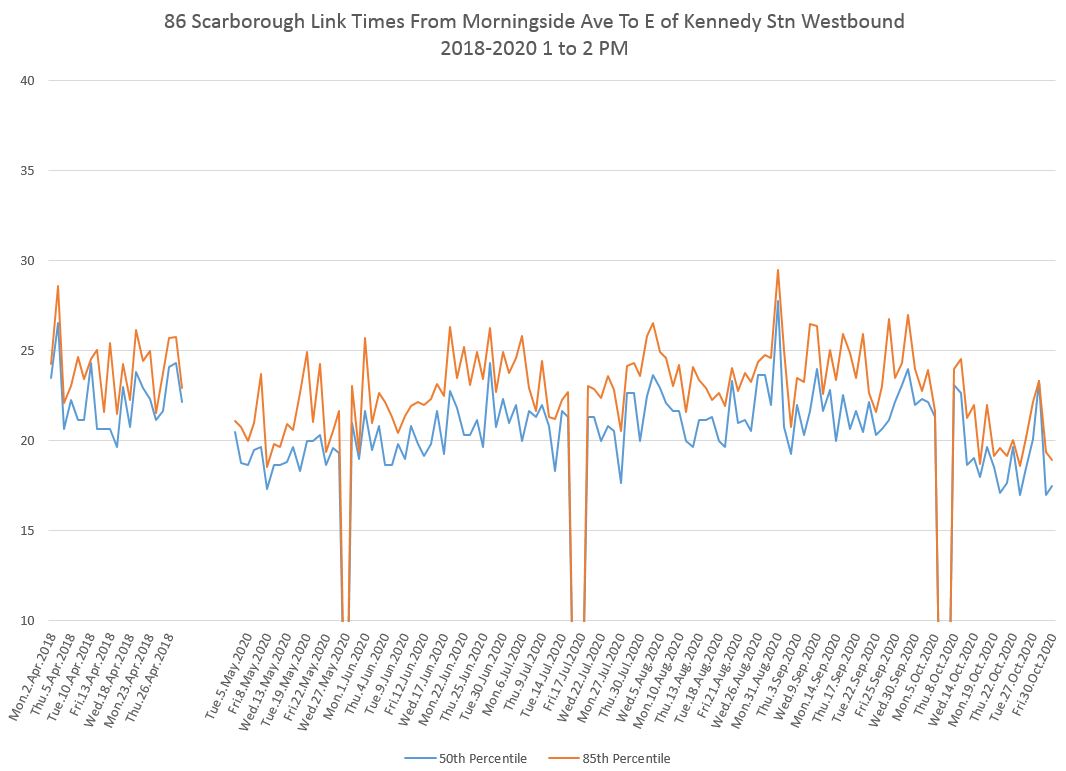
Here are the corresponding charts for westbound service.
The AM peak shows a slight rise in travel times beginning in August with a decline in mid-October.
As with the eastbound data, the westbound midday data show a drop in travel times.
The PM peak westbound data are similar to the AM peak.

In the early evening, travel times fell slightly in October.
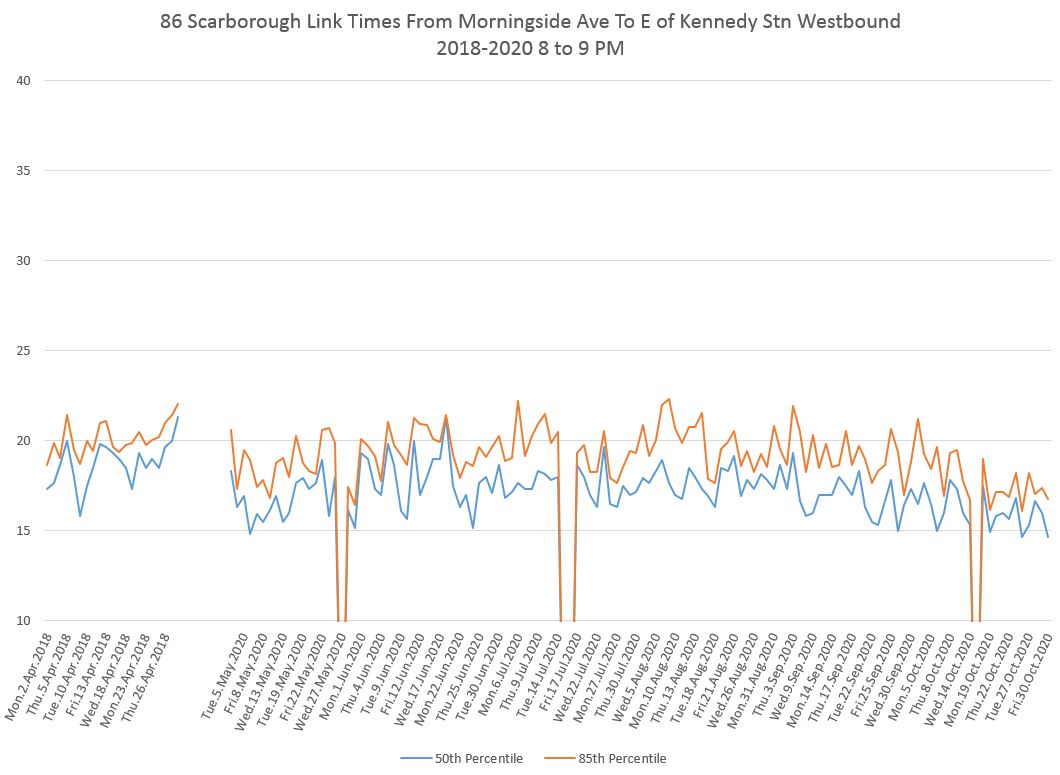
A common point about all of these charts is that the values do not bounce around much, nor is there a wide gap between the 50th and 85th percentile. This contrasts with the situation that existed on King Street before the transit priority scheme went into effect there and made a visible difference in the variability of travel times.
Headway Reliability
An essential part of any transit experience is the reliability of headways, or the spacing between vehicles. Riders are more sensitive to wait time compared with in-vehicle time because it is (a) unproductive and frustrating, and (b) occurs in whatever weather conditions prevail.
A faster trip in a warm bus is of little use if buses arrive unpredictably leaving riders to languish in the snow unsure of when it will arrive or if it will have room for them.
Travel time savings through any priority scheme will only “fix” reliability problems if severe congestion was the underlying cause of headway variability in the first place. This was a problem on King Street, but data do not show a similar problem on the 86 Scarborough route.
To compare the “before” and “after” conditions, the following charts compare actual headways in September and October 2020.
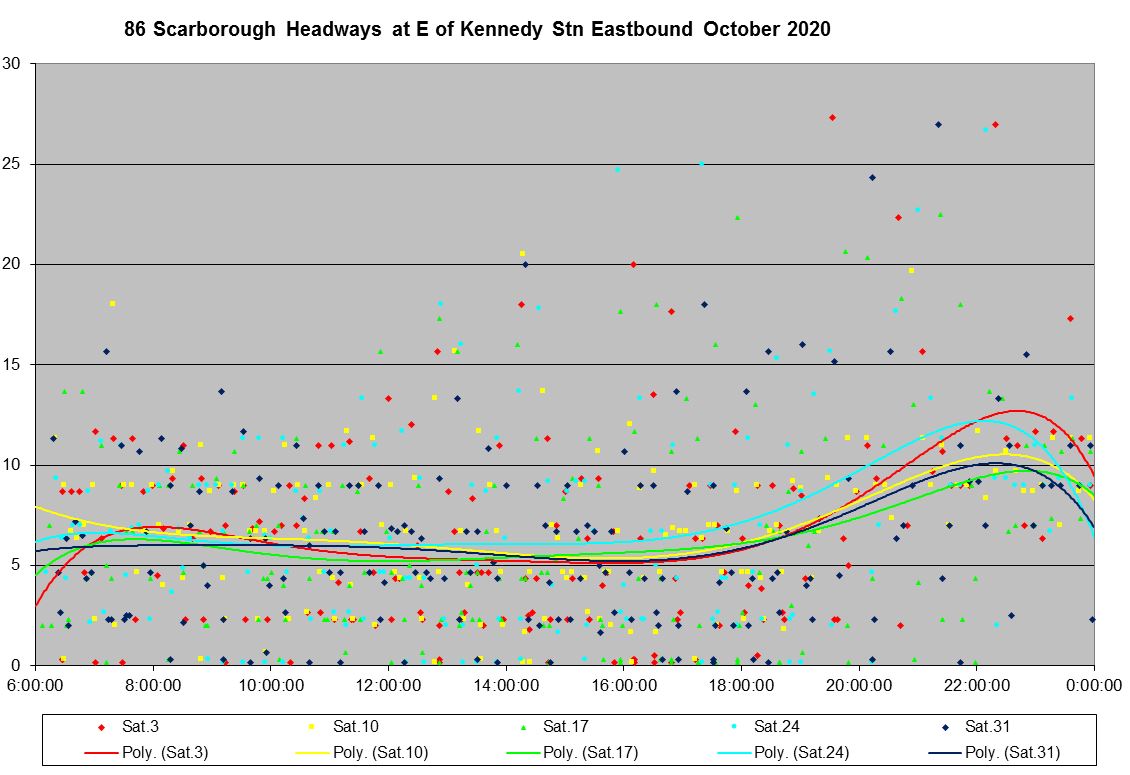
Eastbound from Kennedy Station
Service leaving Kennedy Station is measured at a screenline at the traffic signal just east of the overpass. This has a side effect that is quite visible in the data because the traffic signal “marshalls” buses into spacings that are a multiple of the signal cycle time. It does not matter what headway the schedule says should apply, the buses will cross the intersection every time the signal turns green.
In September, the service eastbound from Kennedy Station is only on the 86 local service for the entire month. The headways lie mainly in a band from zero to 10 minutes, but with some higher values particularly in the evening as scheduled service declines. Note that buses running in pairs (dots at or very close to the horizontal axis) are not unusual exceptions.

In October, there are somewhat more buses on headways above 10 minutes, and service with the new schedule that took effect on October 13 is actually less reliable than what it replaced.
The new schedule also saw the return of the 986 express service. Headways on this route vary considerably especially in the afternoon peak when they lie mainly in a band from 5 to 20 minutes.


The situation on Saturdays is no different with headways spread out over a broad range in both September and October.


Sunday service shows the same pattern. (Note that Labour Day and Thanksgiving are include here with the Sunday data.)

One might be tempted to say “oh, but Kennedy Station is a construction zone and you cannot expect reliable service there”. This is hogwash (a) because it does not explain the wide range of headways including buses travelling in pairs, and (b) the westbound service is just as bad.
Morningside Avenue is the eastern end of the BRT corridor for 86 Scarborough service. Headways lie over a wide range in both September and October, and the express service is even more disorganized westbound than it is eastbound (above).

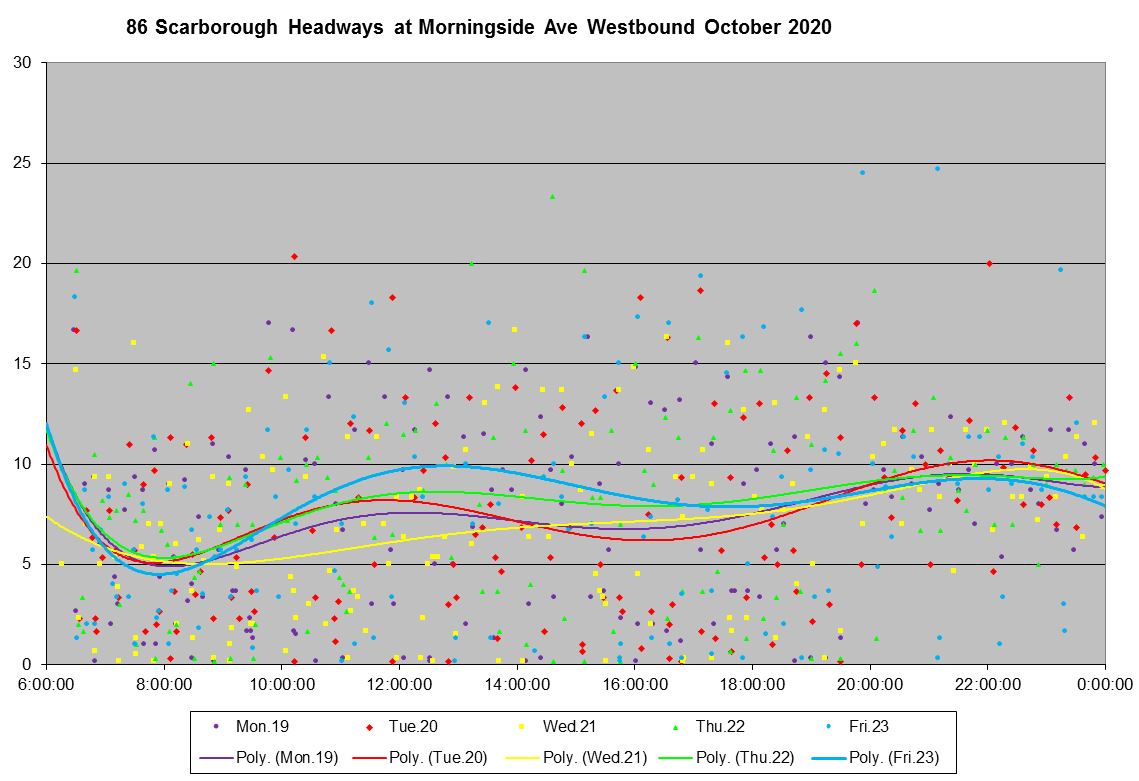

Saturday service shows a wide range of headways in both months.


Sundays show the same pattern.


Oh, you say, “but the TTC only measures service quality at terminals and Morningside is not a terminal”. Here I have to cheat a little because the eastern terminus of 86 Scarborough varies during the day between Sheppard Avenue and the Zoo. In all cases I have shown headways at Sheppard. Trust me: there is no rampant congestion that disrupts service between these points.
Note also that peak scheduled service in late October is less frequent than off-peak because the 986 express buses also operate during the peak.
The same pattern is evident of buses running on a wide range of headways. It is self-evident that the service is disorganized before it every reaches the BRT corridor, and that corridor cannot by itself improve the reliability of service.


Headway reliability is a sore point in every analysis of TTC service. The buses may all be out on the street, but the service bears little relationship to the advertised vehicle spacing. Riders never know when they face a short wait followed by two or three buses, or a long wait peering into the distance wondering if a bus will ever appear.
Travel Speeds in Detail
Finding where and when savings in travel times occur requires a more finely grained look at the data. The charts in this section plot the average speed by buses along the route from Kennedy Station to east of Morningside.
A few notes about reading the charts:
- Kennedy station (west end of the route) is at the left. For eastbound service, buses move left to right across the page. For westbound service, they move right to left.
- Locations where buses stop typically appear as dips in the average speed. For eastbound service that dip will start to the left of the stop as buses slow, and for westbound service to the right.
- There are two or three sets of data plotted on each page depending on the time of day. All pages have the pre-BRT data in green (Oct 1-9) and post-BRT data in purple (Oct 19-30). The week of October 13-16 is omitted because there was a VISION outage and data are missing for two of the four weekdays in that week.
- The stop locations are shown along the bottom of the charts. Stops marked with an asterisk (*) were removed with the BRT conversion. Stops with a double asterisk (**) were reinstated, but this happened some time after the conversion and the data for that period therefore contain a mix of values with these stops removed or active.
Eastbound
Here is the eastbound speed profile for the hour from 8 to 9am. Locations where the green (pre) line peeks out below the purple (post) line are those areas where the service has speeded up. Not how some of these areas correspond to places where stops were removed.
The blue line (express buses) rides consistently higher on the charts than the data for the local services until east of Celeste Drive (GO Station) where the express buses turn into locals.
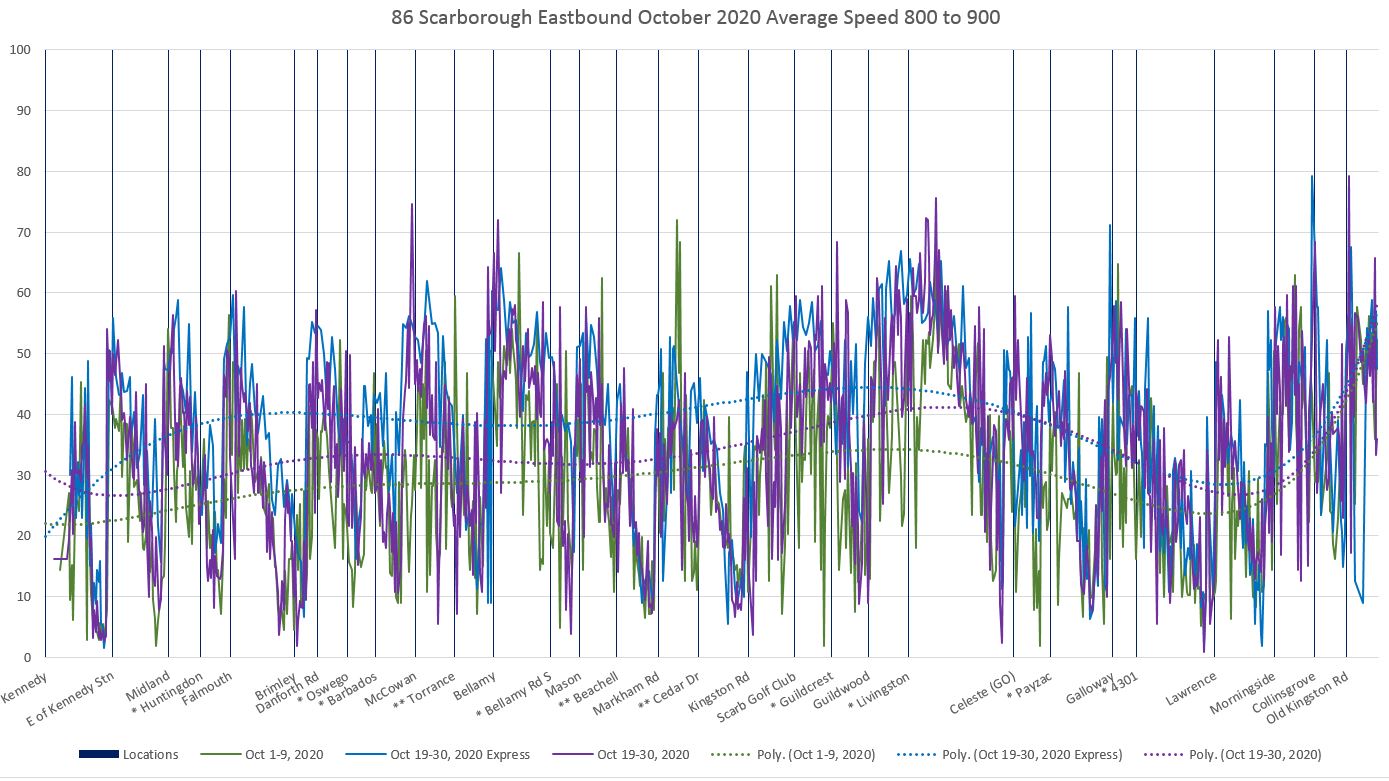
To clarify this relationship, here is a comparison of the pre and post local speeds.

And here is the local vs express comparison post BRT. Note that this is for the counterpeak direction and the savings are smaller than for westbound (later in the article).

The express operation provides a speed advantage, but this is easy to understand considering that there is only one express stop (Markham Road) between the GO Station and Kennedy Station. A more-frequently stopping “express” would not have so strong an advantage.
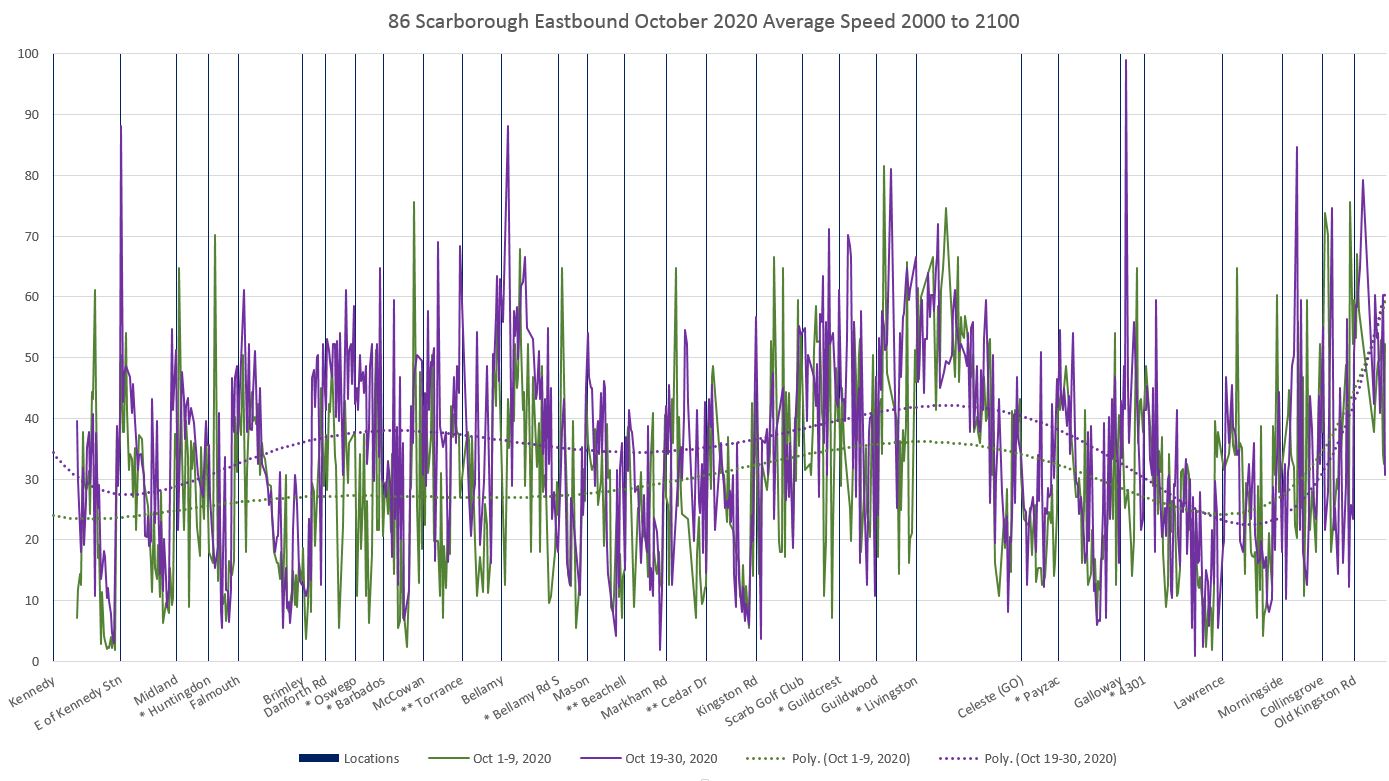
At midday, the differences lie primarily where stops have been eliminated.

In the PM peak, the improved travel speed east of Brimley to Morningside is mainly in locations where stops were removed.

The same pattern appears in the evening with the pre and post values running further apart where stops were removed.
Westbound
The charts below are similar to those for eastbound service, except that the peak directions are reversed. The AM peak is the busier direction westbound.
Here is the comparison of pre, post and express services from 8 to 9 am.
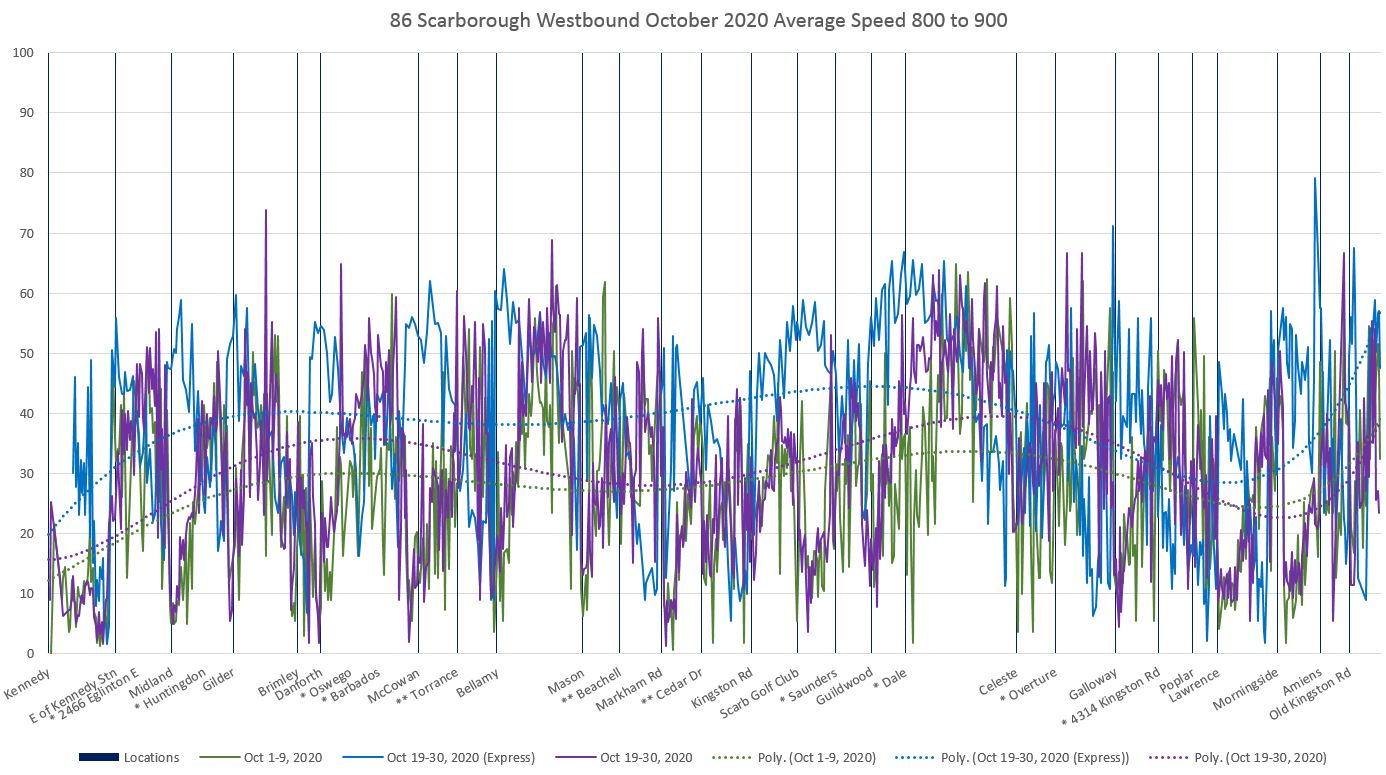
Here is the chart with only the pre and post conversion local services. As with the eastbound service, the larger differences are in areas where stops were removed.

Here is the chart with only the post conversion services showing the difference between local and express speeds in the peak direction. Compare this to the counterpeak (eastbound) chart earlier in the article.

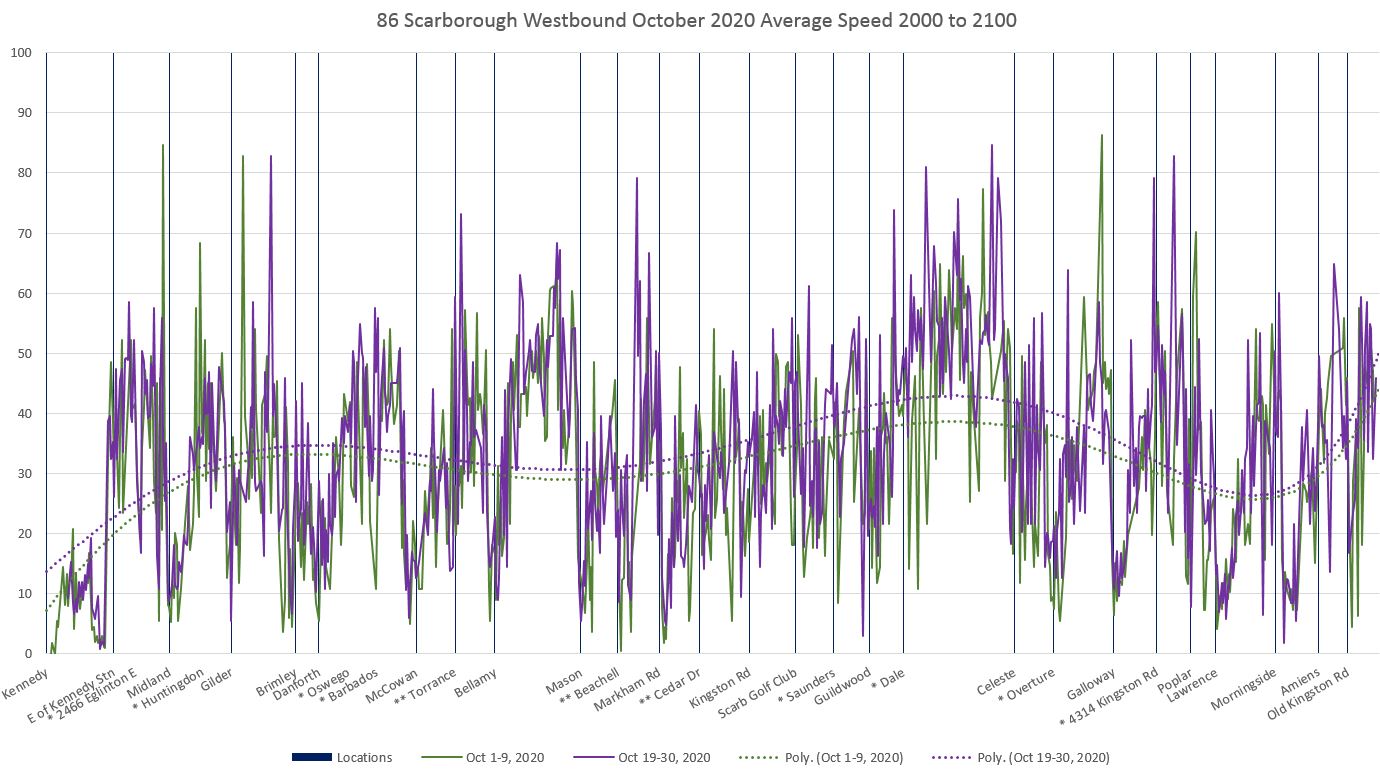
This is the chart comparing mid-day speeds which are similar pre and post conversion.

In the PM peak, the pre and post speeds are similar in areas where no stops were removed, and the express service has better speeds because it stops only for traffic signals and at Markham Road on the trip from the GO Station to Kennedy Station.

The evening service shows little difference between pre and post speeds.
The files linked below contain the charts for the entire day’s operation. By stepping from page to page you can see how the speed profiles evolve from hour to hour.
- Kennedy Station to Morningside Speed Profiles October 2020
- Morningside to Kennedy Station Speed Profiles October 2020
Conclusions
The concurrent implementation of two changes — removing stops and implementing reserved lanes — confuses the benefits each action confers. In several of the speed charts above, the main areas where the post-BRT speeds are better than pre-BRT are those that have lost stops.
Moreover, the difference in travel times by local buses pre/post the change is relatively small during some of the off peak periods suggesting that there was not much traffic congestion over which “transit priority” would have an effect.
The restored 986 express buses provide a more substantial time saving than that achieved with the transit lanes, but this depends on them running almost non-stop between Kennedy Station and the GO Station at Bellamy. Express operations with more stops for transfer routes would not see as much of a change.

Can you figure out why the same people who are grabbing whole lanes out of our roads to make our buses run faster are also dropping speed limits on those same roads by 17%? The buses running out of Scarborough Centre station along Ellesmere to U of T had 60 km/hr limits for the long stretch almost 3 km of Ellesmere where there are zero driveways and only one intersecting street from Scarborough Golf Club Road to Morningside. Ms Gray dropped it to 50 km/hr. It is practically impossible to drive this at 50 and totally unnecessary. What were they thinking?
Steve: I think that there is a more general problem at work here. There is a broad desire to improve road safety especially with the number of pedestrian and cycling incidents in recent years, and this triggers a broad-brush approach to setting speed limits. The problem, however, is that the real speed limit is whatever the road was designed for and can handle in a typical motorist’s view. There is so little enforcement that a ticket is more an occasional annoyance and cost of doing business, not a real deterrent.
Even with enforcement, motorists will drive to what they feel is a comfortable speed, and this means that some will drive above that level.
It’s really not possible to start building obstacles into roads to slow traffic down, and yet I don’t know how this could be achieved beyond frequent traffic signals that are timed to make speeding unproductive.
But it’s easier to just change numbers on a sign and feel we have accomplished something.
LikeLike
Will there be a TTC service change on November 22nd? If so, what changes are going to made to routes?
Steve: The changes have not yet been announced in full, but the TTC has stated that some of the express bus network is to be restored in November with the balance to follow in 2021. All of this depends on the evolving situation with ridership and shifting demands on the network.
LikeLike