
This article continues my series reviewing operation of bus routes on streets where priority lanes are proposed.
Lawrence Avenue East was not part of the TTC’s original list, but it was added by Councillor/Commissioner McKelvie when the overall package was before the TTC Board. It does not enjoy quite the same standing as the original five routes, and also brought objections from Deputy Mayor Minnan-Wong about both the lack of consultation and viability of this proposal, at least in his part of the city west of Victoria Park Avenue. The proposal now extends east from there to Rouge Hill.
In the analyses presented here, I have used Port Union Road as the eastern reference point because buses between there and Starspray Loop take their layovers in various locations that could skew travel times to the terminal or an alternate nearby screenline.
The article is divided into three sections.
- The first looks at the route between Victoria Park and Port Union, but in two segments: east of Midland and west of Kennedy. This split eliminates travel time variations caused by layovers at Lawrence East Station.
- The second part reviews the segment from Victoria Park to Don Mills.
- The third presents average speed comparisons over the route for pre- and post-pandemic conditions.
In brief:
- The eastern segment of the route has some times and location of congestion, but these vary a lot with the most severe problems being in the PM peak hour. At other times, the difference between pre- and post-pandemic average travel times is small.
- The segment west of Victoria Park shows very little change in average travel times over an extended period with one relatively small exception in the AM peak westbound. It would be difficult to justify reserved lanes here based on actual travel time data.
One issue raised during debates at the TTC Board and at Executive Committee was that traffic levels, and hence congestion on Lawrence are affected by demand that has diverted from Eglinton due to the Line 5 Crosstown construction. This effect varies along the route. This should begin to disappear as conditions on Eglinton return to normal over the balance of 2020, and I will track this to see what actually happens.
Travel Times Between Port Union And Midland
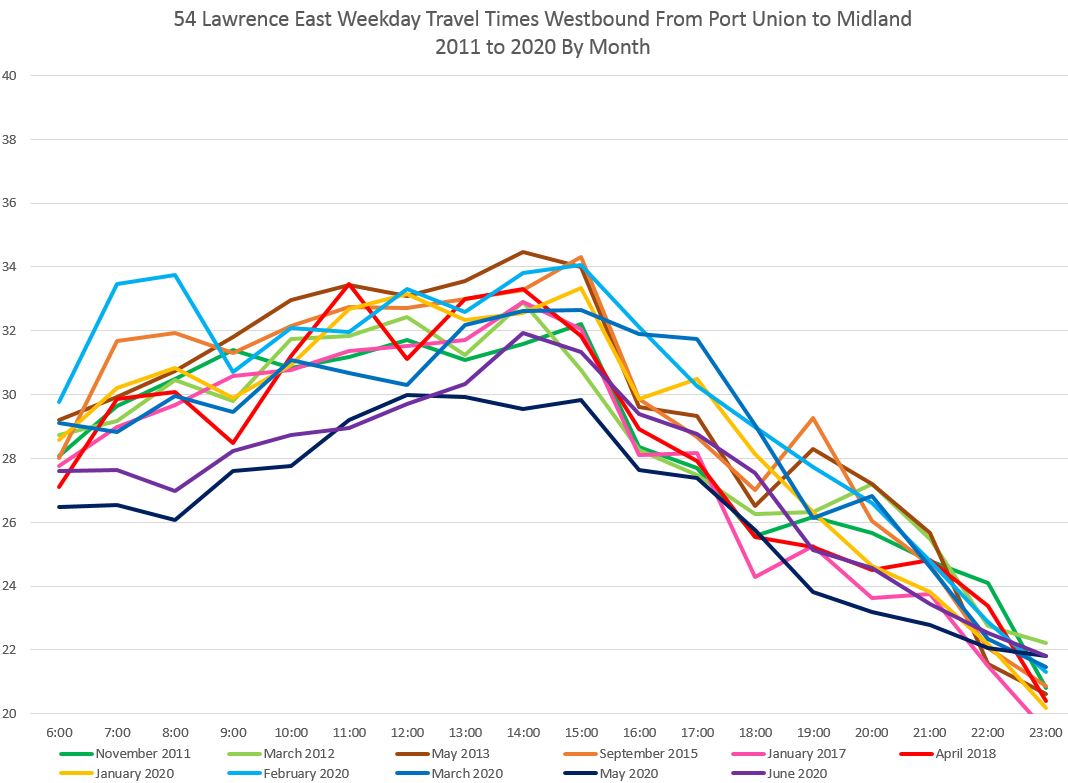
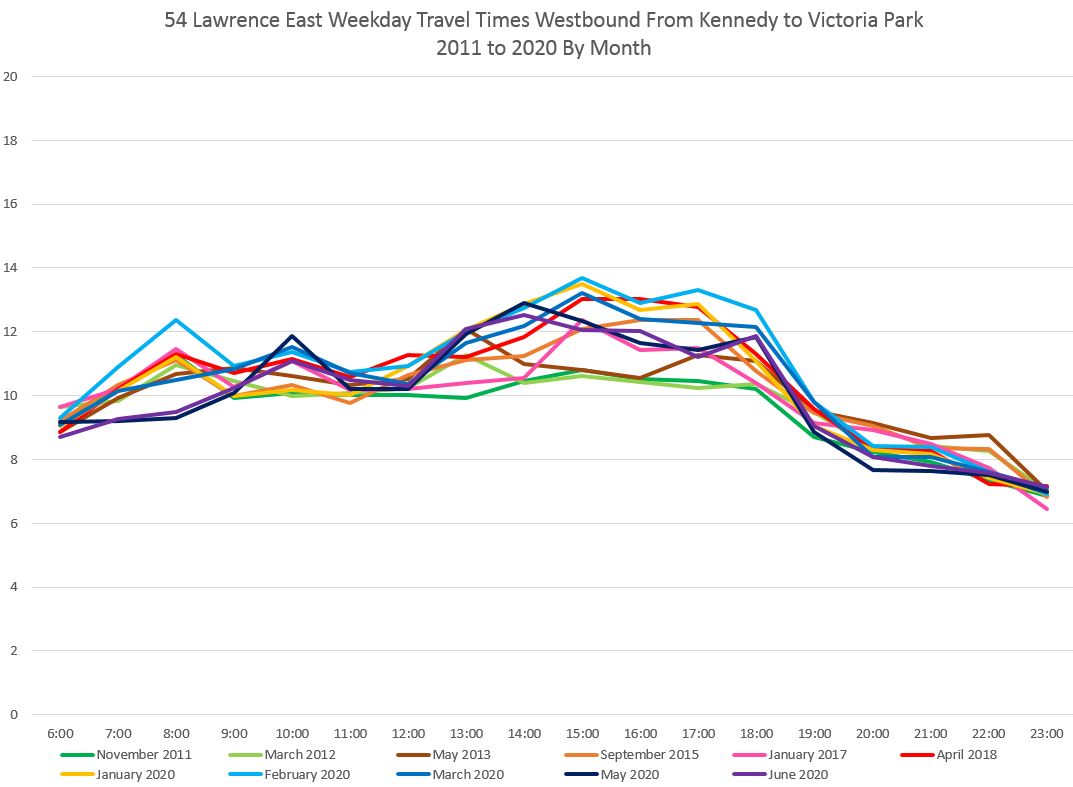
The chart below is a bit of a jumble, but there are a few important points:
- In common with data from other routes, travel times are lower for May and June 2020 than most other months for which I have data.
- March 2020 is a transitional month (details later in the article) with later weeks showing reduced travel times.
- Although there is some spread in values, they lie mostly within a band less than six minutes wide, and this band is narrower in the evening than during the day.
- For westbound travel, the difference is widest in the AM peak, especially comparing May 2020 (dark blue) to February 2020 (turquoise).
- For eastbound travel, the difference is widest in the PM peak, with the highest values in January through March 2020.

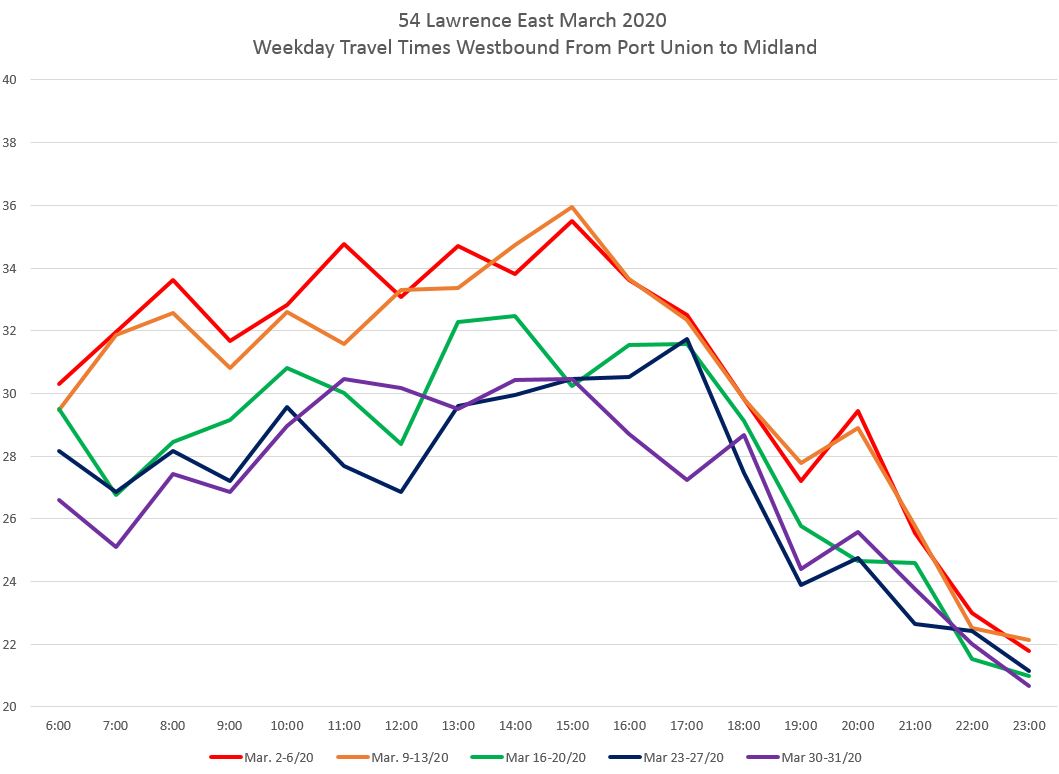
The transition to shorter travel times occurs during March 2020 when, in week 3, much travel stopped. In the charts below, the first two weeks (red and orange) have higher values than the later ones (green, blue, purple). That said, the drop is four to six minues for westbound trips, less so in the evening.
Eastbound trips in March 2020 weeks 1 and 2 show a sharp jump in travel times through the PM peak, with a small post-peak echo.

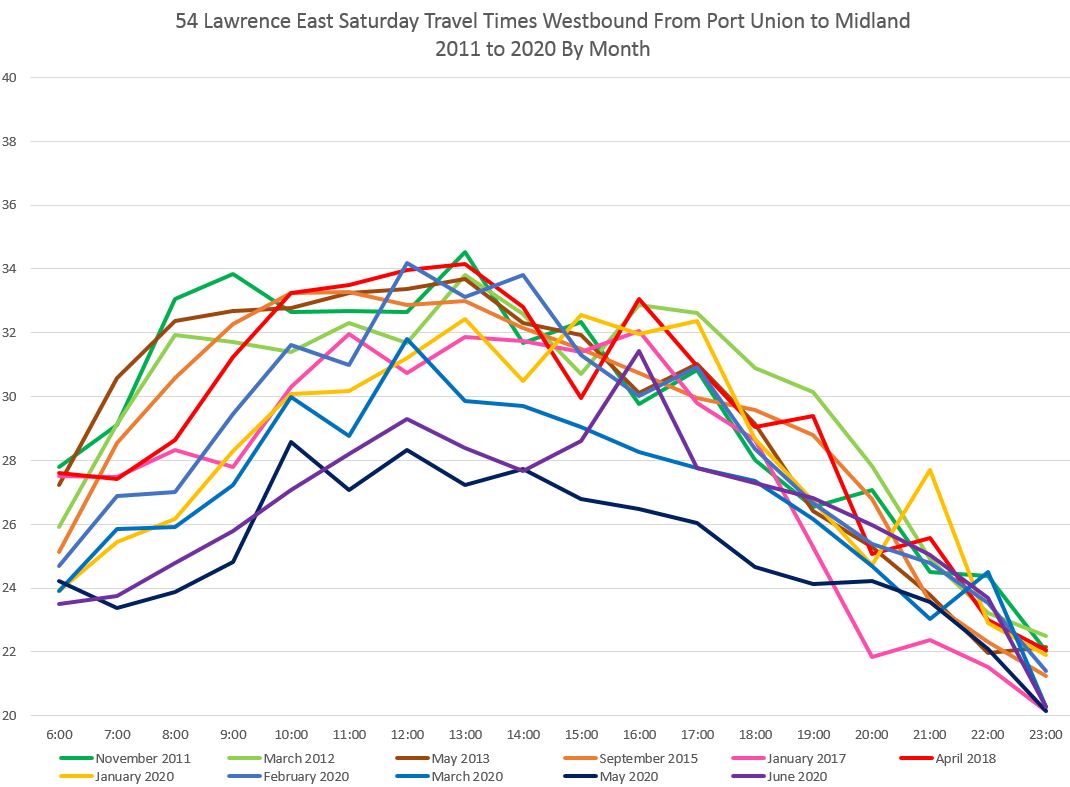
Saturday travel times were also shorter in recent months, although it is not clear whether the values are already starting to rise in the June data. However, the change is relatively small for much of the day, especially eastbound.

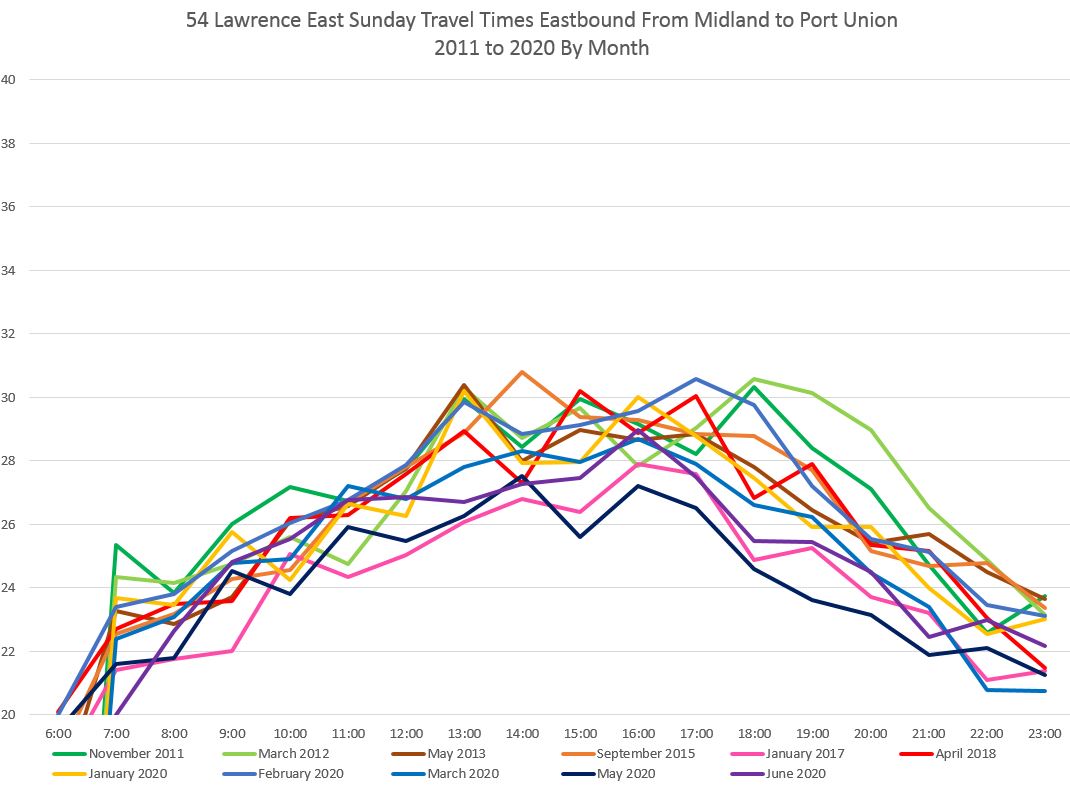
Sundays show even less of a change, and again May 2020 has the lowest values.

Travel Times Between Kennedy And Victoria Park
Westbound from Kennedy to Victoria Park, there is a small improvement in recent months during the AM peak, but otherwise little change.
Eastbound travel times from Victoria Park to Kennedy are slightly lower in May and June 2020 than in early months of the year in the PM peak, but values for 2020 consistently show an AM peak. This could well be an Eglinton spillover effect.

Within the month of March 2020, the difference in travel times for weeks 1-2 vs weeks 3-5 is relatively small, with more of a change in the PM peak than otherwise


Saturday travel times show less change than weekday values. The charts for Sunday (not shown here) are similar.


Travel Times Between Victoria Park And Don Mills
In the section of the route between Victoria Park and Don Mills, weekday travel times are unchanged over many years except for the AM peak westbound.
The April 2018 averages (red) are high because of the effect of a single data point within that month when there was severe congestion on Friday, April 27.

Eastbound travel times from Don Mills to Victoria Park are almost constant over the years with a slight rise in early 2020.

The situation on April 27, 2018, was a quite severe AM peak traffic delay westbound to Don Mills, and a lesser rise in the PM peak. This was sufficiently large to affect the monthly average even though it was only for a single day. I have left this in to illustrate how averages can be deceptive if one does not mine the underlying details.
In the chart below, the blue line and dots show individual trips, and the black line is an interpolation between the values.

Here is what this looked like in a distance-time chart. At its worst, about 8:40 am, the congestion extended all the way from Don Mills to Victoria Park.(In the chart, each line tracks one bus back and forth across the route. The faster the speed, the more vertical the line. Lines that are more horizontal indicate slow travel and, therefore, congestion especially when this occurs over an extended distance.
There was no e-Alert issued by the TTC for any event on this route or in the immediate vicinity, and so the cause is unclear. This was a one-day effect.

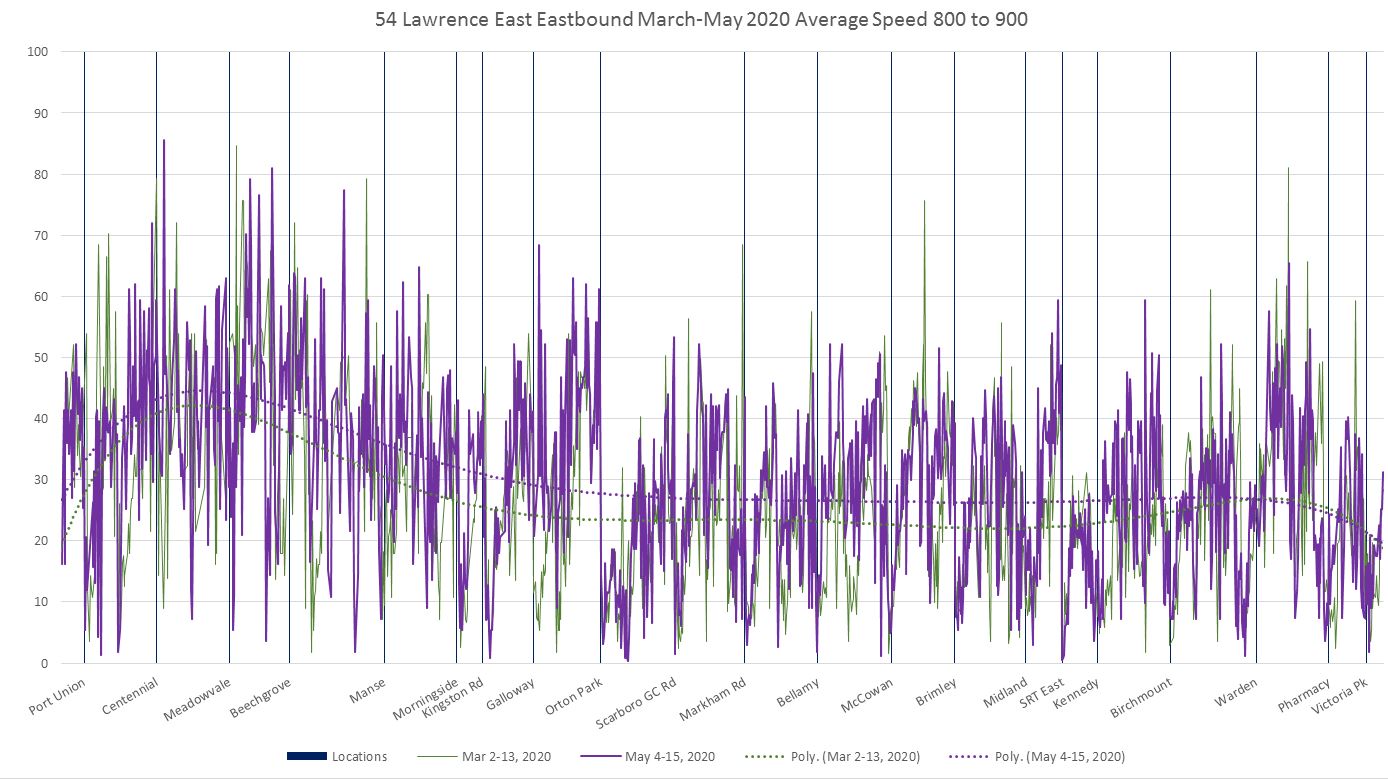
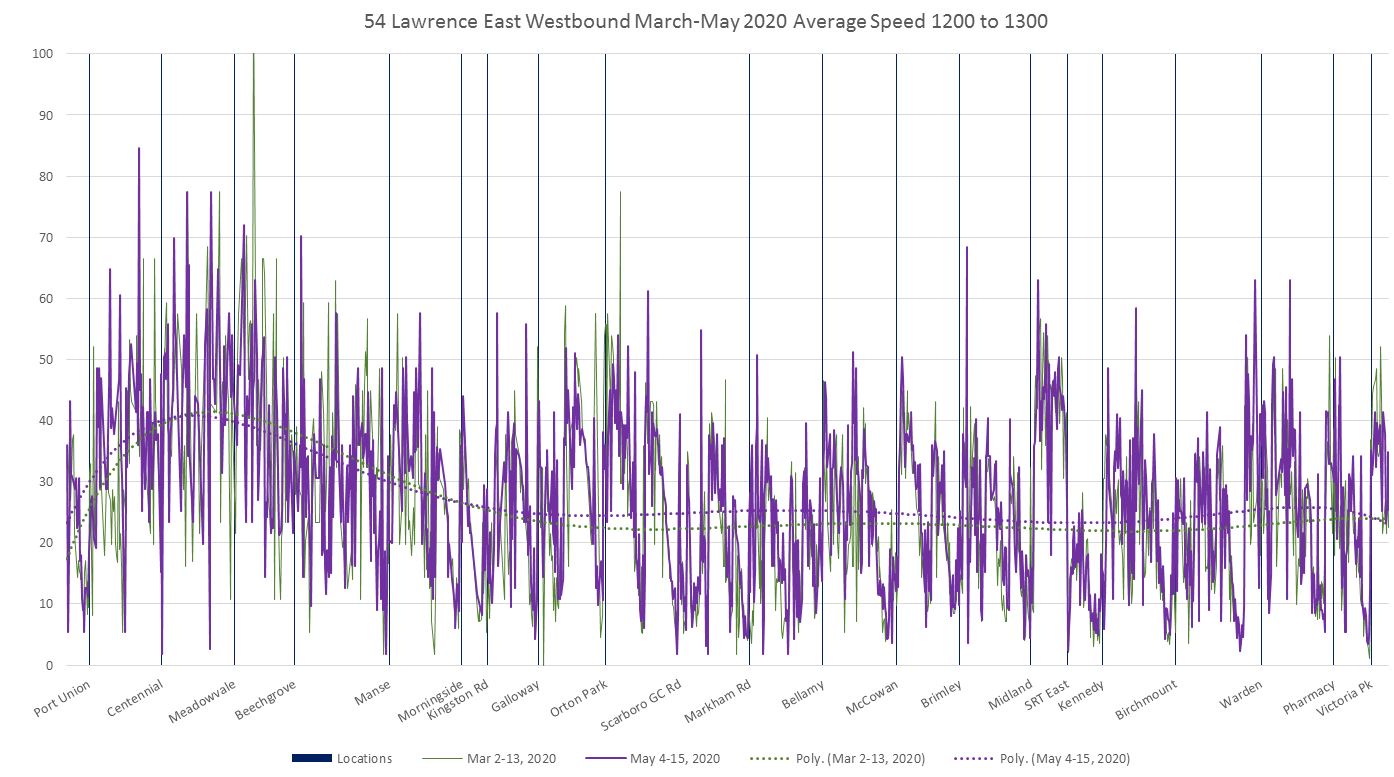
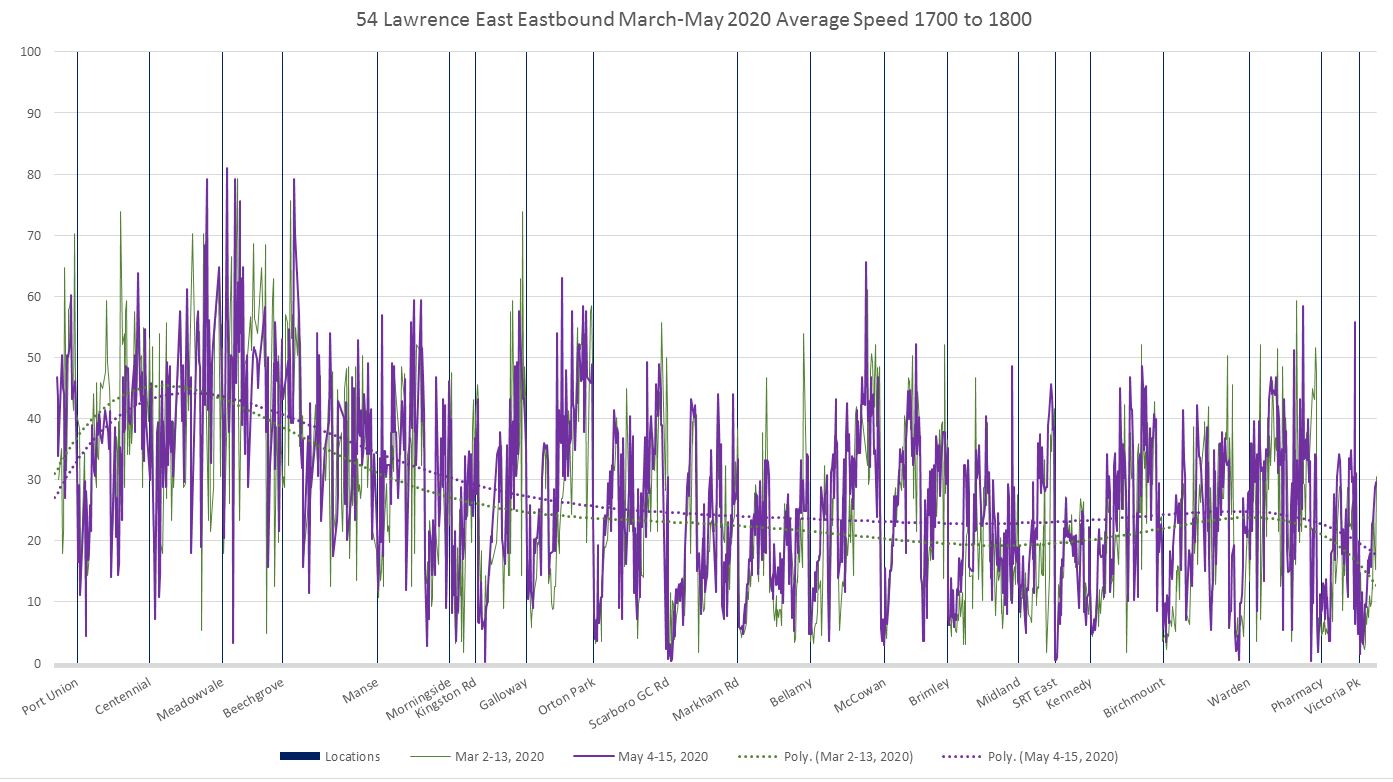
Travel Speed Comparisons Between Starspray Loop And Victoria Park
The charts below compare travel speeds for Lawrence East between Starspray Loop (left side of the charts) and Victoria Park (right side). Westbound travel should be read left-to-right, while eastbound travel from right-to-left. The values drop at stops, and the “valley” in the curves reflects the direction of travel.
Data for the first two weeks of March, 2020, are plotted in green, and for May, 2020 in purple. The dotted lines are interpolated through the data and show its overall shape. In general, the May data run at a higher value than the March data, but the trend lines do not diverge as much as on other routes, and there are limited areas where the March values are substantially below the May ones.
The first two charts are for the 8-9 AM peak period.

By midday, the trend lines are very close to each other indicating that there is little difference in average speeds.

In the 5-6 PM peak hour, there are some lower speeds for part of the route westbound, but again there is considerably less difference than seen on other routes.

Full Chart Sets
The travel time chart sets below include weekday, Saturday and Sunday charts as well as detailed week-by-week breakdowns for several recent months.
The speed charts show the data for each hour from 6 AM to midnight. They can be used as “flip chart animation” to see how travel speeds evolve through the day hour-by-hour.
- 54_2011_2020_PortUnion_Midland_TravelTimes
- 54_2011_2020_Midland_PortUnion_TravelTimes
- 54_2011_2020_Kennedy_VictoriaPark_TravelTimes
- 54_2011_2020_VictoriaPark_Kennedy_TravelTimes
- 54_2011_2020_VictoriaPark_DonMills_TravelTimes
- 54_2011_2020_DonMills_VictoriaPark_TravelTimes
- 54_202003_202005_SpeedStats_WB_Comparison
- 54_202003_202005_SpeedStats_EB_Comparison

I have to say it is shocking that a person who doesn’t believe in transit or votes against things having to deal with transit is on the commission time and time again meaning Denzil Minan Wong’s reluctance for bus lanes. I felt the comment during the most recent meeting of “speeding up bus lanes wouldn’t be fair to car drivers let’s do the reverse of that with gridlock it isn’t fair that people are stuck on a crowded bus because of single vehicle cars. Also I do feel the constant idea of always raising fares on TTC but not taking up a gridlock or congestion charge is unfair. It would have dire issues if everyone drove instead of take the TTC regardless of the Pandemic we have had cleaner air and such with many staying home during the pandemic and also that would cause gridlock to become worse in an already congested city.
LikeLike
In my opinion, the Eglinton Crosstown has added permanent congestion to Lawrence because of the reduction of number of car lanes on Eglinton, from 6 (8 at intersections) to 4. I would add that the importance of these findings could be increased if ridership was known. If I am correct, the Eglinton Crosstown increases the travel time for a large number of Lawrence passengers because of the increased car congestion diverted from Eglinton to Lawrencce.
We must thank Steve for his hard work to really dig into the details to present a factual analysis. Minan Wong’s views are clearly not evidence based, yet he and Tory have the final say.
LikeLike