
At the TTC Board meeting of October 24, 2019, there was a staff presentation on the question of streetcar reliability and statistics, as well as a statement by Bombardier about their improvements in quality control. [Links go to the YouTube video recording of the meeting.]
In a previous article I wrote about claims that the TTC was keeping “two sets of books” on vehicle reliability, and that the numbers cited for the Flexity fleet omitted failures that were counted against the “legacy” CLRV and ALRV fleets. The TTC has now produced statistics for the Flexitys distinguishing between failures chargeable against Bombardier’s contract performance, and a broader class of delays including those caused by other factors.
The charts shown in this article were clipped as screen grabs from the meeting video. When I get better resolution versions from the TTC, I will update the illustrations here.
There are several “Key Performance Indicators” (KPIs) tracked by the TTC and Bombardier, and some of these appear in the monthly CEO’s Report. Responsibility for these varies between the supplier, Bombardier Transportation, and the buyer, TTC, as shown in the chart below. Of particular concern was the Operational Reliability Mean Distance Between Failures which is calculated based on all in-service failures and provides a measure much closer to rider experience than Contractual Reliability that tracks supplier-specific faults.

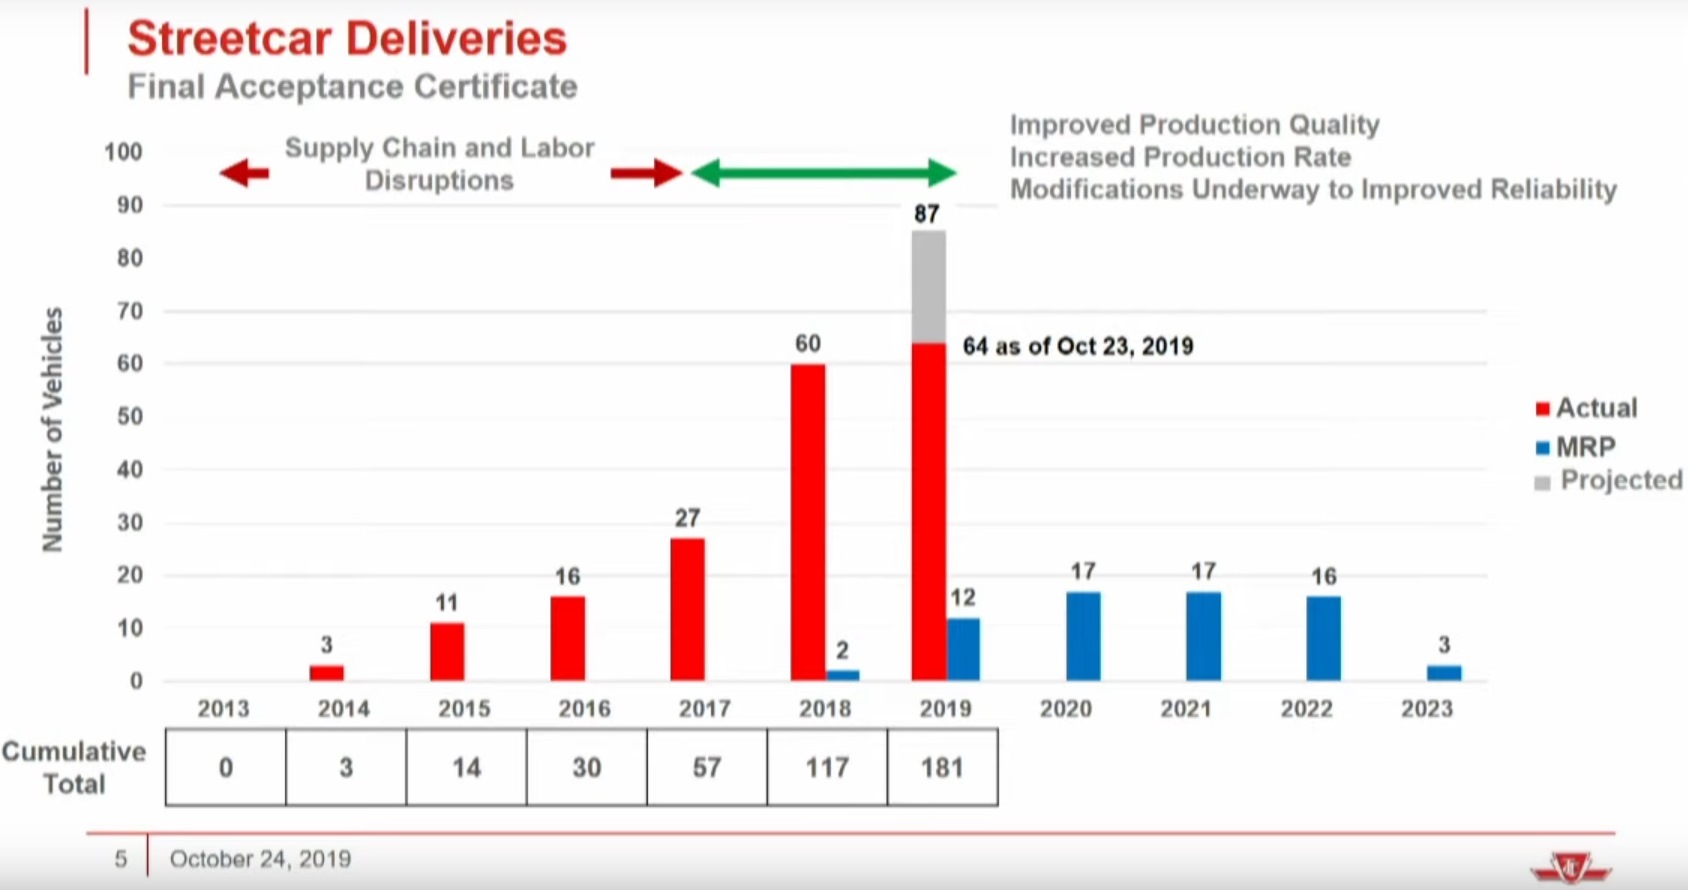
Production of the new cars suffered for roughly the first third of the order because of manufacturing and engineering problems at Bombardier. This was acknowledged in Bombardier’s presentation about which more later in the article. The chart below does not fully show the severity of the problem because a “defect” could range all the way from something cosmetic to a fault in the physical structure. The chart does acknowledge “Major Quality Defects” and this corresponds to the portion of the order with unacceptable welding from Bombardier’s plant in Mexico.

The delivery pattern is shown below with the anticipated completion of the order by December 31, 2019. This could be missed due to subcontractor supply issues at Bombardier.
The blue bars in the chart show the planned repair program to re-weld the frames of the early cars. This project will occur on a rotating basis so that the number of cars removed from the fleet at any one time is small and does not have the same effect it would were all 67 cars deemed unfit for service.
The reliability statistics have been recalculated back to January 2016 to distinguish between vendor-related issues and all others. On the latter basis (the “Operational Reliability”), the MDBF numbers are lower for the new cars. While still better than the legacy fleet, they are not as dramatic an improvement as cited routinely by the CEO as justification for retirement of the old cars.
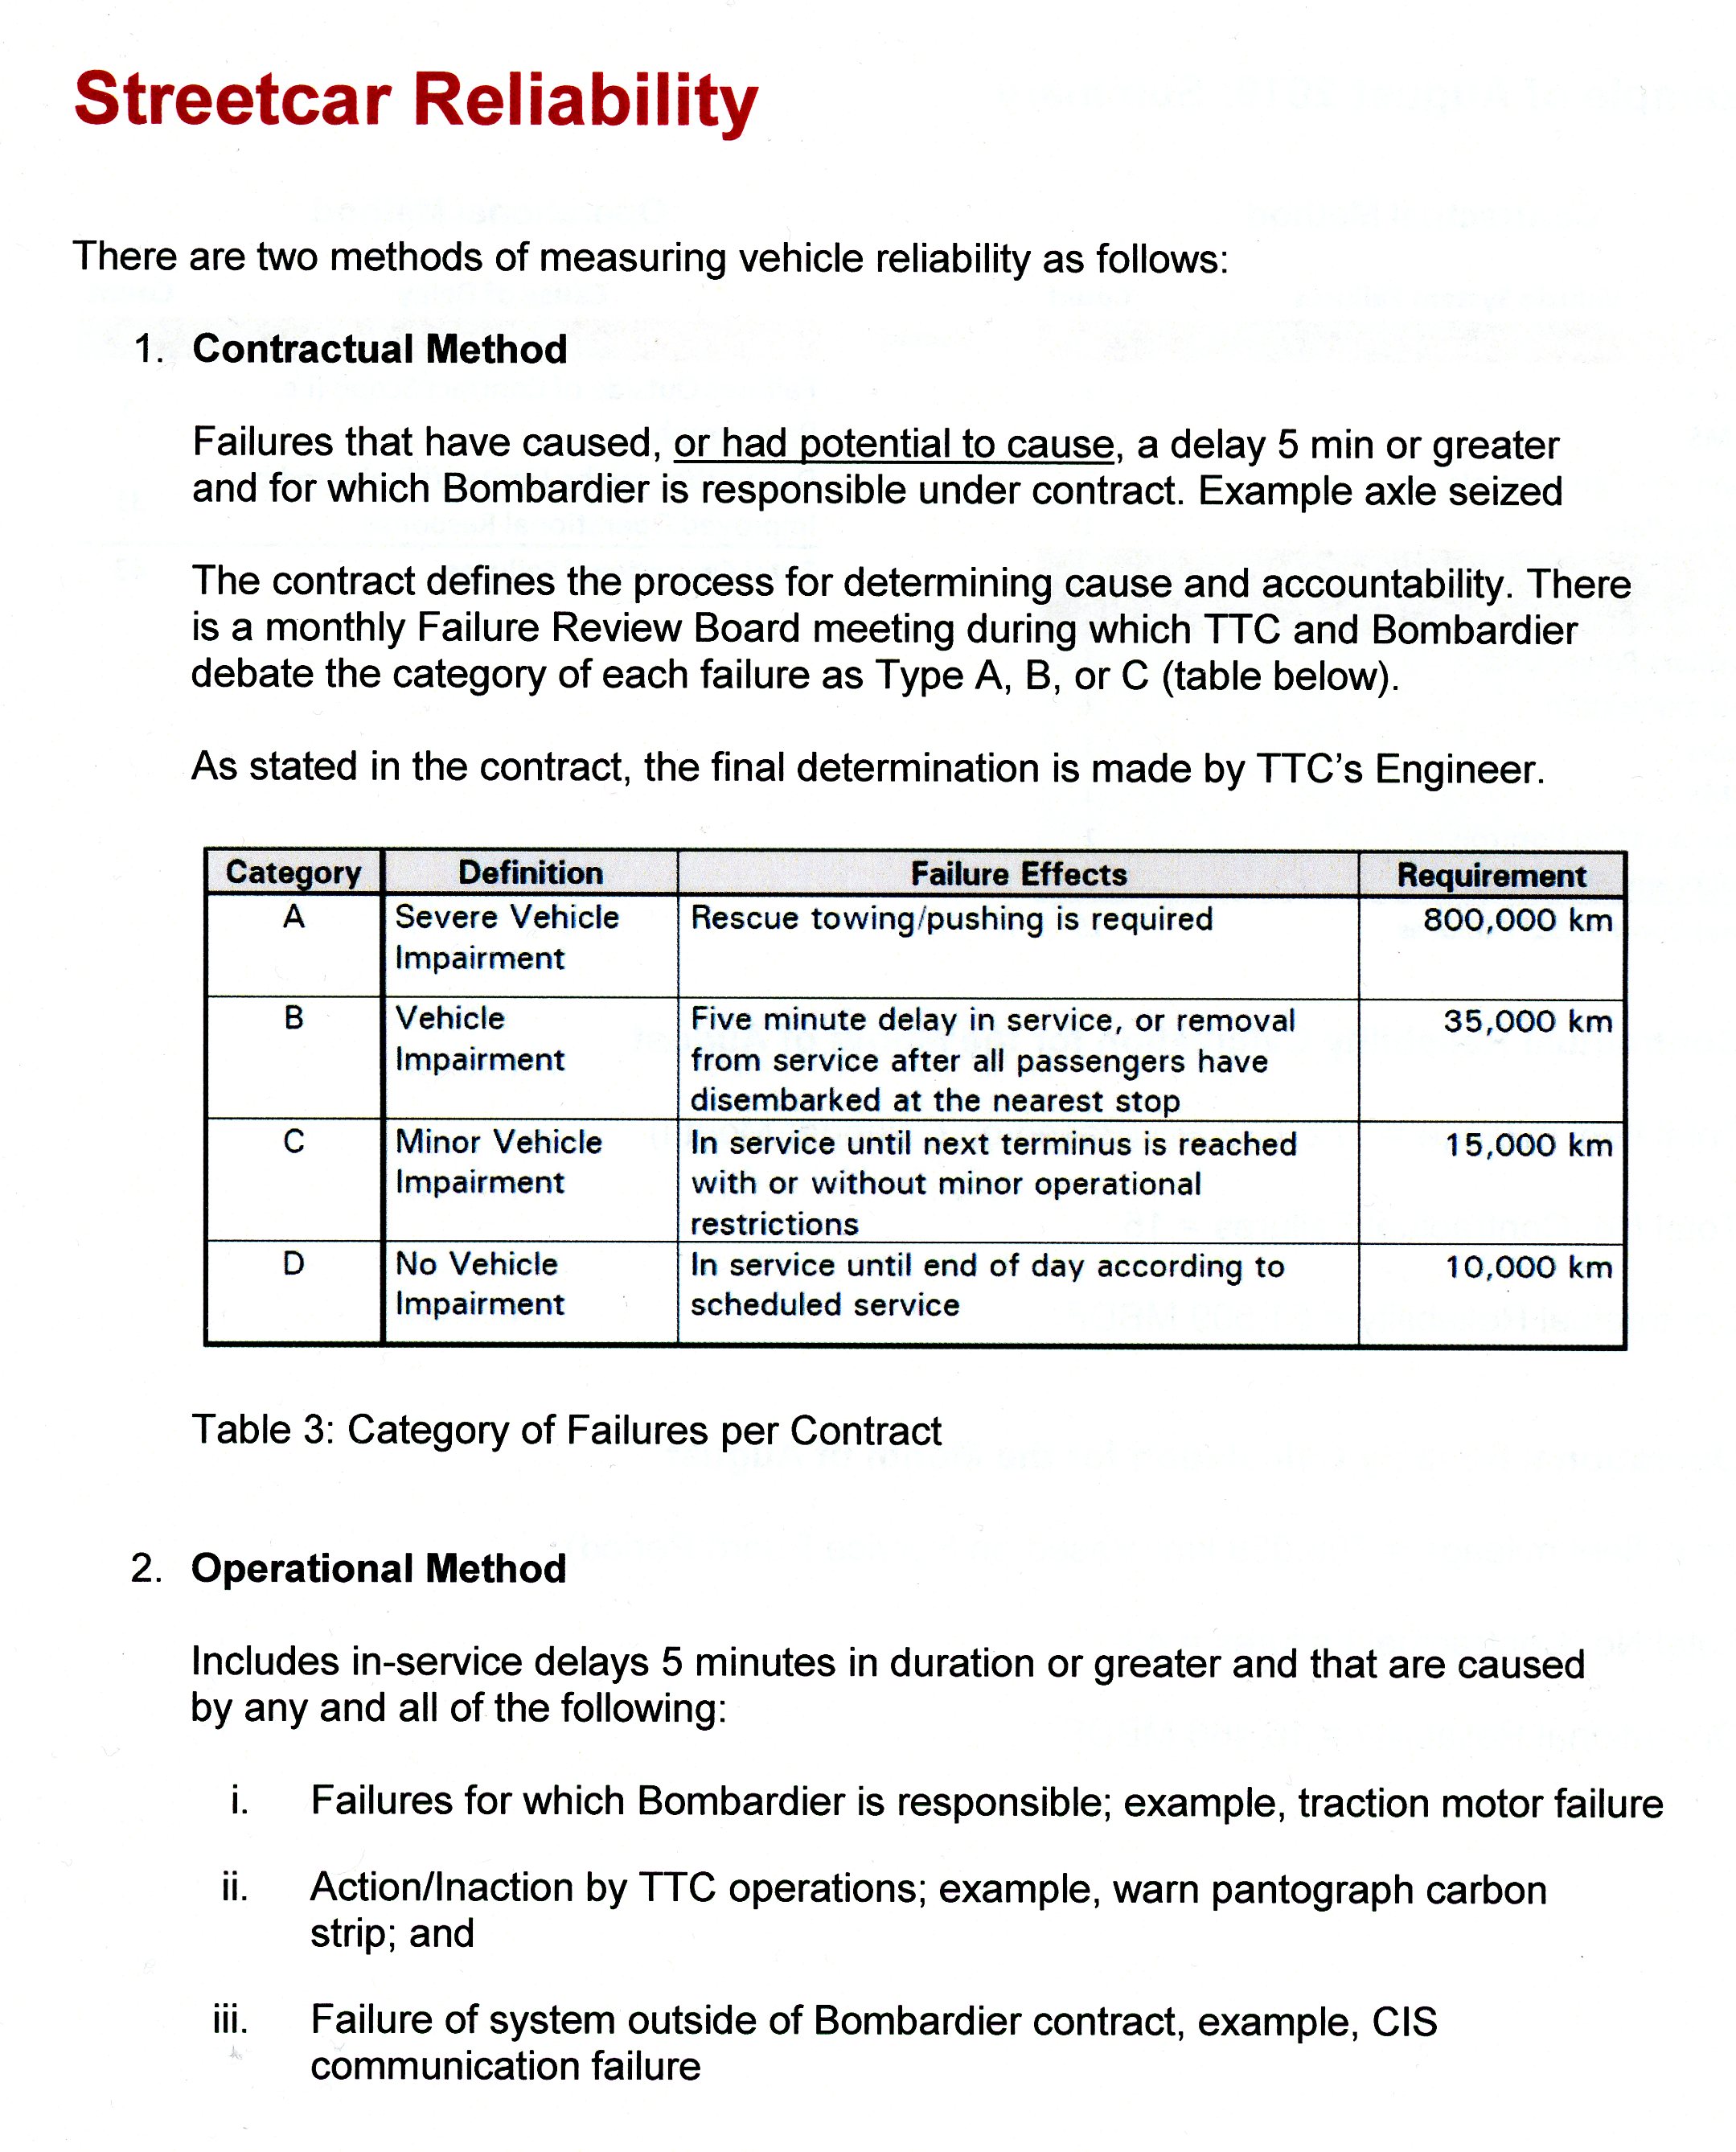
(Item 2.iii below contains a typo: it should read “worn”, not “warn” with respect to the pantograph carbons. Quality control is not just an issue for manufacturing.)

The chart below shows the contractual method of calculating reliability including month-by-month figures (amber) and a twelve-month average value. The dotted line is a projection showing what must be achieved to meet the contract requirement of one year’s average at 35,000 km MDBF. Although this chart ends at August 2019, Bombardier reported in their presentation that the figure remains well over the target into October 2019.

When the calculation includes failures that are not chargeable to Bombardier, the monthly averages fall considerably with the low points for the new cars not far off the high points for the old ones. To be fair, one factor in the ability to keep the legacy cars’ MDBF as high as it is recently has been the retirement of the least reliable cars in the fleet.
The real challenge will be to see how the Flexitys make out through the winter of 2020, and the degree to which vendor-related problems affect the contractual as opposed to operational reliability statistics.

The table below expresses the data on the basis of failures per vehicle showing that on both bases of measurement, this number is falling as the fleet grows showing that newly delivered cars are not contributing to high failure rates as they were earlier in the contract. This could be due to better reliability of the newest cars, or to the accumulation of a larger number of reliable cars in the fleet overall, or some combination of the two.

Reliability In More Detail
Within the contractual method of calculating reliability, there are four categories of failure, of which the “B” type has the 35,000 km MDBF target. These are described below, and the Bombardier presentation refers to “B” failures on a few occasions.
[Source: TTC]
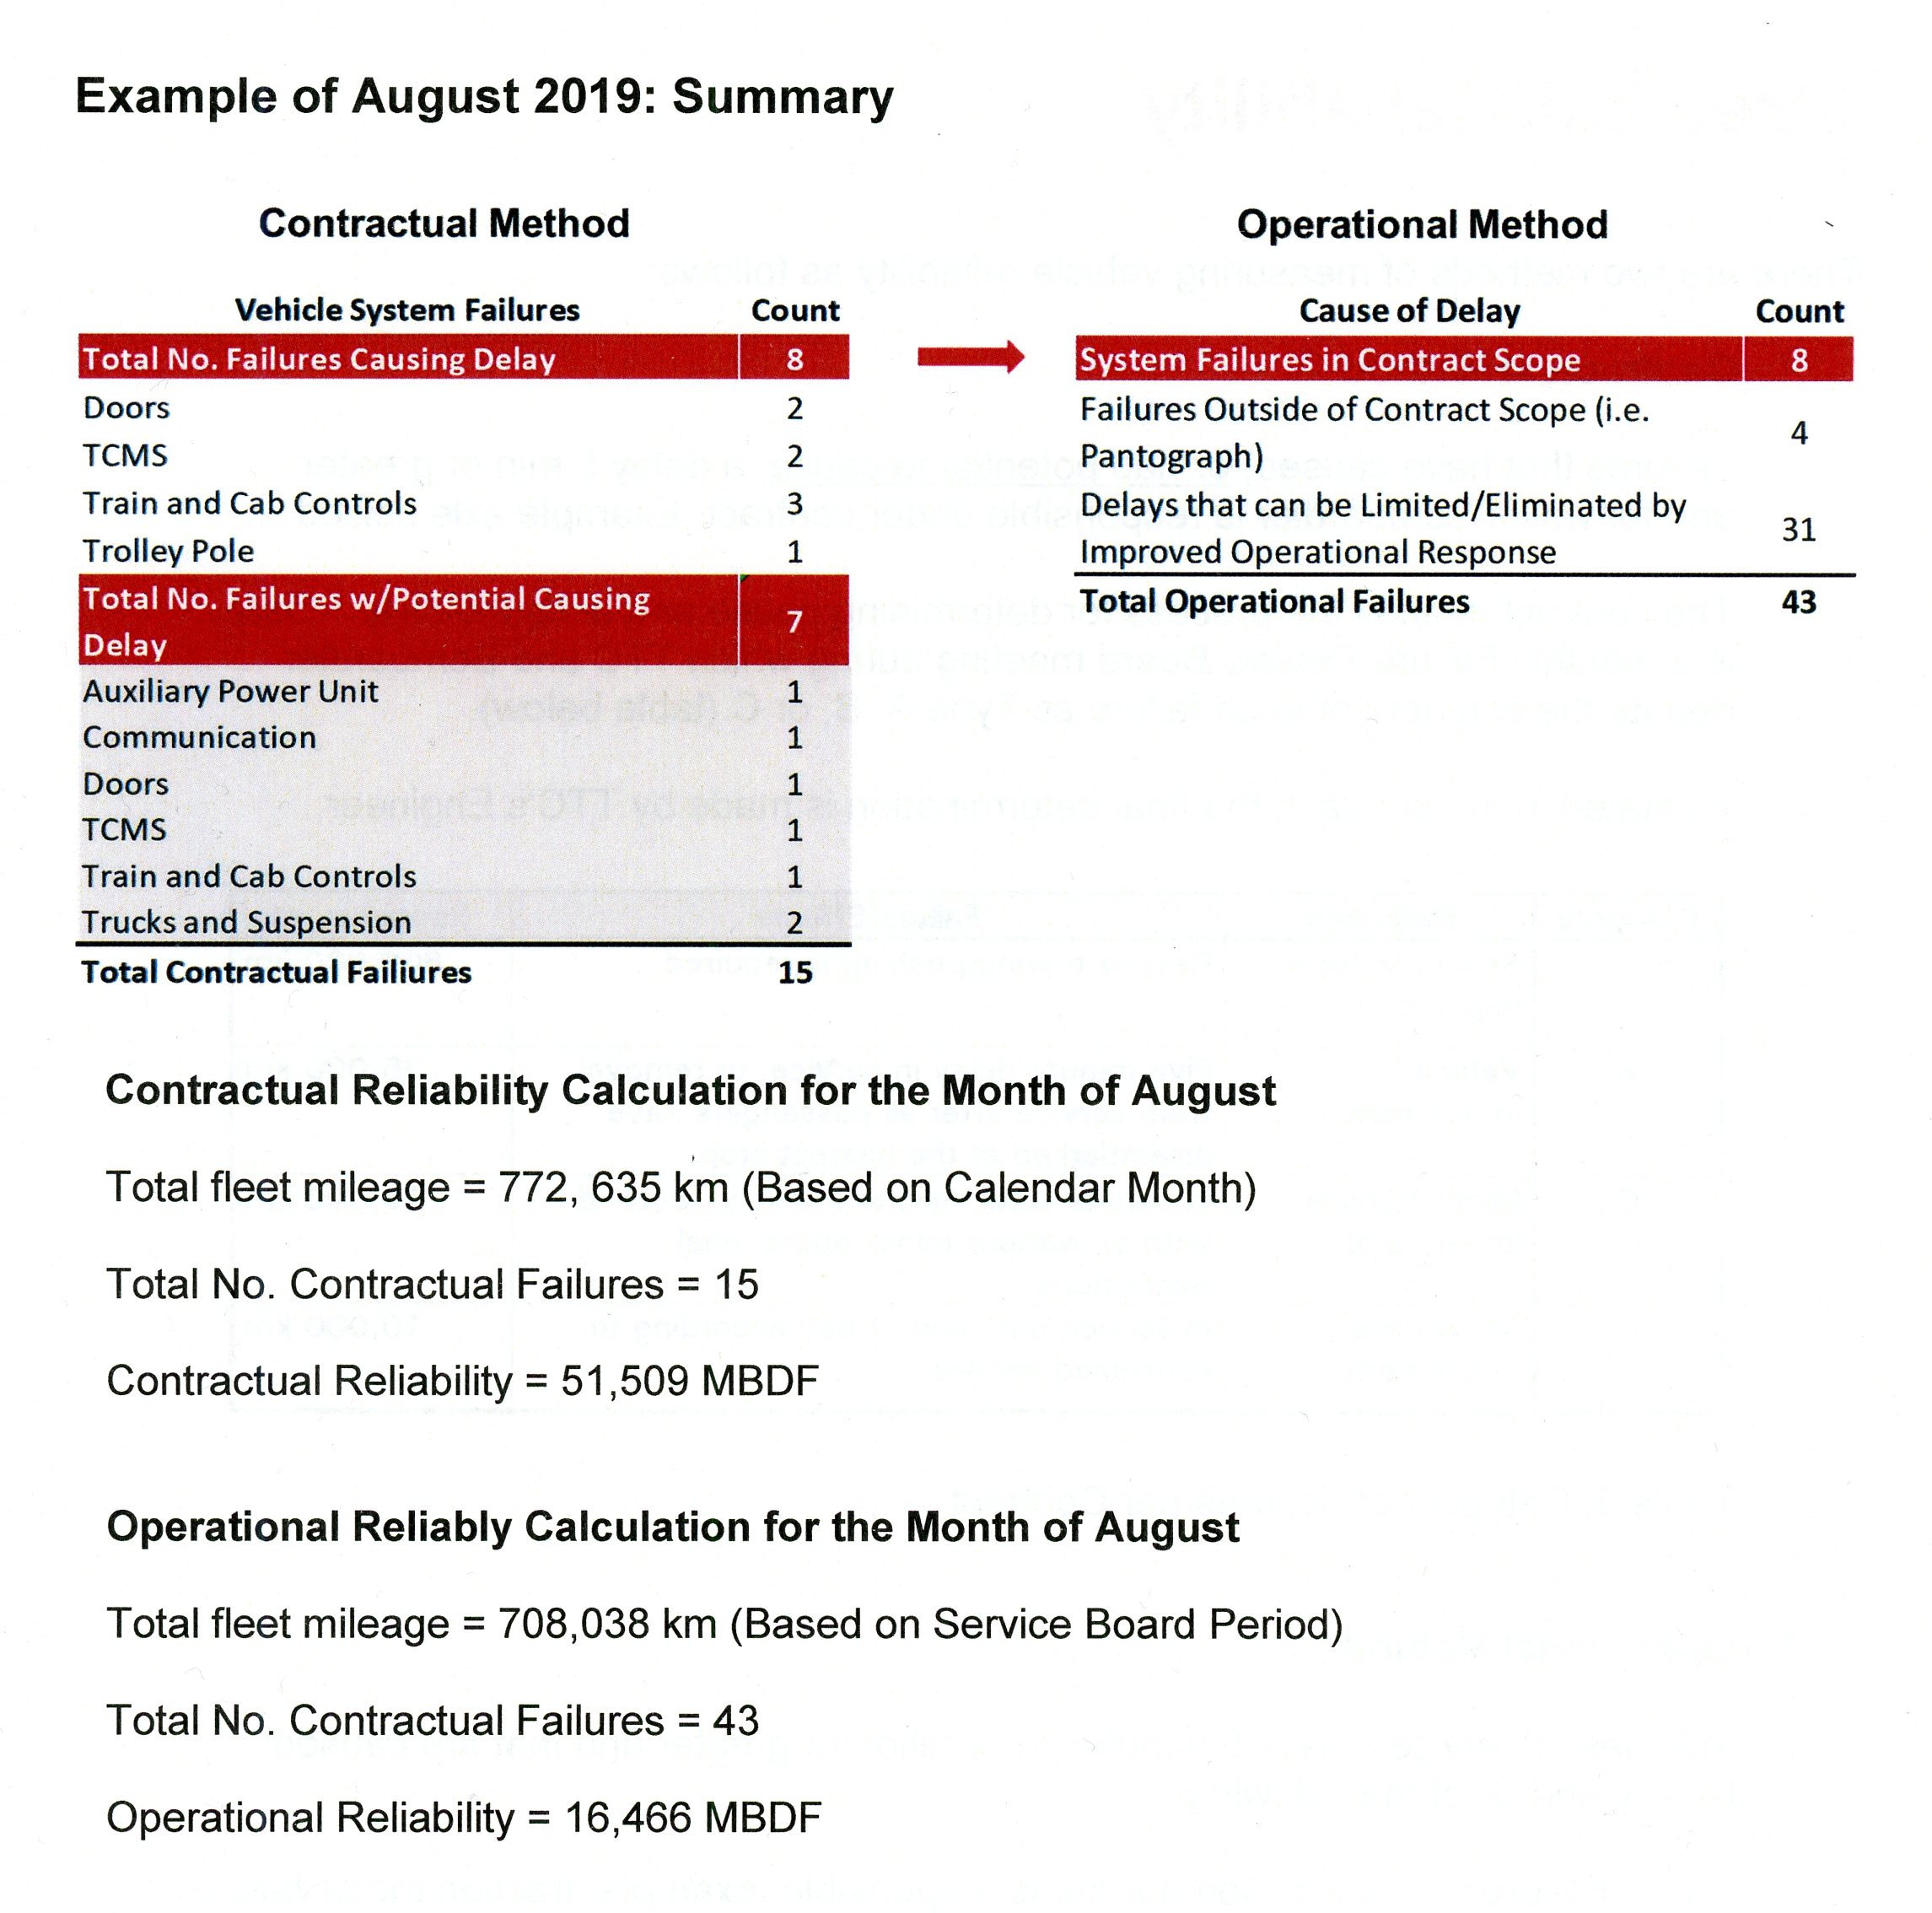
Of particular note is the group of 31 “delays that can be limited/eliminated by improved operational response”. This implies there is work to be done on the TTC’s side in better handling and preventing failures that are at least to some degree under their control.
This is echoed in the October 2019 CEO’s Report:
With respect to the Operational MDBF, there were 28 additional delay incidents contributing to the 16,402 kilometres. These incidents included delays such as communication issues, camera issues and faults that should have been remedied under five minutes due to redundant systems on the vehicle. [p 41]
[Source: TTC]

[Source: TTC]
Bombardier appeared at the Board meeting with a message about how their production pace and quality had improved. They were represented by Lee Sander, president of the Americas Division of Bombardier Transportation, and David Van der Wee, COO for that division.
Most surprising was their quite free admission that Bombardier greatly underestimated the complexity of adapting a car they had successfully built in and for the European market to Toronto conditions (use of salt in winter, grades, curve radii and track gauge) and of transferring manufacturing techniques from an experienced plant to their Mexican operations which were the source of many problems.
In the original bid for these cars, the competing proposal from Siemens was 50% higher than Bombardier’s price. Bombardier admits that they lost a lot of money on this contract. To what extent these losses might have been avoided with better project planning and management we will never know. This might show up indirectly in the bid price for any add-on streetcars if Toronto ever gets to the point of calling for quotes on them.
This was clearly a pitch to say “look at what we can do today” as a measure of what the TTC might expect in a supplementary order for streetcars. The problem, however, is that Bombardier’s reputation, and not just for the TTC order, is in tatters thanks to quality control problems of past years. There is little political love for a company that has had so many bailouts, and other vendors hope to cash in on a potential market where the outcome of bids is less influenced by political considerations.
The TTC’s plan to rebuild rather than replace its T1 fleet for Line 2 puts a big hole in what might otherwise have been a considerable vehicle purchase stream through the 2020s. I do not agree with this decision, but for reasons that have nothing to do with sending work to Bombardier. Rather, the TTC is locking Toronto into the existing capacity on Line 2 for over a decade by keeping the T1 trains.
As for new streetcars, the TTC desperately needs more to handle existing and future demand, not to mention potential network expansion in the waterfront, but all of the capital spending is now focused on subway and suburban LRT expansion, not on the existing surface network. Provincial funding cuts will hobble Toronto’s ability to expand service on its streetcar and bus networks for many years.
The Star’s Ben Spurr writes about Bombardier’s presentation here.
Tips for any vendor making a presentation especially to a potentially hostile audience:
- If you have a slide deck, make sure that it contributes to what you are saying rather than just having a set of beauty shots.
- Be sure all of the photos are the right way around (one was reversed) and show your product in the best, recent light (pantographs up, please) from your own photos rather than culling them from the internet.
- Learn to pronounce the names of locations where you have employees correctly before you get here rather than stumbling over them while reading a prepared text (“Etobicoke”).
These gaffes might not have been noticed by everyone, but they speak to attention to detail, something the whole Flexity supply experience lacked.
