
Correction August 15, 2018: Off peak service for the Westway branch of 52 Lawrence has been corrected.
In Part I of this article, I reviewed the evolution of bus and streetcar fleet capacity measured by scheduled service over the period from 2006 to 2018. The central point was that there has been little improvement in the overall peak period capacity operated on the bus network for much of the past decade. On the streetcar network, two recent changes – the addition of buses to supplement streetcars and the replacement of old cars by new, larger ones – have provided some peak period capacity growth. However, in both cases, this growth is small seen over the long run. Off-peak service has improved more because the system is not fleet-constrained outside of the rush hours, but there is still a budgetary limitation which affects how much staff are available to operate these vehicles.
In this article, I will review several major suburban bus routes to compare service in January 2009 when the benefits of the Miller-era Ridership Growth Strategy had kicked in with service operated in January 2018. Given the results seen in Part I, it was no surprise that when I compiled this information, many routes have less capacity today than they did a decade ago and improvements where they do exist are not major. That is not a recipe for system growth. How did this happen?
First off, when Rob Ford became Mayor, he rolled back the RGS Service Standards and service just stopped improving. Several off-peak improvements were undone, but these affected periods outside of the range reviewed in Part I (mainly evenings and weekends). Ironically, the streetcar system suffered less because, thanks to the vehicle shortage (even a decade ago), the loading standards for streetcars in the peak period had not changed. There were few RGS improvements to unwind. When John Tory reinstated some of the RGS standards, this allowed growth to resume, but almost entirely in the off-peak period because neither the bus nor the streetcar fleets had spare vehicles.
Another more subtle problem lies in TTC scheduling. As congestion built up on routes, the reaction was to stretch existing headways (the space between vehicles) rather than adding more buses to a route. This responded to the vehicle crunch, but it gradually trimmed service levels across the system. Even though the same number of buses were in service, with fewer passing a point per hour the capacity of service riders saw declined. The TTC made excuses for this practice as simply running buses to the conditions, but the long term effect was to cut service to keep operational demands within the available fleet size.
The balance of this post summarizes the data for each route. The full set of tables is linked below as a PDF.
2009_2018_ServiceComparisons_V2
A few notes about these tables:
- Services are grouped by corridor because, in some cases, more than one route operates along a street. For example, Lawrence Avenue West has been served by 52 Lawrence, 59 Maple Leaf and 58 Malton (now folded into the 52).
- Service capacity is shown as buses/hour. The only adjustment for vehicle size is that articulated buses count as 1.5 so that 6 artics per hour is the same, from a capacity point of view, as 9 regular-sized buses. Where a headway is followed by the letter “A” in the tables, this means that artics are operated.
- In some cases, routes have a branch where every “nth” vehicle takes a longer trip. For example, some of the services running through to York Region have every 3rd, 4th or 5th bus going beyond the “standard” destination. These do not provide net additional service where the branches rejoin in the same way as a branching route where half of the buses go one way and half the other. In other words, if a 5 minute service runs to Steeles and every 4th bus runs beyond on a 20 minute headway, the headway to Steeles is still only 5 minutes, or 12 buses per hour. These cases are noted with an asterisk “*” in the tables.
- Some routes were affected by the opening of the Vaughan extension. In these cases, data are shown for November 2017, the last set of schedules before the routes changed, so that the evolution of service right up to that point is clear.
The information for these comparisons is from the TTC Scheduled Service Summaries:
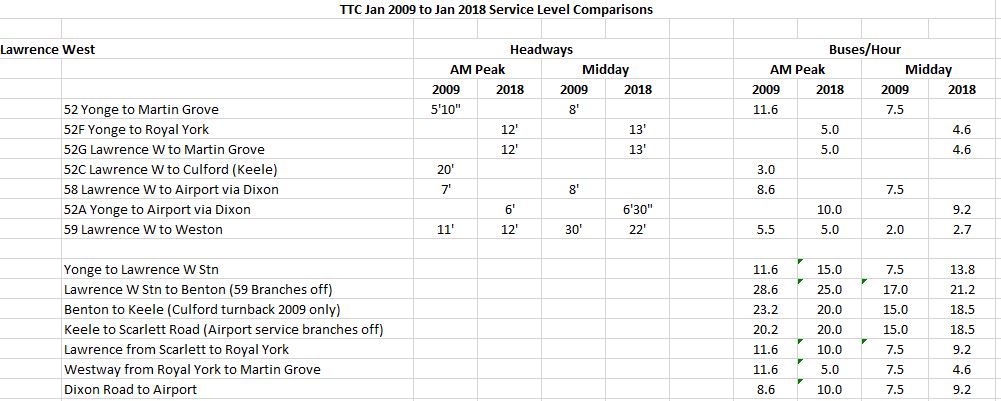
Lawrence West (Corrected)
During the AM peak period, service has improved between Lawrence West Station and Yonge (because the Pearson Airport service was extended to Yonge), and on the Dixon Road branch of the route. Other portions of the route have less service in 2018.
During the Midday period, there are more buses/hour in 2018 on all sections of the route except The Westway from Royal York to Martin Grove.
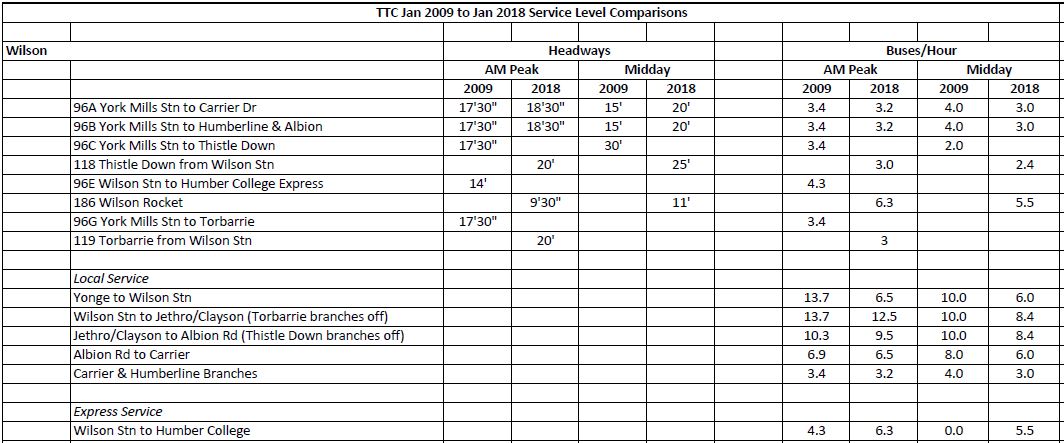
Wilson
AM peak service has improved most notably between Wilson Station and Yonge Street, and only slightly on the rest of the route.
Midday service is less frequent over the entire route, a change that is partly offset by the express service to Humber College for those who can use it.
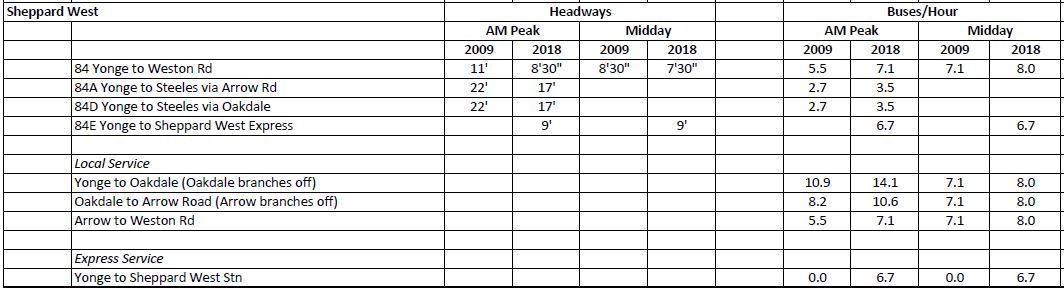
Sheppard West
Local service during the AM peak and Midday has improved, and this is supplemented by the express operation on the eastern part of the route from Yonge to Sheppard West Station (formerly Downsview).
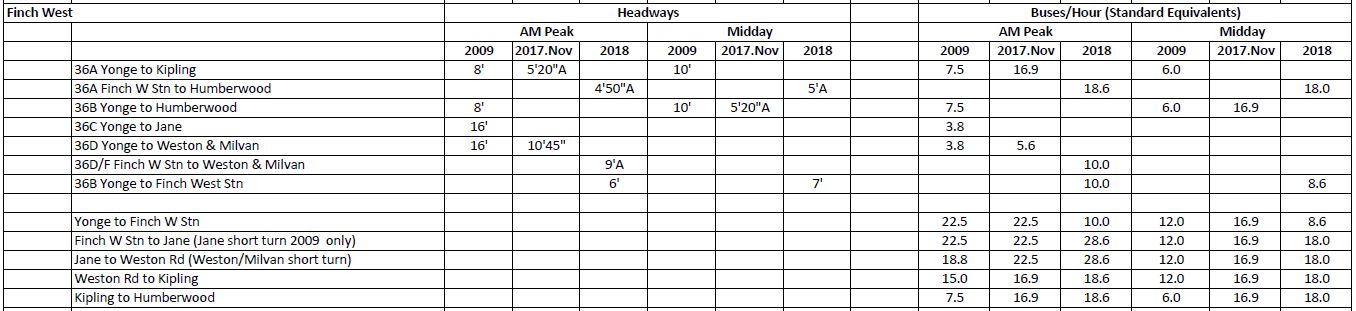
Finch West
During the AM peak, service improved slightly on the outer end of the route, notably west of Kipling, from 2009 to 2017, but on the eastern end of the route there was no change. Midday service saw increases over the entire route. When the TYSSE opened, service between Finch West and Finch Stations was cut by about 50%, but increased slightly on the rest of the route. Some of this cut will be restored in the fall of 2018 because demand was higher than the TTC anticipated.
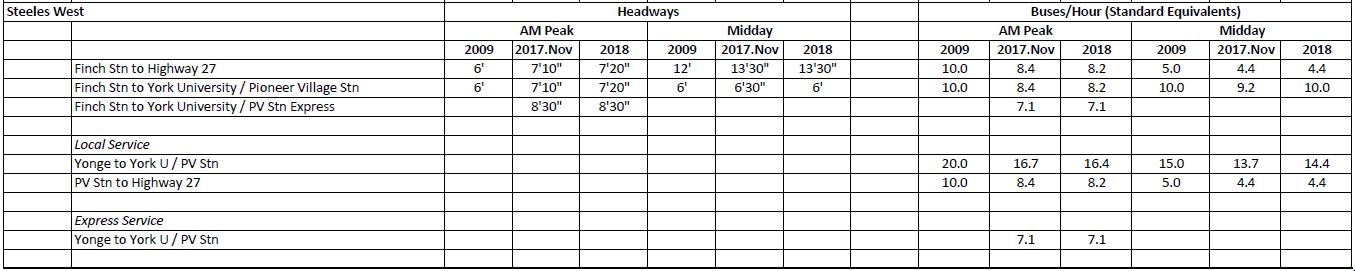
Steeles West
On Steeles West, there is less local service capacity over the entire route during both the AM peak and Midday comparing 2009 to 2017/18, but this is offset by peak period express service that did not exist in 2009.
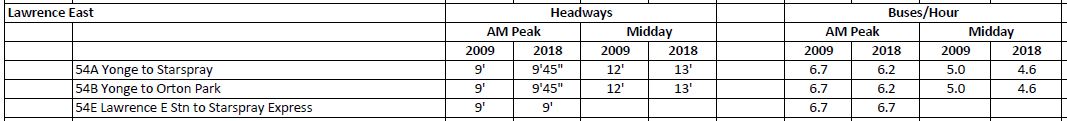
Lawrence East
Service capacity over the entire route is lower in 2018 than in 2009 during the AM peak and Midday periods.
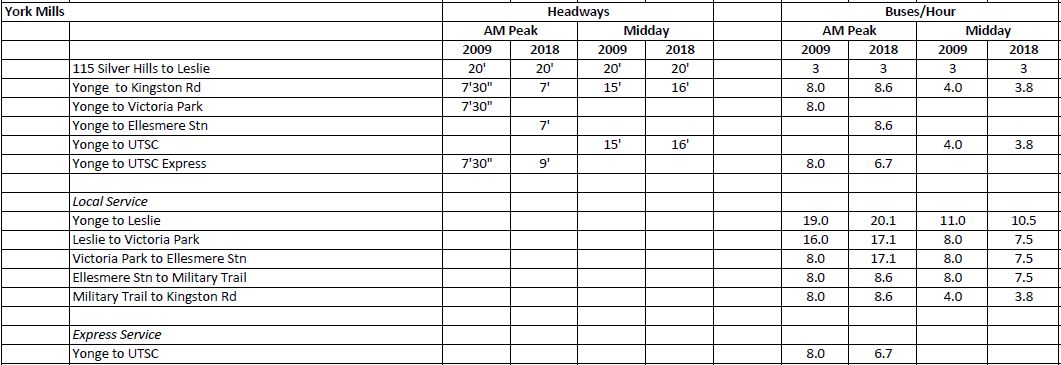
York Mills
Service capacity over the route has not changed much from 2009 to 2018 with some AM peak period adjustments between express and local service, and a slight decline in Midday service.
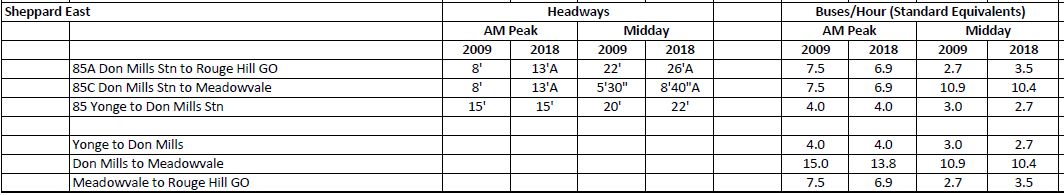
Sheppard East
Service capacity has generally declined over the route for both the AM peak and Midday periods.
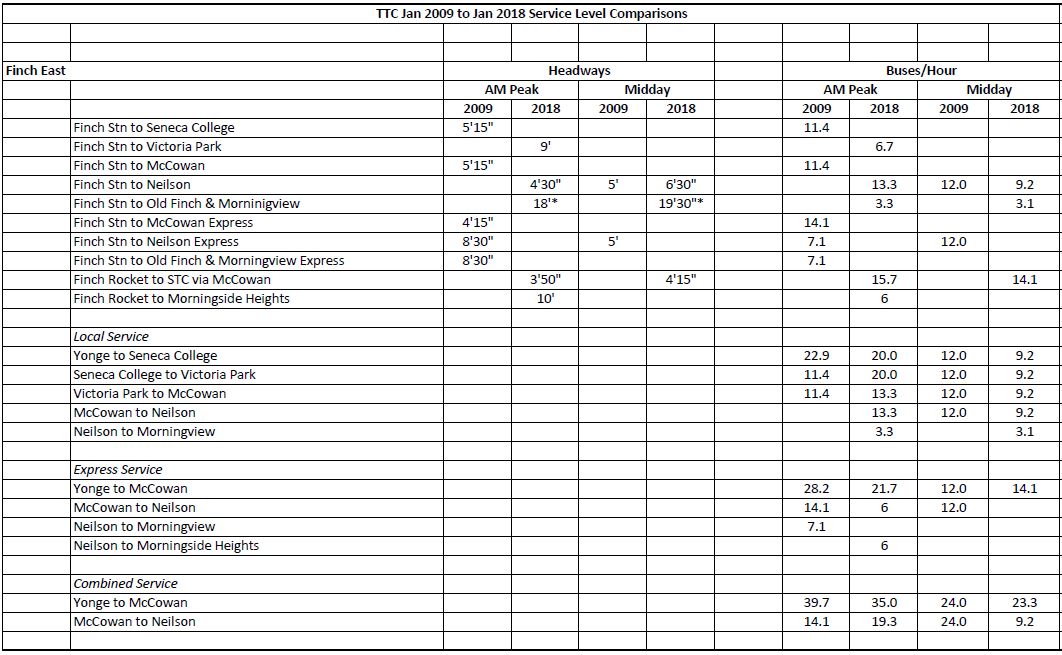
Finch East
This is a complex corridor with many overlapping services. During the AM peak there is some decline in service west of McCowan, and an improvement east of there. Midday service has declined slightly west of McCowan and steeply east of there.
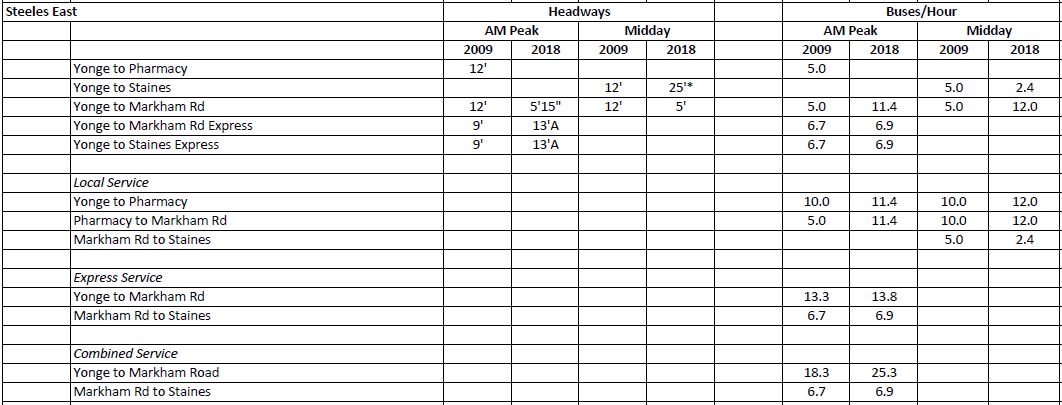
Steeles East
Service has improved in the AM peak primarily with the extension of the Pharmacy short turn to Markham Road.
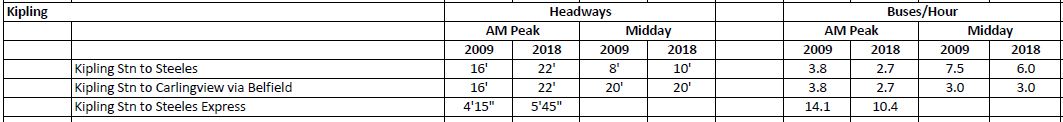
Kipling
Service on all branches in the AM peak and Midday is less frequent in 2018 than it was in 2009.
Islington
Service in the AM peak is unchanged from 2009 to 2018, but has been reduced during the Midday period.

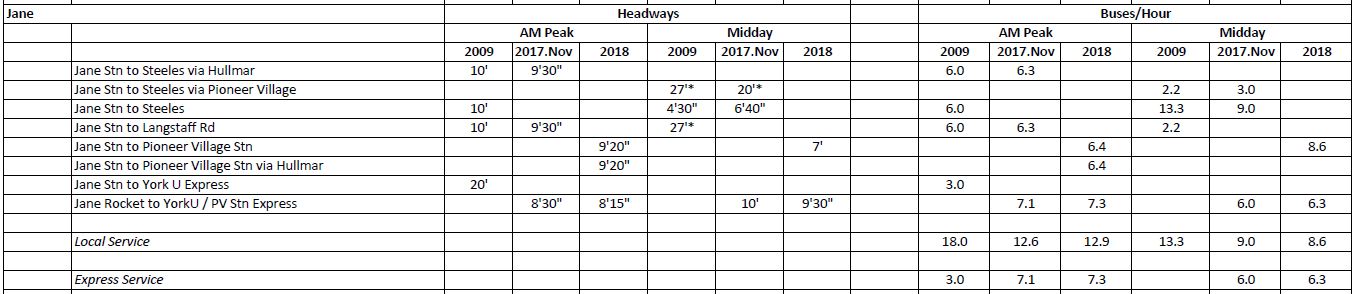
Jane
Service has improved slightly from 2009 to 2018, although there has also been a rebalancing of buses so that there are more express and fewer local trips.
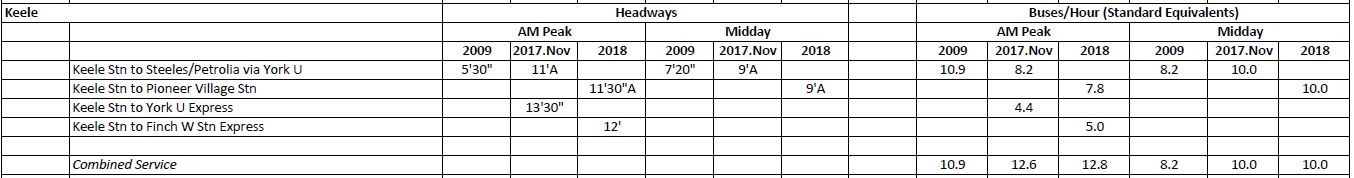
Keele
Service has improved during the AM peak and Midday with a rebalancing of local and express services comparing 2009 to 2018.
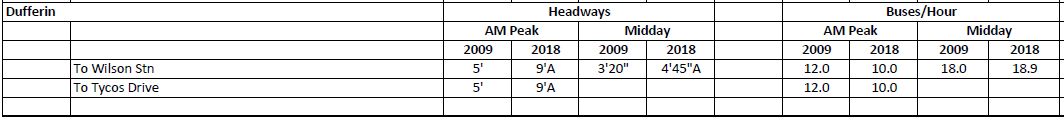
Dufferin
Service capacity has declined from 2009 to 2018 in the AM peak, and only slightly improved during the Midday.
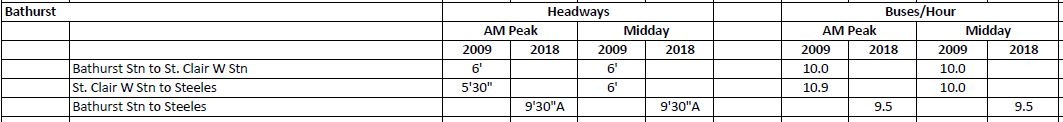
Bathurst Bus
Service capacity is slightly reduced from 2009 to 2018.
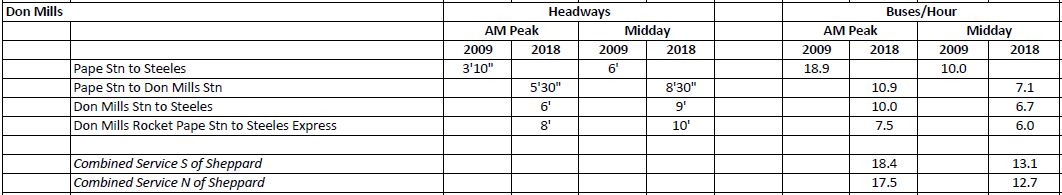
Don Mills
Service capacity in the AM peak is slightly lower in 2018 compared to 2009, while in the Midday service has improved.
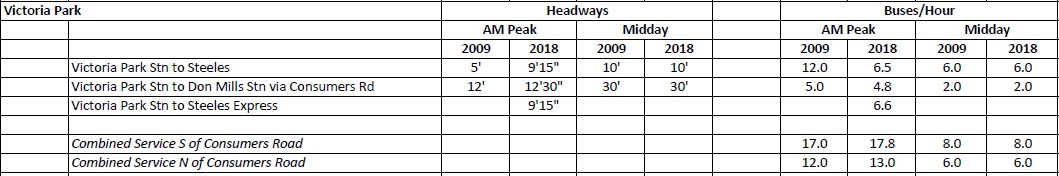
Victoria Park
Service capacity in the AM peak has improved slightly from 2009 to 2018 with a shift of some trips from local to express service. Off peak service is unchanged.
Warden
Service capacity in both the AM peak and Midday is reduced in 2018 compared to 2009.

Kennedy
Service capacity in the AM peak is unchanged from 2009 to 2018. In the Midday, the service to Steeles has been improved, but the Progress branch to STC is unchanged.

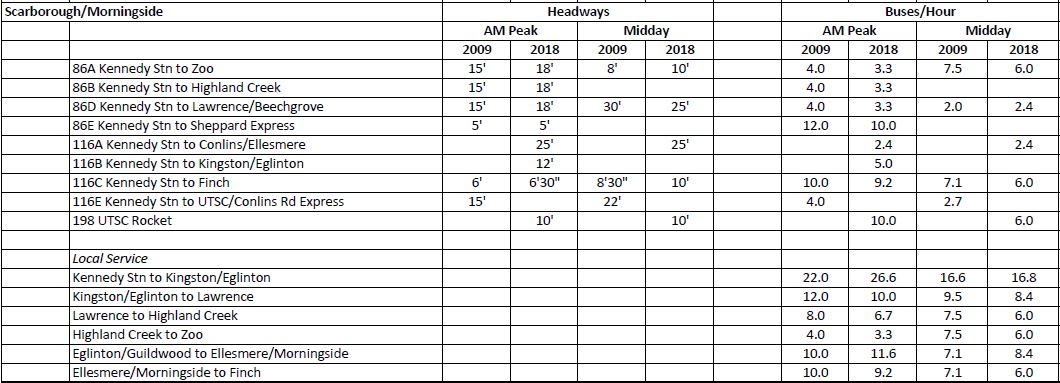
Scarborough/Morningside
The 86 Scarborough and 116 Morningside buses share mileage on Kingston Road, and so for the purpose of this comparison I show them together. There are ups and downs in service capacity depending on which part of the routes one looks at. The major change lies in the express service to UTSC which has been improved.

Another thing that should be pointed out is that there seems to be an overall trend to simplifying routes. This is especially apparent over the past 3 or 4 years.
Quite a few routes that used to run with 2 or 3 branches – with a much better combined headway over the busiest part of the route – have been simplified to have only 1 branch, and usually with no increase in vehicles. This means that while the outer ends of the route may have better service, the busiest portion is left dealing with worse service.
LikeLiked by 1 person
The City of Toronto grew by just over 200,000 people during 2009-2018, or 8%. Contrasted with the service expansion (or contraction) detailed here, the reasons for what we’re seeing with buses is obvious.
LikeLiked by 1 person
The design for Agincourt GO station came out. Look at the poor connection to the 85 and 190 bus. There are no protected access to reach the eastbound platforms bus stops. It is great for connecting west bound.
GO Transit is starting to take riders away in Toronto. When midday service came on the KItchener and Stouffville lines, it was literally ghost towns in those trains. Now, the 6 car trainsets are getting decent ridership. No one wants to use 70 minutes of their time getting downtown, when GO Transit will take less than 30 minutes. If people want to ride GO trains and the TTC do not connect to those stations, it is obvious that fewer people ride buses despite population growth.
In the aviation world, a plane sitting on the tarmac is not making money. Airline CEOs want their planes to be in the sky all the time. When the TTC is parking buses on midday and weekends, those buses are depreciating even though they are not serving Torontonians.
Steve: Some of the station designs for the new GO/SmartTrack stations are appalling in terms of access.
LikeLiked by 1 person
A correction, the 52F and 52G midday headways are definitely not 6’30” each. That would be the combined headway of the two branches which are 13’00” each. Overall service did improve between Royal York and Lawrence Station but not the entire route. The section where the 52A/B branch off at Scarlett Rd and Royal York is called Lawrence not The Westway which begins west of Royal York Rd.
Steve: Thanks for catching this. I was rearranging this portion of the table during the original edit, and got the headways on the Westway branch wrong in the shuffle. Also, yes, the name does not change until west of Royal York. The table has been updated.
LikeLiked by 1 person
Steve, not sure why in your description of the service on Steeles West you say that express service didn’t exist in 2009. Express service most definitely existed in 2009 with 60F to York and 60E to Kipling rush hour only services.
Steve: The peak services on 60 Steeles West in 2009 were ONLY the two “express” branches, and they only ran express from Finch Station to Steeles, but local on Steeles itself. This is by contrast to the 60E today which is a truly limited stop operation over the entire route.
LikeLike
They switched over to limited stop service in October 2009.
Steve: Yes, but my table is as of January 2009.
LikeLike
Thank you, as always, for your analysis. It seems no one cares what is happening on the buses. Lately service on the 41 during pm rush hour has been terrible. Gaps of 20-30 minutes, clusters of buses running together. The TTC offers the same answers of route supervisors are making adjustments etc traffic etc. It all rings hollow when the same problems happen every day. Service has declined fast in the past few months.
Related, I’ve noticed lately that the TTC is running 512 streetcars out of Gunn’s Loop “out of service”, passing waiting passengers, only to put them into service a few stops later. What is this about? Is this new? The vehicles appear in NextBus as in service. Why punish waiting passengers when you can run a proper headway?
Steve: It is possible that the TTC is attempting to restore regularly spaced service by “dead heading” cars some distance from the terminal to space them out. However, given the general lack of attention to headway management by the TTC (they only measure it at the terminals), I suspect this could simply be operators making up for taking longer layovers than are justified. Any ops with further info on this are welcome to comment.
LikeLike
Regarding Tara’s account of 512 St. Clair: Steve is correct as to the streetcars “expressing” to a point on the line in order to balance headways. It is essentially a short turn (without it being recorded as such) however would have a return to service point shorter than the short turn location. This method is more predominant with bus operation however is being more used in streetcars (the subway also does this).
Steve: I first saw this technique decades ago in Boston from which the new CEO Rick Leary hails. He would be well-acquainted with it.
LikeLike
Since streetcars often pick up random citizens on Bathurst north of Bloor while deadheading to St Clair in the AM; it seems inconsistent, to say it nicely, for some of the same operators to deadhead past actual St Clair clients, on the job. What gives?
Steve: This is a classic left hand, right hand problem at the TTC. There is no reason for streetcars to dead head on carhouse trips, but some do. Buses do this regularly in order to run express and shave time on schedules.
LikeLike