Updated February 24, 2016 at 10:40 pm: A map showing the various options for a Pape-Queen routing to downtown has been added at the end of this article.
The City of Toronto Planning Division has released the detailed technical scoring for evaluation of six possible routes for a Relief Line linking the core area to the Danforth subway.
The possible routes that survived a preliminary cull were:
- A: Broadview to Queen crossing the Don River at Queen
- B1: Pape to Queen crossing the Don River at Queen
- B2: Pape to Queen, dodging south to serve the Unilever site before crossing the Don and swinging back to Queen Street
- C: Broadview to King crossing the Don River at Queen
- D1: Pape to King crossing the Don River at Queen
- D2: Pape to King crossing the Don River at the Unilever site
Of these, the two Broadview options don’t fare very well, and the real debate is between the four remaining Pape options.
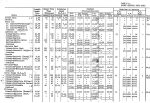
The scoring extends through many categories and pages, but to simplify things and understand just how each factor was ranked, I have consolidated the scores into a spreadsheet. (For the detailed evaluation, refer to the scoring document linked above.)
ReliefLineAlignmentScoringSummary
In place of the scoring system used in the city summary, I have converted each of the symbols to a numeric value:
- Full moon = 4 points
- 3/4 moon = 3 points
- Half moon = 2 points
- 1/4 moon = 1 point
- New moon = 0 points
Within each major grouping of scores, the values were totalled and then normalized to the range of zero to one. For example, if a group contained 4 topics, then the maximum possible score is 16, and each alignment’s score is divided 16 to get a normalized value. This allows the scores from each group to be compared with each other.
At the end, the scores can either be summer individually (each topic counts equally), or the group averages can be totalled (each group count equally regardless of how many topics it contains) and normalized.
On a grand total basis, both the city’s technical evaluation and public feedback came to the same conclusion: even though there are variations between the four alignments, they all average out to a 3/4 score.
The point scores also come out close to the same with higher values on one item balancing lower values on others for, overall, an even ranking.
Quite simply, all other things being equal, the four alignments are more or less equivalent using this scoring system. However, the City opted for alignment B1 because, among other things, is is claimed to be cheaper and simpler to build.
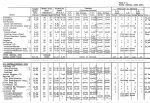
The costs estimates in the City’s evaluation [at p.19] are:
- $3.7-billion for either of the Pape via Queen options regardless of whether they follow Queen or King to the core
- $4.0-billion for the Pape-Unilever-King option
- $4.1-billion for the Pape-Unilever-Queen option
The ridership estimates are generally higher for the via King options, and higher still for the routes serving the Unilever site. In all cases, off-peak riding tends to be low compared to the rest of the network with roughly 2/3 of all boardings on the Relief Line being during the AM or PM peak. The effect is even more striking for configuration where frequent SmartTrack service at 12 trains/hour competes with the Relief Line for customers. This demonstrates the problem of a line aimed at primarily peak period “relief”. As and when we see projections for longer versions of the RL (to Eglinton or Sheppard), the balance of off-peak travel may change because the route will serve new subway territory, not simply provide an alternate route for existing trips.
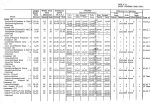
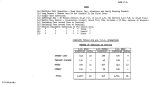
Despite the even scoring overall, the preferred corridor was selected based on giving some criteria additional weight as shown in the table below.

This evaluation, like so much other recent work, depends very much on the presumed presence of frequent SmartTrack service in the rail corridor. If that is found to be impractical, then the relative importance of the RL changes along with its appropriate alignment to serve the core. This is particularly critical at the Unilever site which would have only SmartTrack serving it if the RL stays on Queen Street.
One point above misrepresents the technical evaluation: both of the Queen Street crossing routes have the same cost estimate regardless of which route they take to the core area (Queen or King) and they share the same river crossing characteristics.
In summary, the choice “makes sense” in the limited context that a frequent SmartTrack service will actually be feasible and will be built. If SmartTrack cannot be provided on a five minute headway with a low fare, then the entire planning process will require a major rethink.
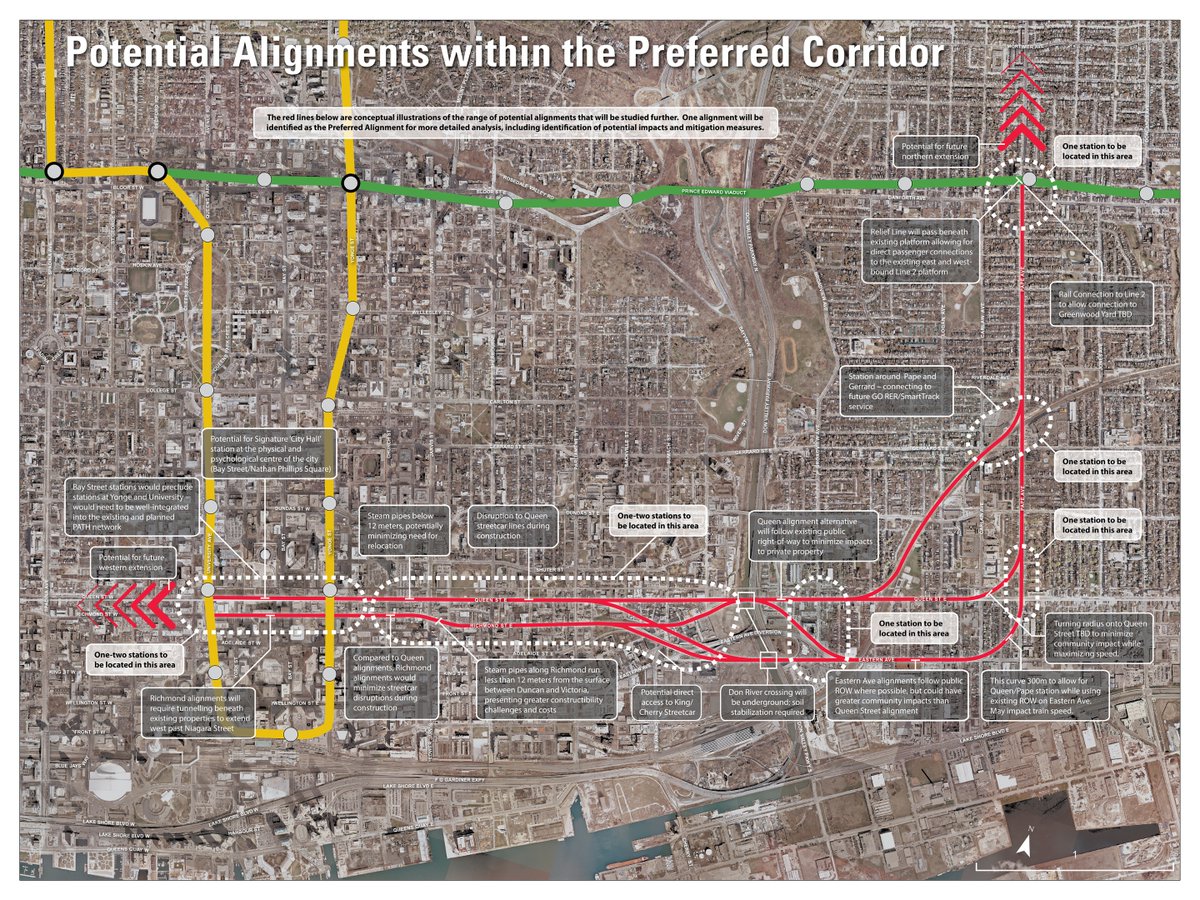
Updated February 24, 2016: The following map shows possible alignments for a route from Pape & Danforth to the core area. Notes on the map talk of a track connection at Danforth to provide access to Greenwood Yard. The technical scoring paper also mentions a southerly route under the rail corridor from Gerrard & Pape eastward. While this is longer, it would avoid the complexity of adding linking curves at Danforth.