
Updated September 24, 2015 at 11:30 am:
Metrolinx has released details of its daily ridership counts.
Although they claim via Twitter that ridership is going up, when the numbers are actually graphed, this is not true.
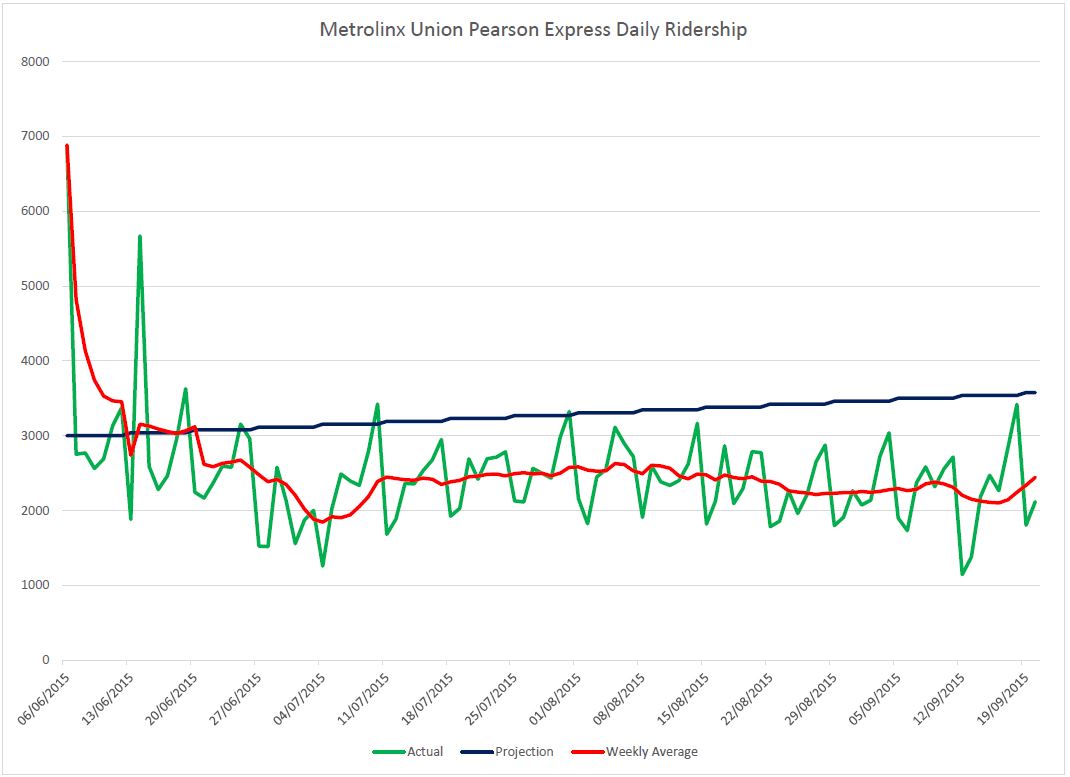
The chart below shows:
- The projected ridership rising from 3,000 per average weekday to 5,000 over the first year of operation (blue).
- The actual ridership from the Metrolinx stats (green).
- The moving average weekly ridership (red). For the first six days, these are the values for the operation to date.
It is quite clear that the ridership has settled into a regular pattern after a dip in early July. There is little evidence of a Pan Am Games effect on the numbers. As and when Metrolinx releases additional ridership data, I will extend this chart.
What is missing from the Metrolinx data is a statement of the average fare paid and a breakdown by fare type. This would reveal both the nature of ridership and the effect, if any, of promotional fares on demand.
The original article follows below.
