
The City of Toronto adds its voice to the debate over transit revenue generation with a report at its Executive Committee meeting on April 23, 2013. There are actually three sub-items on the agenda:
- The main staff report giving background information and proposing the revenue tools that staff recommend Council endorse.
- A summary of the consultation conducted by the Planning Department under Phase 1 of their “Feeling Congested” campaign.
- A summary of the poll taken by Ipsos-Reid to survey city residents on their attitudes to new revenue tools.
Staff recommend that seven new revenue tools be implemented in two phases. The first phase would include:
- Fuel tax
- Sales tax
- Commercial parking levy
- Development charges
The second group would not kick in until the so-called “first wave” of Metrolinx projects (to be funded mainly from general provincial revenue) are completed, likely about 2020.
- Highway tools
- High Occupancy lane tolls (HOT)
- Vehicle registration charge (VRT)
The premise for the staged implementation is that new taxes affecting motorists exclusively are inappropriate (and politically impractical) if an alternative to driving does not exist.
Other groups have proposed their own preferred list of revenue tools, and there are many overlaps with the City’s list.
- Only a reintroduced VRT is not on the Metrolinx short list.
- The Toronto Region Board of Trade favours all of the City’s first group except Development Charges, and includes HOT revenue as a fourth component in their list.
Public consultation though “Feeling Congested” and the Ipsos-Reid polls showed very high support for the concept of dedicated transit funding, but responses on which tools were preferred varied between the two samples.
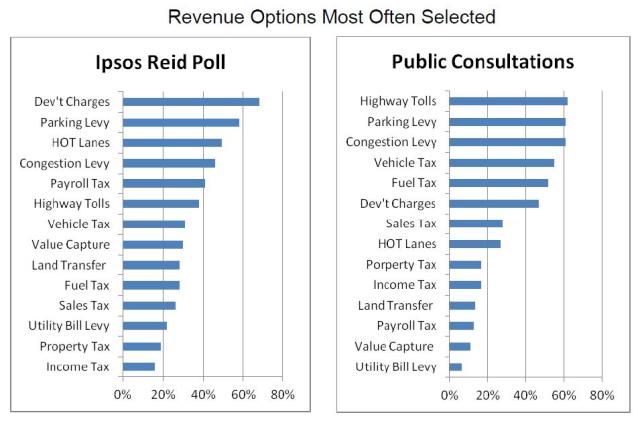
[Source: City staff report, page 11]
The Ipsos-Reid group is supposed to be statistically representative of the city as a whole, while the Feeling Congested group will be weighted with self-selected respondents and participants in the public workshops. It is not clear whether each group had a comparable understanding of the amount of revenue each tool could potentially generate. In any event, well over 80% of the participants in both cases agreed with the premise of new revenue tools.
This figure is at odds with other reported polls in which under half of all respondents agreed to paying new taxes or fees to support transit expansion. Some political and media reaction has turned as much on the “we don’t trust those bastards with our money” argument as on any discussion of the underlying need for more and better transit in the GTHA network. Alternative funding schemes such as increased government efficiency or casinos, not to mention the billions supposedly available for the taking in the private sector, amount to fairy dust, but many voters are easily swayed by something-for-nothing hucksterism.
Notable by its absence from the potential revenue tools is the corporate income tax. This issue has been raised by many at the public feedback sessions, by the NDP at Queen’s Park, and even in the staff report:
… the Province should consider maintaining its Ontario corporate tax rate freeze, at 11.5%, rather than reducing the rate to 10% once the provincial budget is balanced. This could generate a total of $1.5 billion provincially, or approximately $750 million GTHA-wide on an annual basis, which could be applied as an investment tool to fund regional transportation expansion. [Staff report, page 16]
City staff are cautious about issues related to municipal funding including the responsibility for maintenance of projects Metrolinx builds, and the future status of municipal payments to the GO Transit capital program ($20-million by Toronto in 2013). Although 25% of “next wave” funding is earmarked for municipalities, the rules, if any, about how this might be spent don’t exist yet.
Another concern is municipal participation in project selection for the “next wave”. This affects the entire GTHA, and has already cropped up in a “what’s in it for us” sensitivity in many locations. (I will turn to this in a separate article.)
A separate report to Council will address priorities as seen by City Planning staff, as well as issues of governance and transparency for the administration of the new tax revenues.
Detailed Responses by City Quadrant
The Ipsos-Reid and “Feeling Congested” surveys are broken down by city quadrant and reveals different attitudes and concerns across the city. Support for transit funding is uniformly strong, but the details vary with local conditions.
Ipsos-Reid
For some revenue tools, there is not much spread in the percentages across the four quadrants (these must have some degree of statistical error, although its magnitude is not specified in the report).
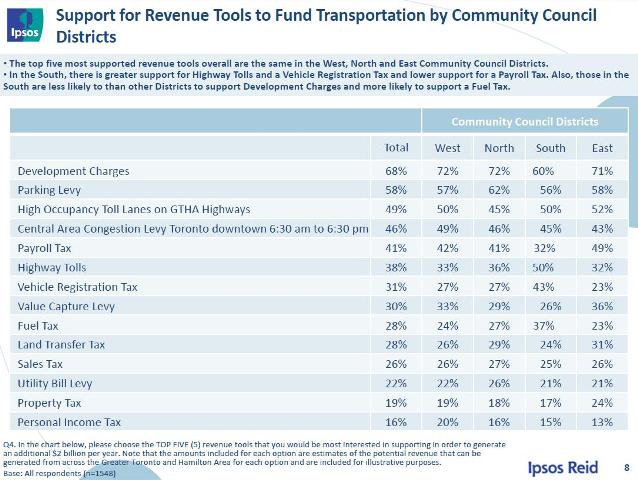
[Source: Ipsos-Reid report, page 8]
Development charges fared poorly in the “south” where, presumably, there are enough condo owners to fear the effect of such charges on future prices. Payroll taxes were also unpopular in the south likely reflecting a higher average income there.
By contrast highway tolls, vehicle registration taxes and fuel taxes were much more popular in the south than elsewhere no doubt because people in the suburbs are more likely to be car-dependent.
92% of respondents favoured dedicated revenues for transportation infrastructure with 49% in the “strongly favoured” camp. Either the survey managed to miss a substantial portion of “Ford Nation”, or that group has a fundamentally different attitude to transportation funding than the Mayor. The lowest support, at 88%, was in the western quadrant. (See page 14)
Support for spending on all forms of transportation is strong with cycling bringing up the rear at 61%. The differences between support for transit, road and highway spending are similar except in the south where highways understandably rank lower, but still at 76%. These numbers suggest that respondents are happy to see money spent on everything and were not really presented with the challenge of options limited by available financing. (See page 16)
The demographics reveal an interesting breakdown of modal use by the participants. 47% drive as their primary means of transportation while 41% use transit. This is a considerably better split than we see in city-wide transit modal share statistics, and begs the question of how the numbers can be reconciled. Driving is higher in the suburbs, over 50% in all cases, but only 27% in the south. Transit is strong in the south and north quadrants (48% and 43%), with considerably lower use in the east and west (37% and 34%. Cycling and walking are the primary mode for slightly over one quarter of respondents from the south, with cycling being consistently well below the level of walking. (See pages 20-21)
Looking at the purpose of trips versus the mode chosen, transit wins out over cars, slightly, for work trips, and much more strongly for school trips. Again, the regional breakdowns show the effect of much higher transit and lower auto usage in the south quadrant. For shopping and errands, cars win out by a wide margin in the suburbs while autos, transit and walking show comparable figures in the south. This is no surprise given the built form of the older parts of the city where housing and much shopping are side-by-side. Visits to family and friends show a similar strong auto-orientation in the suburbs, with transit and autos sharing the market in the south. Transit numbers are likely affected for all types of non-peak travel by service quality and network connection issues. (See pages 22-24)
Of the respondents who use transit “monthly or more often”, the breakdown of transit modes used is quite interesting. Overall 89% report using the subway and/or SRT, 76% a bus route, and 52% a streetcar route. Understandably the streetcar number is highest in the south (74%) but it also is reported by a substantial number of transit users from the other three quadrants. This suggests the streetcar routes are acting as part of trips that begin in the suburbs and come downtown by subway, and they are an important part of the distribution system for the rapid transit network. Buses also represent an important part of the mix showing their roles both as feeders to the rapid transit network and for travel within the suburban quadrants. Almost 90% of transit riders may use the subway, but the importance of the surface network cannot be ignored. (See pages 27-28)
Feeling Congested
Feedback from participants was solicited in a different way from the Ipsos-Reid survey, and some of the questions asked were different. Also, of course, participants were self-selected rather than being recruited to fit the statistical demographic of the city.
As a first exercise, participants were asked to chose among eight rather loosely-defined objectives for making decisions about a transit network.
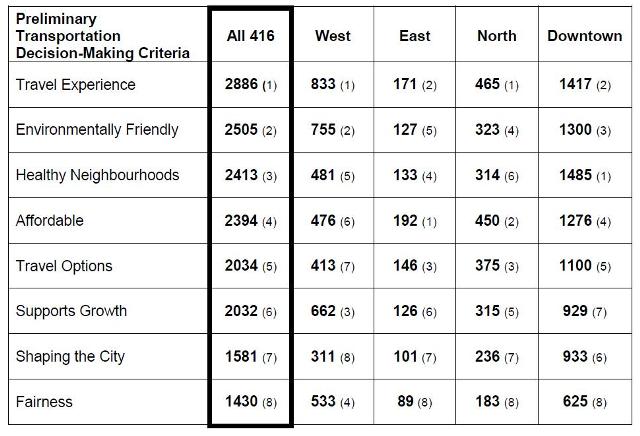
Source: Feeling Congested Phase 1 Summary, page 9. The definition of each criterion is on page 8.
This table reveals a few important points, notably that the sample is overwhelmingly from the downtown quadrant. Consolidated figures should be used with care unless they reflect an across-the-board agreement with the smaller samples from the suburban areas.
Travel experience consistently ranks high across the city, but affordability shows up as the top choice in the east, and as second choice in the north. (Advocates of fare by distance should take heed on this count.) Some of the planning goals such as supporting growth and shaping the city fall lower. Whether this is through disinterest, or simply because attributes more closely linked to actual transit service took precedence, is hard to say.
In both Scarborough and North York, “travel options” brought out the issue of directness of route, transfers and travel times. Both of these areas have surface networks oriented to feeding the subway, but not as well-designed for travel that isn’t oriented to the rapid transit network.
The criteria of “Fairness” and “Equity” overlapped somewhat, but the importance of transit to improve mobility in the suburbs was flagged in both Etobicoke and Scarborough.
“Affordability” means different things to different people. To some, notably in Scarborough, it means keeping the cost of transit low. To others, it means an avoidance of excessive spending. This is a clear example of the lack of clarity and focus in this part of the “Feeling Congested” surveys.
As in the Ipsos-Reid poll, over 90% of participants support dedicated revenues to fund transportation infrastructure. Concerns raised about how the money would be collected and administered, as well as issues of fairness to low-income families, also mirrored Ipsos-Reid. (Page 14)
Feedback on the individual revenue tools is not broken down by region in the “Feeling Congested” report. The comments on specific tools (pages 18-19) are, therefore, likely disproportionately representative of the downtown quadrant and this could explain the difference in tool ranking here versus the Ipsos-Reid numbers.
Finally, a breakdown (Page 20) shows the preference for new spending if it is directed to specific areas. Roads and highways rank higher in the north and east while cycling and pedestrian infrastructure rank strongly downtown. Transit does well, at over 75%, everywhere. The very high rank for cycling downtown reflects, I suspect, the effect of self-selection of the participants. We know from Ipsos-Reid that cycling represents a comparatively small part of the travel market (although this could grow with better infrastructure), but a very vocal one. Pedestrians are not far behind.
Concluding Thoughts
The support by Toronto Council for a suite of transit revenue tools, taxes or whatever we want to call them, will be essential to the overall regional push for improved transit. There is political support “out there” in the 905 and at Queen’s Park, although there’s a lot of looking over the shoulder to see if anyone is actually following in the parade.
In a separate article, I will turn to the question of The Big Move and the “Big Gap” (real or perceived) between what it claims will be accomplished and what voters and municipal politicians might see as benefits that will flow from new taxes.
This report will go to Executive where it will meet a hostile response from the Mayor whose well-publicized reaction to any shopping list of new taxes was a puerile barf, not the most sophisticated of responses, but typical for what passes for leadership. Whether the report will survive unscathed to go to Council, or whether there will be an attempted pocket-veto at Executive, remains to be seen.
Council may once again have to relieve the Mayor of his control of the agenda if they are going to take any responsibility for transit funding and planning. Regardless of which tools Councillors may favour, simply allowing the Mayor to bury the issue would be unacceptable, and would undermine Council’s credibility on the transit file. There will be time to debate which tools Toronto will prefer and what we might do with the money, but that debate must occur in Council where all of the city is represented.

It is interesting but hardly surprising that people in Toronto’s inner suburbs feel left-behind (in terms of service) if they are not using the subway. Your other post about service reliability reinforces this with the point that each connection means less chance of getting ‘good’ service.
More than 20 years ago my school trip involved taking 3 buses (Lambton 30, Jane 35, and Eglinton West 32). If I could catch the 35E (which stopped at Dundas, Woolner and Eglinton) my trip would be at least 10 minutes faster … but the 30 and 35E (or the 32 and 35E on the homebound trip) didn’t always hit schedules and that meant missing a connection and waiting.
20 years later I don’t think anything has changed … which makes me wonder about the level of interest among TTC staff in offering expanded ‘express’ bus (let’s call it “Rocket”) service on the “Avenues” that aren’t getting LRT lines?
I think of Wilson/York Mills/Ellesmere, Steeles, Jane, Dufferin, Don Mills, Vic Park and Kennedy as good examples of cross-city corridors that won’t be getting LRT but need better, faster, more reliable and frequent bus service.
I know it is too much to hope for something like Chicago’s Ashland BRT for Toronto any time soon, but what about expanded express bus service, following the VIVA/ZUM/MiExpress/B-Line examples from other municipalities in the GTHA?
Cheers, Moaz
Steve: The TTC had a plan for express services as part of the Transit City Bus Plan, but that was killed off even before Rob Ford became mayor thanks to a tiff between Adam Giambrone and David Miller’s Budget Committee. The report is still on the TTC’s website. It should be revived, but modified to get rid of some of the more thick-headed TTC management proposals.
LikeLike
This is why priority one should be to actually follow through with one of the older promises. For Metrolinx, perhaps Lakeshore Line electrification. For TTC, perhaps getting the buses and streetcars out of their terminals on schedule (or on headway as the case may be).
What promise isn’t super important, but it’s important to eliminate the “They just can’t be trusted” factor.
LikeLike
The Ipsos Reid results are surprising. I would be interested in the details of their sample selection and in seeing a copy of the questionnaire. These are not described in the summary report.
Do you know if the full report is publicly available?
Steve: You would have to check with Ipsos-Reid, but I suspect that the lion’s share of the info you will get from the City-sponsored survey is in the report that’s online. In retrospect I think that the difference with earlier media reports lies in the geographic scope of the survey. The City’s survey was taken entirely within the 416 and is balanced for the populations of the four quadrants. The one reported in the press covers the 416 and 905. Also, I think that the City survey contains many more questions than a straight “do you support new taxes” query.
LikeLike
Given (1) An 11.5% corporate tax rate generates $1.5bn/year more than 10%; and (2) the federal government cut their corporate tax rate by 1% last year, Ontario should increase it’s corporate tax rate by 1% to raise an extra $1bn/year. Companies would be paying the same tax rate as they were a couple of years ago – just a larger proportion of it would go to the province. If the feds don’t want to use the income to balance their budget, then I’m sure the province could use the cash…
LikeLike
There’s something a bit worrisome within the ExCttee 31.3 — the use of “transportation” instead of transit. While most of us are thinking where do we get the bucks for more transit, the City/staff are using the term “transportation” – which could be twisted to be used for road projects. Like if there’s a Conservative minority government at some point, could this term be used to divert big bucks into highway projects eg. Gardiner? Or something else?
I don’t trust them.
Also, we need to bear in mind that cars/trucks are subsidized – a figure from Vancouver some years back was $2700 per car per year. So maybe we should be trying to get automobility as a system to the same degree of user pay as GO/TTC.
Yes, that would be disruptive. But peak oil is arriving; peak atmosphere is here now.
Steve: It has always been about revenue for “transportation”. A transit only report would never make it out of the Mayor’s office, and even Metrolinx acknowledges that a small portion of the new revenue will be spent on roads and highways by municipalities.
LikeLike
Steve I’m not sure if I missed this in the material but are the Sales Tax and Gas Tax applicable to the GTA only?
Steve: All of the proposals were intended to be within the GTHA, but there is always the possibility of a province-wide implementation with the out-of-GTHA revenues going to transportation projects in those areas.
LikeLike
Steve,
I keep hearing the Doug&Rob Ford dog-and-pony show say stuff like “The Province should find efficiencies” or “We should have Public/Private Partnerships” or “We just have to manage our money more efficiently” or… and also stuff like “Families can’t afford the costs that would be needed” or “People don’t want to be taxed [uh, duh, no but without taxes, stuff like hospitals or road maintenance or whatever we’ll end up as a user-pay system like in the Renaissance Period when all the lower class folks ended up in debtors’ prison].
In fact, I’m listening to Doug Ford soapbox with the host on CBC Radio’s Here & Now show and I’m wondering what I can write in an e-mail to him and/or Rob to basically tell them to shut up, that this train has already left the station and we need, as a city and region, understand that since nobody built this stuff for the past 40 years (hence saving all these taxpayers any smaller “pain” over that period) we are now stuck with the painful decisions or actually building the stuff we need with regards to transit funding – not that either of these guys will actually listen or care….
LikeLike
On a further note, Premier Wynne has gone on record saying that the tax increases and collection would be regional (GTHA) but she has also said that she will listen to Metrolinx recommendations when they are delivered.
Province-wide increases to existing taxes (with those revenues dedicated to transportation) are probably quicker, easier and less costly to implement than ‘new’ taxes that have boundaries at which there will be leakages.
I think we will know more when the budget is delivered on May 2nd … and over the month of May we will see revenue sources and spending (inevitably) start to shift in anticipation of the new revenue tools.
Cheers, Moaz
LikeLike