
Updated December 25, 2009 at 11:40 pm: Most of the links from this article were not working because I saved the files under different names than I used in the links. Sorry about that. This has been fixed.
In a previous article, I looked at the revenue side of the TTC’s budget where, despite an 11% increase in fares, the total revenue only goes up about 4%. Now I will turn to the expense side of the budget.
The material in this article is abstracted from a presentation (not available online) given by TTC staff at the December 16, 2009, Commission meeting. The overview report is available.
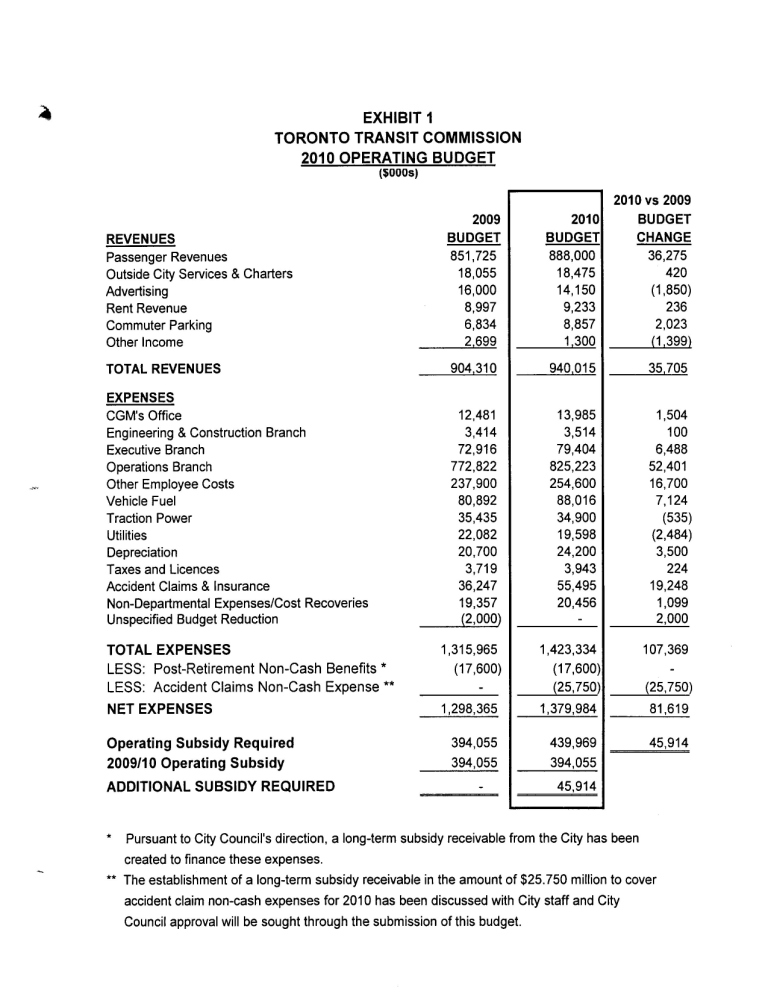
Total expenses will rise from $1.298-billion (probably 2009) to $1.380-billion, or $82-million, a 6.3% increase. This comes from many separate increases, some of which have net new staff attached to them. Unfortunately, the TTC gives the dollar increase for each factor, but does not break out the 2009 numbers for comparison. For example, two areas might both see $3-million increases, but we don’t know how much was spent on each of them in 2009 and so lack a frame of reference. (The reason we cannot simply look at the 2009 budget and financial reports is that the breakdown of the 2010 budget is on a different basis.)
A striking point in a number of these items is the sense that the TTC is making up for reductions in maintenance forces that have compromised the quality and even the safety of the system. Individually these are small, but from past experience, I must ask what other “cost containment” effects have yet to be reported or acknowledged.
Many of the increases this year are, no doubt, justified but the absence of any analysis or review of existing spending offers a target for budget hawks when the TTC seeks a higher subsidy at Council.
The TTC produced an outlook to 2013, but it is almost meaningless because it presumes no ridership growth (462-million rides every year for the next four years), no change in fare structure, and a rise in expenses from $1.380 to $1.629-billion (about 6% per year even with a flatlined operation). This is not credible, and discussion of future transit funding, service and fares must be based on better information than this.
Whether the Commission chose to have “frank discussions” (to use diplomatic language) in private and keep the dirty laundry out of public view, or simply were buffaloed by the material staff presented, I don’t know. Toronto, and transit generally, are ill served by the lack of full and comprehensible information.
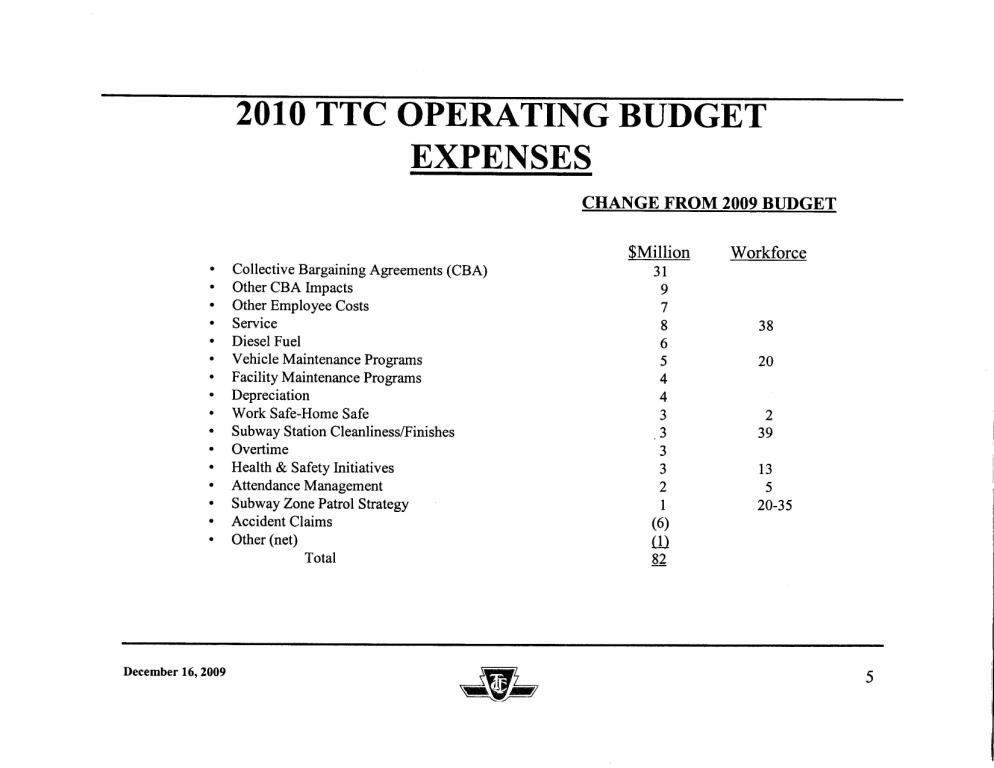
2010 Expense and Workforce Changes
The following sections have been reordered from the presentation to group related items together.
Employee Related Costs
$31-million is attributable to the Collective Bargaining Agreement which was imposed by arbitration.
There will be a 3% jump on April 1 ($22-million), various benefit improvements ($5-million) and a pension contribution increase of 0.5% ($4-million).
400 fewer operators will be hired in 2010 than in 2009, and this means that fewer operators will be paid at the lower introductory rates. This and other seniority-related progressions add $7-million on a base of $750-million.
Because the workforce is gaining seniority overall, vacation entitlements will grow by 1,119 weeks overall requiring 20 new operators to maintain service at existing levels at a cost of $2-million.
There will be a net additional $7-million from increases such as health care, pension, and employment taxes, and a decrease in sick benefit costs.
The total increase in employee related costs is $47-million.
I was a bit surprised that the fully burdened cost of a new operator is priced at, effectively, $100k (20 operators for $2m). The added vacations translate to about 56 weeks per new operator, and this implies that some overtime will be used to cover this.
Overtime
Overtime is projected to rise by $3-million in 2010 for a variety of reasons, but the budget presents no indication of what current overtime experience might be. The general approach is to trade off overtime costs (which are typically at 1.5x the base rate) with the fully burdened cost of additional staff.
Attendance Management
$2-million is added to the budget to fund a program aimed at reducing the absence rate by 1%. A pilot at certain locations has already achieved this saving, and rollout of the program to the full system will more than pay for its cost. The saving shows up in a different budget line.
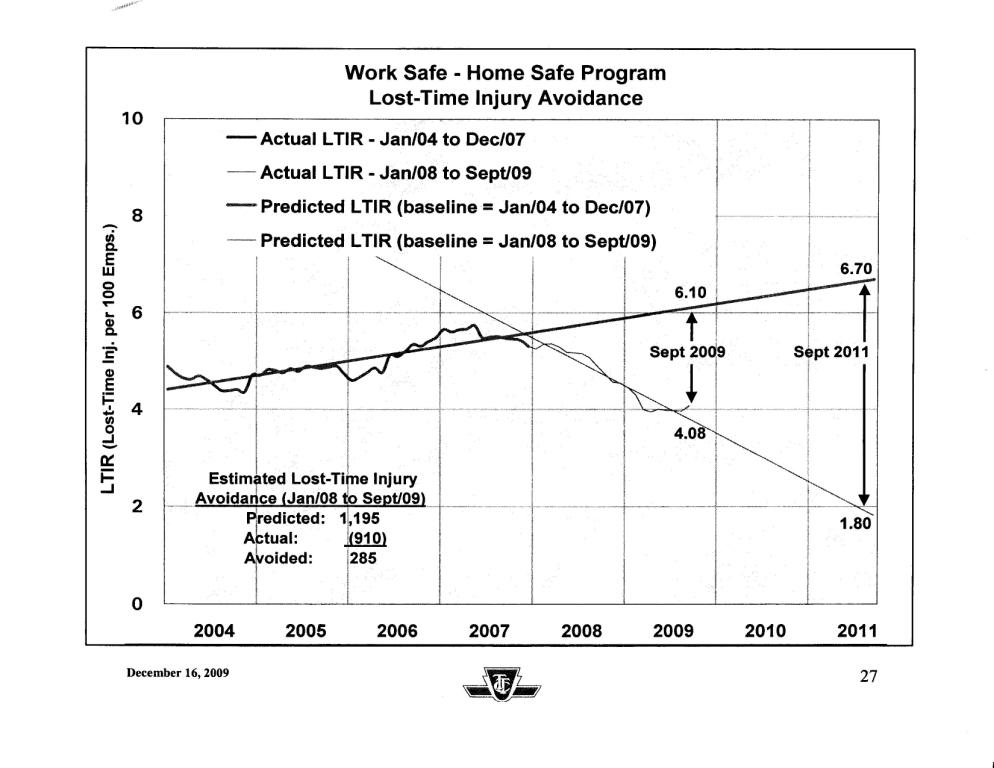
Lost Time Injury Avoidance
The TTC engaged a consulting firm to implement a program to reduce lost time injuries, and this has shown a marked decline in the rate per employee from January 2008 through September 2009. Based on past trends, 1,195 injuries were predicted for this period, but the actual number was 910. Any reduction in injury rates affects the TTC’s WSIB payments and this shows up as a reduction in employee costs.
At September 2009, the rate had declined from over 5.50 per 100 employees to 4.08.
Performance payments to the consulting firm are due at the 40% and 60% reduction points, and if the trend continues, the TTC will have a one-time payment of $3-million due in 2010. However, the graph of the LTI rate has been quite steady at about 4.0 for much of 2009, and it is unclear whether this is a temporary or permanent plateau.
Also unclear is whether injuries cease to count as “lost time” simply because the TTC finds alternative work (such as Bloor-Yonge platform monitoring) for employees who would otherwise be off work. In other words, is the workplace safer, or does the TTC simply have other things for some of their injured employees to do?
Lost Time Injury Avoidance Chart
Health & Safety
$3-million is added to the 2010 budget to cover additional costs of Fitness for Duty testing and supervision, as well as three sets of new employees.
- 7 additional staff are needed at Divisional Offices to reduce the amount ofvault handling by individual employees. This is a side effect of the new, heavier tokens and the limits on the amount of heavy lifting permitted by WSIB. Previously this was addressed via overtime and spare staff, but the last arbitration limits the TTC’s ability to backfill with spare clerks. Having 7 new staff is $200k less expensive that paying overtime for this work.
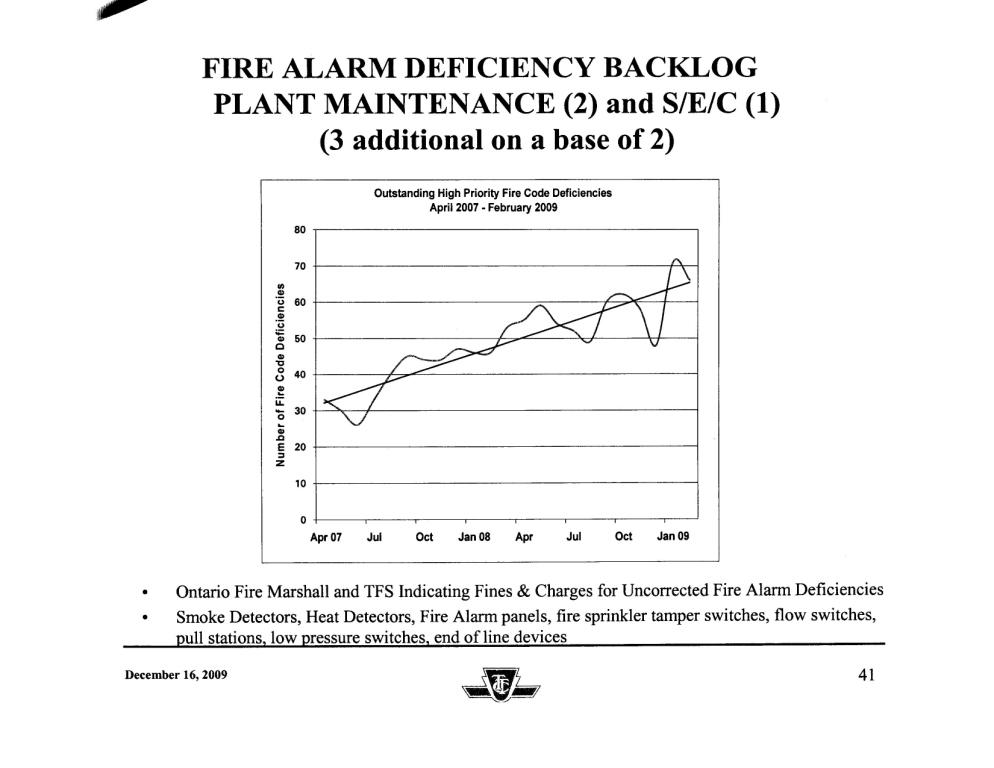
- 3 employees are added to catch up with a backlog of firealarm deficiencies. The number of outstanding high priority fire code deficiencies has risen consistently over the past few years to the point that fines and charges would be laid against the TTC. The new staff (added to an existing group of 2) will address this problem, but it will take two years to work through the backlog.
- 3 employees are added (making 4 in total) for Track & Structure inspection and maintenance.
Service Related Costs
There are two versions of the service cost projections. One is without the fare increase (and associated service cuts to match lost ridership), and the other is with the fare increase. Some components are unchanged between versions.
The original increase due to service was budgeted at $15-million made up of:
- $5-million for additional costs (over 2009) of dealing with City construction projects.
- $5-million for full-year costs of the Queen 501 reliability project, new express bus routes and service adds for overcrowding.
- $3-million for capacity lost to low-floor buses and traffic congestion.
- $1-million for 20 additional Route Supervisors.
- $1-million for the Transit City Bus Plan starting in November 2010.
The revised budget lowers the increases for Service by $7-million to $8-million as follows:
- $5-million for 501, express buses and crowding adjustments is removed.
- The allowance for capacity and congestion losses is reduced from $3-million to $1-million.
- The Transit City Bus Plan is moved up to September 2010 at a cost of $3-million, up from $1-million.
- Other service changes to deal with lower ridership save $2-million.
It is unclear what the removal of funding for the 501, express buses and crowding means for on-the-street operations. Does this mean that extra supervision and non-standard crewing arrangements for the 501 will be discontinued, that the Humber Bay express bus will be cancelled, and that all of the crowding-related increases will be rolled back?
Also, somehow, the lost capacity for low-floor buses and the extra service needed to combat congestion have been cut by two thirds. How? Why?
Of the 20 additional Route Supervisors, three are destined for the subway. One will be assigned to the station collectors, while the other two will work with the EMS (paramedic) teams already based in the subway to improve response to and reduce delays from medical emergencies.
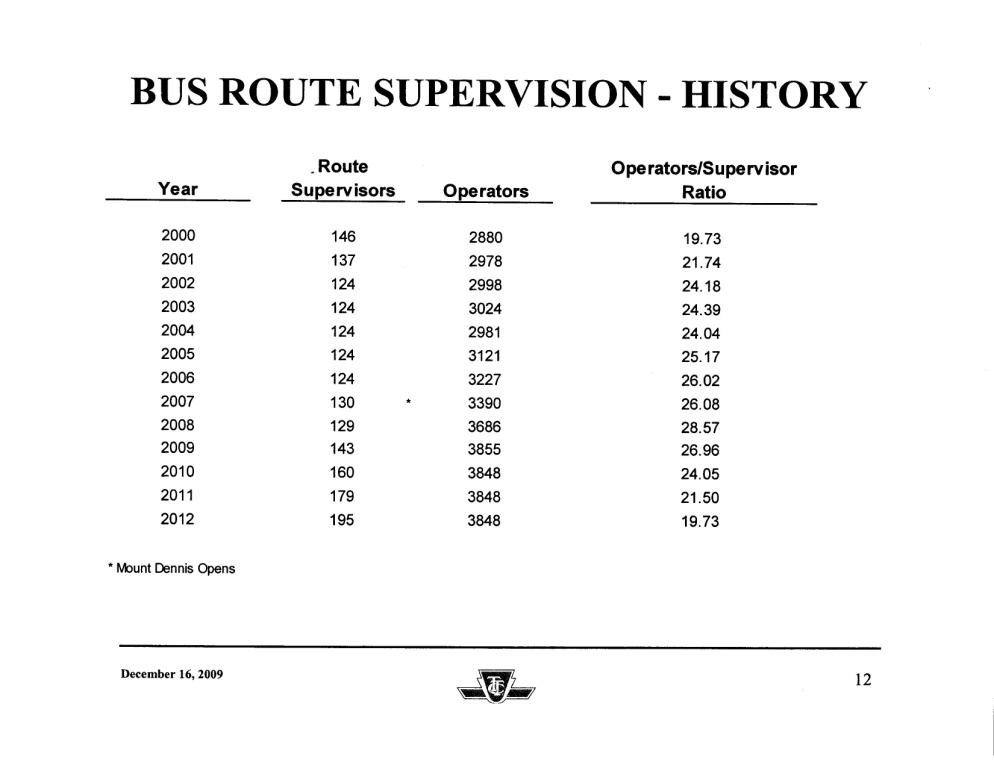
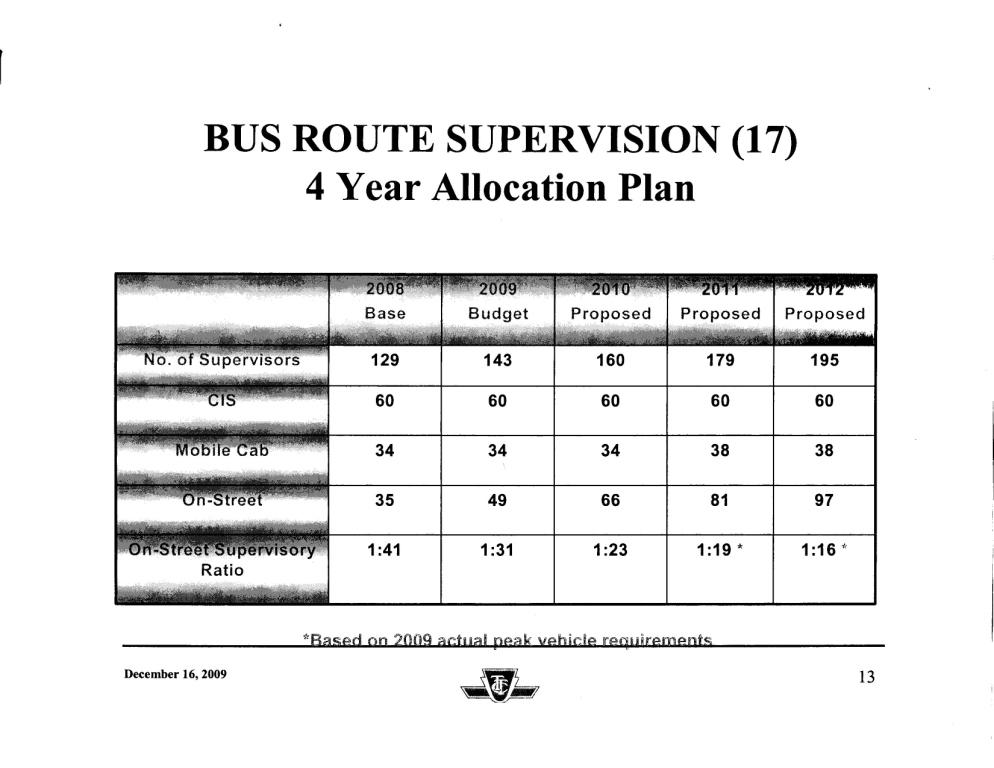
The remaining 17 supervisors will be assigned to bus routes. For the past decade, the ratio of supervisors to operators has grown from 19.73 to 26.96. As a result, some routes are completely unsupervised except, possibly, by central supervisors via CIS (the TTC’s communication and monitoring system for surface vehicles). The TTC plans to add about 20 supervisors per year until 2012 to restore the ratio to its 2000 level.
Moreover, the new supervisors will be almost all on-street. In 2008, only 35 of 129 supervisors work on street, and an additional 34 in mobile cabs, and these must cover a 7×24 operation. Almost half of the supervisors are in central CIS control rooms. The new supervisors will all go to on-street roles, and by 2012, 97 of 195 supervisors will work on street. The intention is to handle a variety of on-street problems that cannot be dealt with from a central console including:
- Fitness for duty
- Collissions and on-board injuries
- Employee injuries and assaults
- Service regularity
- Customer issues
- Operator irregularities (speeding, idling, cell phone use, reading, smoking,dress)
- Vehicle change-offs (in-service replacements)
A pilot project to increase supervision on Dufferin and Bathurst yielded some interesting numbers:
- Complaints down 20%
- Collisions down 20%
- Assaults down 80%
- Short turns down 9%
It is unclear how some of these results are related to the presence of one or more Route Supervisors, and the TTC should undertake detailed studies to ensure that this benefit can (a) be maintained and (b) be achieved on other routes.
Bus Route Supervision 4-Year Plan
Diesel Fuel
Fuel costs will rise in 2010 by $6-million. Half of this comes from a price increase from $0.98 to $1.01 per litre, and half from additional costs from additives and greater fuel consumption. The cost increase for fuel in the budget summary is higher ($7-million) because it includes new services such as the Transit City Bus Plan.
There will be fuel saving of 10-15% due to the hybrids relative to what an entirely non-hybrid fleet would have consumed. This is worth $4-million.
A further saving of $1.5-million comes from the full-year benefit of dropping bio-diesel in 2009.
TTC fuel prices are not yet locked in for 2010, and staff monitor the futures market to buy at advantageous rates.
Vehicle Maintenance
Bus maintenance is affected by the complexity of new vehicles, and the TTC has been buying a lot of those recently. Moreover, as these buses come off warranty, the cost of fixing problems cannot be claimed against the manufacturer (effectively a cost borne in the Capital Budget where buses are purchased).
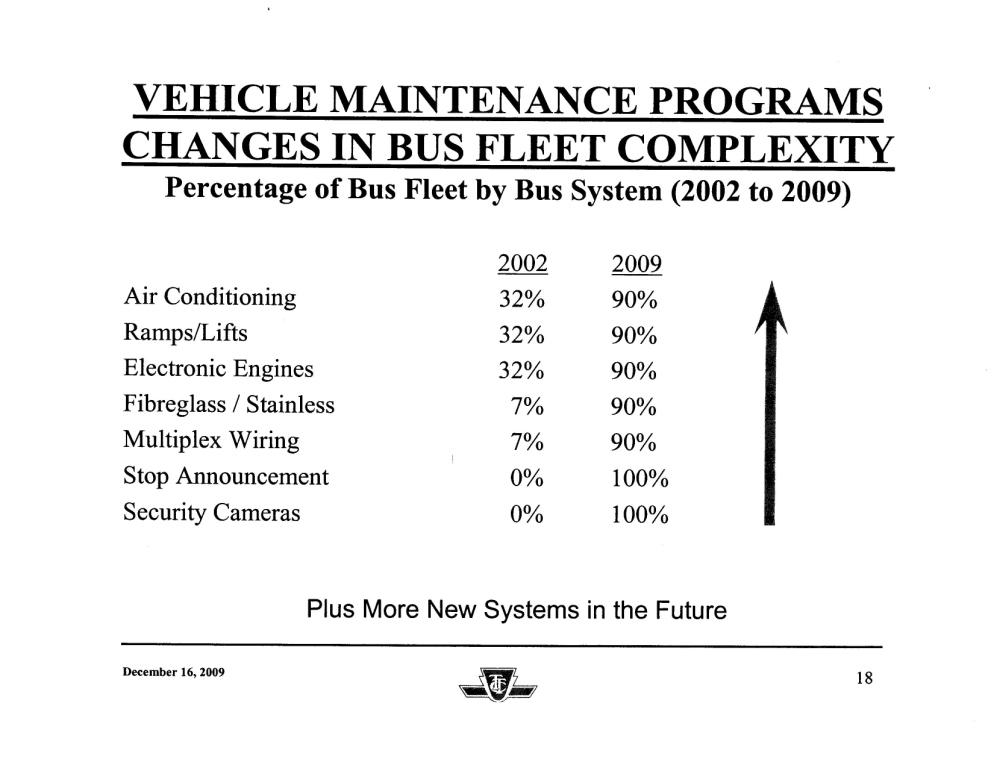
Almost all buses (soon to be the entire fleet) now have many subsystems that did not exist a decade ago. The TTC cites figures for the number of repairs needed and the increase in time spent on repairs. Unfortunately, they don’t give base data, and it is therefore difficult to know how serious the problem is relative to the change in fleet composition.
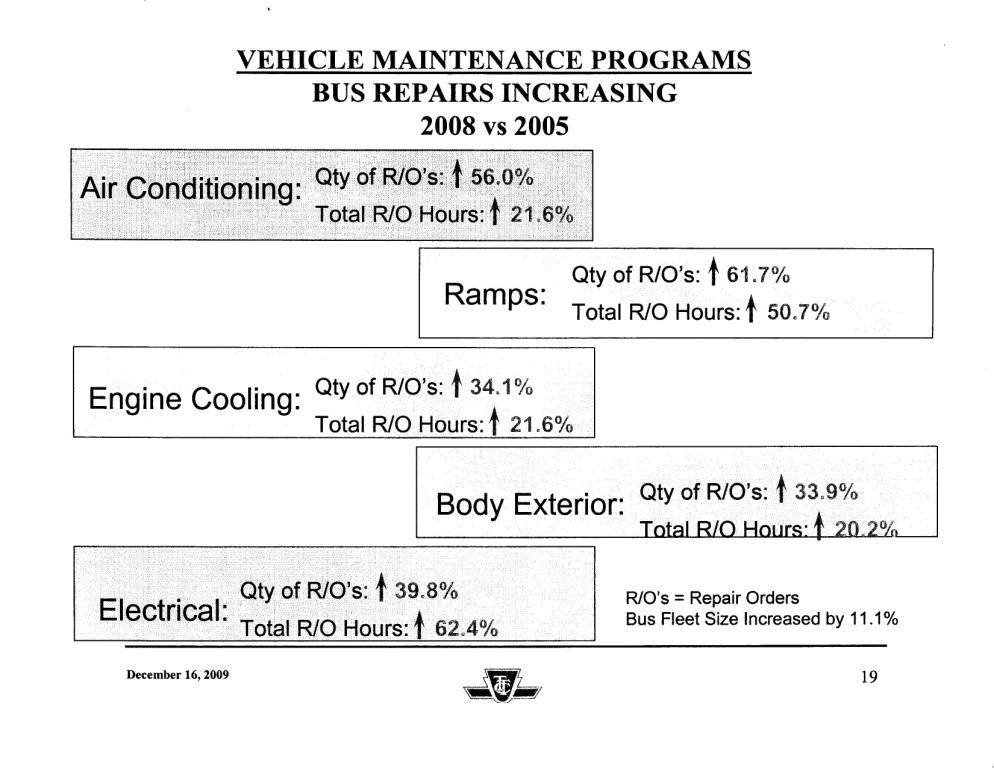
For example, from 2005 to 2008, the number of repair orders for air conditioning went up by 56%, but the hours spent on repairs only went up 21.6%. This implies that the AC units are becoming more reliable and/or that TTC staff are getting better at fixing them. Generally speaking, the number of hours for each subsystem has gone up less, proportionately, than the number of repairs. The exception is for the electrical subsystems where orders went up by almost 40%, but hours went up by 62%. This implies a greater complexity in the systems to be repaired or that staff are still on the learning curve for some of the newest systems.
What is unclear in the budget is whether and at what level the growth in repair costs can be expected to level off (assuming a fairly standard fleet makeup and mature subsystems). For 2010, 12 new repair positions will be added (on a base of 486) primarily to deal with the camera and announcement systems.
Changes in Bus Fleet Complexity 2002-2009
Changes in Repair Order Volume and Complexity 2005-2008
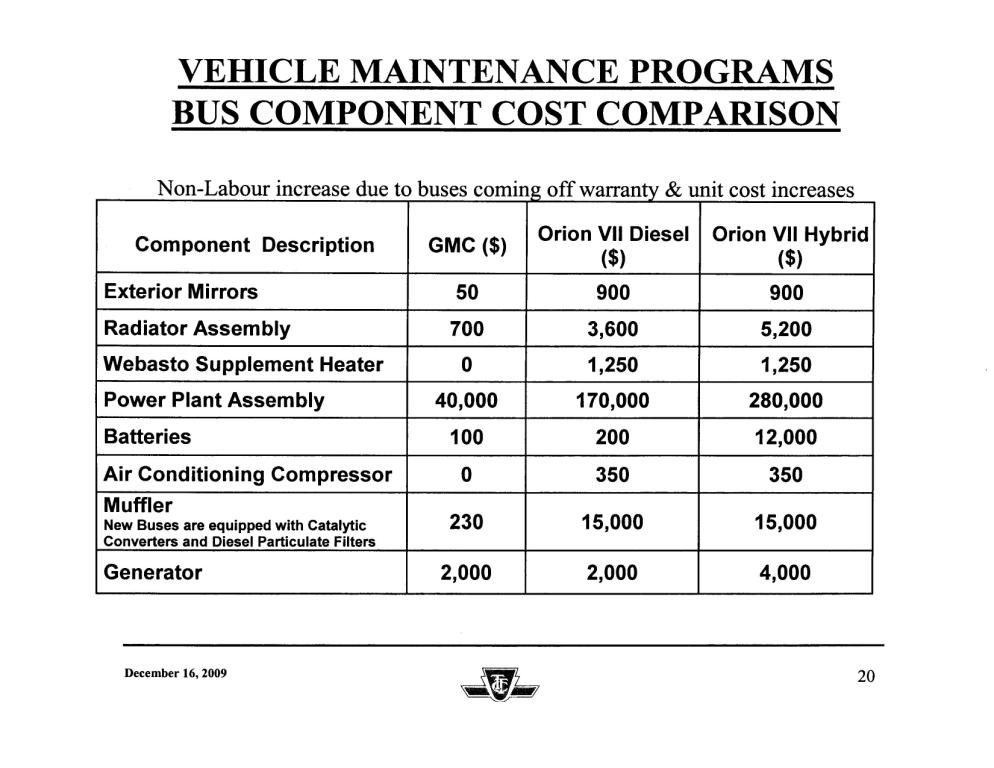
Changes in Bus Component Costs GMC vs Orion
On the streetcar system, the reactivation of the 512 St. Clair route raises the requirement for service by 27 cars over the actual level in 2009. The CLRV fleet is aging, many components are failing and obsolete. Eight new permanent positions will be created (on a base of 462), and this will be partly offset by dropping four temporary staff at the two carhouses.
The budget is unclear on whether these two maintenance groups represent all of the staff who look after buses and streetcars respectively. If so, the higher ratio of staff to vehicles for streetcars is very troubling especially given that streetcars are concentrated in a few locations. Why is this ratio so high? For future planning, will this ratio change as newer cars come into service? What maintenance savings can we expect as more reliable cars make up more and more of the fleet?
The increase in vehicle maintenance for the two modes adds $5-million in 2010.
The budget contains a table of comparative parts costs showing that replacement parts for modern Orion buses are much, much higher than for the old GMC buses. For example, a catalytic muffler costs $15k for a new bus, but the non-catalytic version on a GMC costs only $230. Many components and subsystems for the new buses are much more costly than for old ones, and these costs are even higher for the hybrids.
What is missing in the budget is any sense of how often one of these components fails and must be replaced. If there is a combination of higher failure rates and higher prices, the compound effect on bus operating costs will be substantial.
Facility Maintenance
$4-million has been added to the budget for plant, equipment and structures maintenance. Of this, half is due to directives from the authority regulating elevators, escalators and HVAC (the TSSA), and the rest is for a variety of costs including streetcar stop rail replacements. Some of the newer track is now old enough that well-worn stops need to be replaced. This process will be interesting to watch as we will see how successful the new track structure design is in simplifying spot maintenance.
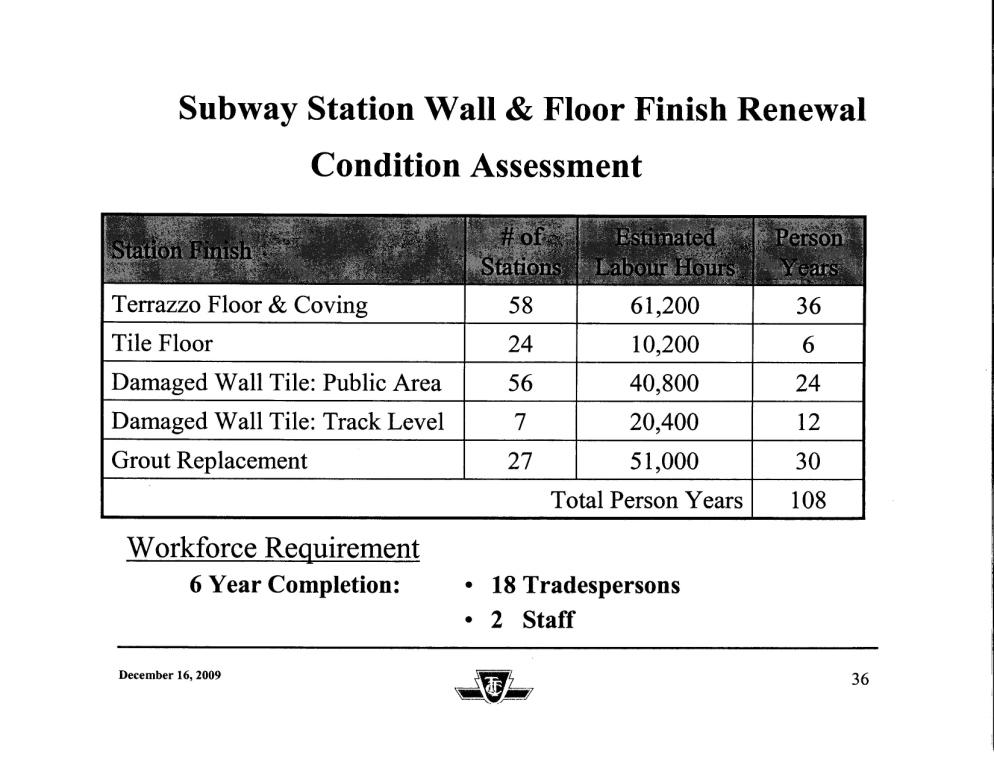
$3-million has been added to fund improvements in subway station cleanliness. 31 new positions will address escalator and station cleanliness, and 8 will look after finishes. The TTC plans to add 31 and 24 more positions in each of 2011 and 2012 to build up the station maintenance staffing so that the overall cleanliness level will be much improved.
Initially, the new staff will address the large backlog of repair work, but the TTC expects to maintain this manpower level to ensure that stations remain in a good condition.
Subway Station Condition Assessment
Accident Claims
The 2010 budget is reduced by $6-million compared to 2009 due to the change in accounting treatment of current and future costs. This non-cash expenditure will now be booked as a long term subsidy receivable from the City and will be expensed by them in years when it is actually drawn.
The TTC, and the transit industry in Ontario generally, is pursuing legislative and regulatory changes to reduce the ongoing rise in claims due to no fault provisions.
Subway Security
Positions previously funded via the TTC’s budget are now part of the Toronto Police Service budget. 35 positions were funded in this way in 2009, and a further 20 are planned for 2010.
The question of the eventual jurisdiction for Special Constables or Transit Police is still under discussion.
Depreciation
Because the TTC must fund some of its capital purchases from its own current assets, it has begun to accumulate a base of new capital assets which are depreciated against the operating budget. This increase adds $4-million in 2010.
Other Expenses
A variety of other expenses net out to a saving of $1-million over 2009. Notable among the savings is the effect of the HST ($4-million for the half year it will be in effect) and the soft natural gas market ($3-million).

All the linked charts, except the first one, are giving errors.
Steve: Ooops! I uploaded the files, but used different filenames in the links within the article. Thanks for letting me know about this. It has been fixed.
LikeLike
I Know that construction is progressing at the new East Entrance for Kipling Station but is there construction for the GO/Mississauga Transit facility at Kipling?
Steve: I have not been out there to look recently. This is a GO Transit project, but there’s nothing on their construction page about Kipling.
LikeLike
Do you know the excact list for the 2010 TTC capital projects?
Steve: The “excact” list is a pair of binders 1600 pages long. I have read through them, but can’t say I have memorized them cover-to-cover. My notes on the most significant of these show up here from time to time in connection with articles on specific projects or groups of projects.
LikeLike
Now I can see the lost time avoidance chart, I’m not convinced that there is a real effect they’re measuring there. Yes, the number is below the predicted line, but this was also true in early 2006 and late 2004. This could be random variation of the sort you get whenever events are measured. I’d want a much longer period of below predicted numbers before I’d put any weight onto their being a real effect.
LikeLike