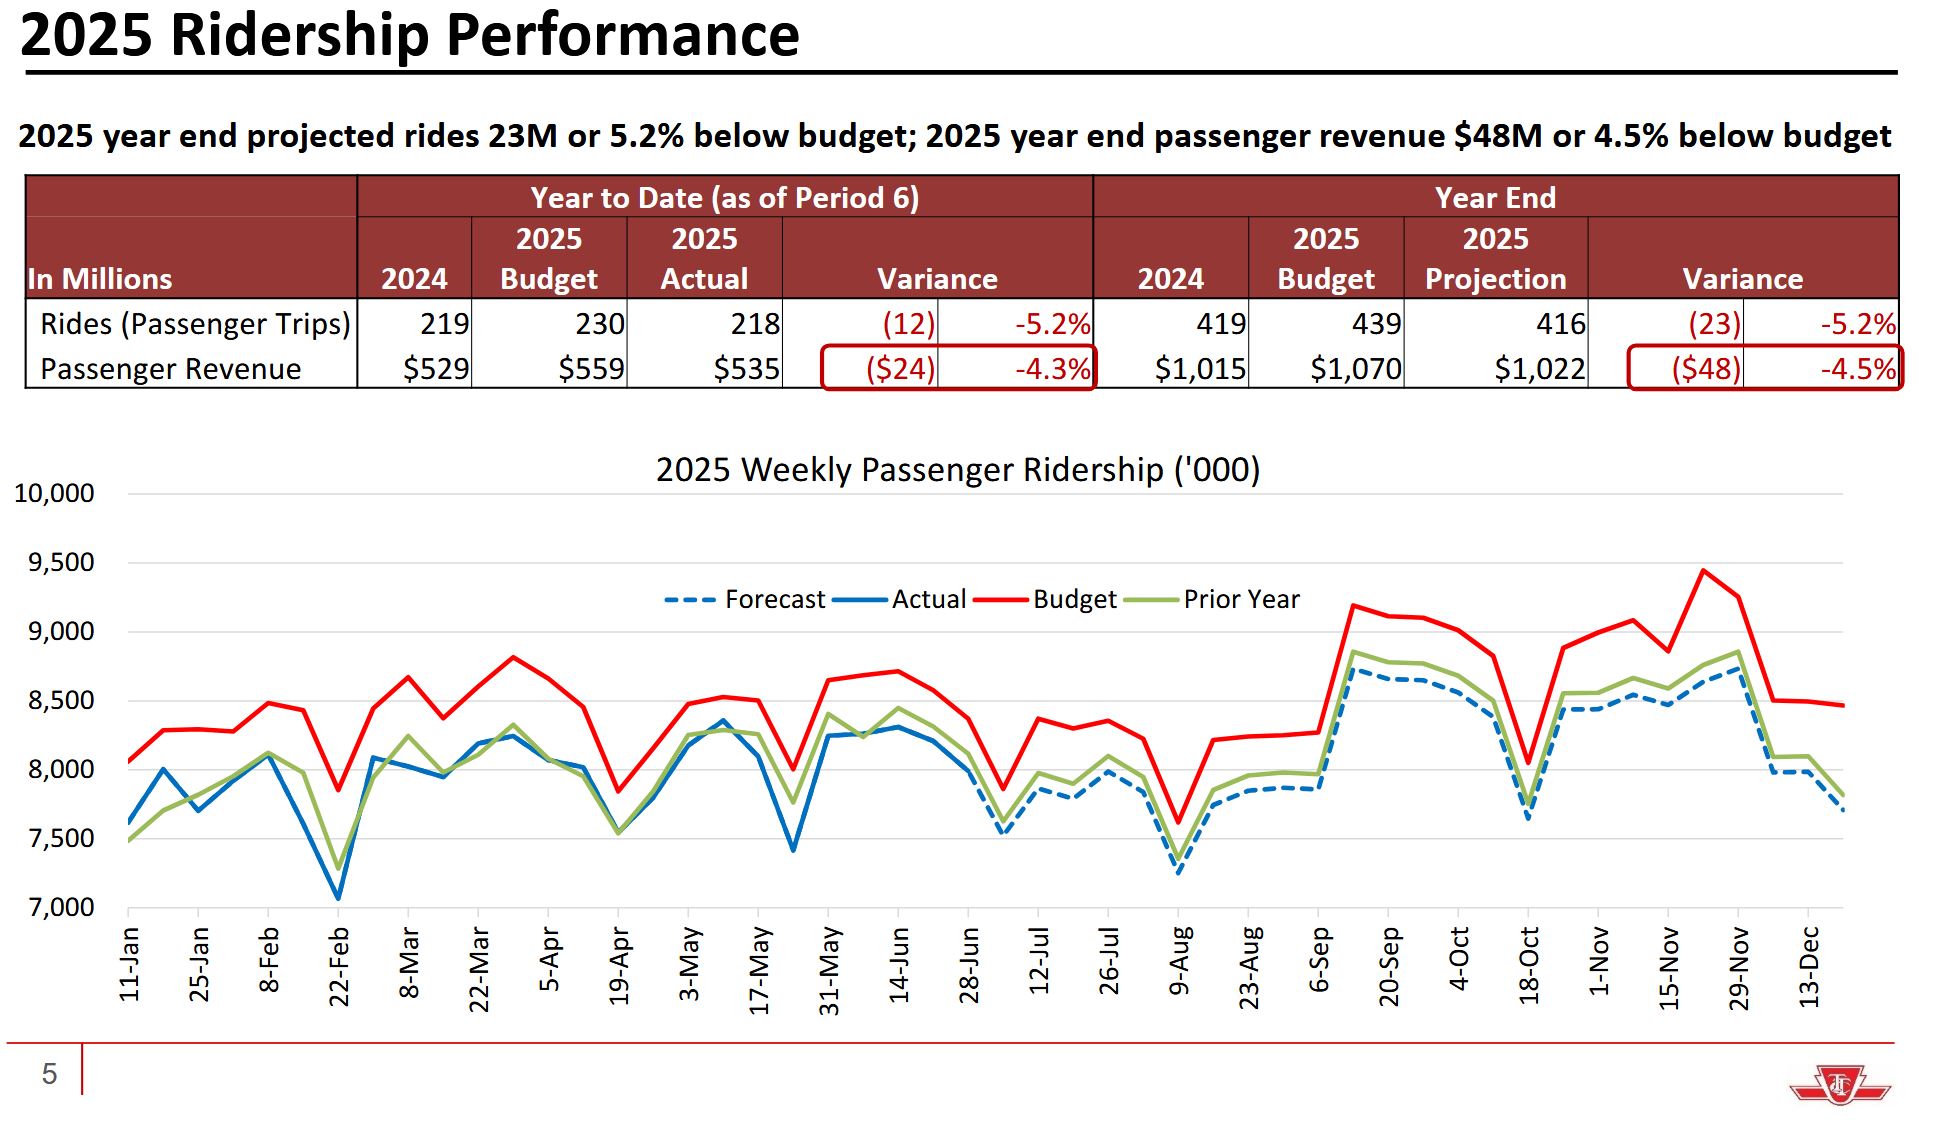
For many years, the TTC reported bus reliability as a mean distance before failure (MDBF) as shown in the charts below.
A fundamental problem with these charts is that the values for Hybrid and Clean Diesel buses are capped at 30,000km and 20,000km respectively, although the actual values could be higher. This makes the values shown for eBuses which lie in the 15,000-30,000km range look similar by comparison.
In the October 2025 CEO’s Report, on the agenda for the TTC Board Meeting of October 6, 2025, the values are not capped. Indeed, the CEO comments on the particularly good results for diesel buses.
Industry-Leading Asset Performance
When it comes to vehicle reliability, our fleet continues to outperform expectations. Across all vehicle types, our buses are achieving Mean Distance Between Failures (MDBF) well above North-American standards. Clean Diesel, in particular, is showing exceptional results, demonstrating industry-leading reliability across our entire bus portfolio. [CEO’s Report at p. 2]
The numbers cited by the CEO for September 2024 to August 2025 are:
Mean Distance Between Failures
Ebus 117 buses 24,554km (12m rolling avg) Target 24,000
Diesel 1165 buses 46,336 km(12m rolling avg) Target 12,000
Hybrid 766 buses 36,218km (12m rolling avg) Target 24,000[CEO’s Report at p. 5]
The MDBF values affect key aspects of service provision including the number of vehicles required for spares and the probability of a failure affecting service.
Not included in the stats is the mean time to repair which can have as severe an effect as MDBF. If the failures for one type of equipment are more complex putting a bus out of service for a longer period, this can compound the MDBF rate because each failure represents a longer outage. The TTC is somewhat insulated from this effect because it maintains a larger spare ratio than the industry average (see below).
I will review the new format of reported stats (only bus and subway are available so far, with streetcar to come in November) as part of my general write-up of the Board agenda.
The TTC appears to have been under-reporting the reliability of diesel and hybrid buses for many years, and this suggests that they wanted to make their eBus program appear as successful as possible. The historical stats should be restated with the caps removed so that the public can see just what the comparison over past years actually looked like.
Recently, operational issues regarding the deployment and charging for an eBus fleet have come to light, and it is clear that conversion to battery buses is not going to be as straightforward as thought when this program began.
Different fleet counts are cited in the August 31 Scheduled Service Summary and the CEO’s Report.
| CEO’s Report September 2025 | Scheduled Service Summary August 31, 2025 | |
| Diesel | 1,165 (56.9%) | 1,165 (55.3%) |
| Hybrid | 766 (37.4%) | 766 (36.3%) |
| eBus | 117 (5.7%) | 177 (8.4%) |
| Total | 2,048 | 2,108 |
| Peak Scheduled | 1,588 | 1,588 |
| Spare Ratio | 29% | 33% |
Only 1,588 of these buses are scheduled in peak service [effective August 31, 2025] giving the TTC roughly a 29% spare ratio (three buses spare for every 10 scheduled), still above industry standards if the pilot eBus fleet is excluded. If they are included, the spare count is even higher, but that could be misleading depending on how many of the pilot buses actually remain in service.
How much of this is due to budget limits on service growth, and how much is due to keeping a high number of spares to offset poor reliability?
233 eBuses remain to be delivered on current orders, and the TTC proposes a further 200 hybrid buses to continue replacement of older vehicles while eBus technology matures. The portion of the fleet now being retired is not the diesels, but the earlier hybrids acquired in 2006-2008. [Source: TTC Scheduled Service Summary effective August 31, 2025 at p. 58]
A through review of the eBus program is needed to understand its effect on future operating and capital budgets without the rose-coloured lenses applied to “green” projects. Emission reductions are a key goal for Toronto, but they should not come at the expense of higher cost and reduced reliability for the transit fleet.