The TTC’s Audit & Risk Management Committee will meet in the Boardroom at TTC Headquarters, 1900 Yonge Street, on Wednesday, March 11 at 9:30am. Two items on the agenda are of considerable interest:
The review of customer performance, metrics and real-time information covers at length the many problems with passenger information from the TTC including its website and various outlets for notices including social media and apps. This is an unusually candid review and long overdue.
Also included are charts showing the status of various recommendations from TTC and City audits, as well as from outside reviews. However, these are only summaries and there is no link back to source documents to cross-reference specific items, their severity and status.
Two confidential attachments address “The Subway Tunnel Maintenance and Rehabilitation Audit” as well as some findings from the UITP review.
Updated March 11 at 12:45pm:
Much of the meeting was conducted in camera. In the public session, a few concerns arose from the Committee:
There is a large and growing list of outstanding recommendations from both TTC Internal Audit and the City Auditor General, and the Committee was concerned about how, especially, high priority issues are tracked especially when they fall behind previously-promised due dates.
Although there was brief discussion of the issues of public facing information and performance metrics, the primary comments had the sense that finally problems are recognized, but without debate on specifics.
With respect to overtime, the Auditor will concentrate on exceptional cases where payments exceed expectations. Future reports will break down overtime by cause for clarity, e.g. planned work, weather related, special events, etc.
The TTC Board met on October 6, 2025. Many items on the agenda were confidential in whole or in part, and the meeting immediately recessed into private session. Four hours later, the public session resumed.
Extended private sessions have been a “feature” of recent Board meetings, and this is a major inconvenience for people who have taken the trouble to travel to City Hall for deputations, or remained available online. In years long past, the Board scheduled an in camera session before the public session so that, usually, the public part started on time. They should reconsider this practice, or at a minimum advertise a long, planned private session in the agenda so that public attendees can plan accordingly.
Items of interested included:
The CEO’s monthly report including an updated format for bus fleet and route performance metrics
The Peer Review of asset management by the International Association of Public Transport (UITP)
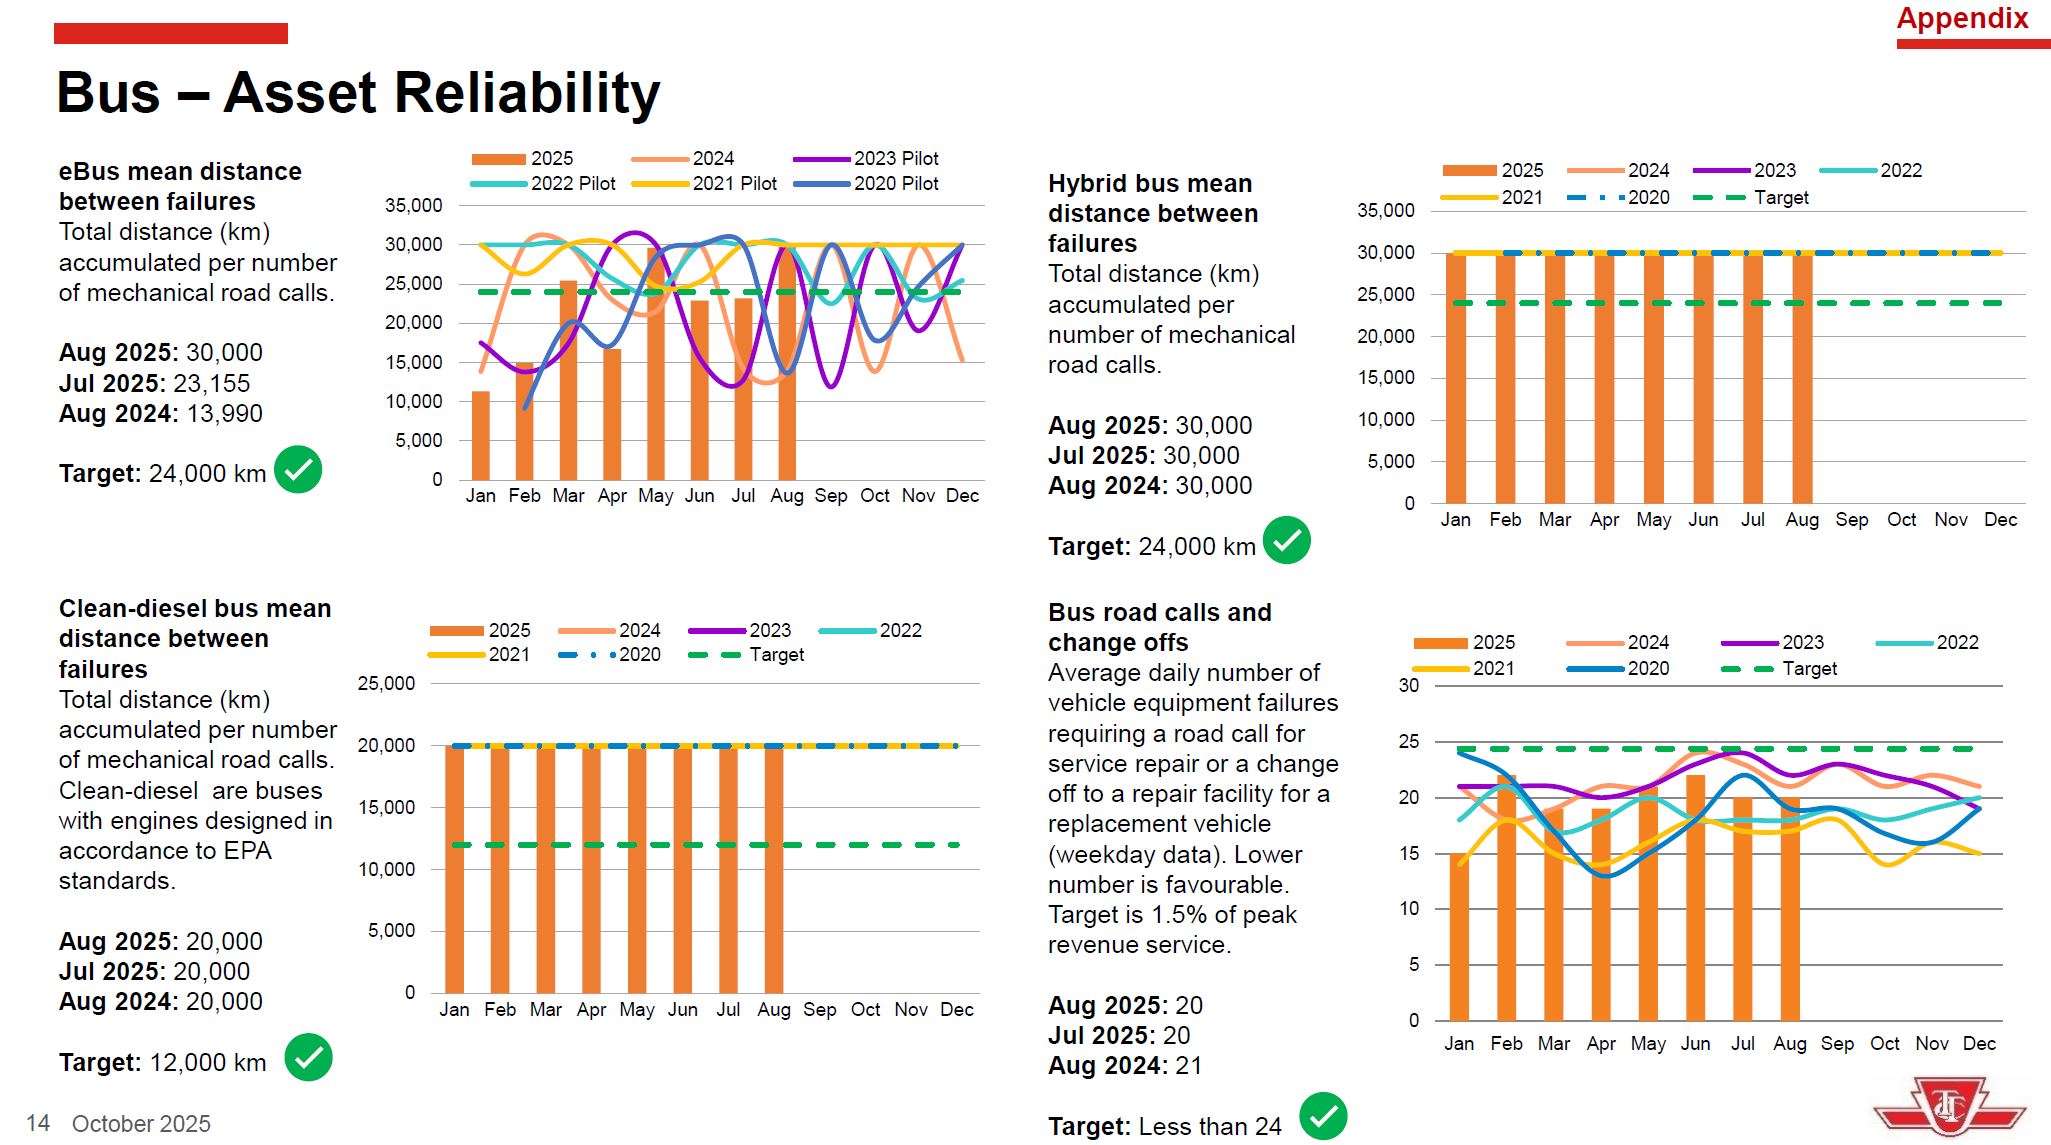
For many years, the TTC reported bus reliability as a mean distance before failure (MDBF) as shown in the charts below.
A fundamental problem with these charts is that the values for Hybrid and Clean Diesel buses are capped at 30,000km and 20,000km respectively, although the actual values could be higher. This makes the values shown for eBuses which lie in the 15,000-30,000km range look similar by comparison.
In the October 2025 CEO’s Report, on the agenda for the TTC Board Meeting of October 6, 2025, the values are not capped. Indeed, the CEO comments on the particularly good results for diesel buses.
Industry-Leading Asset Performance
When it comes to vehicle reliability, our fleet continues to outperform expectations. Across all vehicle types, our buses are achieving Mean Distance Between Failures (MDBF) well above North-American standards. Clean Diesel, in particular, is showing exceptional results, demonstrating industry-leading reliability across our entire bus portfolio. [CEO’s Report at p. 2]
The numbers cited by the CEO for September 2024 to August 2025 are:
Mean Distance Between Failures
Ebus 117 buses 24,554km (12m rolling avg) Target 24,000 Diesel 1165 buses 46,336 km(12m rolling avg) Target 12,000 Hybrid 766 buses 36,218km (12m rolling avg) Target 24,000
[CEO’s Report at p. 5]
The MDBF values affect key aspects of service provision including the number of vehicles required for spares and the probability of a failure affecting service.
Not included in the stats is the mean time to repair which can have as severe an effect as MDBF. If the failures for one type of equipment are more complex putting a bus out of service for a longer period, this can compound the MDBF rate because each failure represents a longer outage. The TTC is somewhat insulated from this effect because it maintains a larger spare ratio than the industry average (see below).
I will review the new format of reported stats (only bus and subway are available so far, with streetcar to come in November) as part of my general write-up of the Board agenda.
The TTC appears to have been under-reporting the reliability of diesel and hybrid buses for many years, and this suggests that they wanted to make their eBus program appear as successful as possible. The historical stats should be restated with the caps removed so that the public can see just what the comparison over past years actually looked like.
Recently, operational issues regarding the deployment and charging for an eBus fleet have come to light, and it is clear that conversion to battery buses is not going to be as straightforward as thought when this program began.
Different fleet counts are cited in the August 31 Scheduled Service Summary and the CEO’s Report.
CEO’s Report September 2025
Scheduled Service Summary August 31, 2025
Diesel
1,165 (56.9%)
1,165 (55.3%)
Hybrid
766 (37.4%)
766 (36.3%)
eBus
117 (5.7%)
177 (8.4%)
Total
2,048
2,108
Peak Scheduled
1,588
1,588
Spare Ratio
29%
33%
Only 1,588 of these buses are scheduled in peak service [effective August 31, 2025] giving the TTC roughly a 29% spare ratio (three buses spare for every 10 scheduled), still above industry standards if the pilot eBus fleet is excluded. If they are included, the spare count is even higher, but that could be misleading depending on how many of the pilot buses actually remain in service.
How much of this is due to budget limits on service growth, and how much is due to keeping a high number of spares to offset poor reliability?
233 eBuses remain to be delivered on current orders, and the TTC proposes a further 200 hybrid buses to continue replacement of older vehicles while eBus technology matures. The portion of the fleet now being retired is not the diesels, but the earlier hybrids acquired in 2006-2008. [Source: TTC Scheduled Service Summary effective August 31, 2025 at p. 58]
A through review of the eBus program is needed to understand its effect on future operating and capital budgets without the rose-coloured lenses applied to “green” projects. Emission reductions are a key goal for Toronto, but they should not come at the expense of higher cost and reduced reliability for the transit fleet.
Despite the extensive catalogue of issues with the Green Bus program, the TTC Board wasted no time in adopting the report without debate on an enthusiastic motion by Commissioner/Councillor Saxe. There was a sense that they could not wait to get this item off of the table.
However it is likely to come up again at the Strategic Planning Committee in discussions of future service improvements and the resulting fleet size, and the City Auditor’s review of the program will land on Saxe’s Audit & Risk Management Committee agenda sometime in 2026.
In the meantime, the TTC needs honest reporting of the performance of its growing eBus fleet as more buses arrive. In the short term, they can paper over range issues by using these vehicles on blocks of work that do not tax their capacity (buses that are only in service for part of the day, and on less stressful routes). The disparity between charging capacity and fleet size discussed in the report will also affect availability, and “performance” metrics should include not just how far a bus can travel, and how reliable it is from failure, but also whether it is even available for service.
Meanwhile, major systems elsewhere in North America continue to hedge their bets on eBuses with parallel orders of hybrids as Toronto is now doing.
This is a long report, and some key information is buried down in the appendices. It reveals, among other things, that:
Delivery of the battery-powered eBuses is running late. This is an industry-wide supply chain problem.
The TTC plans to buy 200 more hybrid buses as an interim step to allow retirement of their oldest vehicles.
The reliability of the eBuses is below the originally hoped-for “long range” capacity and they are only achieving about 250km per charge. That is with a new battery, and the value is expected to drop as batteries age.
Much of the TTC’s currently scheduled service cannot be operated with standard range eBuses, and planned change-offs will be needed to cover the span of service typical on TTC. This will add to mileage and operator hours.
Charging operations at garages are constrained by a shortage of installed charge points compounded by limitations of electrical capacity.
The problem of shorter range and limits on charging fundamentally change how garages operate for diesel/hybrid buses where refuelling is quick and is performed as part of routine servicing as buses come out of service.
The need to shuffle buses between charge points and storage locations will add to staffing requirements at garages.
eBuses cannot replace hybrids on a 1:1 basis because of the charging constraints.
There is a possibility that the TTC will have to store new buses unused because of charging limitations.
The policy decision to deploy eBuses at all garages simultaneously requires that maintenance equipment, staffing and training must be provided everywhere at once rather than a garage by garage transition, and that concurrent support for hybrids must also exist at all sites.
On route charging (using charge points at key locations to permit buses to “top up” their charge) was considered early in the project, but was rejected for various reasons including a desire to be up and running quickly to secure special eBus subsidies. It is now treated as a possible option, but with implementation five years away.
The comparative performance of hybrids and eBuses in the CEO’s monthly Metrics Report artificially understates the hybrid numbers and makes the eBuses appear to perform closer to hybrid buses than is actually the case.
The TTC does not address garage capacity issues and, indeed, speaks of shifting the need for a 10th garage off by over a decade through a “garage enhancement” project. This scheme echoes other past budget juggling to shift major infrastructure requirements and their funding needs off of the current planning calendar.
The report contains no discussion of the implications of technical limitations for the future of bus service especially in the context of any desire to drive up ridership with significant service improvements.
Overall, the report describes a project that has finally addressed the technical realities of eBuses, something that has been glossed over for years. Some aspects of eBus migration, notably charging capacity, time and garage management issues, are presented almost as new discoveries even though they are not new to the industry. Whether this is wilful ignorance or downplaying of problems on a high-profile project, the effect is the same. As with a few other major Toronto projects, the TTC is saved from some pitfalls because schedule extensions give them more time to deal with issues that should have been foreseen.
The project began in 2017 when, shamefully, the TTC Board under then Chair Josh Colle, allowed reps from BYD to pitch their wares in the guise of a “deputation”. This was “facilitated”, to use City Hall speak, by then TTC Board member Minnan-Wong with behind the scenes support from then-Mayor Tory. The video is still available on YouTube. The original hype from BYD, who hoped for a large untendered contract, is falling away, but the implications for the future of TTC bus service are only now coming out in the open.
(Those of us with long memories will recall the combined efforts of TTC management, MTO “innovative technology” staff, the gas industry and Ontario Bus Industries to replace the TTC’s trolleybus system with “clean” natural gas buses on a sole-source contract. We have been here before.)
As the 60-bus pilot project wore on, BYD was only able to supply half of the 20 buses originally allocated to them. Proterra, now out of business, got 25 and New Flyer got the other 25. At the point I write this article (July 13 at 3:00 pm, none of the BYD buses is reporting a position on the vehicle tracking system. (14 of 25 Flyers, and 8 of 25 Proterras are active.)
New Flyer is supplying eBuses to the TTC, and of the fleet numbers 6000-6203, the highest number reporting its location is 6141. Fewer than half of the delivered buses is reporting a location. Nova Bus deliveries on a 136 bus order are slower, and only 6 buses are reporting locations. (See Appendix E later in this article for information on delivery progress.)
An important issue when considering reliability stats is that a bus that never runs never fails, and so does not contribute to MDBF (Mean Distance Before Failure) stats. These buses do, however, count as part of the TTC’s active fleet and inflate its apparent size including chest-beating claims to the number of eBuses Toronto has. Having them and operating them are two different issues.
When there are only a few trial vehicles in the fleet, how well they work has little effect on service, especially through the pandemic era when service was not running at 100% of former levels. The situation is much different as recovery to full service, notably on the bus network, is in sight, and both City Council and some TTC Board members talk of an aggressive increase in transit service to wean motorists out of cars and accommodate population growth.
The TTC has already reached the point where it must keep elderly vehicles in service to compensate for performance issues with the new fleet, and this situation will compound as more eBuses arrive. There is even a question of where to store all of these buses if they cannot be actively, reliably used. The planned order for hybrids does not simply buy time while supply chain issues are worked out and battery technology improves. It is an admission that the electric fleet plan is not working out and that service at current levels is threatened. Major service expansion is simply not possible.
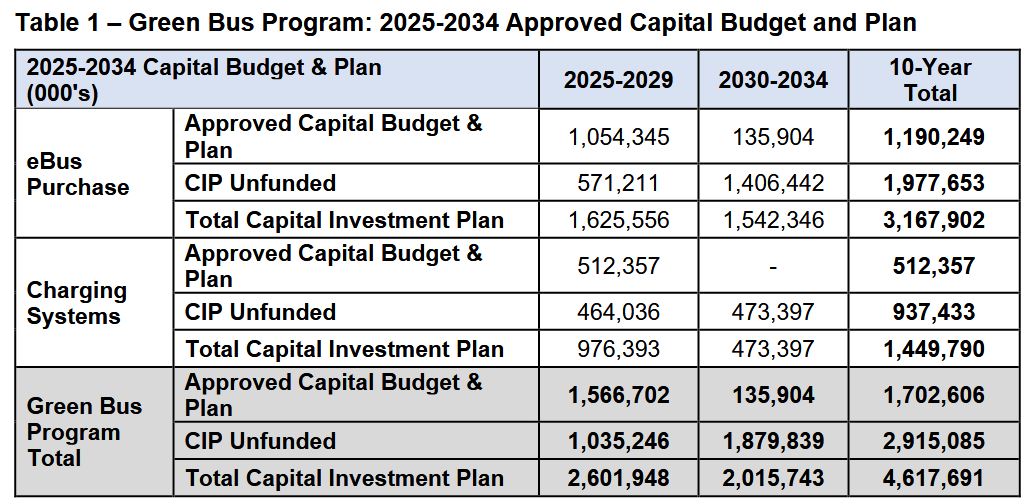
On the financial side, migration to eBuses is not cheap, and the project is funded only to about 37%. An important discussion nobody at the City or TTC seems willing to address is whether it is better to lower emissions by converting the fleet and all facilities to electric operation, or if buying and operating more buses to get riders out of their cars and improve mobility in the city should take precedence. Capital projects are seductive because they are often funded with “other people’s money”, but even the special eBus subsidies only go so far.
It is both ironic and sad that the electric streetcar system has many surplus vehicles thanks to service cuts, but also from a shortage of operators. The TTC plans to move to a six-minute service on three routes in Fall 2025, but may have to bus one line (503 Kingston Road) for want of streetcar drivers.
Peak streetcar service in July 2025 is 170 cars (on Saturday afternoons, not during the weekday peaks!), but the fleet will soon number 262 cars when the last of the new Flexitys arrives. 50 of the 60 new streetcars, 4603-4662, are actively reporting locations, and the highest of these, 4655, shows how close to complete the deliveries are.
In the rest of this article, I will explore issues with the eBus project and plans in more detail, but the last Appendix deserves to be here, “above the fold”.
A review commissioned by the TTC Board from Deloitte in 2023 flagged issues with “project management improvement in the areas of schedule, cost, scope, reporting, risks and issues, governance, and interdependencies management”. Of the 37 recommendations, 18 are closed and 19 are in progress.
An APTA (American Public Transit Association) peer review is planned to begin in September 2025, and the City’s Auditor General plans to review the eBus program.
It is quite clear reading through the report that the TTC eBus project is in trouble both because of external factors (industry conditions) and because the implications of the technology were not fully understood or appreciated. Moreover, the transition will require far more than buying some new buses and plugging them in. The TTC loves to claim that is a leader in the field, but this is likely only true in comparison with smaller systems that do not have the capacity. Within the industry, TTC is not at the front of the pack.
From time to time, a discussion arises about the makeup of the TTC’s surface fleet, how it is utilized and the effect on service levels. This article presents details broken down by vehicle type to show variations across the system.
My apologies to readers if this seems a tad nerdish, but any discussion of future service requires an understanding of the fleet’s makeup and how it is used. Any fundamental differences between vehicle types will affect future planning, but equally there are inherent differences in types of routes and schedule designs that have nothing to do with the vehicles.
The charts in this article are based on tracking data accumulated by Darwin O’Connor at TransSee for the months of November and December 2024, less a few days around Christmas when the site was offline.
First, a basic question about how many vehicles were actually active over the two-month period. The chart below shows the daily count of vehicles that were observed in service by the TTC’s tracking system and TransSee during the period.
The peak number of buses (blue) is higher than the peak service requirement shown on the Scheduled Service Summaries for these months. The difference is due both to “Run as Directed” buses which do not show up in the assigned vehicle counts, and to buses that only work for part of the day and are replaced by other vehicles for various reasons.
The situation for streetcars (red) is similar, but with a smaller difference because there are few “RAD” streetcars and most cars stay in service all day, as shown in the detailed stats later in the article. Another important difference for streetcars is that weekend service is close to weekday service in terms of the number of vehicles used.
The bus fleet is in flux as old vehicles are retired and replaced by new deliveries. If anything, this should increase availability by removing the least reliable vehicles from service. The streetcar fleet is growing with deliveries of new cars that will continue through 2025. Service levels for both modes have yet to catch up with fleet size and availability, although some improvements are planned later this year.
The remainder of this article looks at the stats for individual vehicles, grouped by type.
The July 17 Board meeting was extraordinarily long thanks to three in camera items, plus extended discussions of the CEO’s Report and of use of buses as homeless shelters during the winter.
The confidential session dealt with:
A collective bargaining update for two small groups of customer service and operations supervisor employees.
An update on advice from External Counsel. On a recorded vote, this was adopted with all Board members except Councillor Saxe in favour. As of the publication of this article (July 28), there have been no leaks about the subject of this report.
An update on the fare modernization program including the status of the Presto contract. The report was also discussed briefly in the public session later in the meeting.
The public meeting included:
The July 16 storm, flooding and hardening of infrastructure against climate change.
New subway trains and federal funding announced earlier the same day (July 17).
Prioritization of State of Good Repair projects. This item received scant attention although the report contains much interesting background on capital plans.
Safety on the TTC.
Use of shelter buses.
Transit network expansion update.
Fare Compliance Action Plan: See the updated version of my previous article on this report which includes the debate at the Board meeting.
Not discussed was the issue of hydraulic fluid leaks from subway work cars of which one quarter are still out of service. A report is supposed to be coming to the Board soon. It is not clear how much this situation is affecting the TTC’s ability to stay on top of track maintenance issues and the growing list of slow orders for track that cannot be safely operated at full speed.
In this round, the data are from January 1 to February 15, 2024. As before, the raw information has been provide by Darwin O’Connor from his TransSee website, for which much thanks.
The amount of service the TTC operates is limited mostly by budget, which in turn dictates how many operators the system can afford, but there is also the question of bus availability and reliability.
Updated May 20, 2024 at 3:10pm: Link to UITP report on in-motion trolleybus charging added at the end of the article.
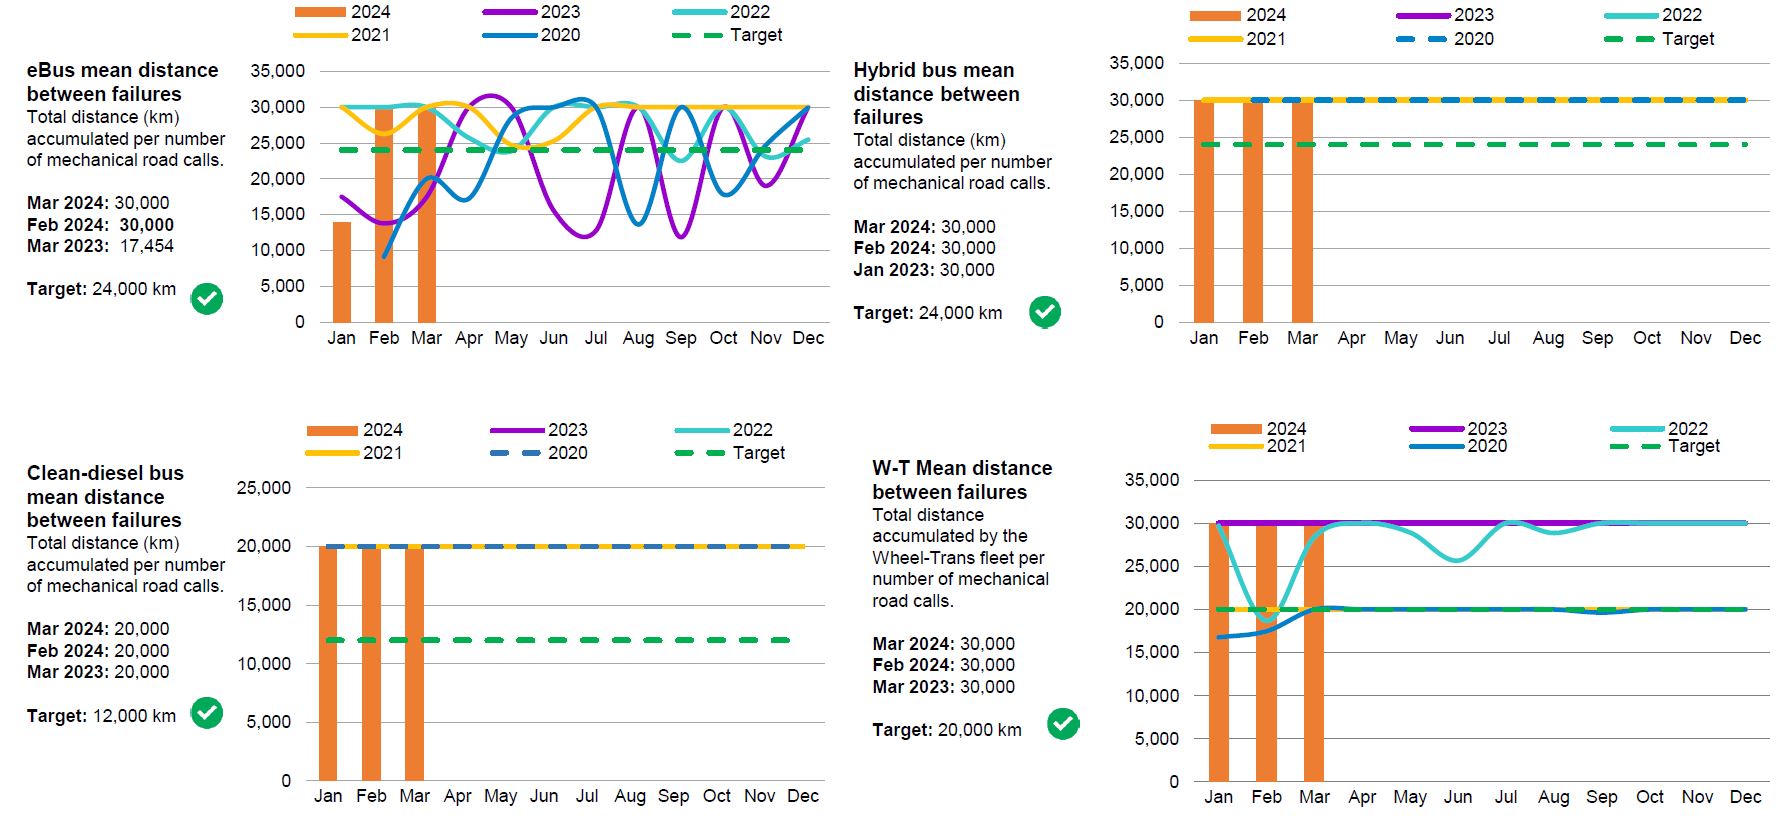
Reliability
Buses that break down interrupt service and incur greater maintenance. Buses that never leave the garage might show up on the roster, but they are not really available.
For many years, the ratio of spare buses to scheduled service on the TTC has been quite high by industry standards, and this grew during the pandemic thanks to service cuts. Restoring full pre-pandemic service, let alone expanding beyond that level, does not depend on fleet size in the short term. Moreover, many of the elderly vehicles on the system will be replaced with new diesel-hybrids now on delivery, and this should increase the number of buses actually available for service. Opening of Lines 5 and 6 Crosstown and Finch West should also release buses for use elsewhere.
The May 2024 CEO’s Report shows the current official fleet size.
The reliability of buses is reported in an odd way by the CEO. The charts below have capped the reported mean distance to failure at a target value rather than reporting actual values for several years. We know that hybrid buses achieve at least 30K kilometres between failures, and diesel buses achieve 20K, but the actual numbers could be both higher and more variable than the charts show. Meanwhile, some values for battery eBuses are capped and others wander quite a bit. Note that both the target level and y-axis maxima vary from one chart to another.
An important factor here is that buses that never, or rarely, operate in service do not contribute to failure statistics, and this can hide the true reliability of a fleet, or subgroup within the fleet. Unused buses represent capital sitting idle and service that cannot be provided. If budget cuts prevent full usage of the fleet, this is hidden, but there could be an unseen cap on what is possible if budget priorities change.
At its meeting of December 7, 2023, the TTC Board received a staff presentation on its bus electrification plan.
The City of Toronto has a goal to move to a zero-emission fleet across all departments by 2040 with interim goals of 20% in 2025 and 50% in 2030. TTC’s electrification plans fit within that timeframe.
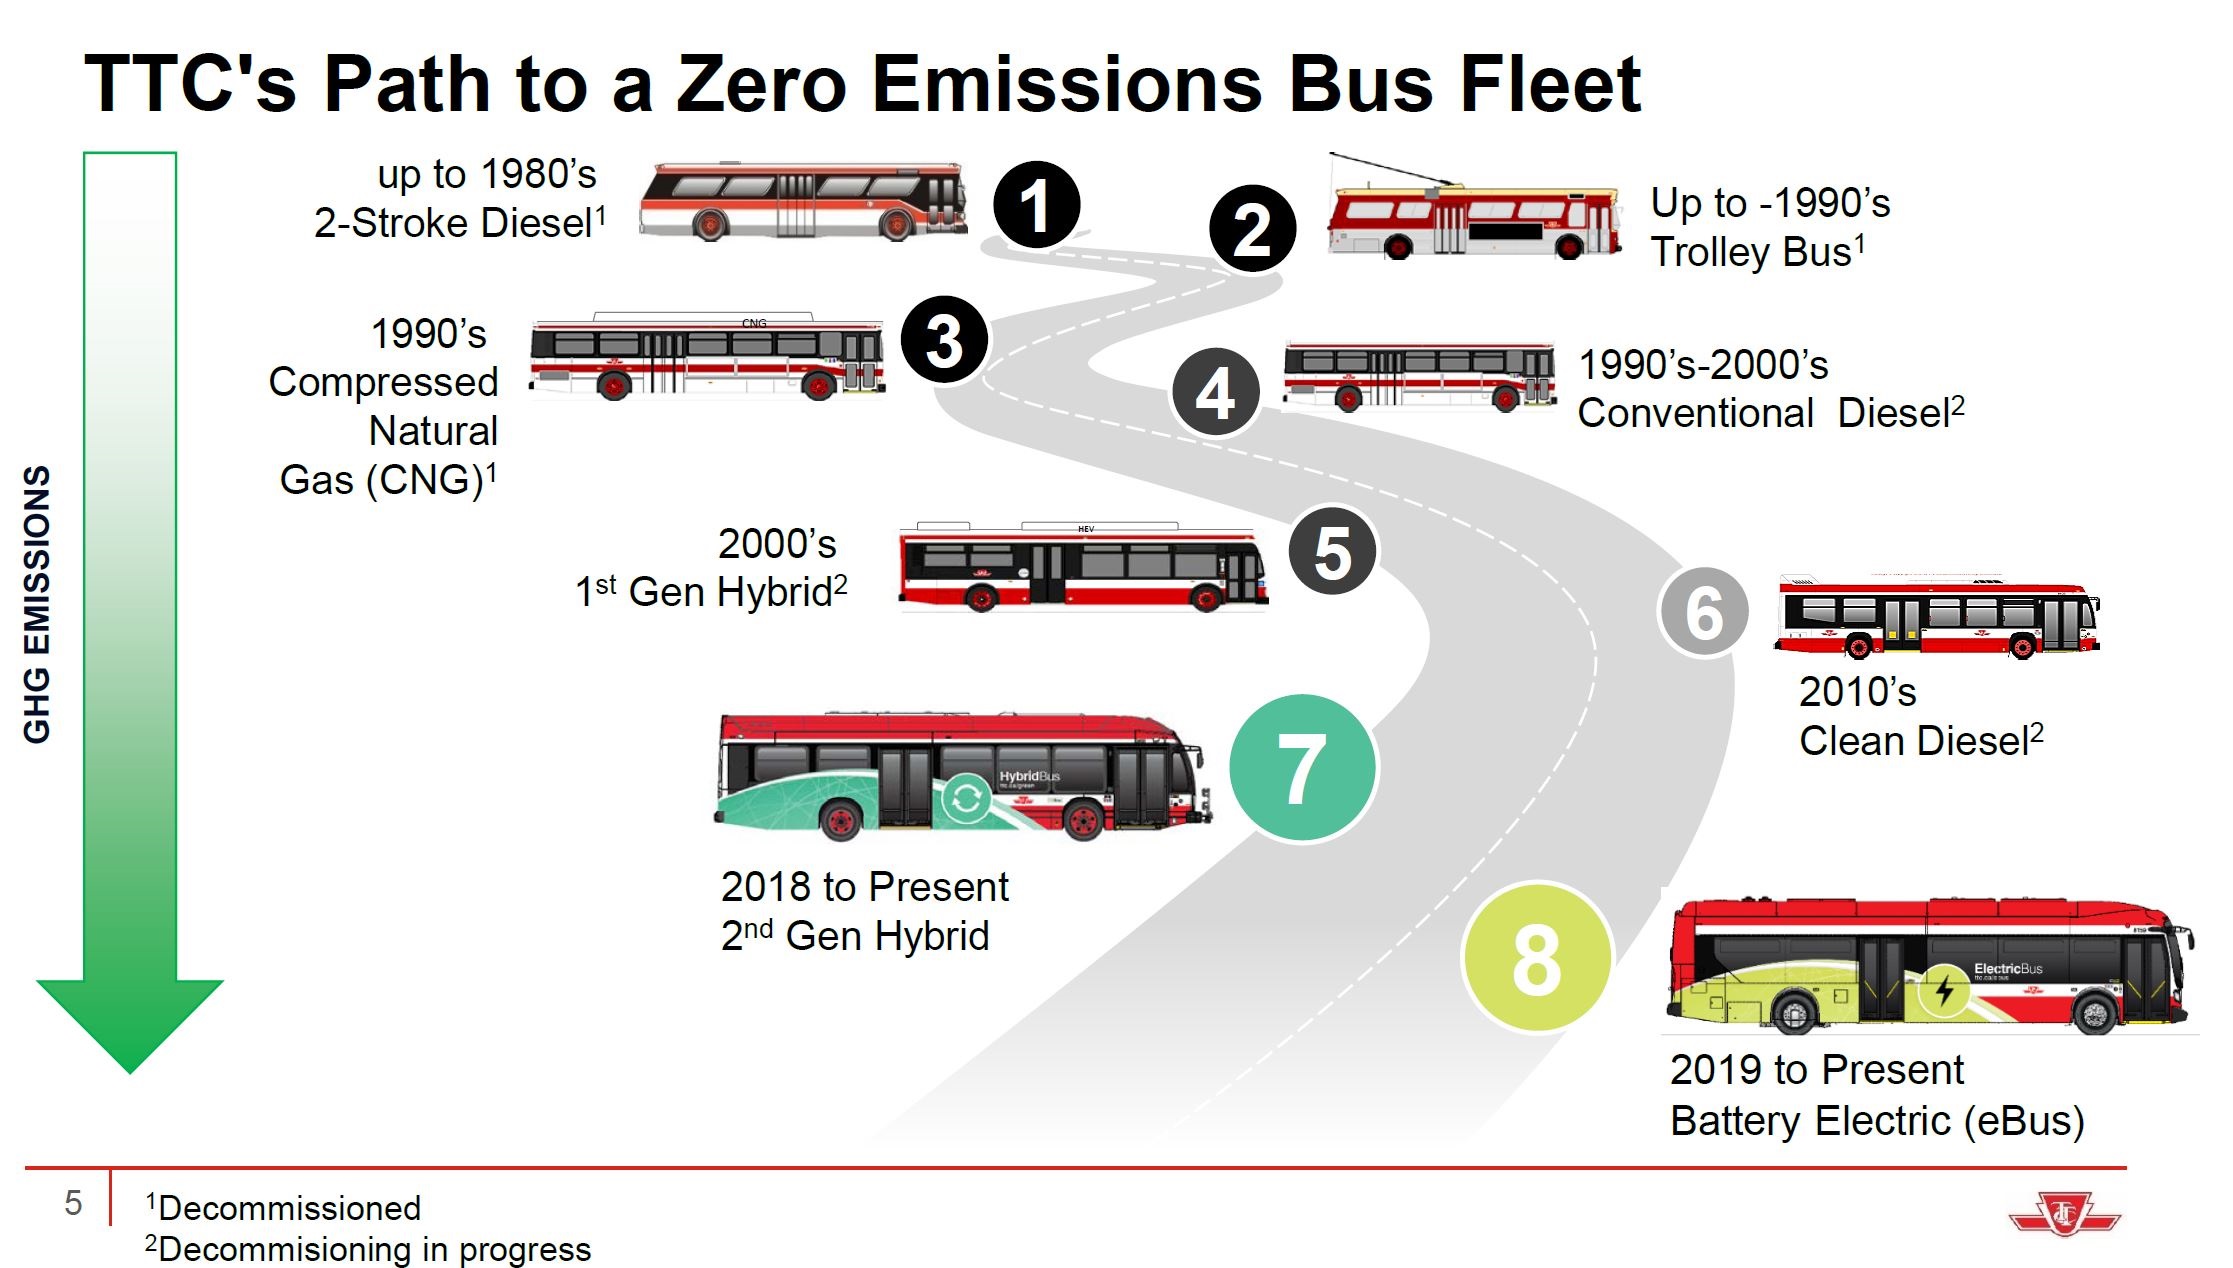
Of the TTC’s greenhouse gas (GHG) emissions, in 2019 80% of these came from the diesel bus fleet.
The history of a move to an all-electric fleet is shown in the TTC drawing below. Three decades ago, the TTC was seduced into “greening” its fleet by the replacement of electric Trolley Buses by CNG-powered buses. This was the result of an alliance between TTC management who wanted rid of the TBs, the gas industry which has a surplus of product, Ontario Bus Industries who wanted an untendered contract, and the new technology arm of the Ministry of Transportation who were desperate to show some sort of progress. (This was not the first, nor the last time provincial boffins would meddle in transit technology choices.)
The TTC Board will meet at Scarborough Council Chambers at 10:00 am on September 26, 2023. This will be the first meeting of the reconstituted Board under Mayor Chow’s administration. Among the reports on the agenda are: