At the TTC Board meeting on December 10, 2025, there was an extensive discussion on the poor showing of Line 6 Finch since it opened a few days ago.
Predictably, this was a mix of “give us time to get things working”, disappointment over the bad impression left in riders’ minds, and attempts at hard questions about what went wrong. I say attempts because there were many evasive or just plain misleading replies, coupled with a stifling blanket of Metrolinx confidentiality thrown over the debate.
Yes, thanks to the multi-party agreement between TTC, Metrolinx and others for the Finch project, many aspects of it cannot be discussed in a public session because Metrolinx enforces silence as a condition of their contract. Commissioner Josh Matlow attempted a line of questions early in the meeting, but was shut down on this by Chair Jamaal Myers as the issue would be debated later in camera.
Global News recently reported that the TTC and Metrolinx did not agree on a planned opening date for Line 5 Eglinton. Metrolinx wanted December 28 and the TTC wanted February 8 as there were “still issues to be ironed out”. In the end the TTC prevailed, but the gravity of the meeting was clear from the presence of the Mayor, Premier and Minister of Transportation. This was no ordinary staff gathering. Attempts by Commissioner Matlow to elicit any information about discussions with Metrolinx were shut down by the Chair.
All the same, two motions regarding transit priority were proposed, amended and adopted, and discussion of them revealed details on the Finch and Eglinton projects. They also revealed many errors in understanding by some board members, TTC and City officials. This does not bode well for a frank, well-informed discussion of what might be done to improve Finch and other lines.
From the moment Line 6 opened in a magisterial whoosh of grandeur, well, maybe not exactly a whoosh, the issue of its glacial operating speed has fuelled many debates in social media.
One comparison that is always made is between the “LRT” and subway speeds. Yes, the LRT has closer stops, it has to deal with traffic signals, errant motorists and pedestrians, but it gives a new meaning to “glacial”. The downtown streetcar lines are in the same ballpark, and some of them best the brand new “LRT”.
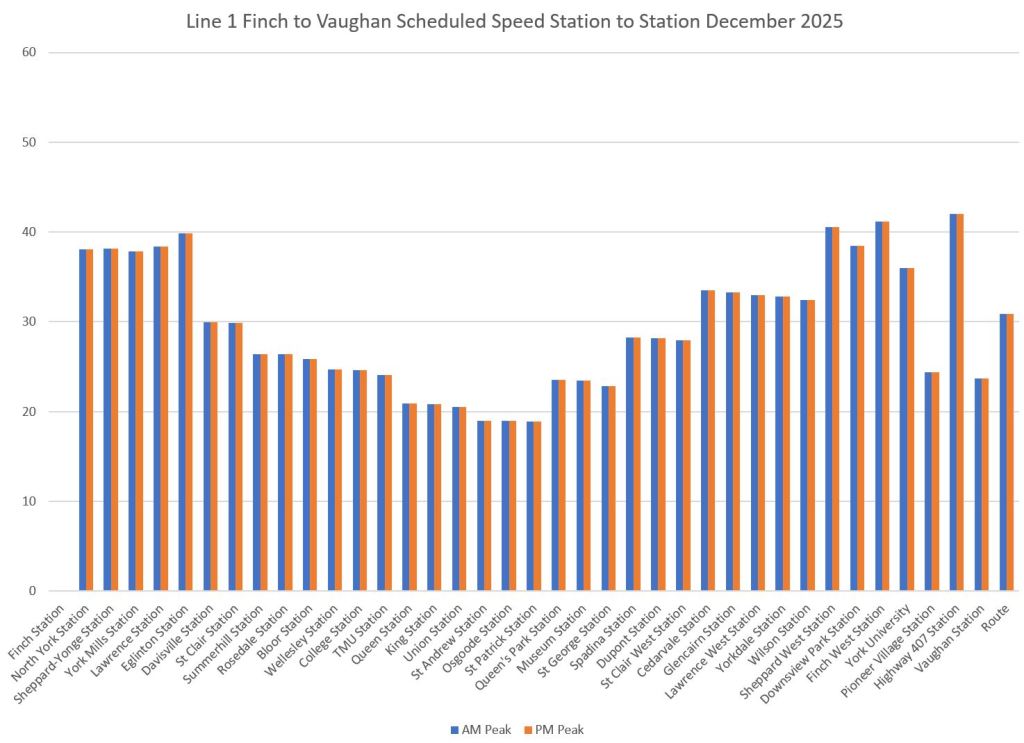
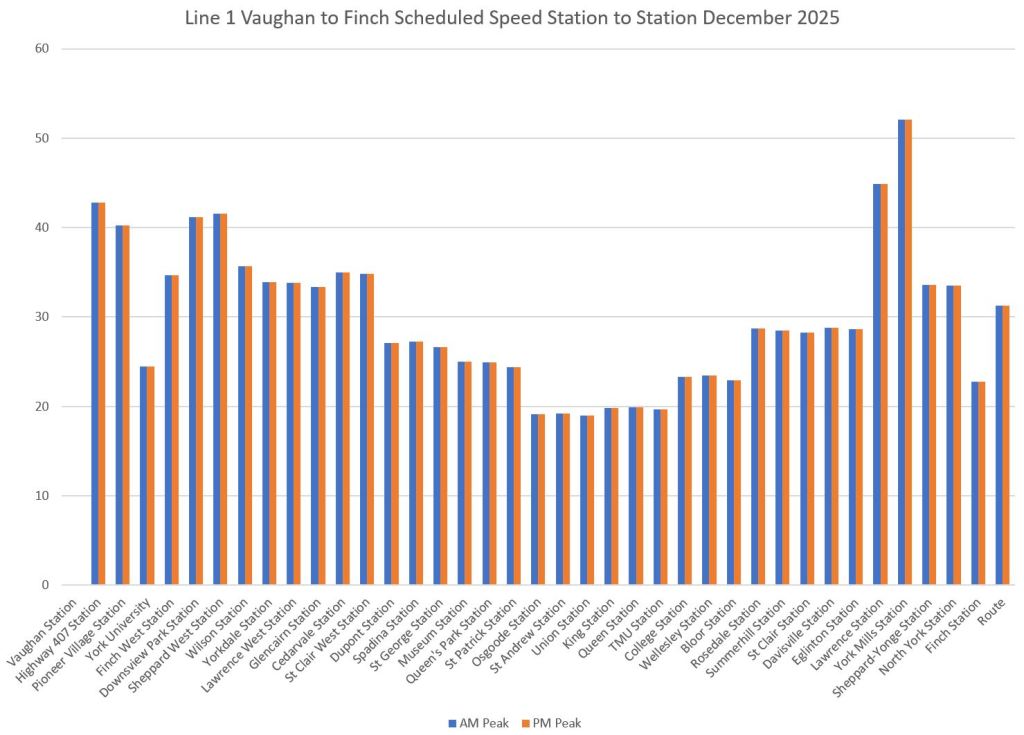
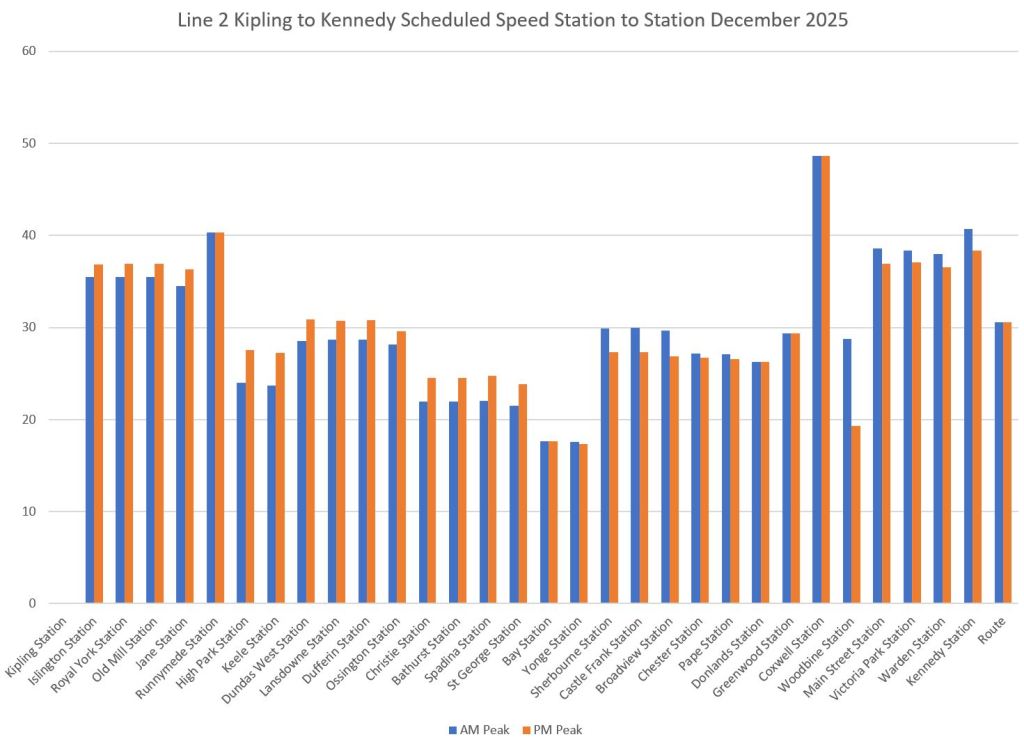
There are many factors at work which I will leave for another day. This post is intended to provide info on the scheduled travel speeds of the two major subway lines and the new 6 Finch West.
The data are taken from the GTFS version of schedules used by trip planning apps. They do not match the actual speeds, but give a sense of what the TTC expects these to be, in general, for trains running “on time”. (The GTFS data includes times and spacing for every stop from which the scheduled speed can be calculated easily.)
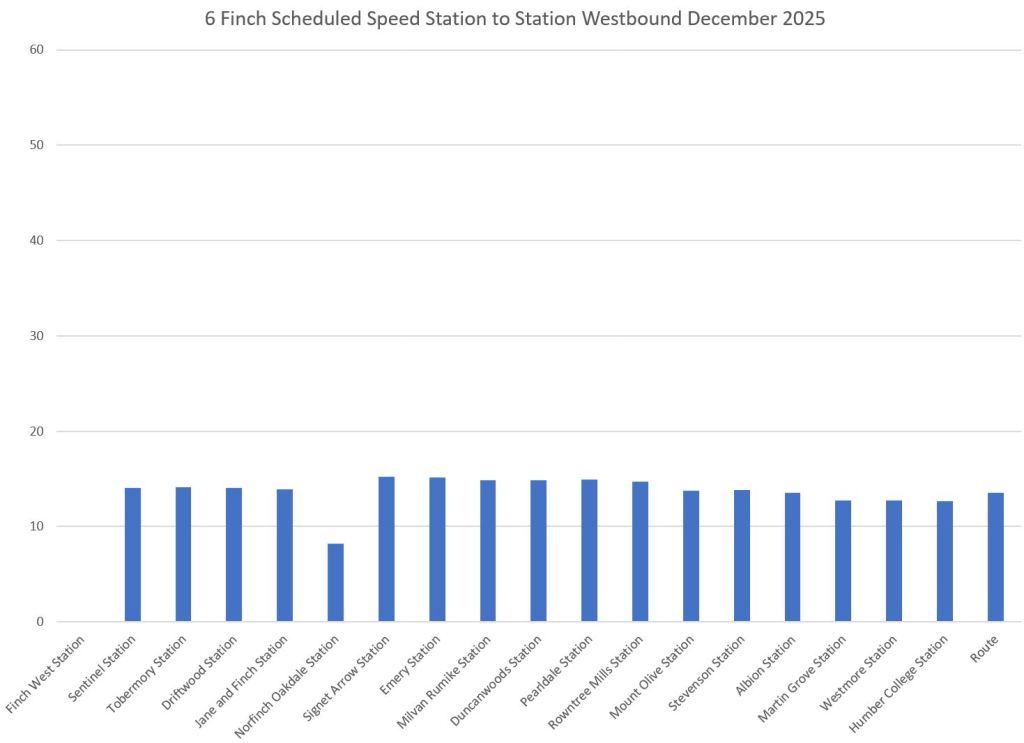
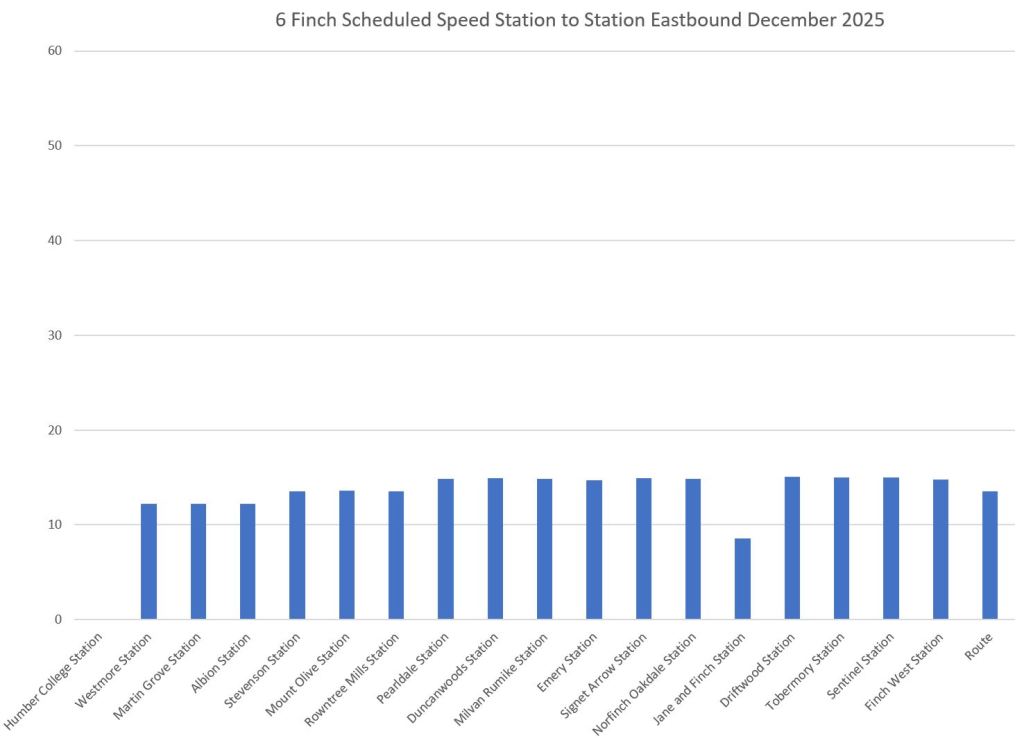
In the charts for Lines 1 and 2 (Yonge-University and Bloor-Danforth), data are shown for both the AM and PM peaks. For Line 6 Finch, only one set of data is shown because the TTC has used a generic all-day schedule for the initial service.
The vertical scale is set at 60 km/hr for all charts. The average values for each set of data are at the right end of each chart labelled “Route”.
It is self-evident that subway speeds will be higher for many reasons including stop spacing and the fact that trains both accelerate to and run at higher speeds. However, the LRT speeds are embarrassingly slow. Riding the line even on a trip that makes its scheduled time, the car crawls across the route.
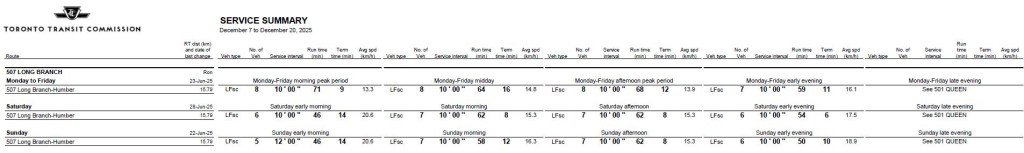
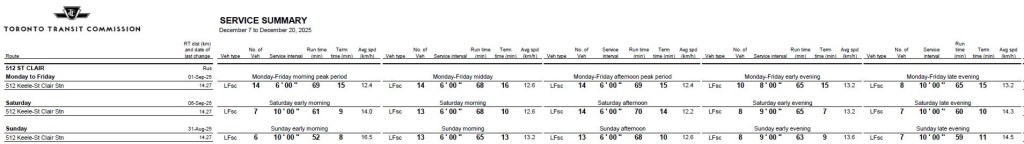
As a matter of comparison, the 512 St. Clair car is only slightly slower than 6 Finch and at times faster. The 507 Long Branch running on Lake Shore Boulevard in Etobicoke is consistently faster than 6 Finch.
With the mid-period update of schedules for opening of the 6 Finch line, TTC has published a revised Scheduled Service Summary. There are only a few changes, and they are listed here for convenience.
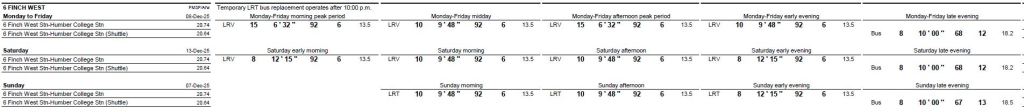
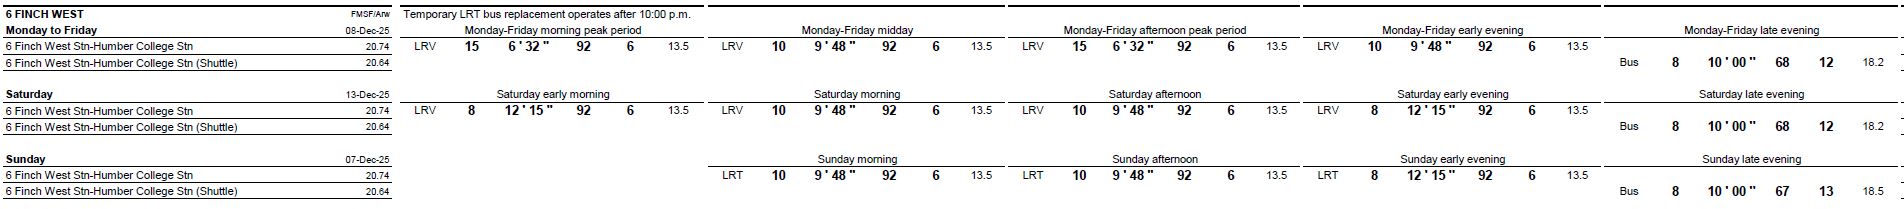
6 Finch
Here is the service summary for the new LRT line and the late evening shuttle bus. Note that the shuttle bus is interlined with the 37S Islington short turn service from Humber College to Humberwood Loop, although this is not mentioned in the summary.
Note that the scheduled speed of the bus is much higher than the LRT, and the buses get generous recovery time.
The peak requirement is 15 cars out of the 18 in the fleet.
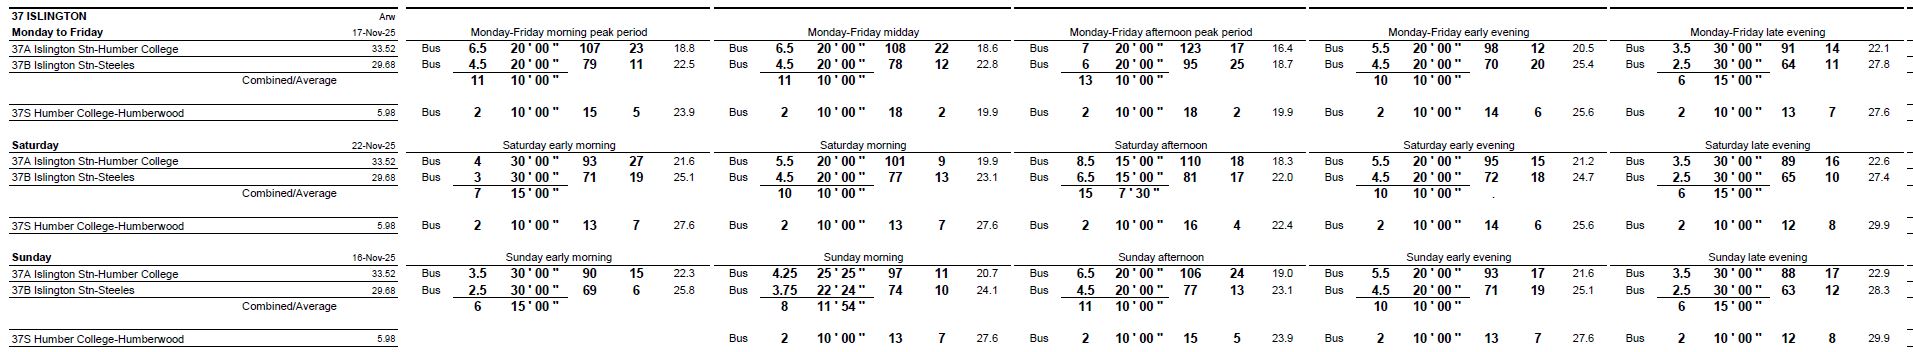
37 Islington
In the December 7 summary, a 37S Islington short turn service is shown between Humber College and Humberwood Loop, although the effective date of the schedule is supposed to be mid-November. This does not appear in the November 16 version of the summary.
During the late evening, these buses interline with the Finch West shuttle which has an internal route number of 806 even though it operates as “6”.
Mayor Chow announced that as part of her 2026 Toronto Budget, fare capping will be introduced on the TTC starting in September 2026.
The cap will be set at 47 rides per calendar month and will apply to all fare classes including adults, seniors and youth. This will bring the senior’s and youth monthly fares down to the same multiple as adults. Chow also proposes that the TTC budget for a 40 ride cap in 2027.
The caps will apply to fares paid by Presto, debit or credit card provided that the same card is used for all rides. This is enabled by changes in Presto’s “back end” system that will keep track of rides used and charge accordingly. Monthly passes will disappear, but frequent riders will get the equivalent benefit without buying a pass up front. This is important for those on tight budgets who do not know what their travel habits will be in advance.
The anticipated cost in 2026 will be $2.9-million less TTC farebox revenue, and a further $0.6-million for the City due to the reduced effective price of their “Fair Pass” for low income riders.
This is a long-overdue change to the fare structure that was first approved in principle by the TTC Board many years ago. Now finally it will be implemented because of the Mayor’s willingness to fund it, and Presto’s ability to support it for all types of payment.
No details of how this scheme will interact with regional fare deals such as 905+416 trips and GO+TTC trips have been announced.
The proposal will first go to the TTC Board’s budget meeting in January, and then through the City’s budget process to Council on February 10, 2026.
With the constant changes in route diversions for various construction projects, water and sewer repairs and overhead reconstruction, the previous Fall 2025 edition was getting cluttered and unwieldy. This version consolidates the current and planned work for late fall and early winter 2025-26.
Updated December 21, 2025 at 8:45am
Current diversions:
Until Spring 2026:
501 Queen cars divert both ways via Broadview, Dundas and Parliament.
503 Kingston Road buses divert both ways from River via Queen and Parliament.
504 King cars terminate at Distillery Loop.
504D King buses operate from Broadview Station to King & Parliament
Ongoing:
501 Queen cars divert both ways via Church, Richmond/Adelaide and York.
The TTC’s Strategic Planning Committee met on November 25 for a presentation outlining major issues in the forthcoming Operating and Capital Budgets. These will be presented at the next meeting of the full Board on December 10.
When the Strategic Planning Committee was first proposed during 2025 budget debates, the idea was that it would have some input to the 2026 cycle through discussions of policy options, financial effects and tradeoffs. However, the committee’s actual formation dragged on for months almost as if there was a “fifth column” working to prevent its ability to function.
The committee will not meet again until March 2026, and hopes to plug into the 2027 budget cycle. This will be complicated by the municipal election and the sense that any policy debate sets the stage for candidate platforms. Still to come from management is an updated Ridership Growth Strategy that necessarily will inform budget plans for 2027 and beyond. It is not yet clear how work on various TTC plans will flow through the Strategic Planning Committee with meaningful input and opportunity to fine-tune proposals.
In that context, management presented an overview of issues facing the TTC going into the 2026 budget debates.
The stage is set with an overview of recent years and the situation in late 2025.
The 2025 budget aimed high anticipating riding growth from a return-to-office commuting trend. This has not materialized uniformly across the system, and it is compounded by a decline in student travel thanks to cuts in the international student visa program and reduced offerings at post-secondary schools.
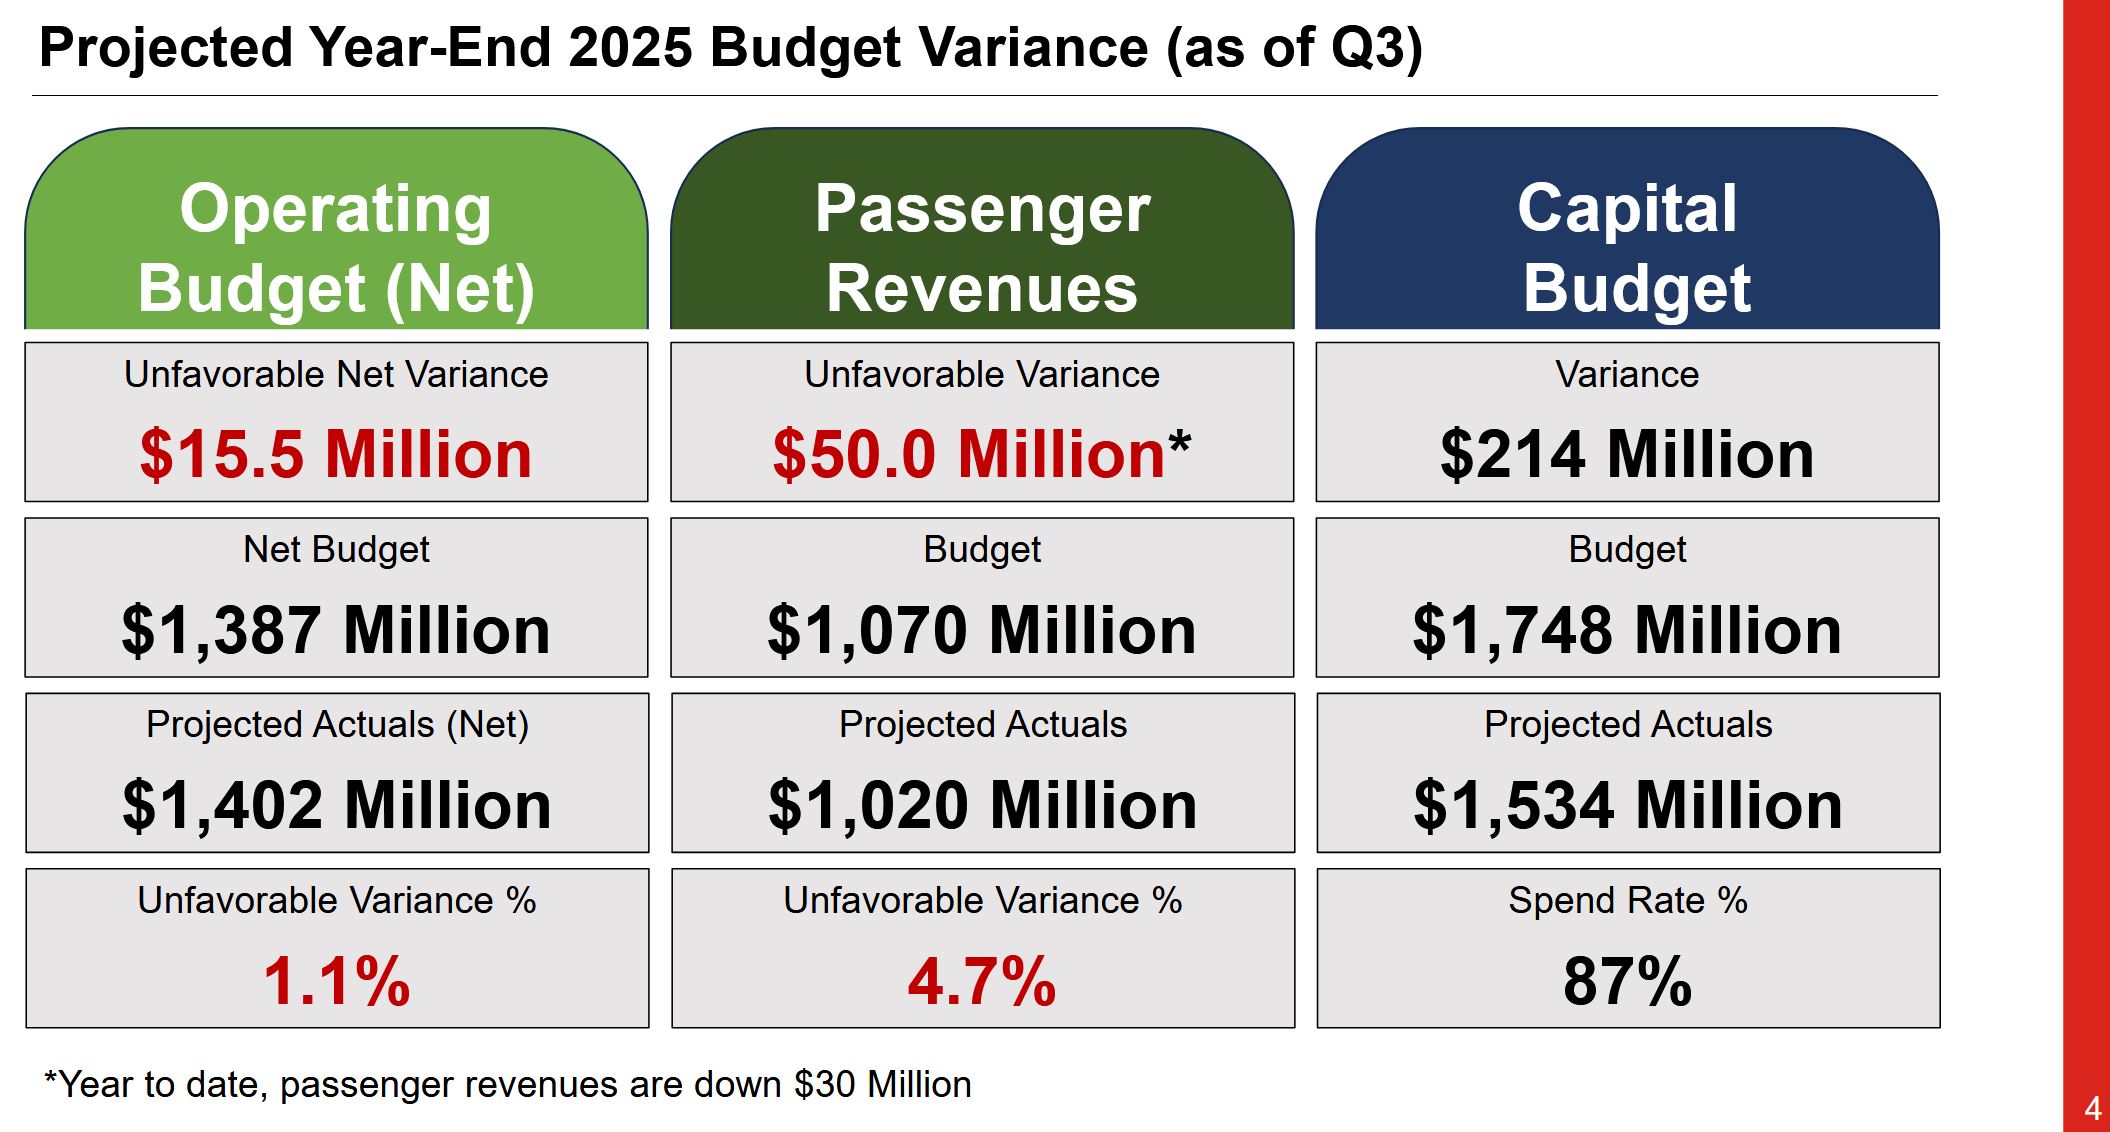
In the table below, note that the “Operating Budget (Net)” is effectively the budget as seen from the point of view of funders, primarily the City. The gross budget for 2025 is $2.9-billion.
On the Capital side, the TTC spent 87% of allocated budgets as of the third quarter end, and expects to hit 100% or more by year-end. Spend rates through the year are affected by peaking effects from project timing related to weather (construction delays) and major deliveries (new vehicle arrivals), for example.
Although the bump proposed in 2026 spending is relatively large, almost $200-million, 87% of this goes to the extra cost of operating Lines 5 and 6, assuming both are open. Only $25-million goes to current service. Some of that will simply pay the full year cost of operating improvements made in 2025 such as restoration of subway service to near-2019 levels. As we will see later, improvements, such as they might be, will come by reallocation of service between routes, not from net new spending.
For the third year in a row, fares will be frozen. This has a cost, although it is not shown as a budget line item. A 10-cent increase in adult fares, about 3% at current levels, translates to about $30-million annually less the effect of any ridership loss an increase would cause. TTC management has always warned that small annual changes in fare levels are preferable to infrequent large jumps to make up for periods of fare freezes. There is nothing inherently wrong with keeping fares low and service good, but the City must go into that policy with its eyes open as subsidies make a larger part of total revenue, and any service increases bear an increasing effect on non-fare funding.
Debates will continue about changing the fare structure including rebalancing concession rates, introducing schemes to benefit frequent riders such as fare capping. However, any change is unlikely until at least mid-2026 when the TTC rolls out a new version of Presto that will provide more flexibility in tariff design.
This is not to say discussion about fares should halt, and indeed it should already be underway informed by the capabilities and restrictions of Presto. This should be a integral part of any Ridership Growth Strategy debate including the comparative value both in the business sense and as a matter of municipal policy. Why do we provide transit service, what constitutes good, attractive service, and what spending (or avoided revenue increase) would best address the City’s goals?
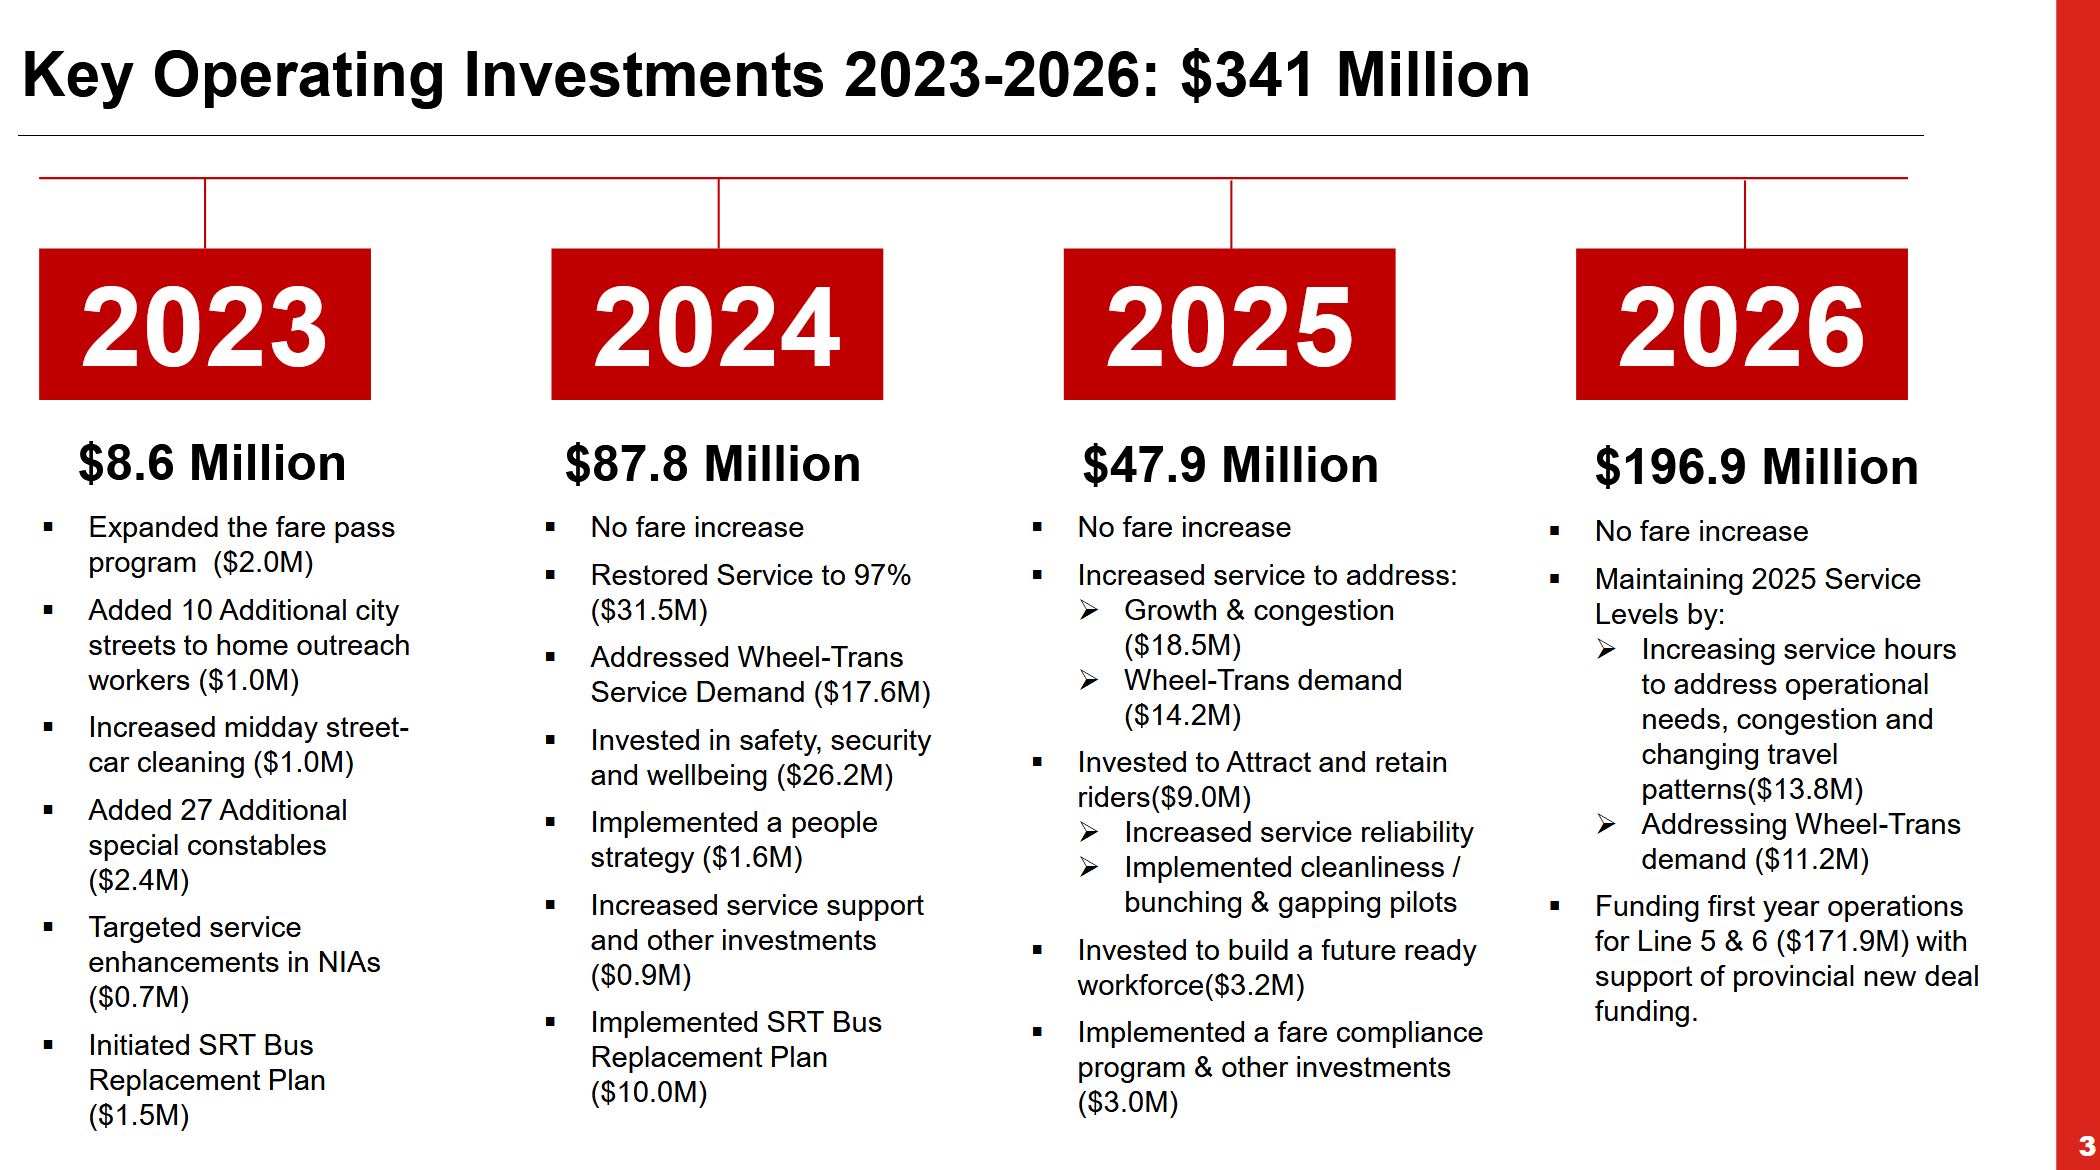
For 2026, the highlights are:
The fare freeze
A 2.2% increase in service hours
Added funding for a growing fleet of eBuses and streetcars (new vehicles delivered in 2025 will incur full-year maintenance costs in 2026)
Lines 5 and 6 operation (the net cost to be offset by a Provincial subsidy)
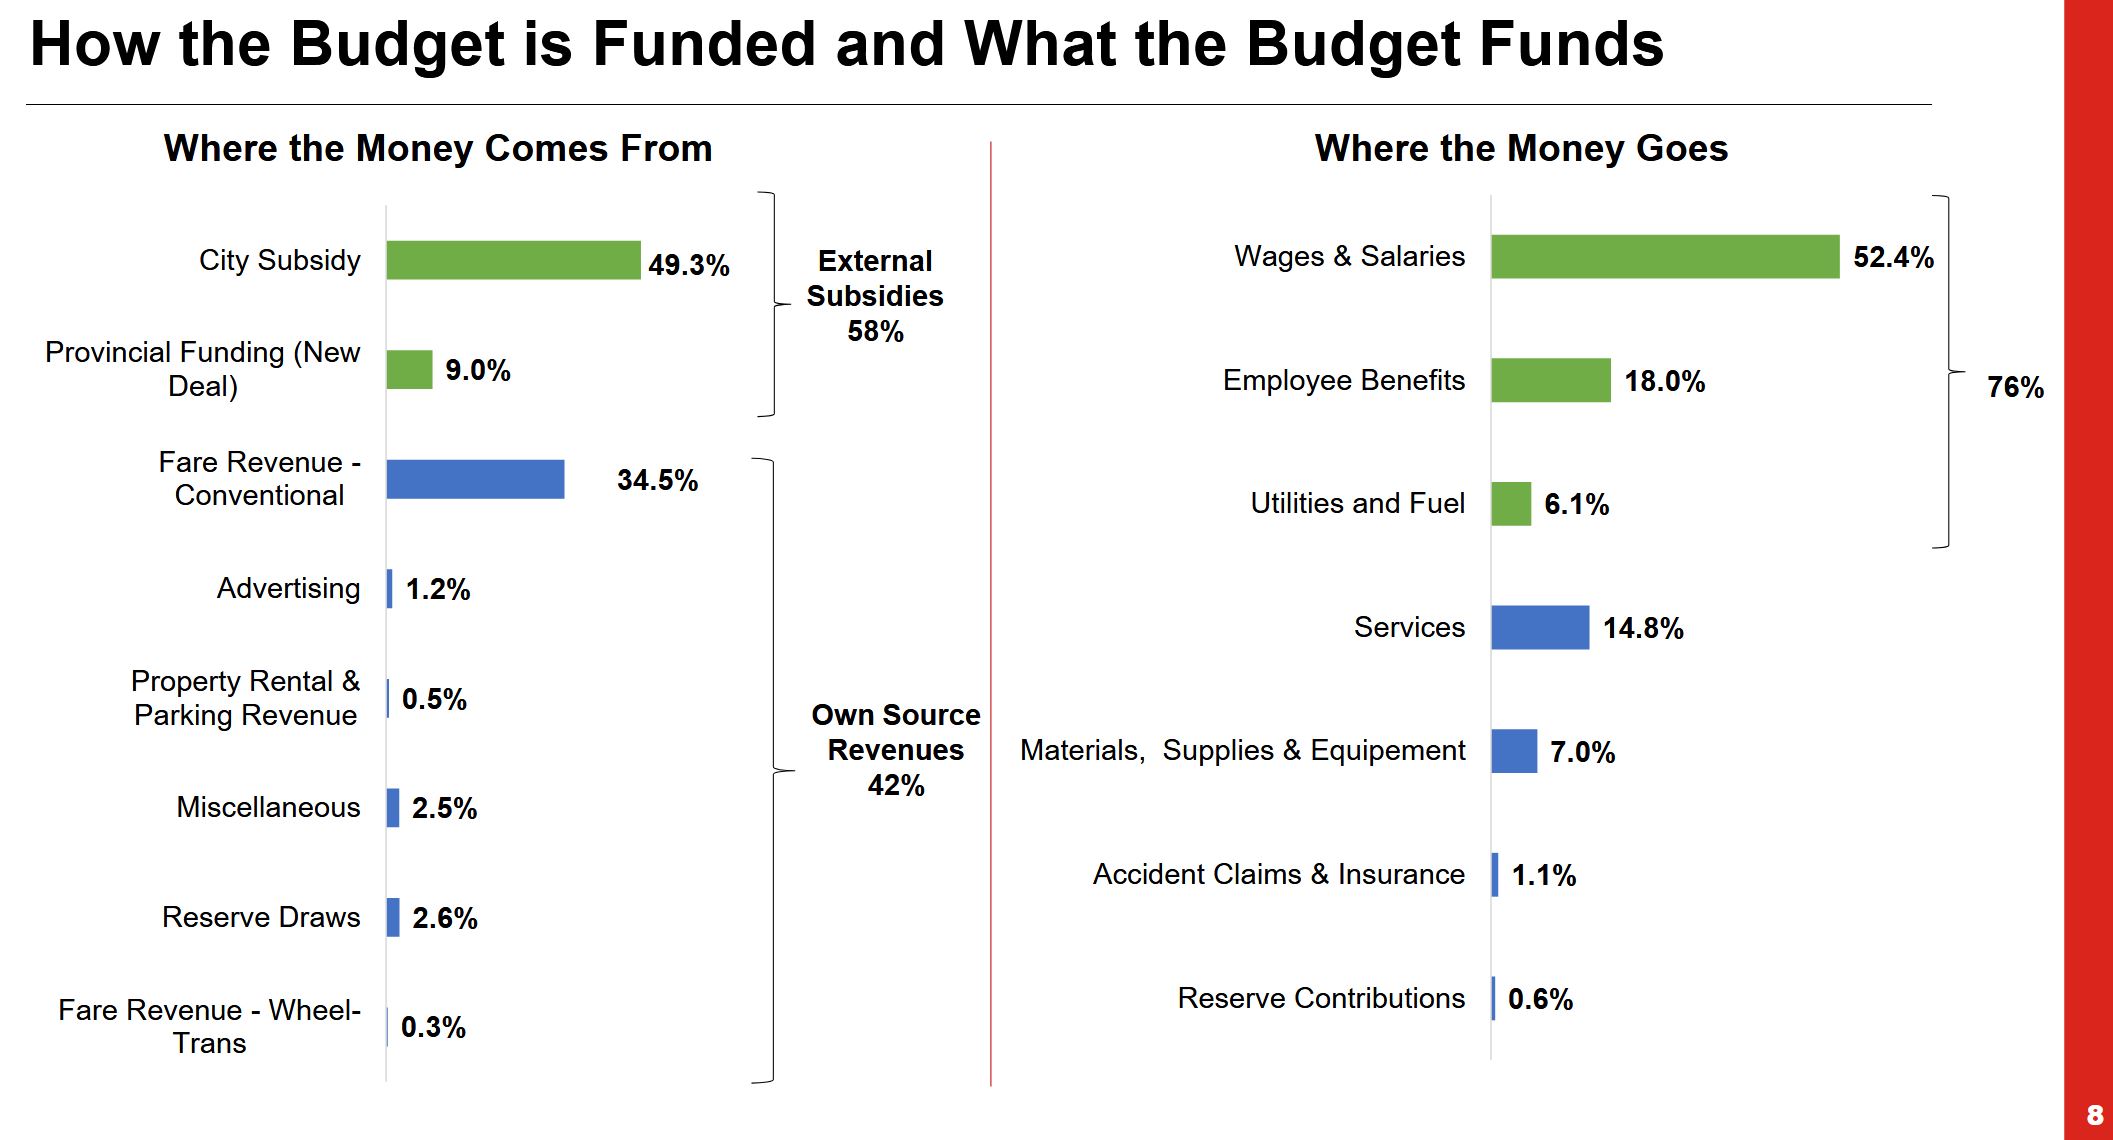
Of the total operating cost, 93% is “conventional” TTC service and 7% is for Wheel-Trans out of a projected total of $3-billion.
This was achieved while keeping the increase in City funding to $91-million and finding $87-million in budget reductions (some of which are due to accounting changes). We do not know most of the details of budget trimming, nor the foregone possibilities for improvement. Commissioner Saxe queried the lack of Board participation in this process which was to be part of the Strategic Planning Committee’s mandate. We will see in 2026 whether there actually is an open debate.
The revenue/cost ratio for the TTC is now 42%, and that number includes some ancillary revenue beyond the farebox. It is no longer possible to paint TTC as a woefully undersubsidized agency. Riders once paid 60% of costs with another 6% coming from sources such as advertising. Indeed, the City of Toronto will pay more in subsidy in 2026 than the TTC will receive from fares.
Note how small the ancillary revenues are in the table below. Budget debates spend excessive time on how the TTC could be so much better off if only there were more ads, or revenue generating schemes such as shops in stations. This is all very small change compared to overall funding needs, but fixating on minor revenue schemes avoids hard decisions about spending on quality service.
Since September 2025, the TTC CEO’s Report has included a new presentation of various performance stats both to improve clarity, and to allow a deeper dive into each mode – subway, bus, streetcar – than was done in past reports.
This article presents the new pages for surface modes side-by-side, followed by the subway versions which differ because of the operating environment and infrastructure.
It would be heartwarming to see a revised set of data, but my gut feeling is that the new format adds little to older reports than pulling together many stats for each mode in one place. The actual content still leaves a lot to be desired.
To be fair to the TTC, there is a project underway to review and improve the KPIs [Key Performance Indicators] used to monitor the system, but this is not yet reflected in the reported data.
A pervasive problem with TTC’s self-monitoring is that many statistics are averages over long time periods, locations and routes. There is no sense of local variability or “hot spots” deserving of attention. Use of averages hides the problems, and prevents exception monitoring to show whether improvement happens where it is really needed.
Other metrics allow management to present a rosy picture when this does not match what riders actually see and politicians responsible for transit hear about in regular complaints.
Some metrics are demonstrably invented out of thin air. I have already written about how, until September 2025, bus reliability stats were artificially capped making eBuses appear much more competitive than they actually are. These stats should be restated for previous years to show actual trends, not fairy tales about bus reliability.
Crowding is reported on the basis of “full” or “crowded” status, but these are not defined, nor is there any recognition that the approved Service Standard for off-peak is different than for peak vehicles. What might be considered only “crowded” in the peak would be well beyond the off-peak standard.
Recently, the average speed of streetcars was misrepresented as being strongly affected by autos blocking the tracks when, in fact, the lion’s share of these incidents were the result of the winter snowstorm and the ineffectual clearing of roadways by the City of Toronto. Traffic obstacles for streetcars (and in some cases for buses) remains a problem, but misrepresentation of stats will only undermine calls for better transit priority.
Fleet availability is reported relative to scheduled service, but without any discussion of factors that could limit how much service the TTC attempts to operate. This includes operator shortages through budget limits. A basic metric for transit fleets is the “spare ratio”, the number of spare vehicles above and beyond regular service requirements. Some spares exist for routine maintenance, some for ad hoc service, but some are simply sitting with nothing to do because there is no budget for them nor for the operators needed to better utilize the available fleet.
A related question is the degree to which a high spare ratio reduces the effect of vehicle failures because the pool available for scheduled service is so high. A high number of spares represents both a capital cost (procurement and yard capacity) and an operating cost (routine maintenance). Does the high number of spares represent real availability for better service, or are these the duds left on the sideline except for extreme emergencies? How large is the truly available fleet for each mode?
“On time performance” is a misleading term on several counts.
The metric has historically only applied to terminal departures, not to overall route behaviour.
A separate headway metric is now coming into use, and it is much more generous for the divergence of actual from scheduled service than the on-time metric in most cases.
Service Standards define metrics for early arrivals and for missed trips, but these are not reported.
Delay logs report the length of a service blockage/diversion, but give no indication of the number of vehicles or riders affected.
With the continued reporting of ridership levels today compared to pre-pandemic times, what is missed is a comparison of service levels. Leaving aside the bunching & gapping issue, service on most streetcar routes is less frequent, sometimes dramatically so, than it was in early 2020 and before. The wider headways are compounded by bunching problems which accentuate the relative infrequency of scheduled service. Decades ago, we saw how 501 Queen lost a substantial portion of its ridership when longer ALRVs replaced CLRVs on comparably wider headways. How much of the current ridership loss is due to much less attractive service as opposed to some inherent weakness in demand?
A comparison of pre- and post-pandemic service levels is at the end of this article.
The remainder of this article reviews the charts in detail.
In a previous article, I examined the report on the Bunching & Gapping pilot now in progress at the TTC.
At the November 3 Board meeting, there was almost no discussion of that report, but in its place management provided a short presentation. Unfortunately, this portion of the meeting was not uploaded to YouTube, and so readers will not be able to view it for greater detail.
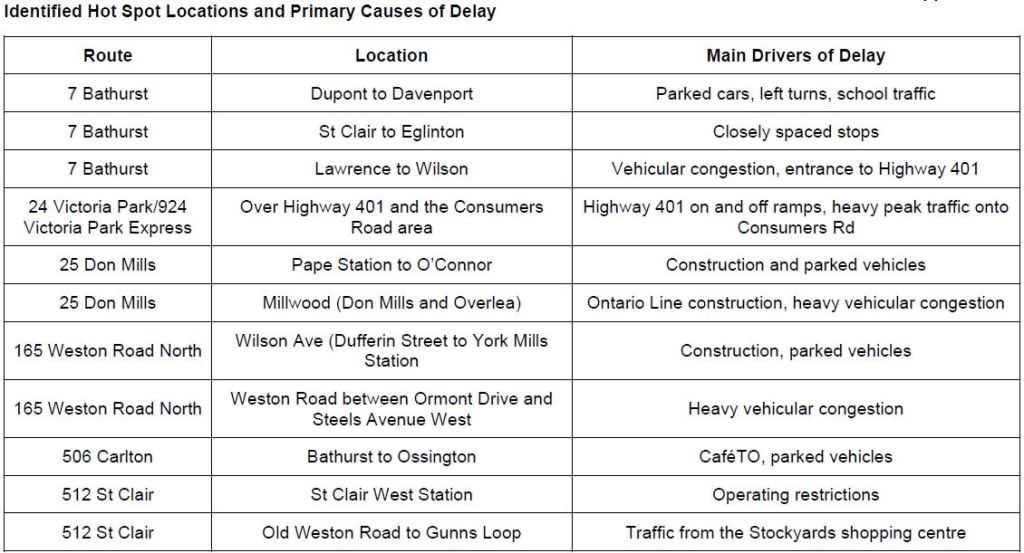
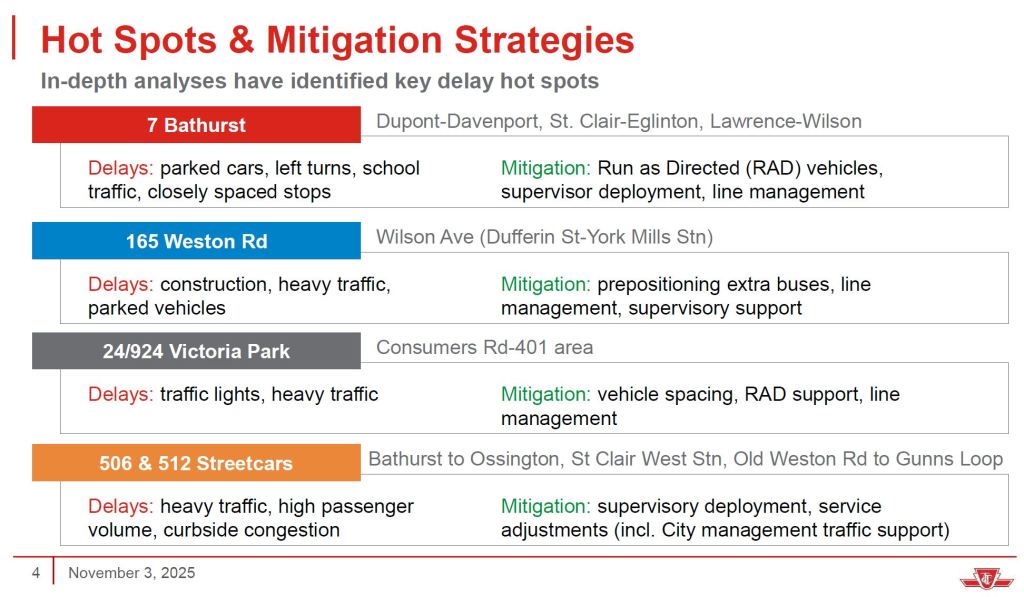
Information about hot spots on routes was presented in a different way from the original report. Both versions are shown below.
Original VersionPresentation Version
The original version has more granularity showing the issues specific to each route segment.
The presentation shown at the meeting included a hot spots map across the whole system, but this is not included in the published deck. I will ask TTC for a copy and add it here when available.
The important point about that map is that the hot spots are all over the city, while conventional wisdom presents this more as a downtown, streetcar-centric problem.
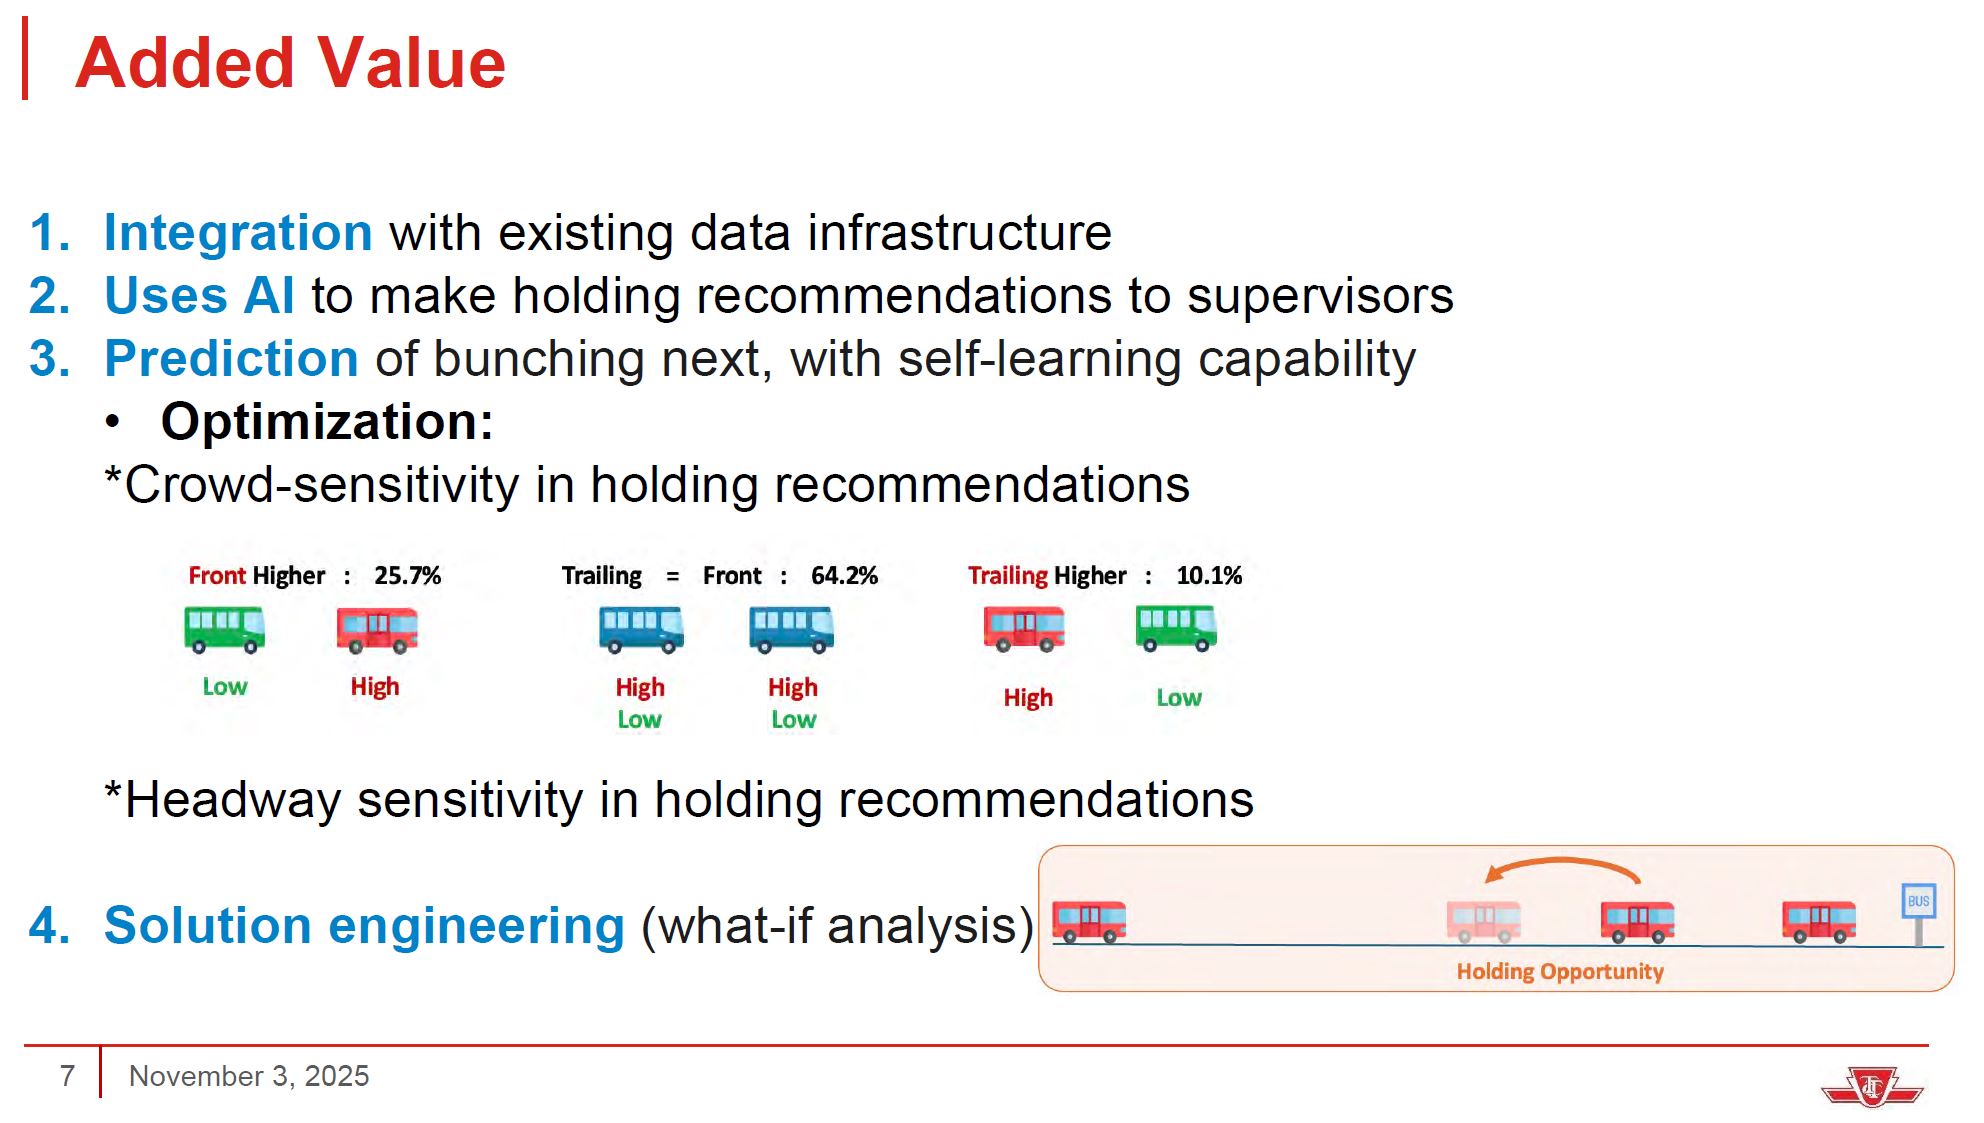
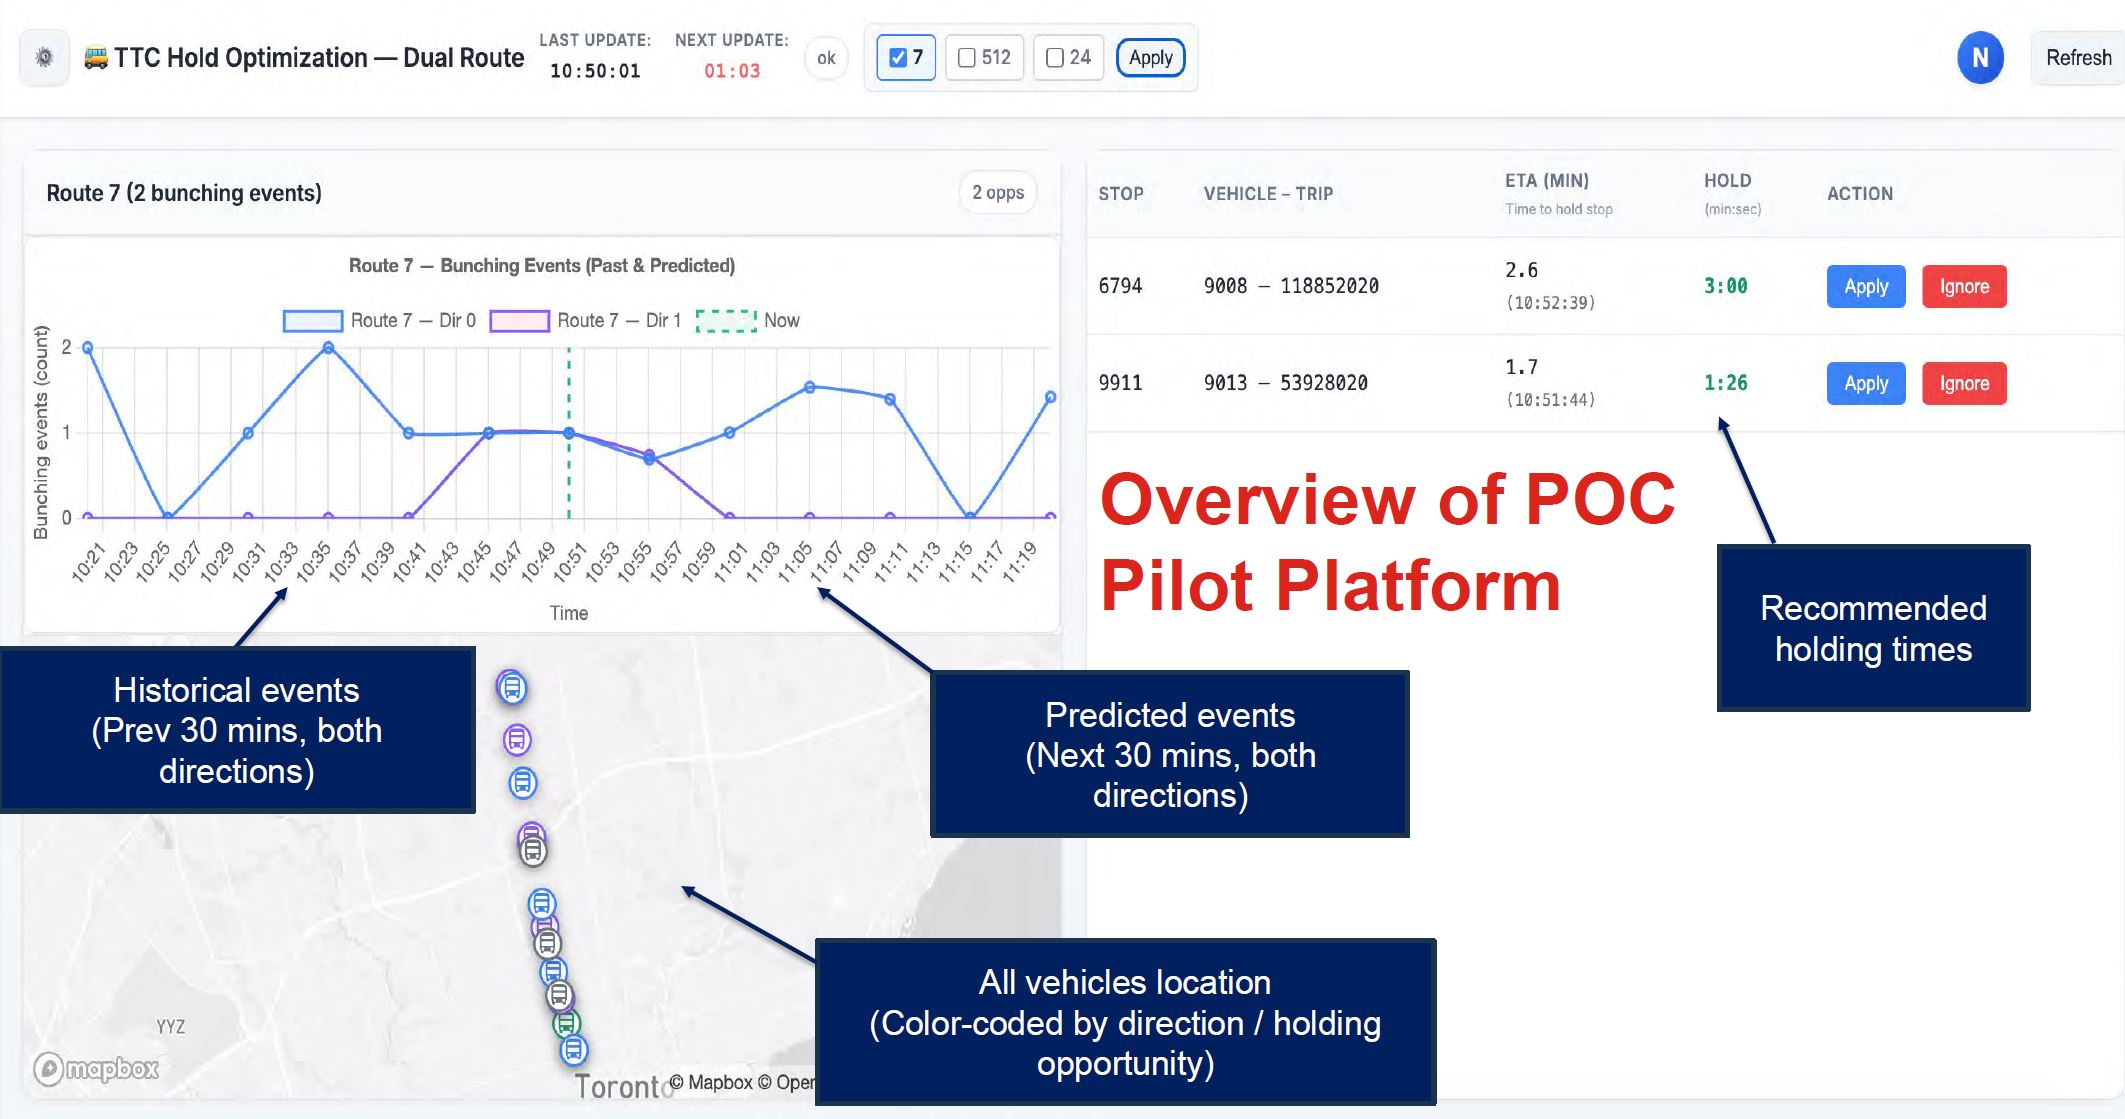
Results on the pilot routes have been mixed, and even this has required a high level of supervision that likely would not scale to the entire system and most hours of service. As an alternative, the TTC is considering an AI (Artificial Intelligence) tool developed at York University. Initially this would be used in an advisory manner to route supervisors who would decide whether its recommendations were valid. Later, it would directly instruct operators to hold enroute to even out headways.
A decision to hold a vehicle would take into account the relative loads of the leading (gap) bus and the trailing (bunched) one. Ideally, a bunched bus will have the lighter load and holding it to space service will affect fewer riders. This is not always the case if pairs of buses leap-frog to share the work along a route, and the “trailing” bus might have the heavier load at some points.
A proof of concept dashboard gives an idea of what might be presented to a route supervisor. This shows recommended holds, as well as the distribution of historical and predicted bunching. Note that the scale on the chart is the number of bunched buses, not the gap size to be corrected.
The challenge here will be for the AI model to predict future behaviour. Many things affect bus spacing, and some of them are not predictable. For example, irregular terminal departures can begin a process where a small gap gradually widens. That effect can be predicted and service adjusted, but the actual late or early departure is only known when it happens. Developing gaps are easy to spot along a route because the future service at a location can be predicted by what is in the few kilometres approaching it.
Congestion caused by accidents cannot be predicted, but the act of smoothing out service can deal with its results at least in part based on past experience with similar events. There is no mention of short turns or tracking of issues with buses running late due to insufficient schedule time, or the timidity of a junior operator.
Notable in the presentation is the implication of headway management, not on-time performance. The TTC needs to decide which of these it will adopt and incorporate that into terminal dispatching.
There is also the question of whether the Service Standards are too generous in defining the allowable variation in “on-time” and “headway” values. Departures are supposed to be no more than 5 minutes late, and never early. Headways on a 10-minute service like 7 Bathurst can vary from 5 to 15 minutes. If the AI tool uses these as its goal, it will perpetuate the uneven service allowed by the standards, particularly in headway management. There is also a danger that route speed will be determined by spacing service to accommodate the slowest drivers.
No computer system inherently “knows” what it is supposed to achieve, and depends on the parameters set down by its developers. If the TTC does not fully understand what “good service” should look like, an AI tool will only work toward expectations built into its design. An important component should be the ability to tighten or relax the targets for “good” service management.
TTC plans to shift the focus of its more intense supervision from the 7 Bathurst and 24/924 Victoria Park routes to 29/929 Dufferin and 25/925 Don Mills. I have collected tracking data on these routes for some time, and will publish analyses of changes in route behaviour after a few months have accumulated.
The Board approved the following motion:
Request TTC staff report back to the TTC’s Strategic Planning Committee as a part of consideration for 2026 budget priorities on the resource requirements, staffing, and operational needs to sustain a full-year Bunching and Gapping Pilot in 2026 as well as the feasibility of expanding the pilot to additional key routes across the City to improve service and reliability.
The next meeting of the Strategic Planning Committee is on November 25, 2025.
In September 2025, I reported that the UITP (International Union of Public Transport) had delivered its peer review of TTC rail systems, but that TTC management did not want this document in public.
A decision on whether to release the document was put off until the November 3, 2025 Board meeting, and partly redacted documents were released on November 5. See:
Very little of the report or response is redacted, and the sections withheld are listed as containing “information about the security of the property of the local board”. At one point as the report made its way through previous debates, “commercial confidentiality” was also cited, but that has disappeared in the version that was released.
The management responses lie in three separate documents, with most items being “accepted and in progress” or “pending further assessment and potential resourcing”. Some of these will require participation by groups outside of the TTC, notably City Transportation Services. I will leave it to readers to peruse the responses linked above.
Readers should note that this is not a general review of TTC operating and maintenance practices, but rather a discussion of how the TTC keeps track of maintenance needs and manages its fleet and infrastructure. Only a few operating practices come in for comment. This review only covers rail modes, and the report is silent on bus operations and maintenance.
Subway vehicles and Streetcar vehicles are the main elements in the scope of this peer review. Other related subsystems like power, track, overhead catenary and signaling systems, which are essential parts for the operation of Subway and Streetcars,2 have been reviewed as requested by the TTC.
This peer review is a strategic review of the asset management plan and maintenance processes and is not a technical analysis nor assessment of the systems within the scope apart from the review of the Automatic train control (ATC) system specially requested by the TTC.
The aim of this peer review is to assess the TTC asset management plan and some other relevant documents, to identify gaps and improvement areas in line with the best international practices and standards. [p. 12]
Although the UITP team reviewed the TTC’s practices both through virtual discussions and information exchange, and through on-site visits, some comments give the impression that the team did not pick up on all of the local details.
Some TTC practices are lauded including the degree of in-house expertise and avoidance of outsourcing. This is ironic considering the ongoing efforts in past years to shift work to the private sector. The UITP review is quite clear in favouring the in-house option.
It is noted that the TTC conducts much of its maintenance in-house. It is good practice to keep maintenance of most systems, including rolling stock, signaling and track, in-house in order to maintain technical and performance knowledge within the organization. Whilst outsourcing may seem an attractive proposition, as it leaves the responsibility for the process to another party, it will be more expensive, and it removes control of the maintenance processes from the operator.
The long lifespan of many railway assets means that changes will take place as a result of experience in operation and maintenance processes. There will be modifications to equipment to improve reliability or reduce maintenance requirements. The life cycle of the asset is better managed by the operator if the operator has full knowledge of the performance of the asset. A maintenance contractor will take that knowledge from the operator and reduce their ability to monitor cost effective life cycle processes. [p. 18]
The bulk of the review and recommendations lie in Section 7 running from page 16-46. This article will sketch the key points, and interested readers should refer to the full report.
The items are presented mostly in the order that they appear in the document. Some sections give the sense that the authors attempted to review the TTC in detail, while others have a “cut and paste” feel of general suggestions with little reference to the Toronto situation, or the city’s position relative to other major transit systems.
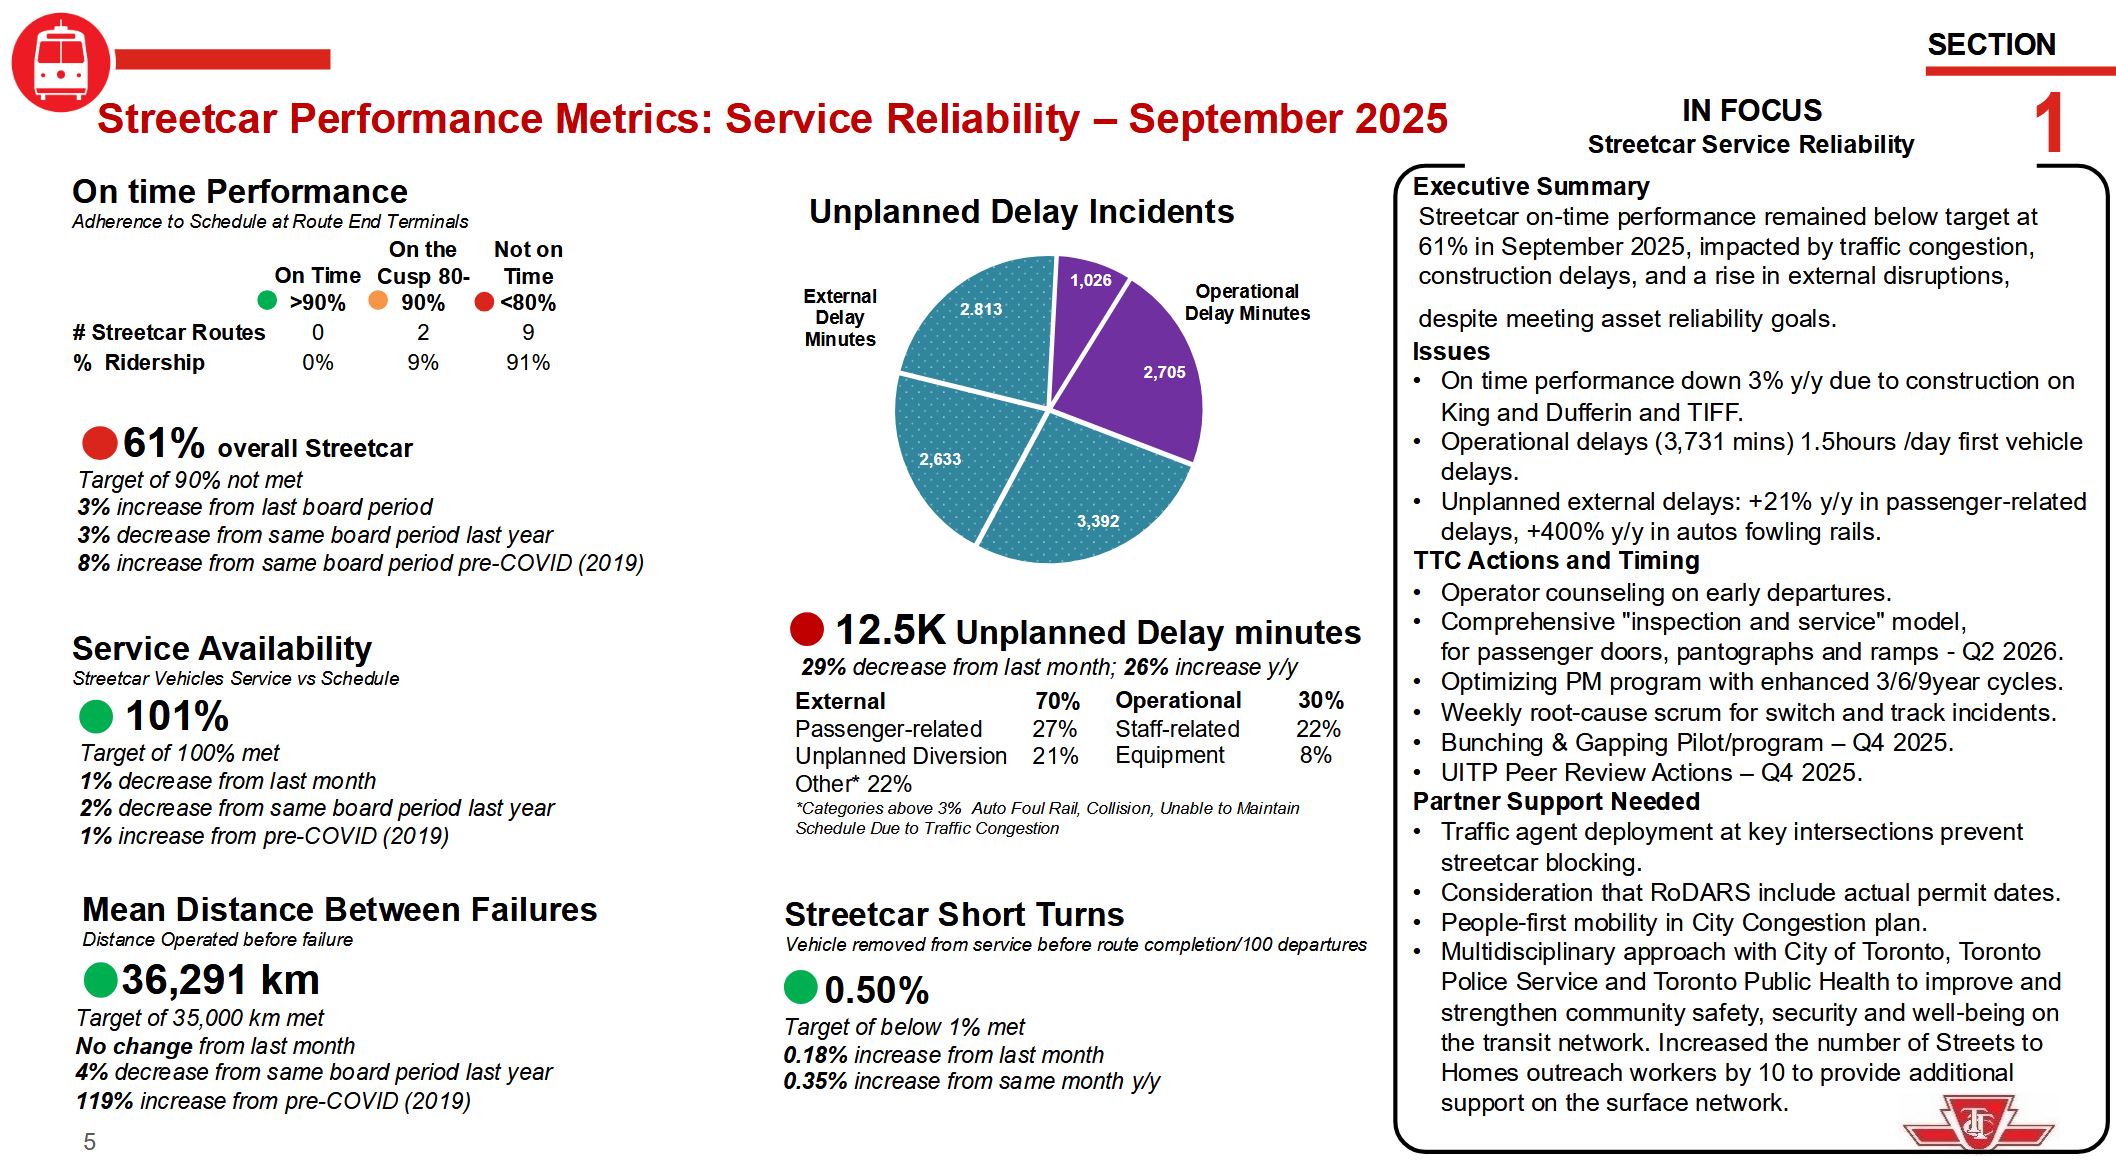
At the TTC Board meeting on November 3, management presented statistics on streetcar delays broken down by type of incident. TTC is quite fond of portraying external incidents, especially those related to congestion, as the root of (almost) all evil. The following page is from the CEO’s Report.
Note that external delays (turquoise) occupy the majority of the chart. During discussion of the problem of autos fouling rails, a passing remark by the Interim Chief Operating Officer piqued my curiosity when he said that there were many delays due to the winter storm.
This sent me to the TTC’s delay statistics which are available on the City’s Open Data site. There are codes for many types of delay including “MTAFR”, short for “Auto Fouling Rails”.
According to the “In Focus” box above there has been a 400% year-over-year increase in these delays, although they are styled as “fowling” implying a flock of chickens might be responsible for service issues.
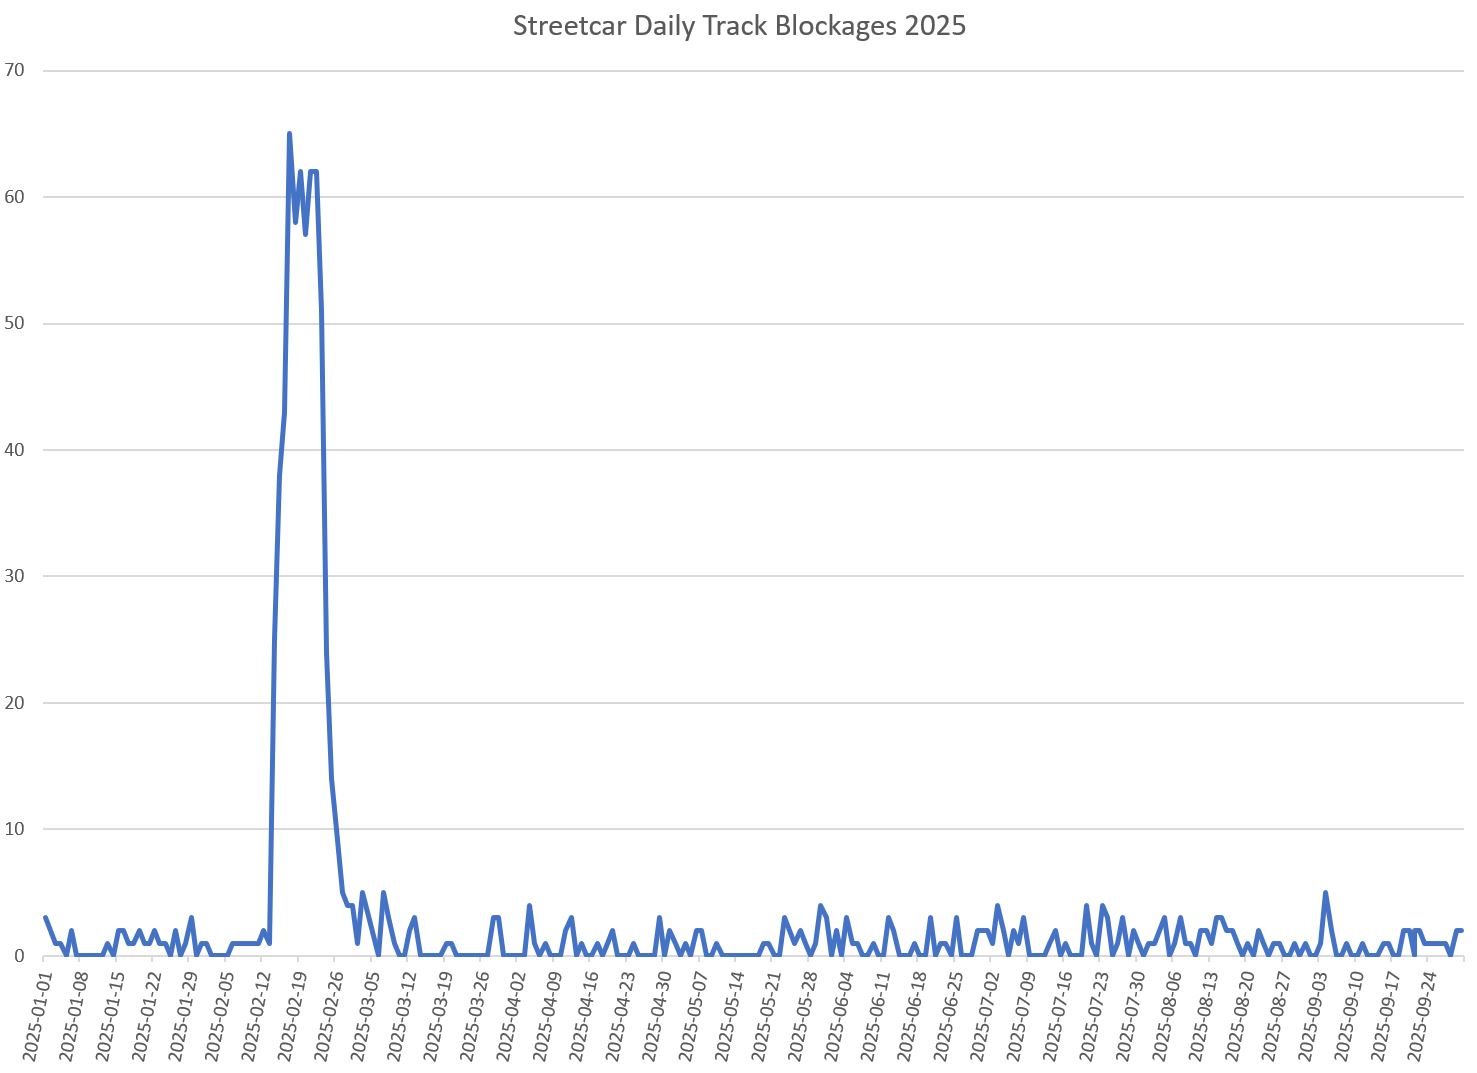
Sorting the data by code and summarizing by date produces interesting results.
Between January 1 and September 30, 2025, there were 843 MTAFR events logged.
Of these, 586 fall between February 14 and 26 hitting a daily high of 65 on February 17.
These blockages were not caused by the typical traffic congestion, but by the City’s utter failure to clear snow on key streets.
105 were on 501 Queen
42 were on 503 Kingston Rd.
84 were on 504 King
93 were on 505 Dundas
186 were on 506 Carlton
3 were on 507 Long Branch
1 was on 508 Lake Shore
2 were on 509 Harbourfront
None were on 510 Spadina or 511 Bathurst
6 were on 512 St. Clair
A few dozen were on various night cars
The pattern here is quite clear: routes on wide roads or rights-of-way were not seriously affected, but routes on regular 4-lane streets were hammered. (How 511 Bathurst was spared is a mystery. At the time it was running with streetcars from Bathurst Station to King & Spadina, and with buses on the south end of the route.)
To claim that the 400% increase from 2024 is some indication of worsening traffic problems is gross misrepresentation of what actually happened. Although this is the CEO’s report and he almost certainly did not assemble the information himself, he wears this issue for having reported misleading data to the Board and public.
Direct comparison with published 2024 data is difficult because until 2025 the TTC used a much coarser set of delay codes that lumped many types of events under generic headings. There was a category “Held by” in which there were 625 incidents from January to September in 2024. The 843 MTAFR codes in 2025 are quite clearly not a 400% increase over 2024.
Whenever there is a discussion of unreliable service, we hear endlessly about traffic congestion. This definitely is a problem, but not the only one, and certainly not in the way presented by the CEO.
A question arose during the debate about the problem that performance stats are consolidated across all routes. Route-by-route service quality is presented in detail in the second part of this article for all streetcar routes. This shows that problems are widespread in the system, even on routes with reserved lanes.
As for the delay stats cited by the CEO, it is clear that we are not comparing September 2025 to one year earlier as the text implies, but using events from the entire year to date including a major snowstorm that had no equivalent a year earlier. The so-called 400% jump in delays from blocked tracks is due to snow and poor road clearance by the City.
TTC management owes the Board and the public an apology for blatant misrepresentation of the delay statistics.