
With Line 5 Eglinton entering its second week of operation, comparison of LRT and bus speeds on the surface portion of the route is inevitable, especially among those who would prefer subways everywhere.
This article reviews the actual travel times in December 2025 and January 2026 for the bus service that was replaced by Line 5. This gives a variety of operating conditions including holidays and winter storms, and reflects stopping patterns and dwell times for the level of demand before Line 5 opened for business.
Actual bus travel times only bettered the scheduled LRT from mid-evening onward on weekdays, and were considerably longer in the PM peak. For trips to/from Kennedy Station, the LRT has an advantage of a more direct path into the station avoiding both the traffic signal at Kennedy Road and the roundabout bus route within the terminal.
The section of Eglinton where the LRT runs at the surface is uncongested during much of the day compared to other routes in the city. Some spots have slower bus travel times, but these do not persist. This is a challenge to “better” performance by the LRT unless it has some advantage over buses notably in faster speed during all operating periods, good priority at traffic signals and reliable travel times when the adjacent road is congested.
The potential for faster LRT trips through transit signal priority lies in the 2-4 minute range, an improvement of 10-20%, depending on how aggressively this is implemented. There are 14 traffic signals over the route between Ionview and the DVP, and a variety of locations with nearside, farside or no stops at these points. The Transit Signal Priority strategy should be tuned to the characteristics of each crossing.
This analysis does not include additional access time to LRT vs bus stops. This affects the surface section of Line 5 less than the underground section where both station spacing and vertical access times add to LRT journeys.
Detailed tracking data for Lines 5 and 6 are not available from the TTC although “next train” predictions are in their public data feed. This hampers analysis of the reliability and travel times of the new LRT lines.
Screenline Locations
For this analysis screenlines for measurements are at:
- Kennedy Road
- Victoria Park Avenue
- Don Mills Road
This arrangement omits the time required for buses to enter and leave Kennedy Station Loop. This actually shaves a few minutes off of the bus times from a rider’s point of view for trips using that station. I will return to this later in the article.
Weather
Toronto received substantial snowfalls on the following dates (readings at Toronto International Airport):
- December 10: 10.0cm
- December 22-23: 10.0cm
- December 26: 12.0cm
- January 9-10: 9.9cm
- January 14-16: 25.6cm
- January 25: 46.2cm
The temperature did not rise above freezing from mid-January onward and substantial snow accumulations remain as of mid-February.
Westbound from Kennedy to Don Mills
LRT travel times between Kennedy to Don Mills, from personal observation, are about 20 minutes of which about 12 are spent east of Victoria Park and 8 west to Don Mills. Eastbound times were slightly longer due to the slow approach to Kennedy Station. Tracking data for Lines 5 and 6 are not available, and so I cannot produce a statistical report of the consistency and range of times. Scheduled travel times are 21-22 minutes depending on the time of day.
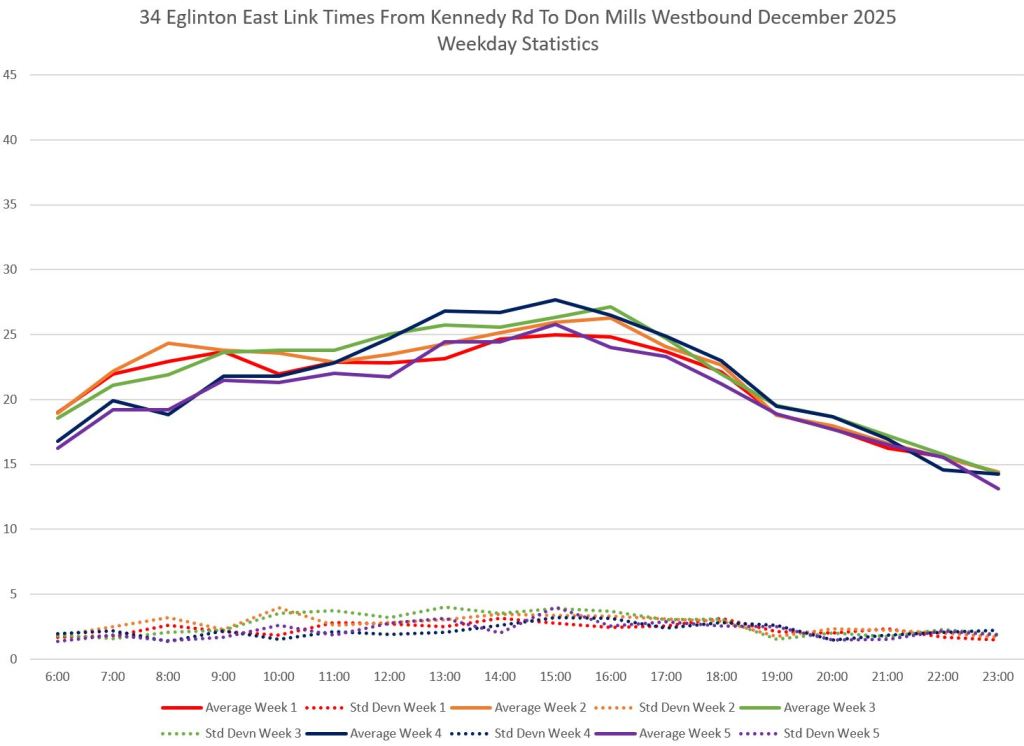
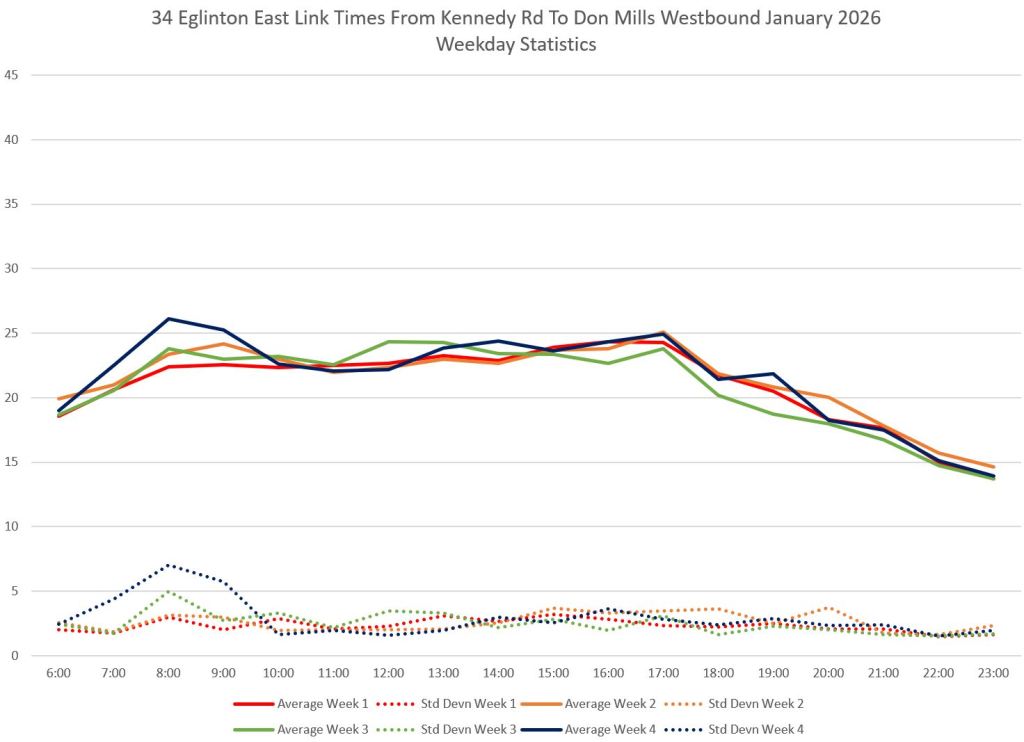
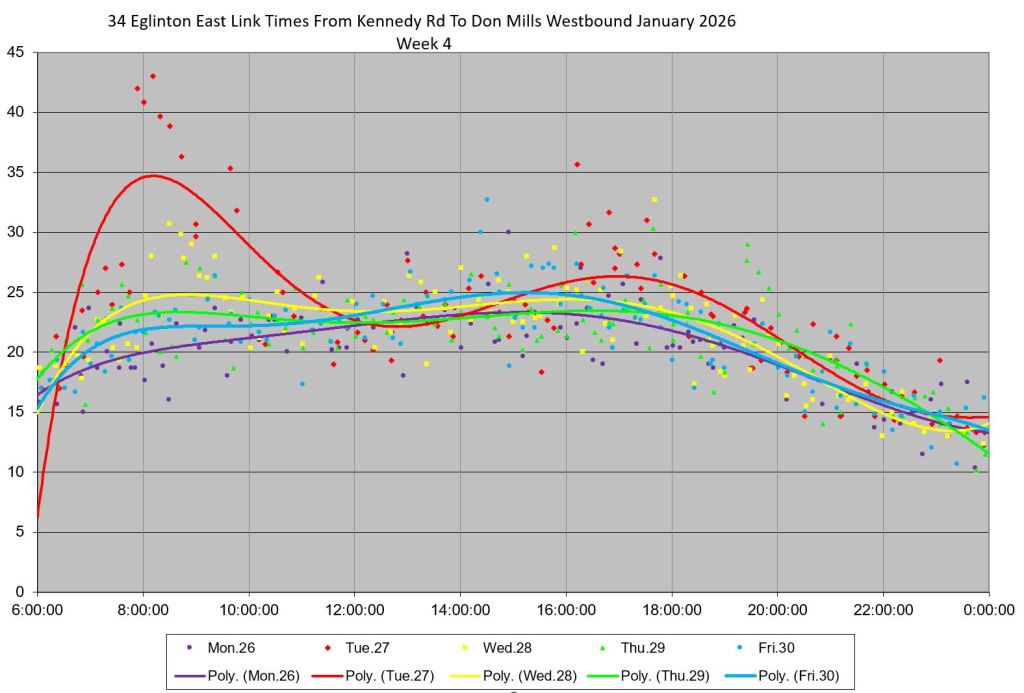
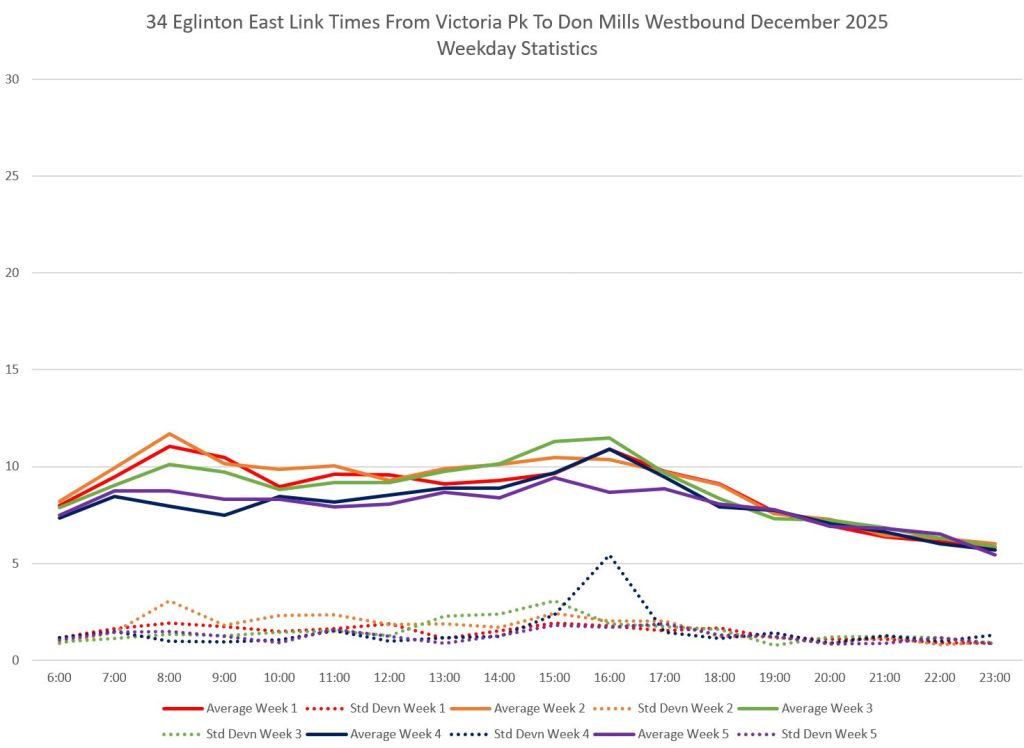
Bus travel times lie in a band of 20-25 minutes during daytimes, dropping substantially in the evening when traffic and ridership are light. Standard deviations in the times are in the 3-4 minute range indicating that most of the bus trips lie in a band about 6-8 minutes wide.
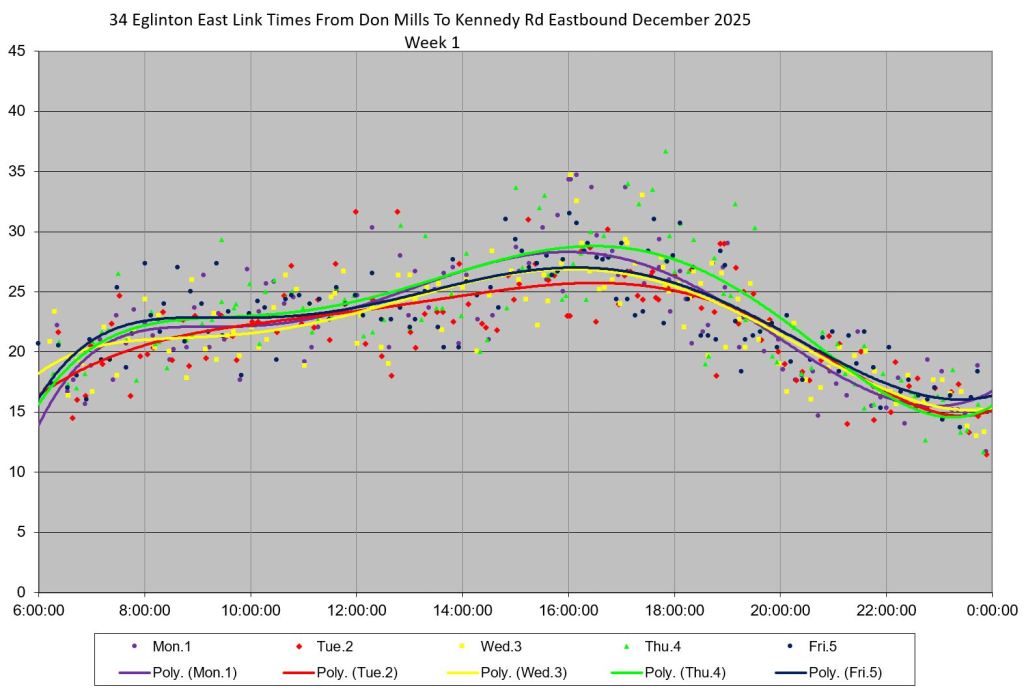
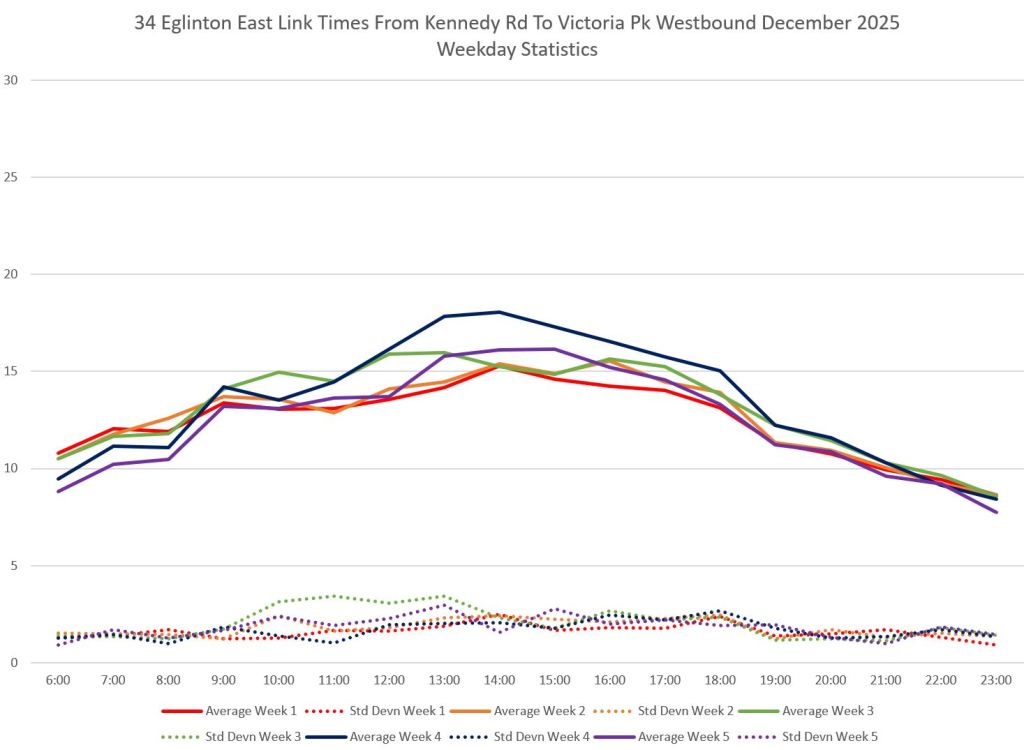
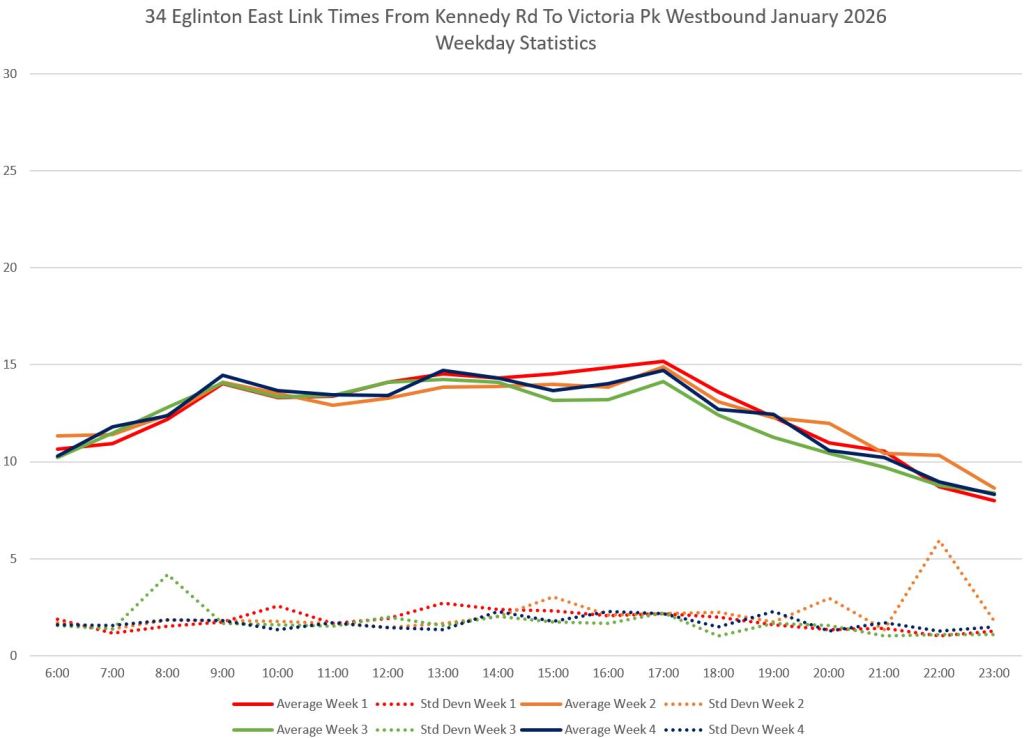
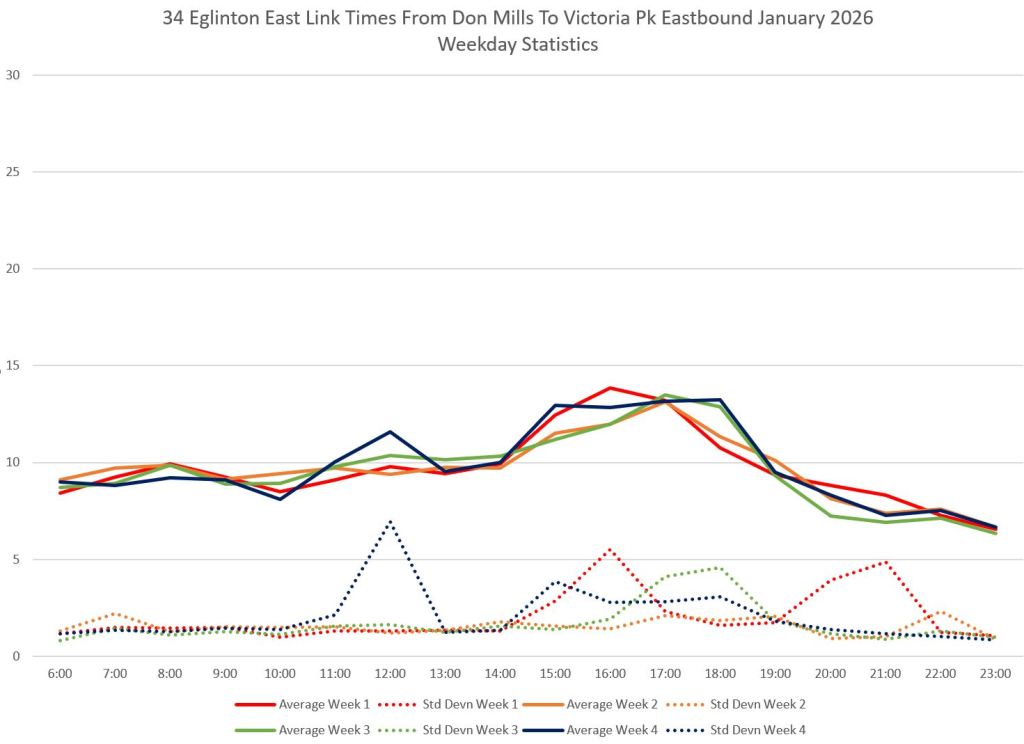
The first set of charts show the weekday averages by week and hour of the day.
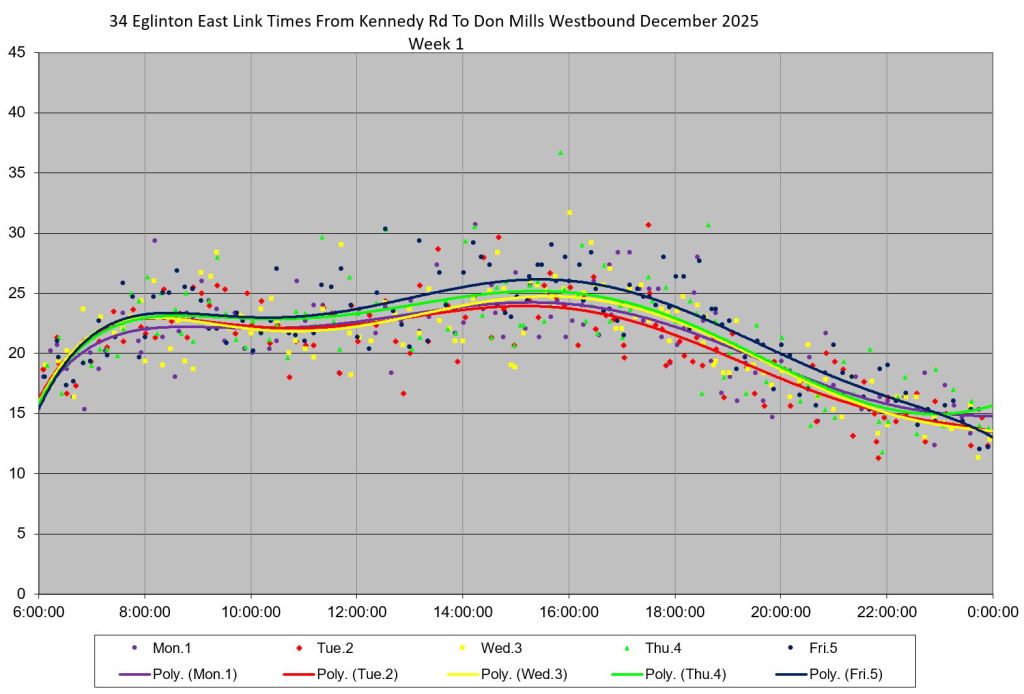
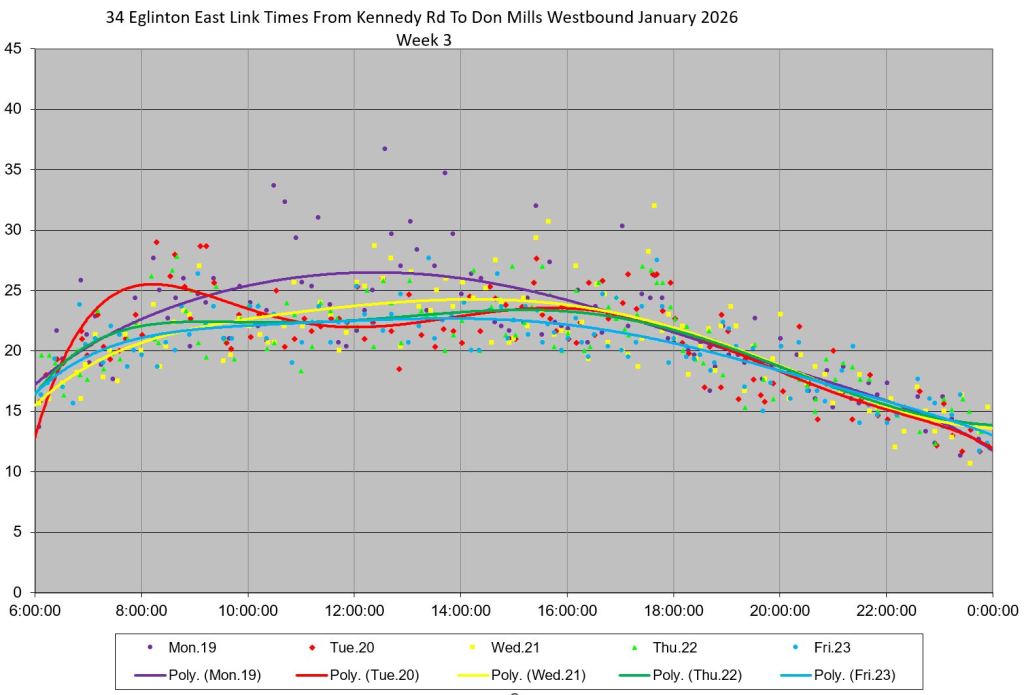
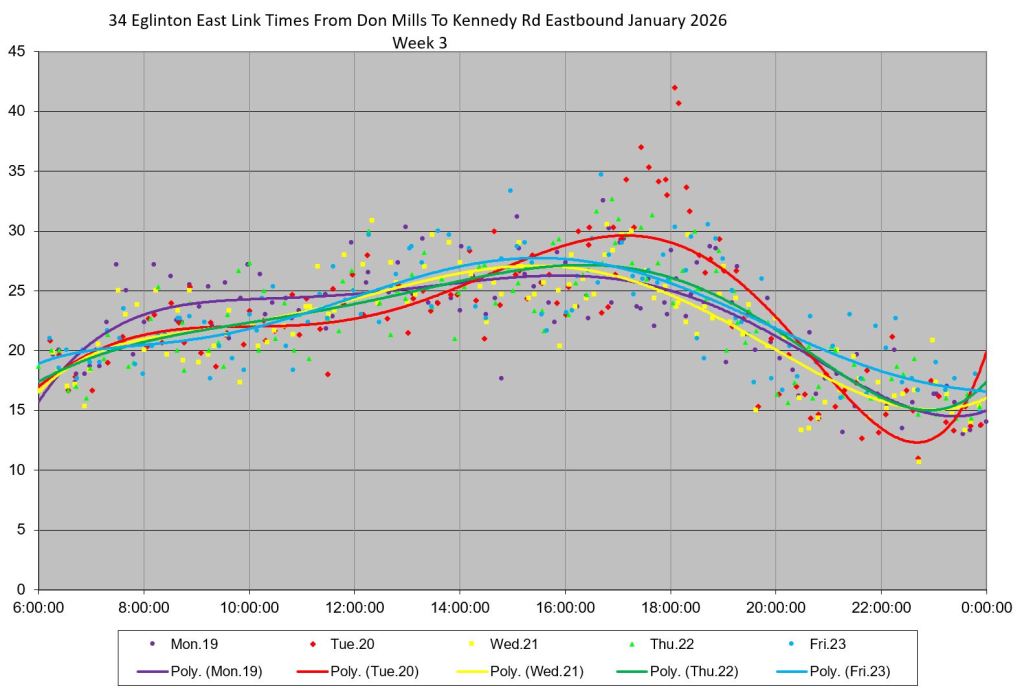
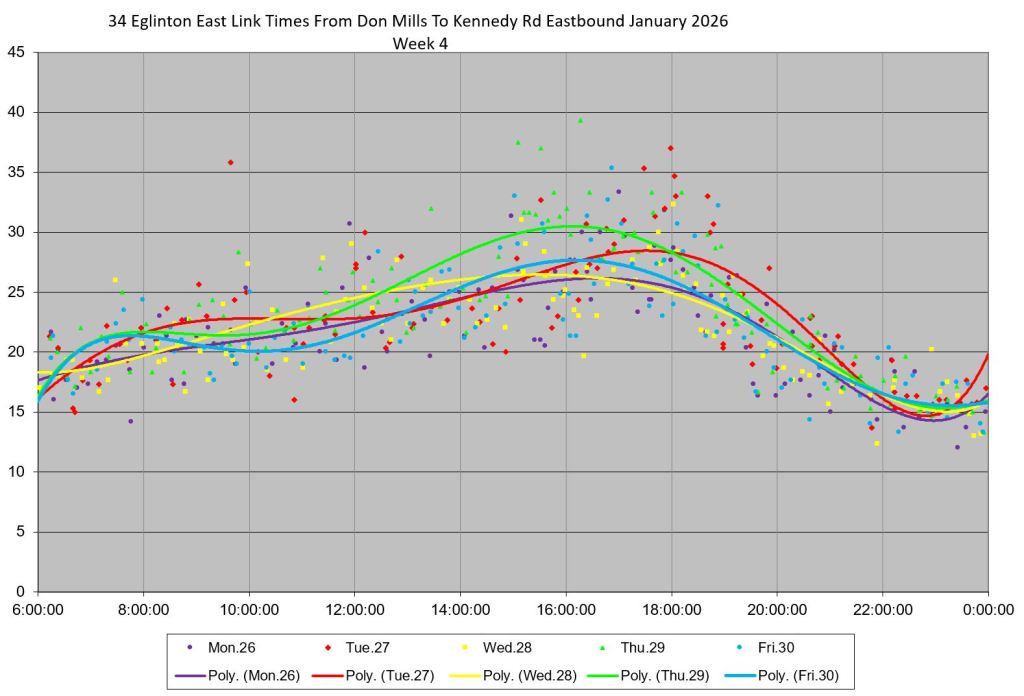
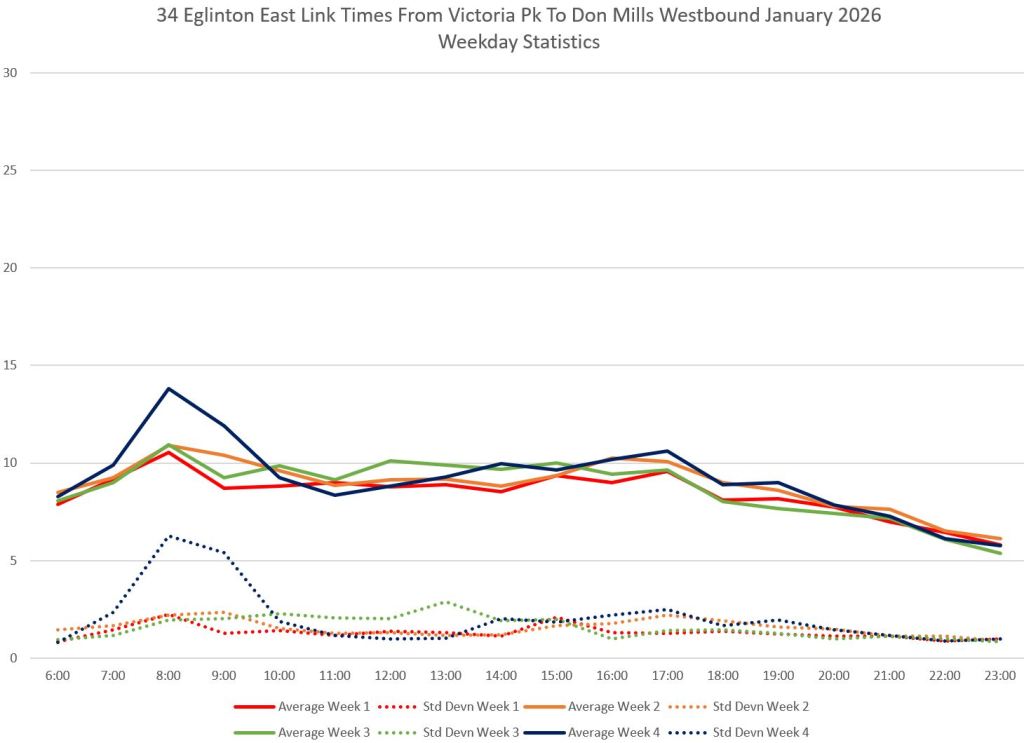
The next set of charts show the detailed data for the first week of December (before the first storm), and for weeks 3 and 4 of January. The scatter in travel time values is greater on some days showing the effect of the snowstorms and their aftermath.
An important distinction between LRT and bus trips will be the degree to which LRT times are more reliable than bus trips. Looking only at average travel times hides the possibility that a longer trip might be possible/probable with one mode as compared to the other. Unfortunately, this is hard to analyze without the vehicle tracking data available for regular TTC routes.
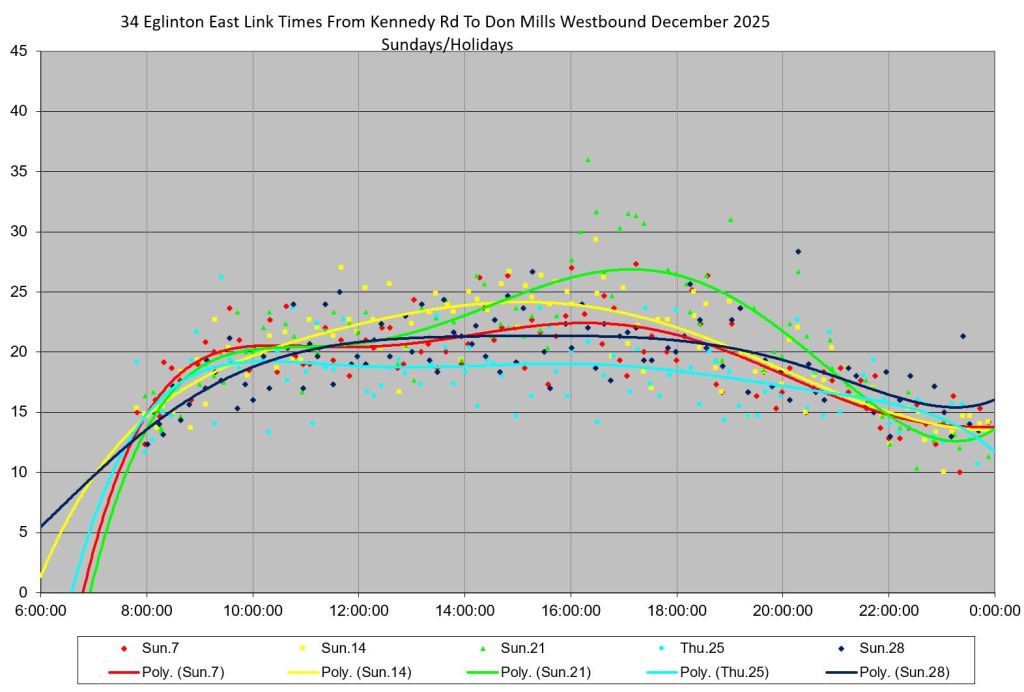
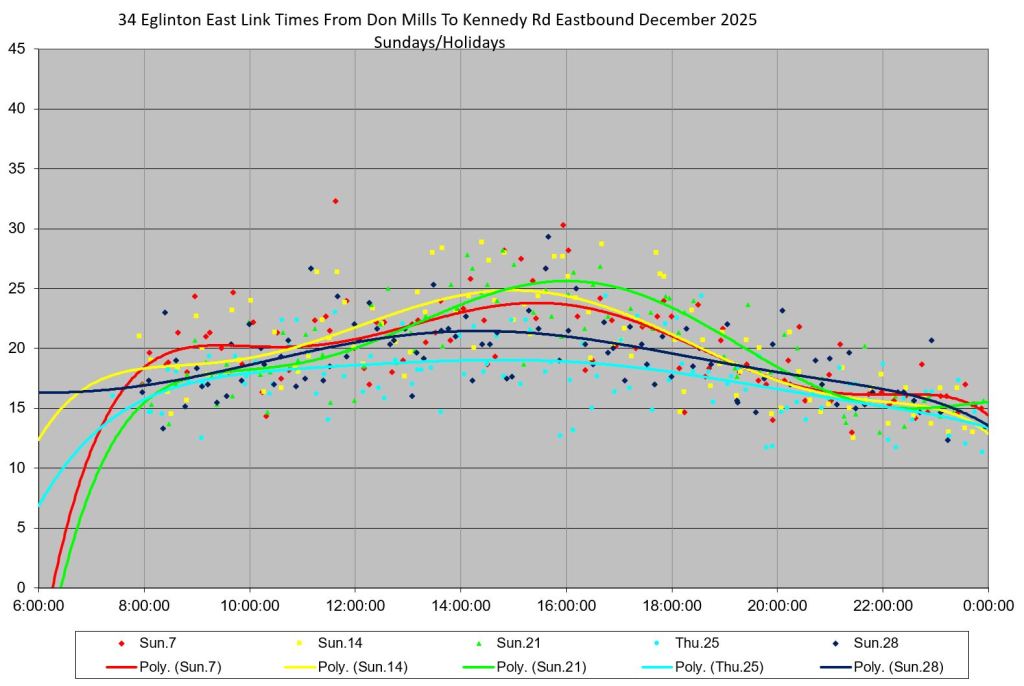
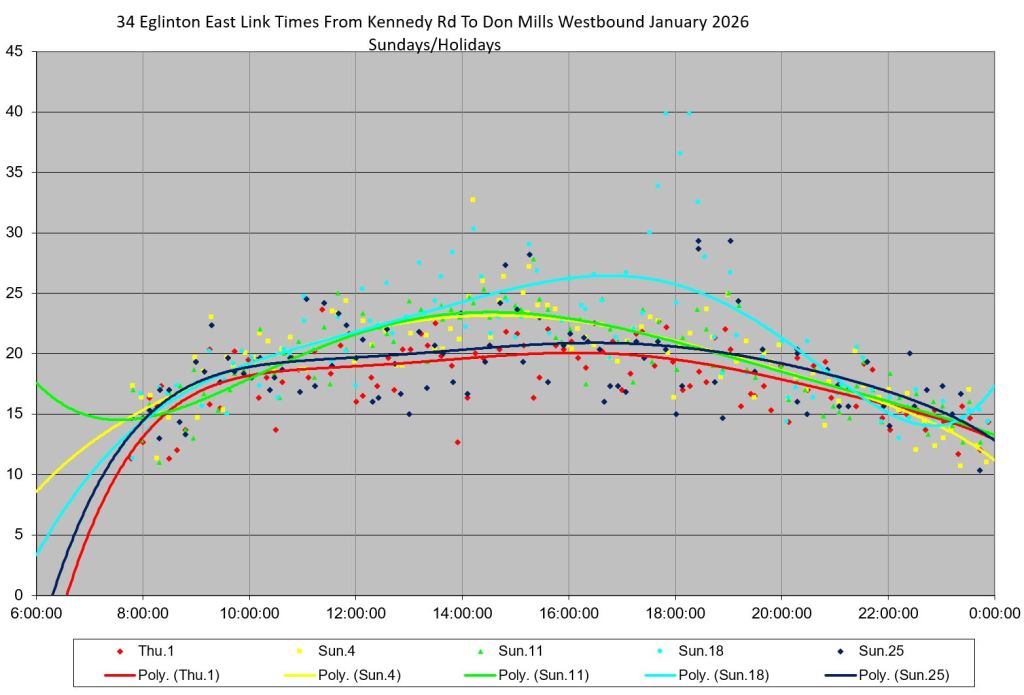
The charts below show Sunday/Holiday data including Christmas (turquoise on the left) and New Year’s days (red on the right). Those days show the fastest travel times of all with the trend line just below 20 minutes. The combined effect of light traffic and lower ridership (hence less stop dwell time) show up a few days a year, like these.

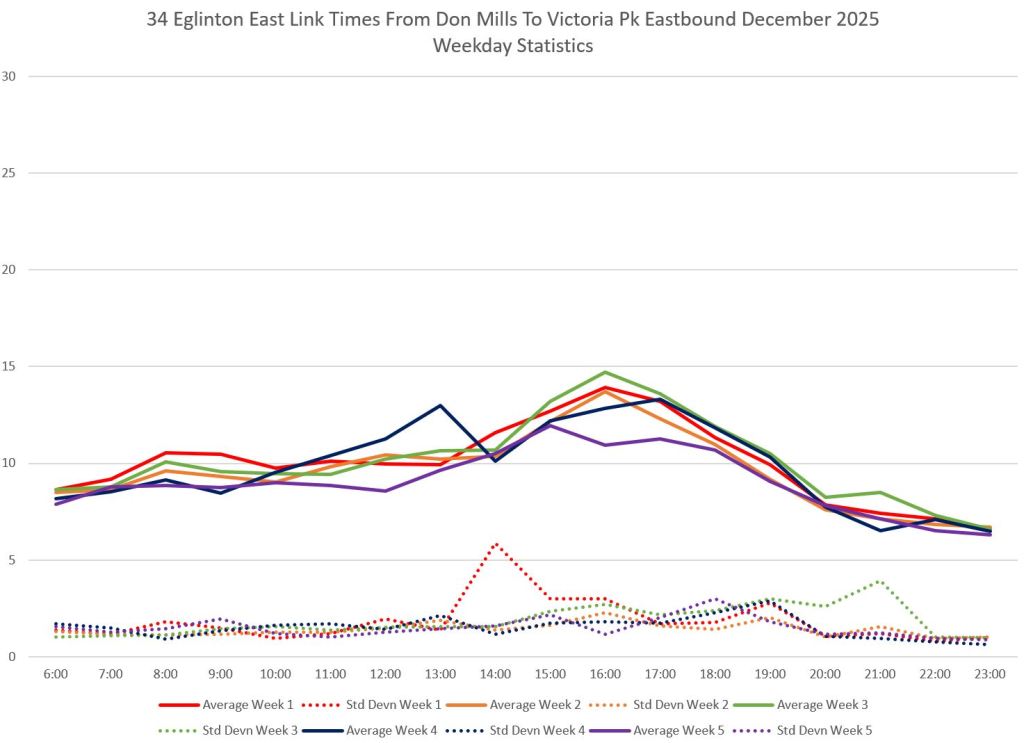
Eastbound from Don Mills to Kennedy
Weekly travel time averages from Don Mills to Kennedy are generally higher than for westbound trips topping out in the PM peak.
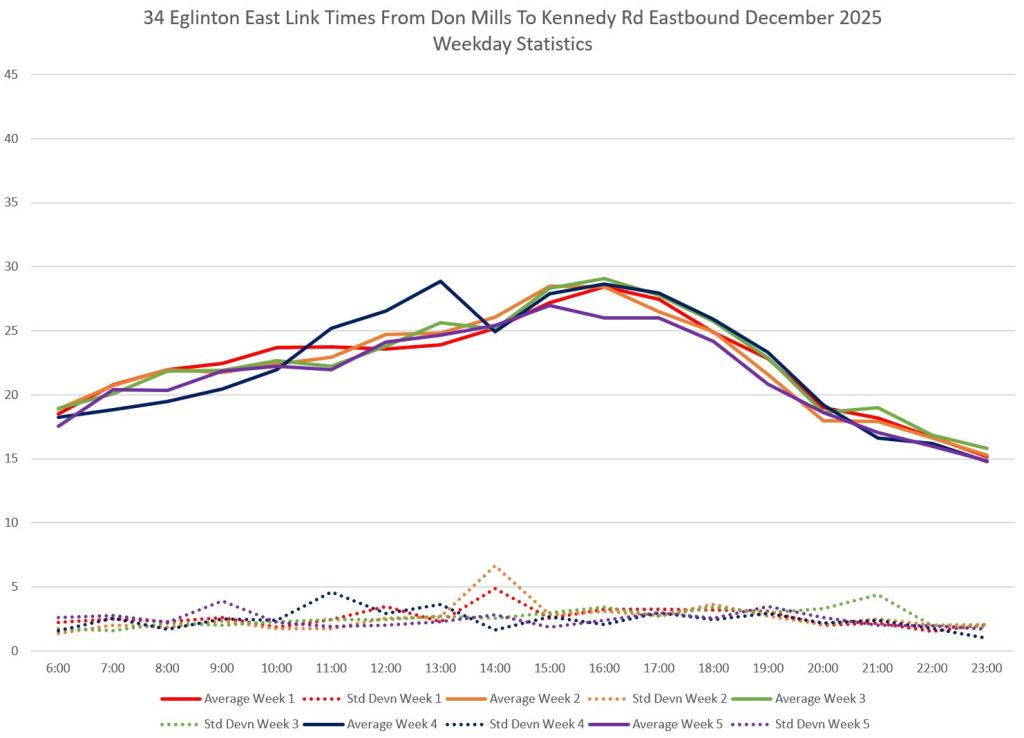
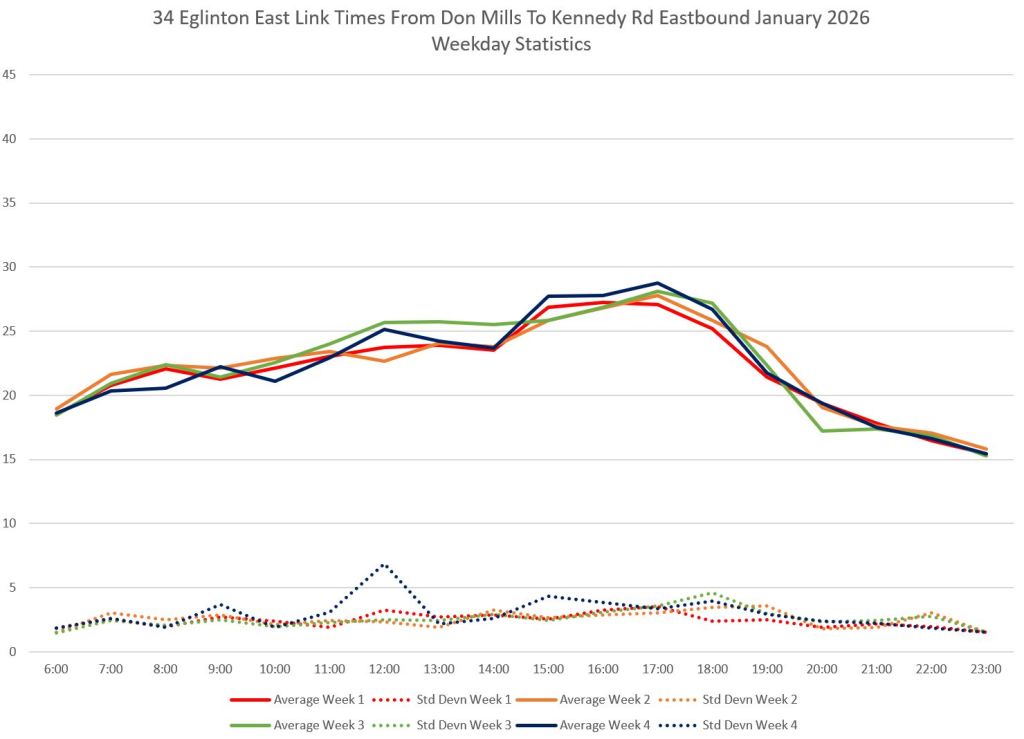
The three detailed charts below show the scatter in travel time values, again notably high in the PM peak corresponding to the standard deviation values in the charts above.
As with the westbound data, Christmas and New Year’s days show the fastest and most consistent travel times.
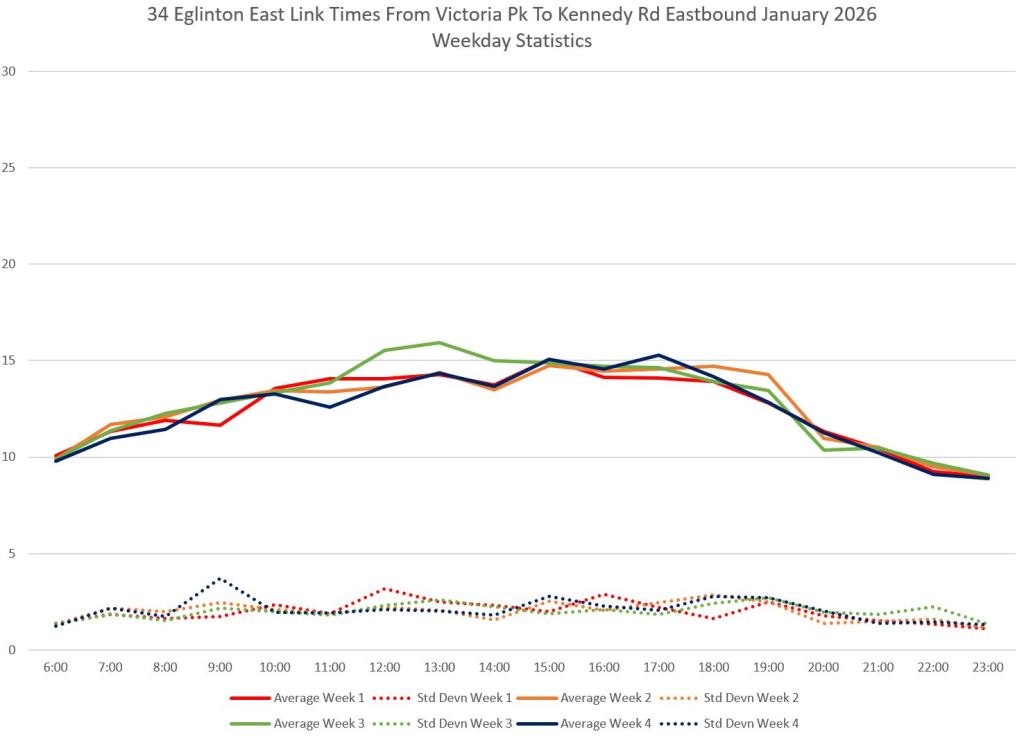
Kennedy to Victoria Park
Westbound
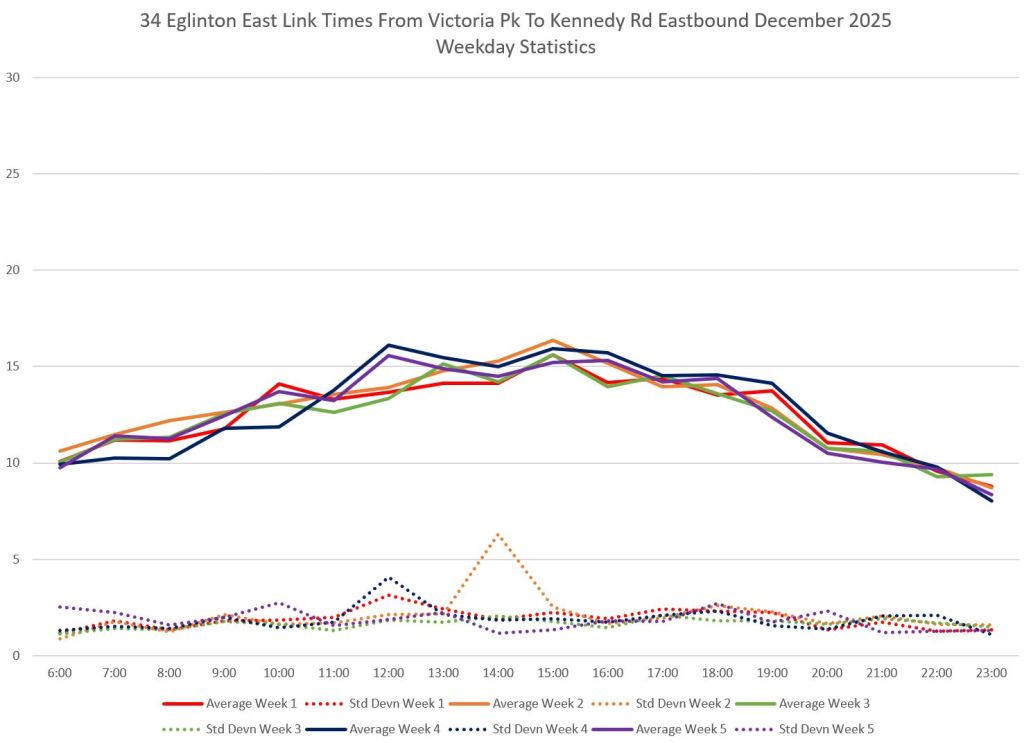
The character of Eglinton Avenue is different east and west of Victoria Park. The eastern section has closer stops, more traffic signals, and fewer opportunities for speedy operation.
Note that the peak travel times vary both by direction and location. The eastern section peaks in the early afternoon, while the western section peaks in the “traditional” hours of 4-5pm.
Putting this another way, the opportunity for the LRT to better the bus travel times is not uniform because at some times, locations and directions, the buses do not experience extra delay from traffic or stop service.
Eastbound
Victoria Park to Don Mills
Westbound
Eastbound
Traffic Signals in the Corridor
There are 14 traffic signals along the LRT corridor from Ionview to the west side of the Don Valley Parkway, although there are only 9 LRT stations. A saving of ten seconds, on average, at these through Transit Signal Priority would reduce trips by 2’20”, a fifteen second saving would reduce trips by 3’30”. Whether this can actually be achieved remains to be seen. An important issue in bus to LRT comparisons is the degree to which the LRT on its own lanes will be isolated from peak period congestion that shows up for bus travel, particularly in the PM peak. There is also the question of whether the top speed for trains will be raised in this section of the route, and how much that would be constrained by stop spacing.
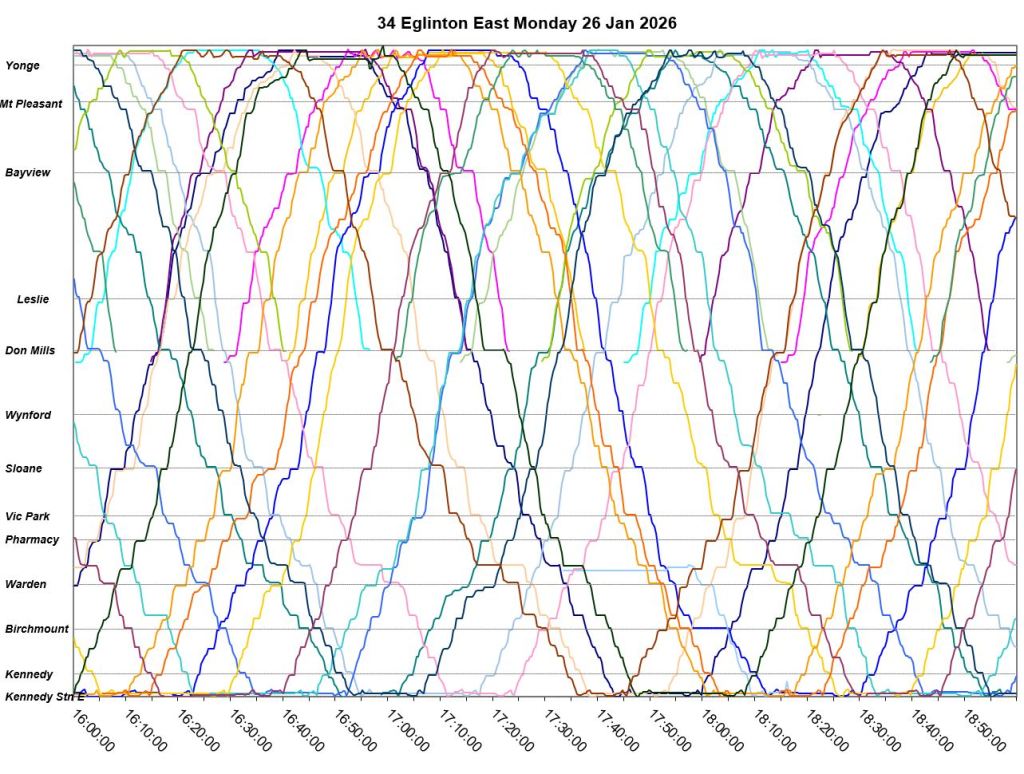
Detailed Trip Profiles
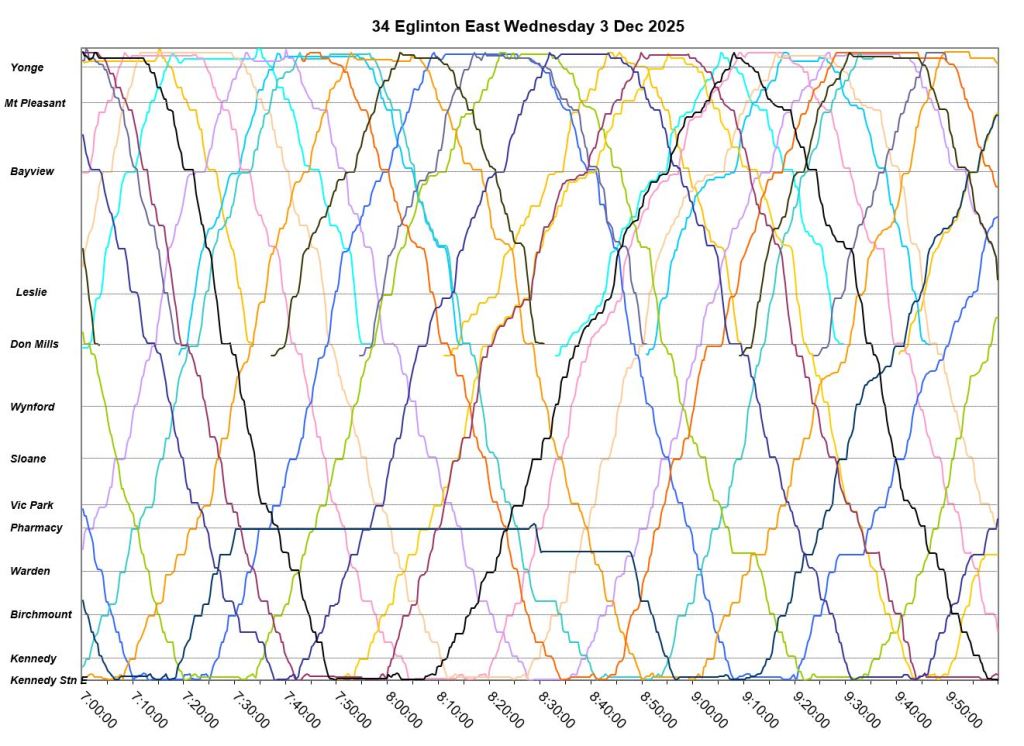
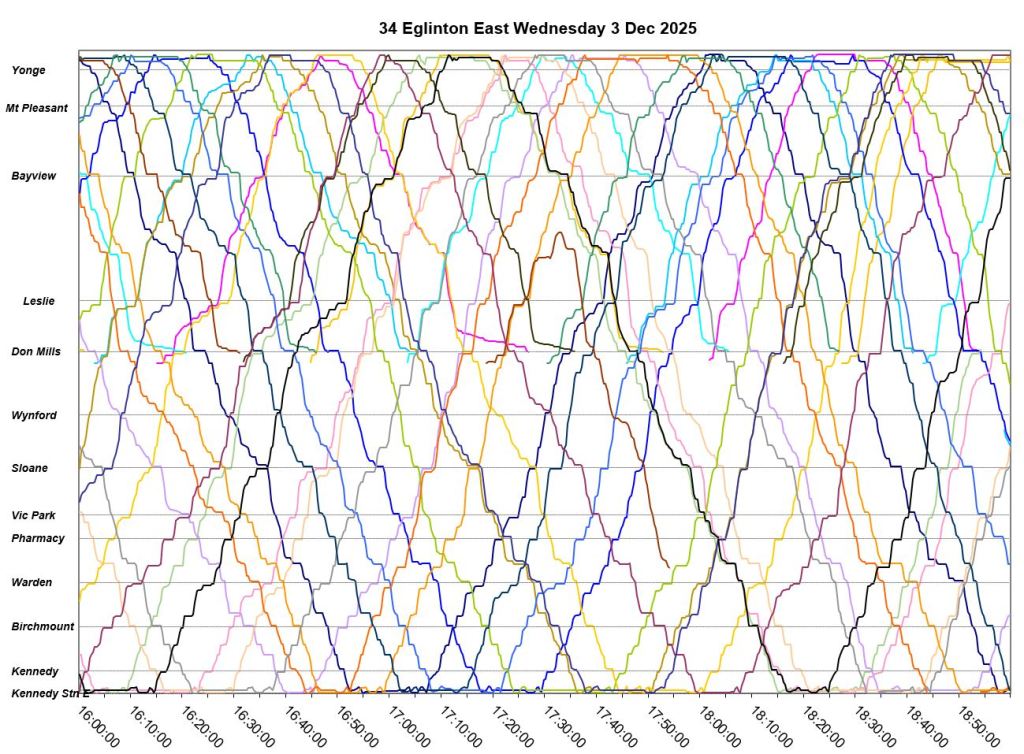
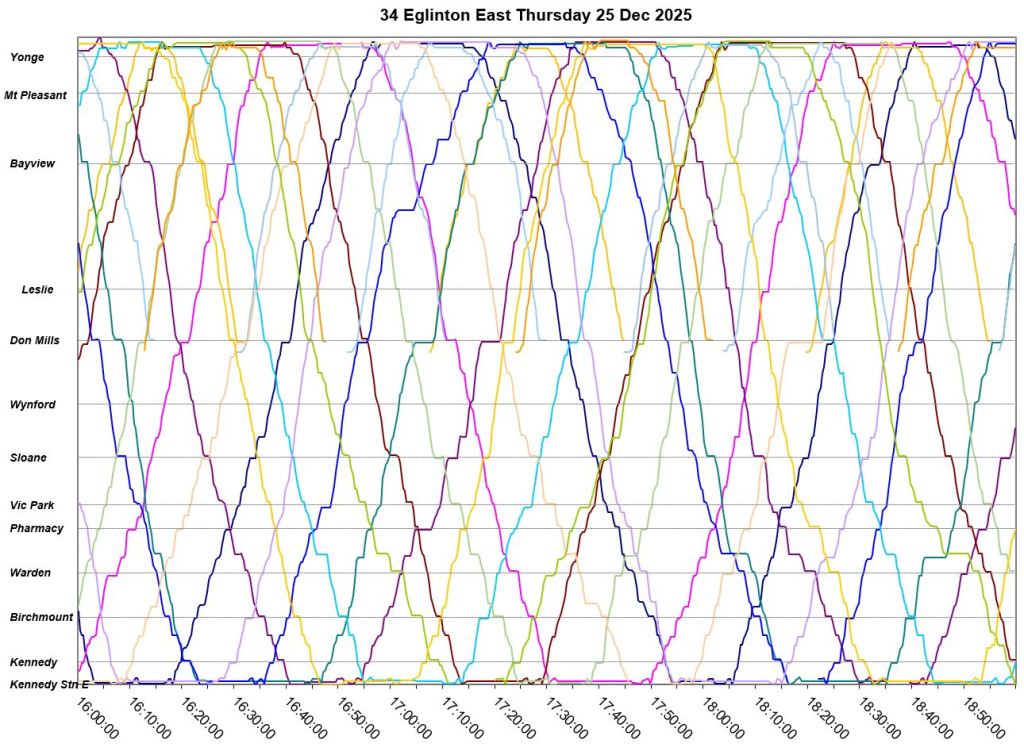
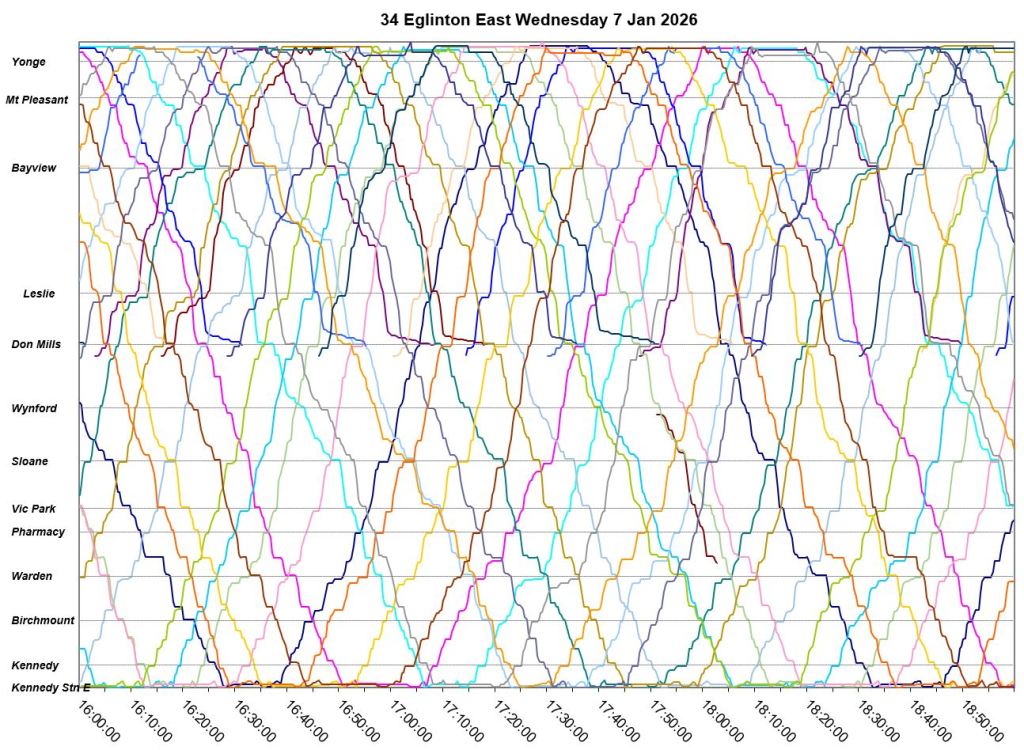
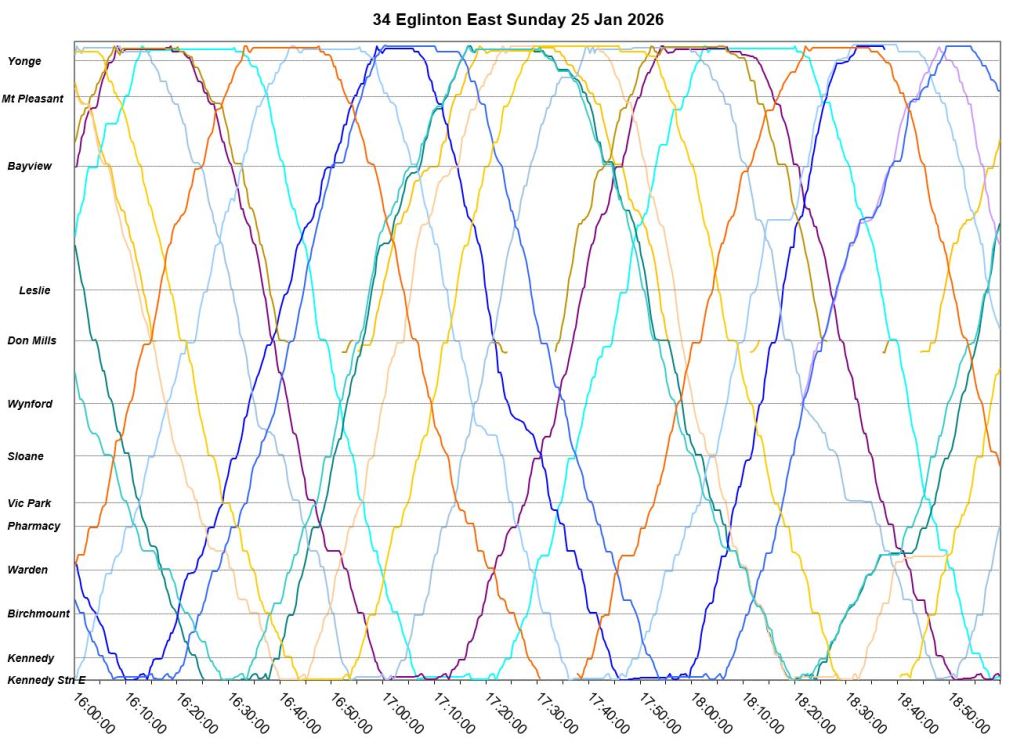
The charts in this section show the movement of buses along 34 Eglinton East on selected days.
The format of these charts will be familiar to regular readers, but here is a quick tutorial:
- Each line represents one bus.
- The vertical axis is distance with Kennedy Station at the bottom (east) and Eglinton Station at the top (west).
- Horizontal lines mark the major streets and their location is proportional to their distance from Kennedy.
- As each bus moves back and forth on the route, it traces a zig-zag line moving up (east to west) and down (west to east). The slope of a line indicates the vehicle’s speed with more vertical lines representing faster vehicles. Congested locations and time are easily spotted by a change in slope. Horzontal segments show a bus that is stopped.
- The space between lines shows the headway between buses. Closely spaced lines show bunching while widely spaced lines are gaps. Note that the 34C Flemingdon Park buses vanish east of Don Mills, and they were not well-blended with the through 34A service to Kennedy Station.
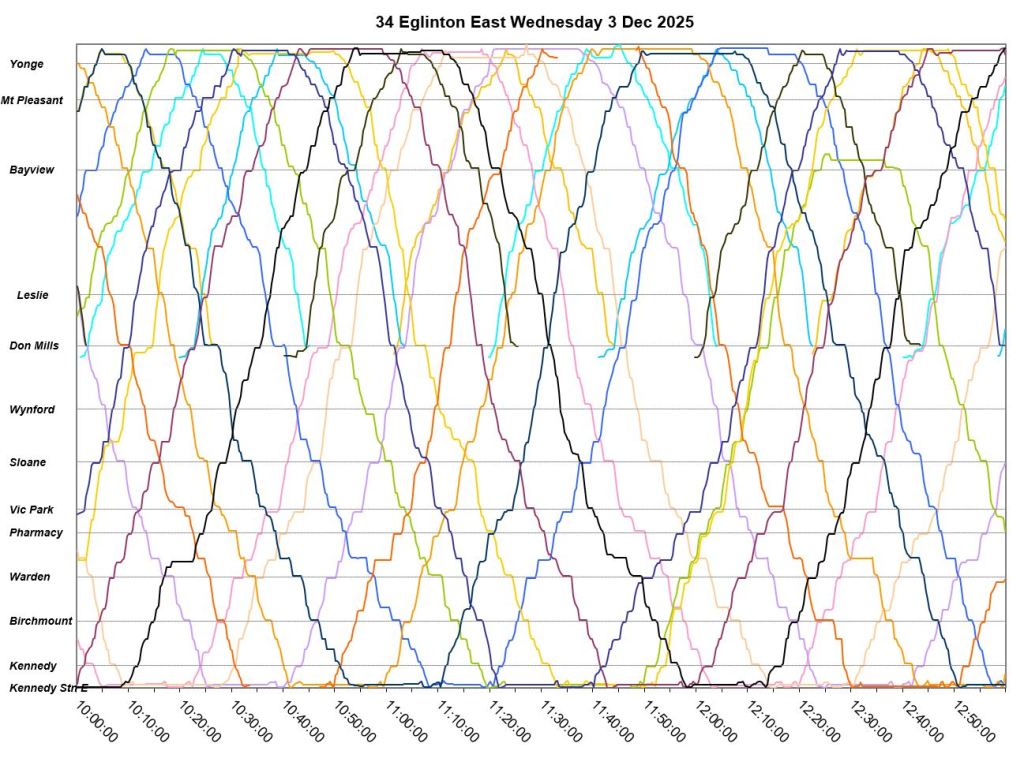
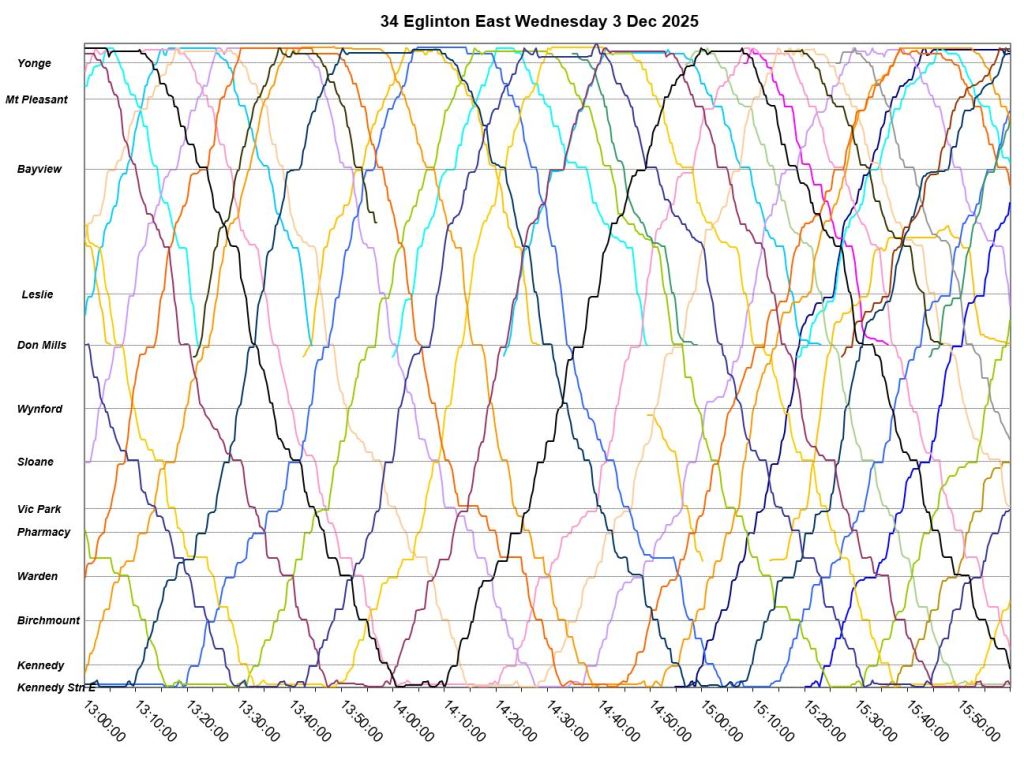
Wednesday, December 3, 2025
December 3 predates the first major snowstorm of the season and shows a fairly typical midweek day. Note that although there are locations where buses hold for some time such as at Lebovic (between Pharmacy and Warden) for crew changes, there are few examples of congestion effects on the line between Don Mills and Kennedy.
By contrast there are visible changes in speed (the slope of lines) westbound approaching Bayview, eastbound to Laird (between Bayview and Leslie), and westbound to Leslie. There is also some queuing for the 34C buses to make a left turn eastbound at Don Mills.
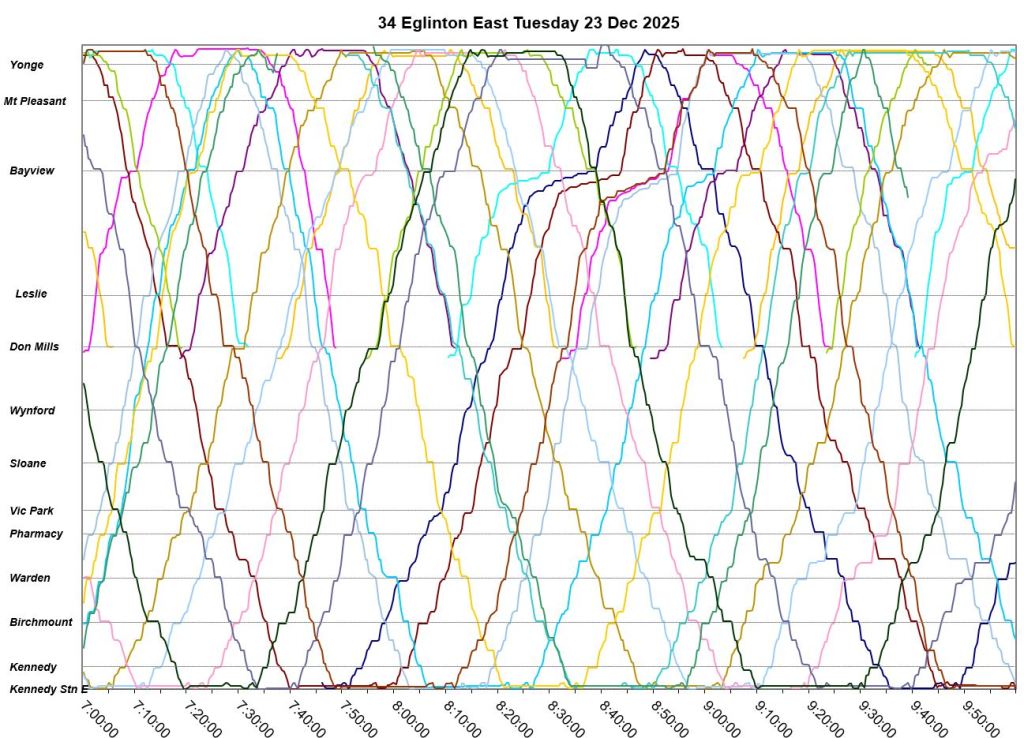
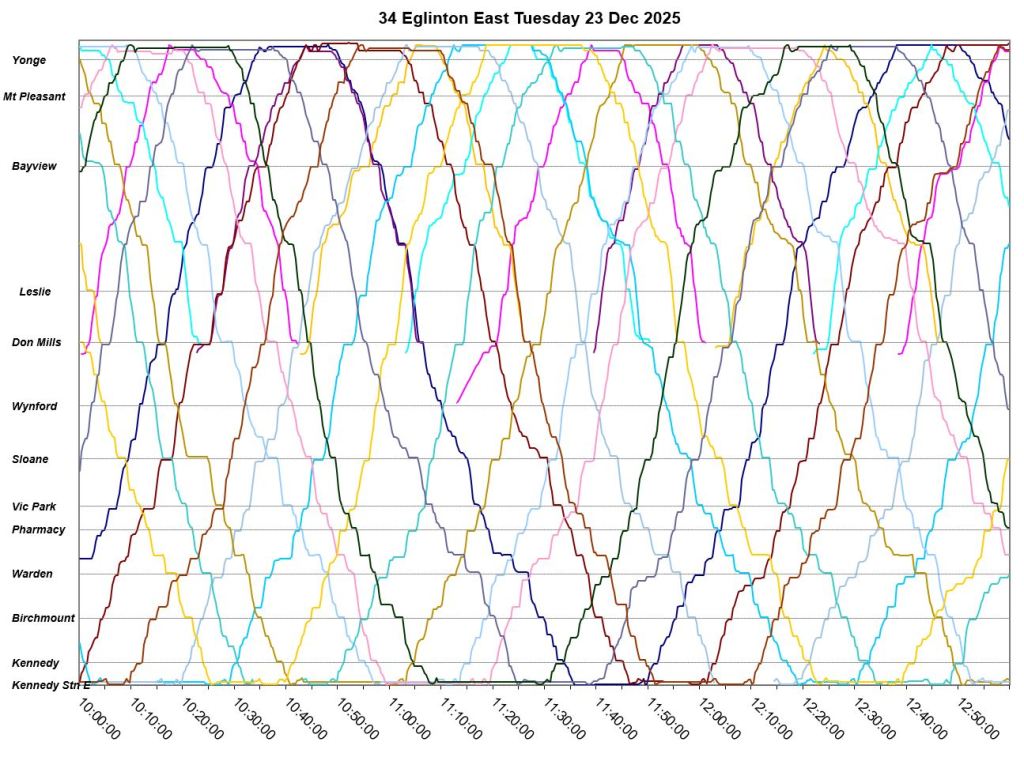
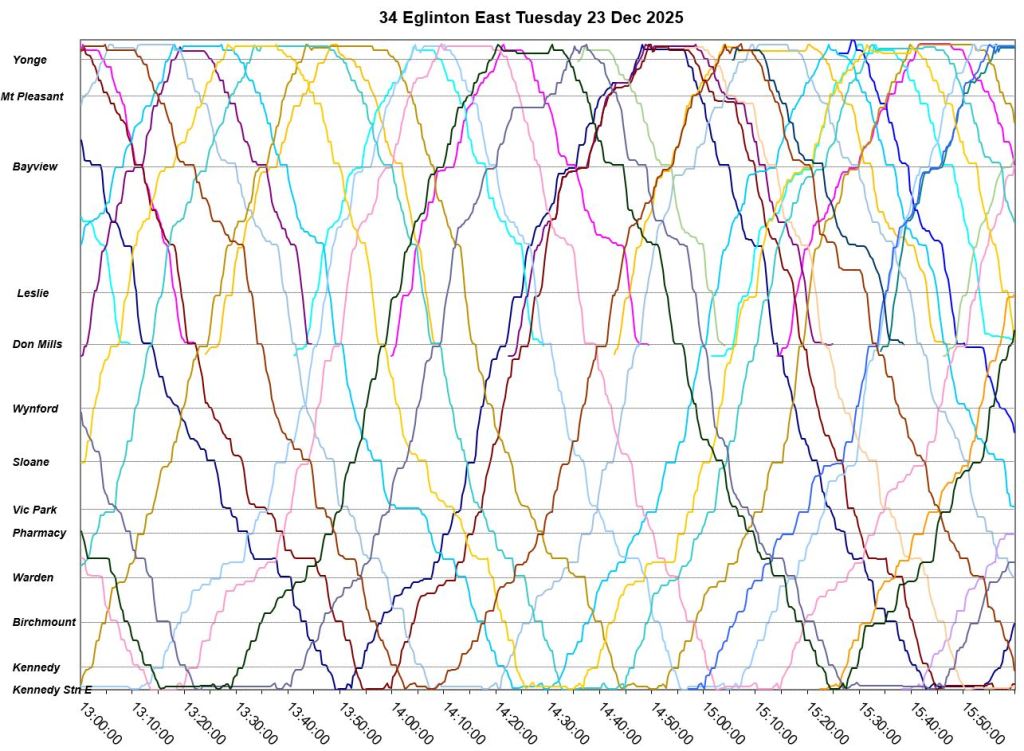
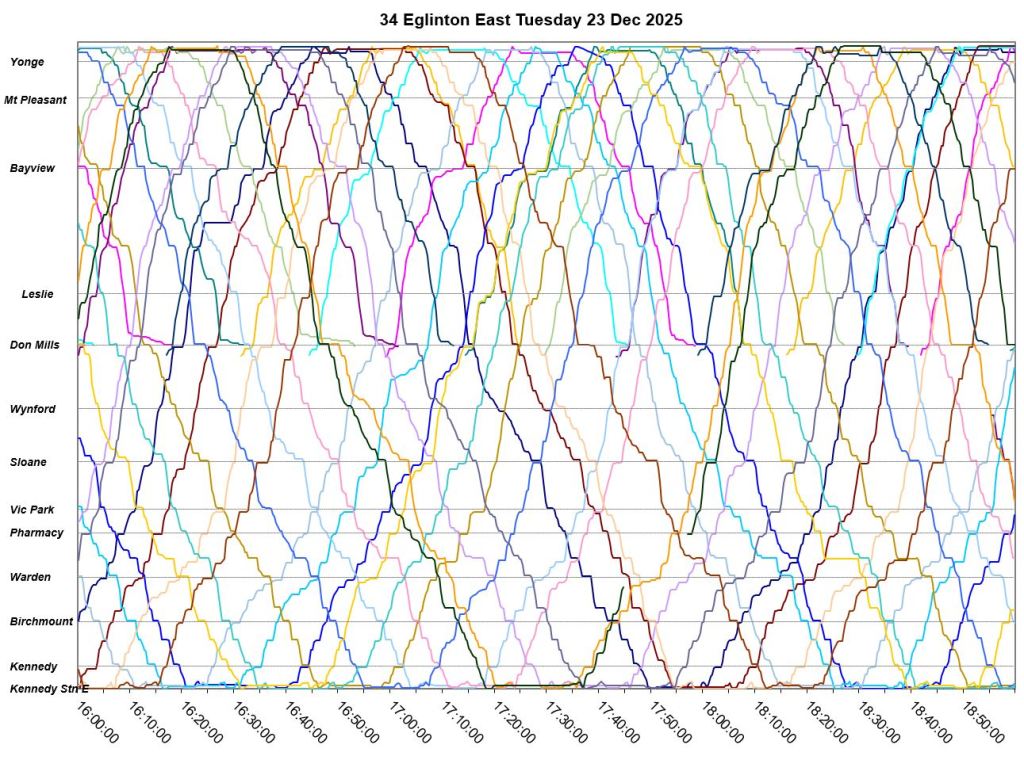
Tuesday, December 23, 2025
There were 10cm of snow on December 22-23, and the effect shows up with more congestion and slower travel times on various parts of the route. Note that this is not uniform over the day. Service remains fairly well spaced.
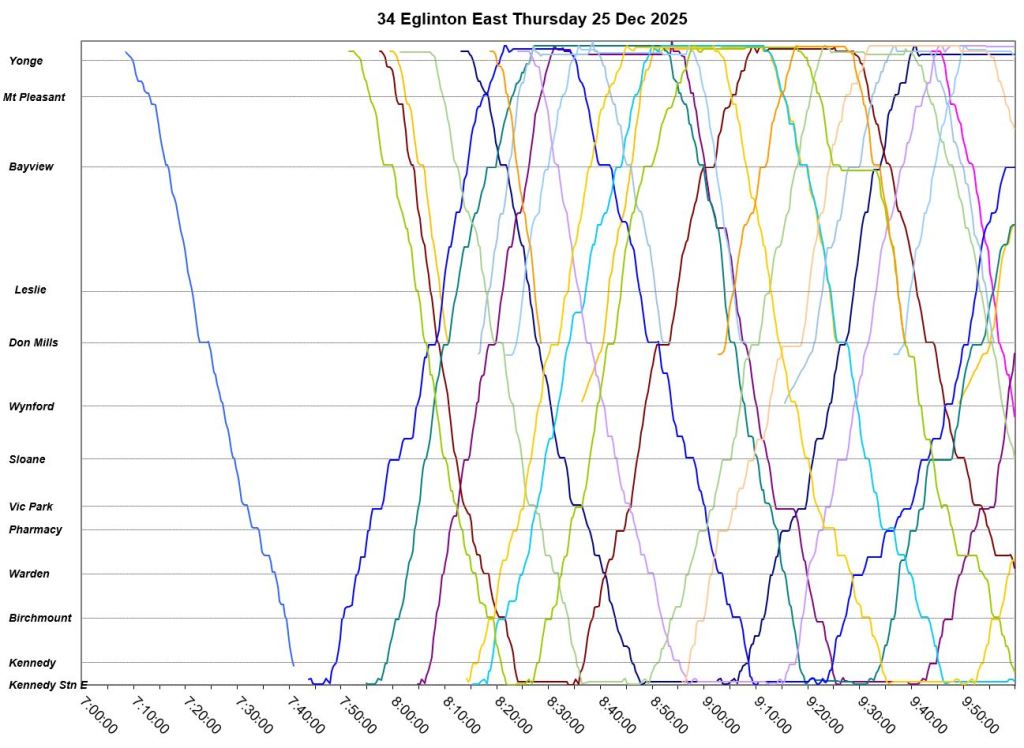
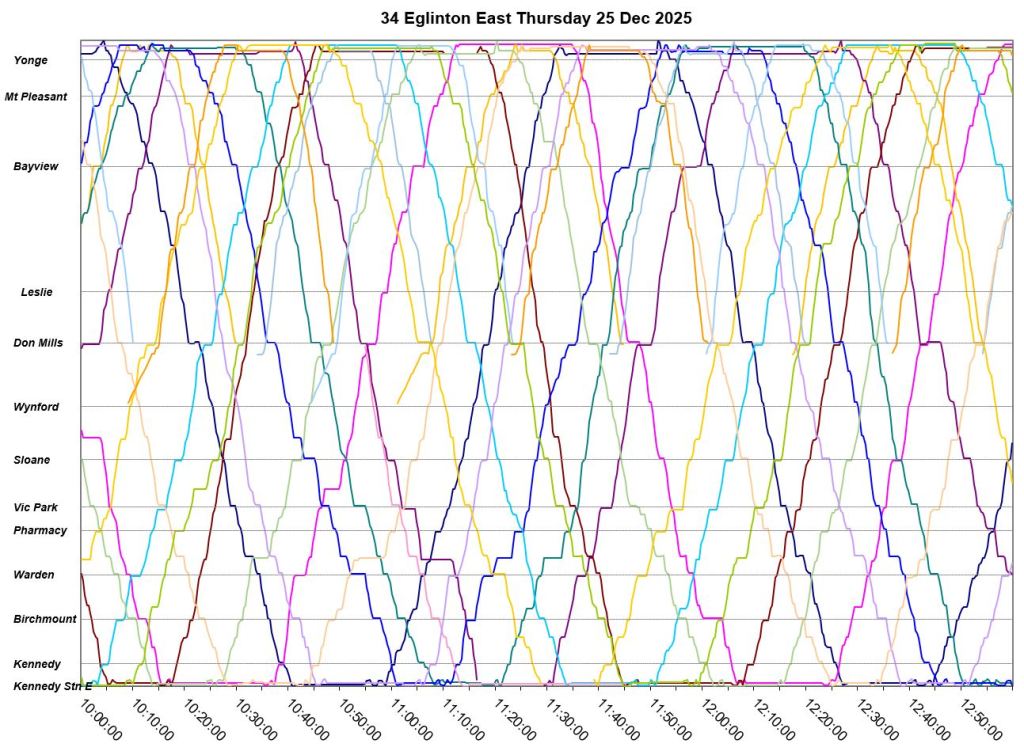
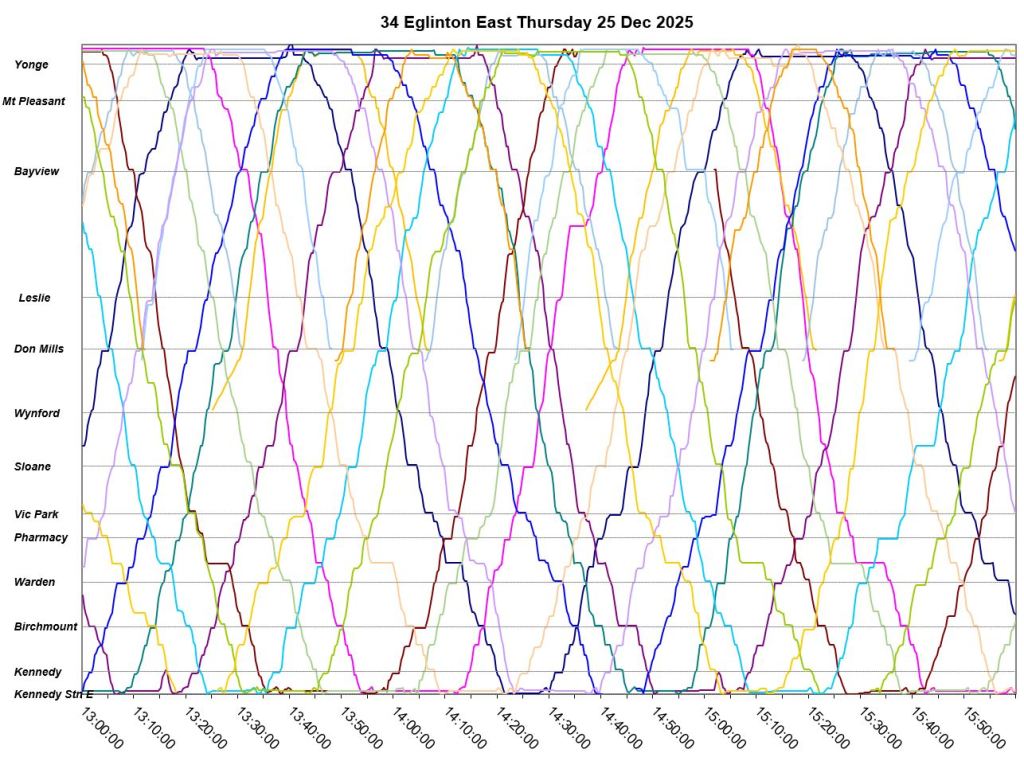
Thursday, December 25, 2025
Christmas Day is generally a “best case” example of travel times and speeds. Note that the lines stay quite regular in slope with no signs of congestion, and the time spent stopped at major intersections is generally lower too.
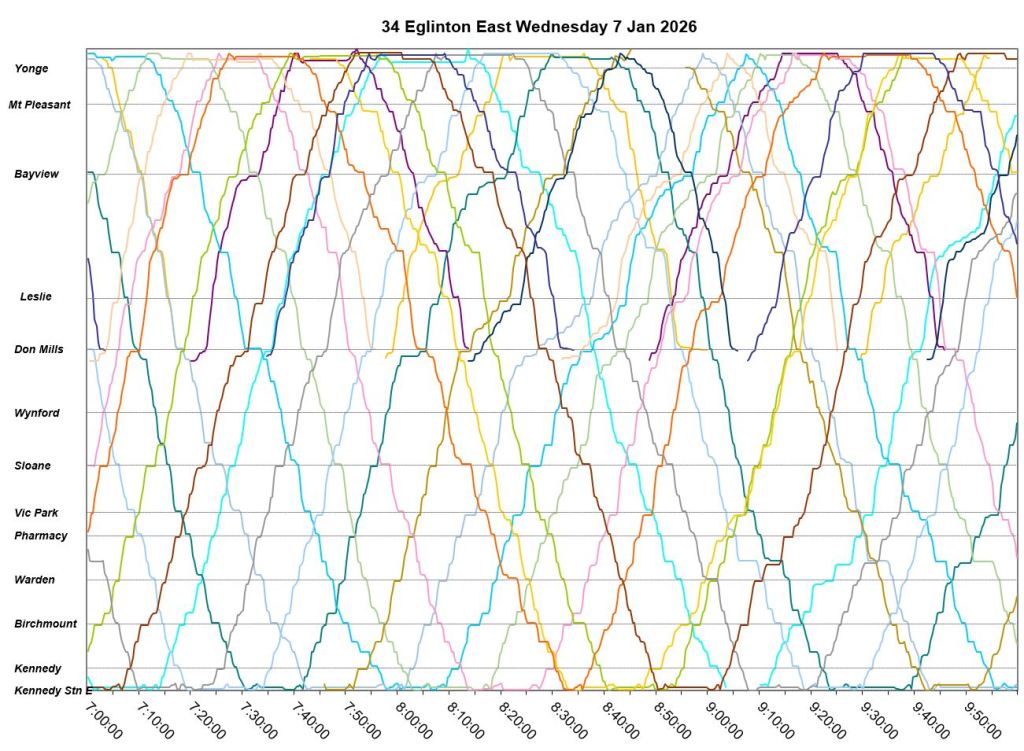
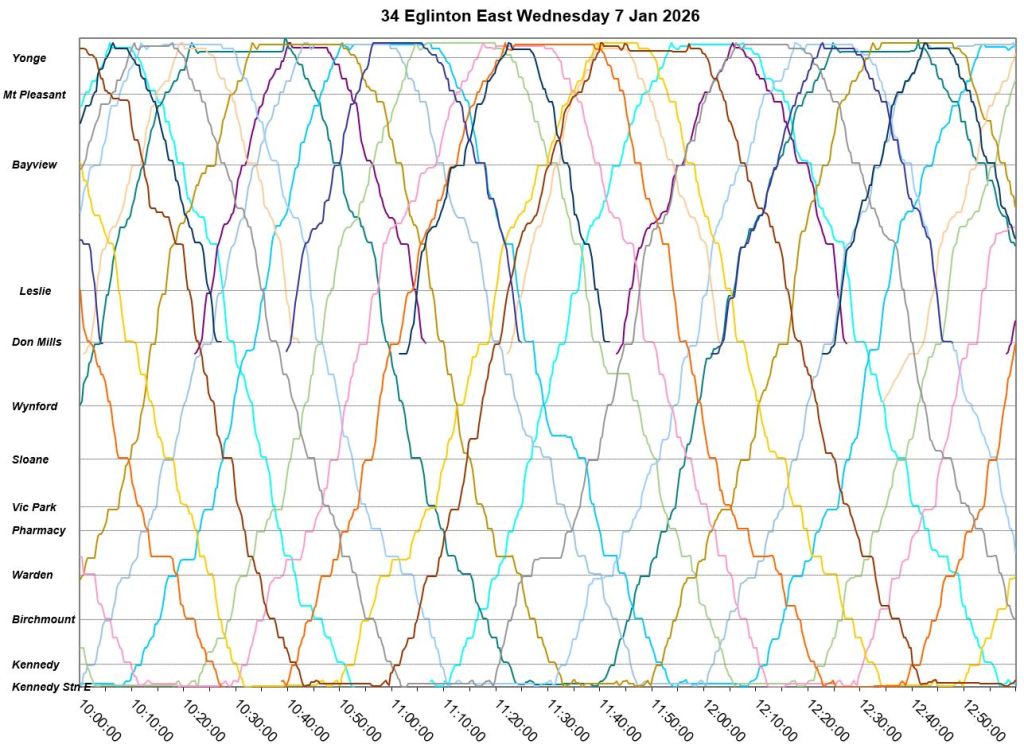
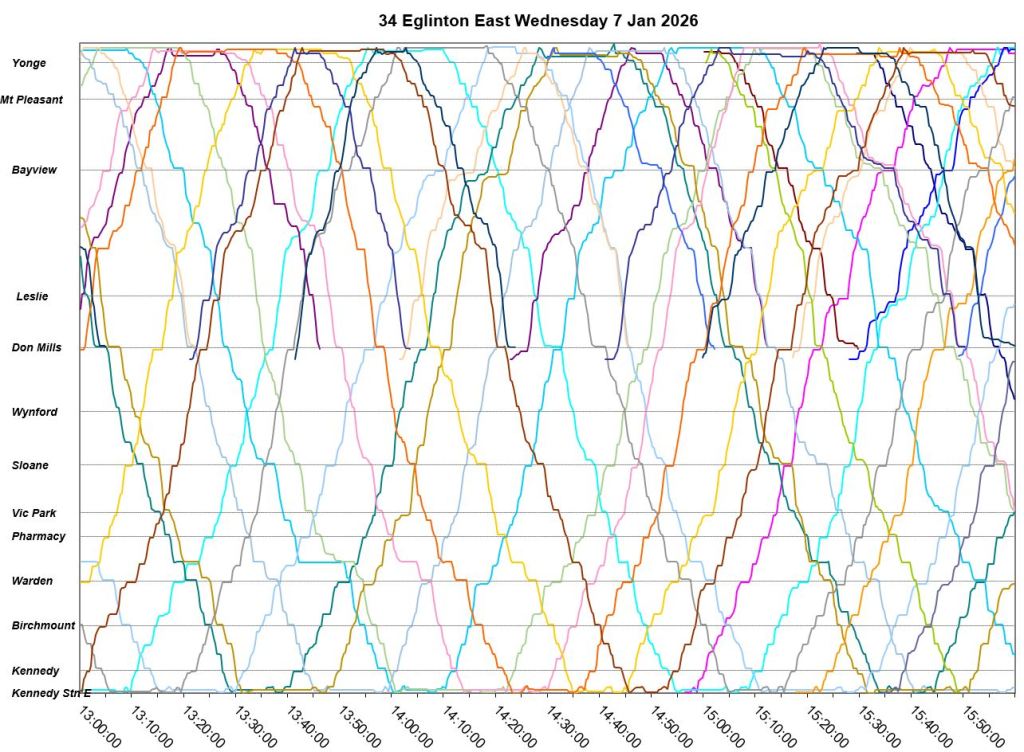
Wednesday, January 7, 2026
January 7 was just before the first of three major snowfalls. There is little sign of congestion, although travel speeds are a bit slower in the PM peak.
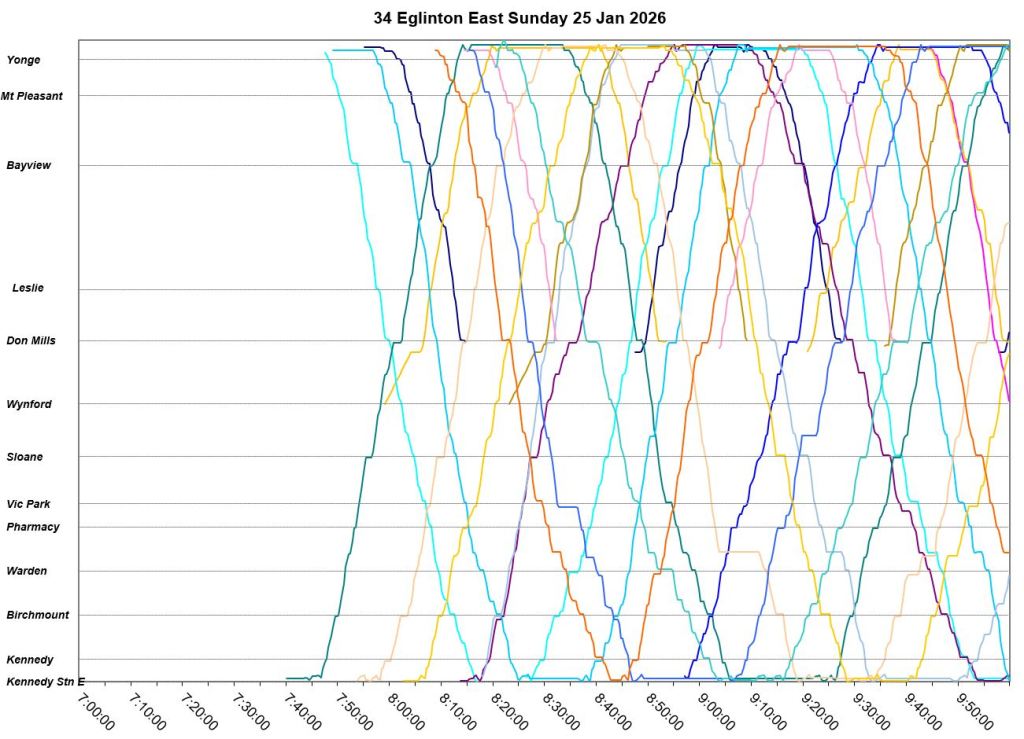
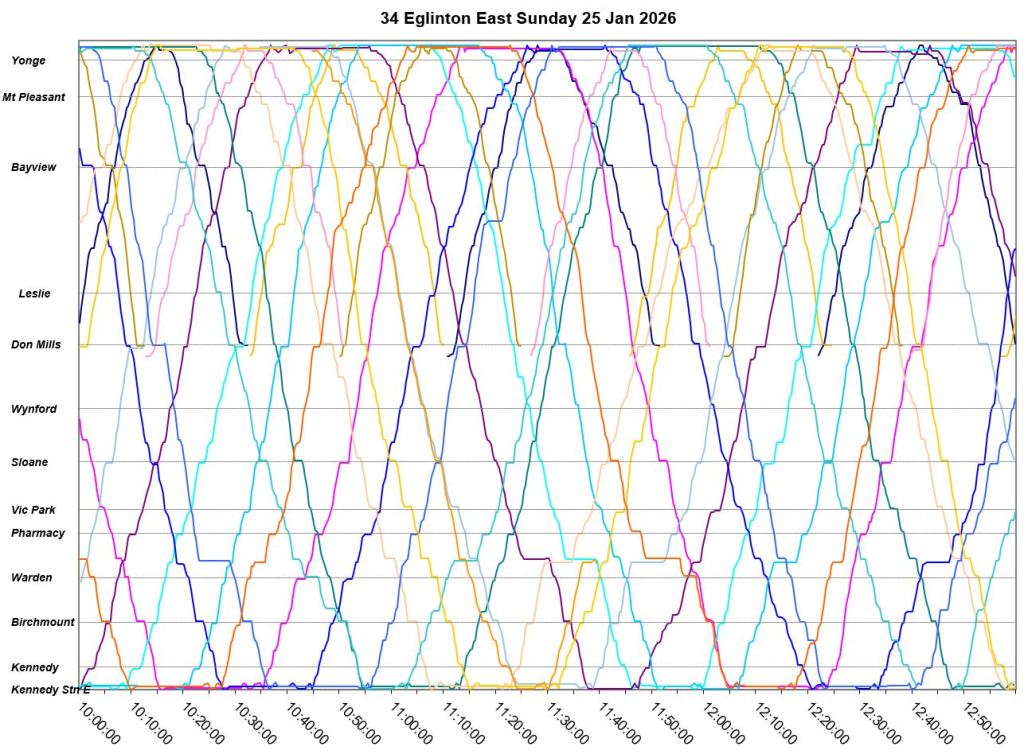
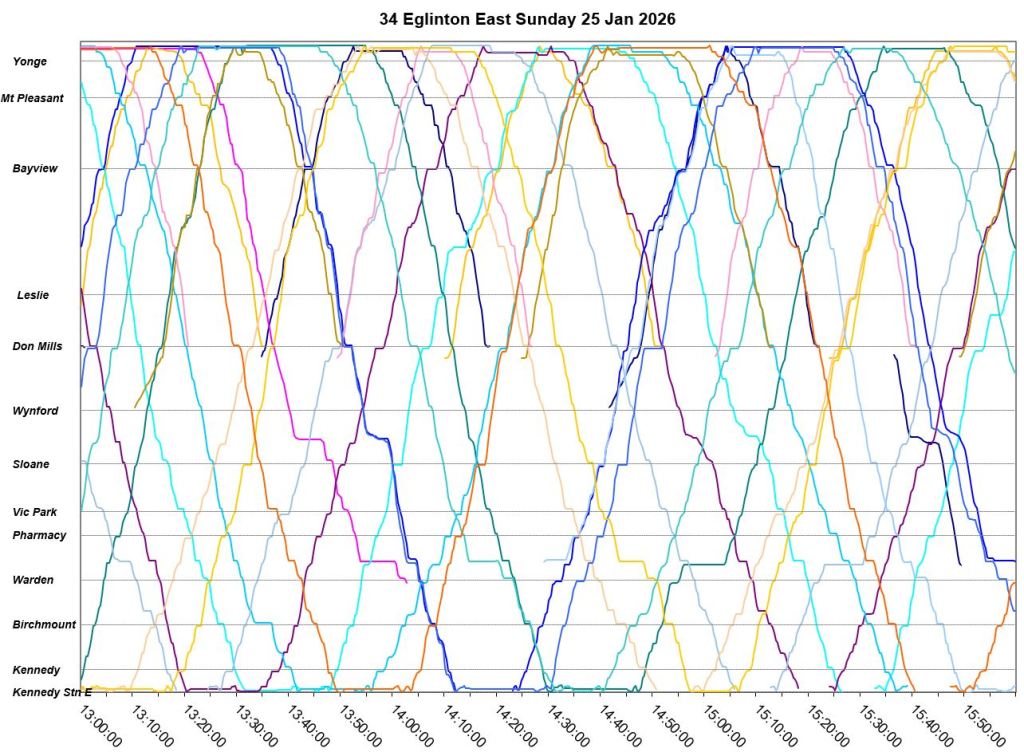
Tuesday, January 25, 2026
January 26 followed the record snowfall, and some of its effects are visible in the service chart although this is primarily an issue of bunching and gaps rather than an overall slowdown of service. One easy way to see that the service was generally able to keep to schedule is the length of time buses spend at Eglinton and Kennedy Stations (horizontal lines at the top and bottom of the charts)
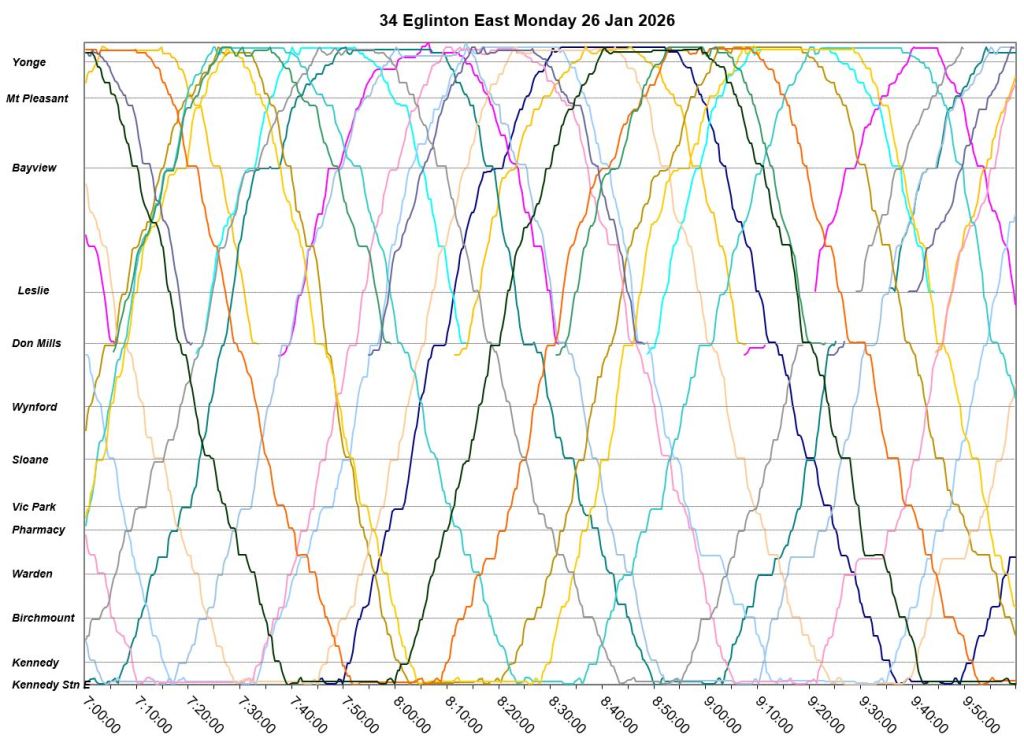
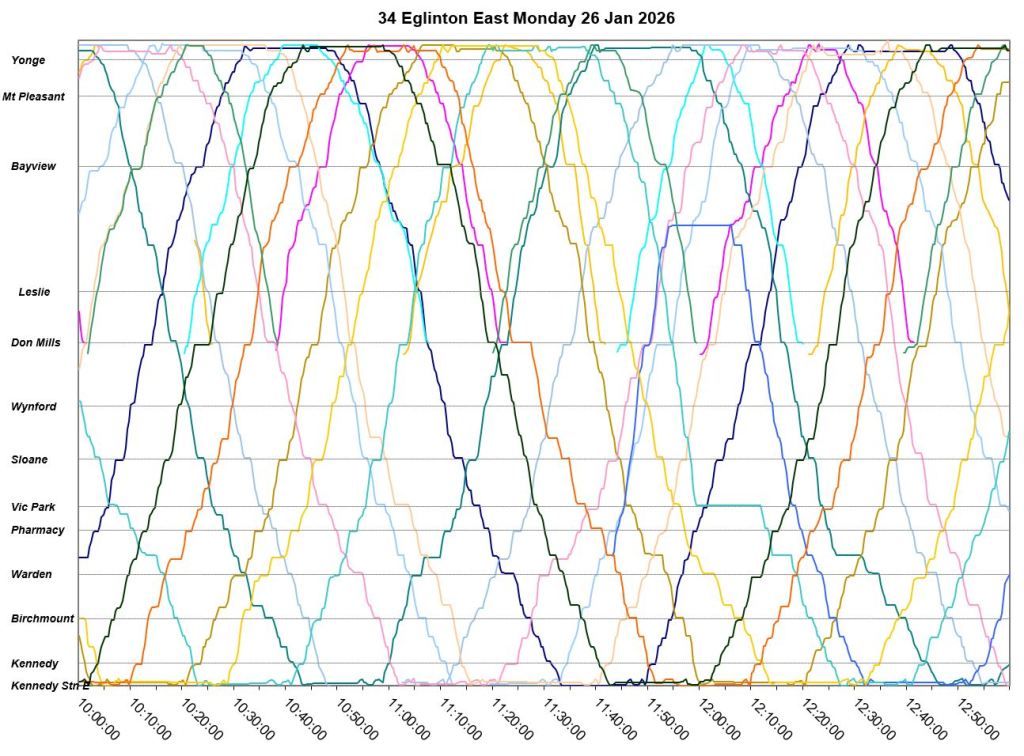
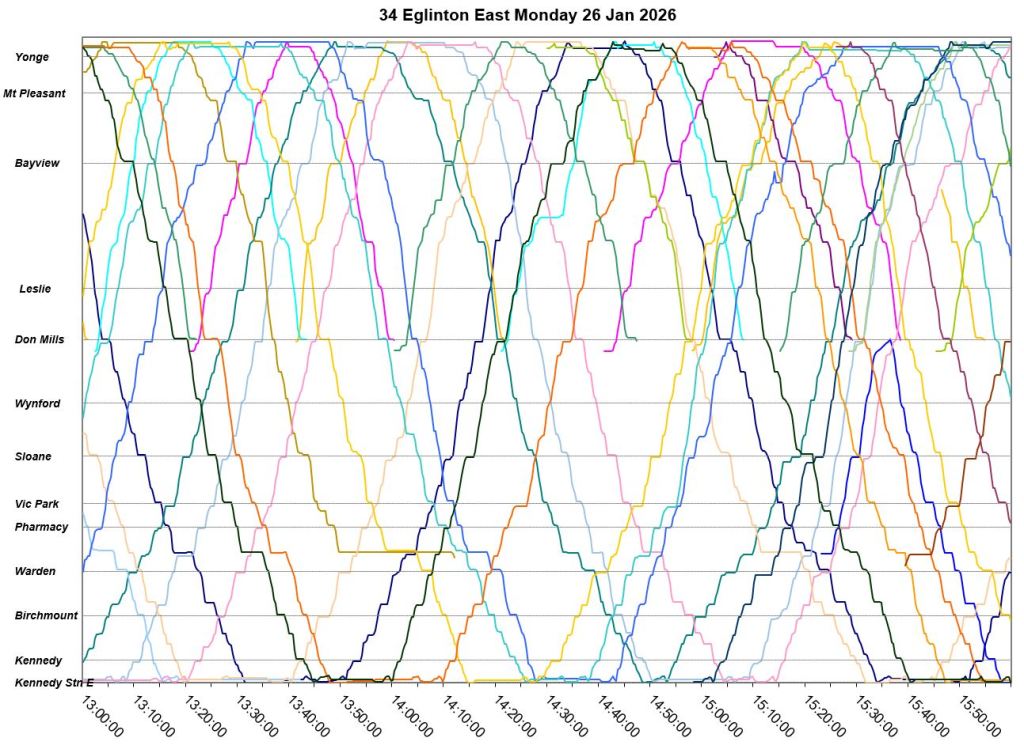
Wednesday, January 26, 2026
Two days after the storm, the service shows fewer bunched trips and gaps than the day before.
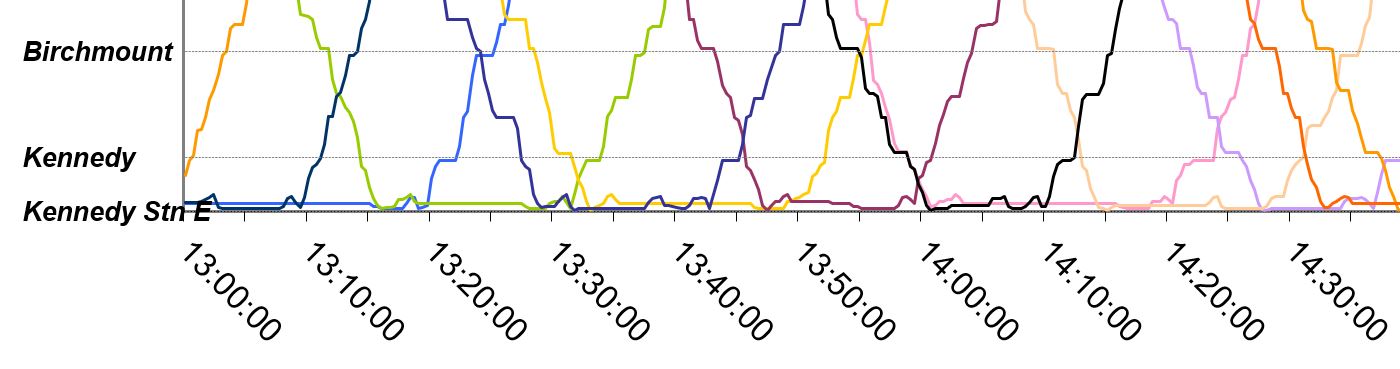
Bus Access Times at Kennedy Station
A bus entering Kennedy Station must drive onto the bus roadway south of Eglinton, proceed over to the east side of the station, and then loop back to reach the route’s platform. Similarly, on leaving the station, a bus must loop around first to the east to cross to the north side bus roadway and then come out onto Eglinton.
The chart below is a snippet from December 3, 2025 between 1:00 and 2:30pm. The position of each line representing a bus is based on the east-west position with the east side of Kennedy Station being at “zero” (the horizontal axis). The reversals of direction as buses loop around show as small humps in each line.
For example, the green line crossing Kennedy eastbound at about 13:14 is a bus that does not come to rest at a platform until almost 5 minutes later. There is a similar time lapse between a bus that begins to depart at 13:08 (dark blue) and crosses Kennedy three minutes later.
Any comparison of travel times for trips originating or ending at Kennedy must allow for the longer bus access path and time between Kennedy Road and the bus platform as compared to the LRT which has a straight run out of the terminal and no traffic signal delay.
This is part of a rider’s journey, but my charts include only the bus travel time west of Kennedy to avoid the effect of the roundabout bus path to serve the terminal.

On Friday night, we took the LRT from Cedarvale Stn to Kennedy Stn and it took 44 minutes. Unfortunately we waited about 25 minutes for it. We tapped on around 10:27 pm and didn’t get on the train until 10:53 pm. Meanwhile there were 3 trains going westbound in that time. How is there bunching/a huge gap at night?! No alerts about this. We caught up to a 34 exactly at Aga Khan. From Aga Khan to Kennedy (the entire surface portion), I was tracking the 34 which got to Kennedy Station exactly 10 minutes before our LRT did. They need to make the surface section faster ASAP and fix the gaps. It’ll be just like every other service TTC operates with erratic waits and bunching. We were disappointed.
LikeLike
Austin wrote
I had the same issue last Wednesday midday, but I was heading west, and 3 eastbound LRV’s arrived before the westbound, and then it was crush load. Looks like the bunching is a serious problem and needs to be investigated and corrected.
Steve: Definitely, but, believe it or not, the TTC does not appear to have access to tracking data for Lines 5 and 6, and so it’s impossible to do an analysis to show what is going on, or what improvements might result from changes in sgnalling or operating procedures.
About transit priority on Eglinton (and Finch West): I do not know why (traditionally) left turns get first crack at major intersections in the ‘burbs. But, what if the straight-aheads went first, and then the left turns? Also, where the stop is far-side, the LRV should be able to advance the green (or delay the yellow). Is this not what fire trucks can do?
Steve: Fire trucks just show up with sirens and horns. They do not control the traffic lights in Toronto.
LikeLike
There are some traffic signals close to Fire stations that go all way red when there’s an emergency, and hold there for a while. This allows the responders to get through without dealing with moving traffic.
For some info regarding Fire and Transit signal prioritization, see here.
LikeLike
Comparing a bus and a LRT line would work if the TTC had actual real and strong contingency plans for when an employee doesn’t show up to work for a specific LRT schedule. Meaning more people actually readily available to take over an operator missing.
Given the amount of times I’ve observed services being skipped and riders waiting unreasonable amount of time for streetcars/LRT, it seems no priority is given to them by the TTC for service. Because a bus replacement can always be dispatched. This is one of the biggest operational red flag at the TTC.
LikeLike
Regarding bunching on Lines 5 and 6,
Steve replied:
At this time, due to Transit Control not being in control, it is probably moot – I noticed that there are lots of cross-over tracks. Since the LRV’s are double-ended, would it work to short turn one in front of a delayed vehicle coming the other way? And then have the inserted vehicle operate from the back console all the way to the terminus? Perhaps it might be good to place someone at track level at a few stations to keep an eye on vehicle arrivals, etc., just like they used to do in the good old days.
Steve: They are already short-turning trains when there are problems, and that’s how they triggered so many “switch issues” at various places along Finch, not just at the terminals. For relatively modest disruption (ie two vehicles nominally on a 6 minute headway running as a pair on a 12) short turns won’t do any good because they don’t address the basic issue of having trains properly spaced and a schedule that isn’t so padded that trains are always waiting for their time.
LikeLike