
When the TTC talks about service levels, a common comparison is to the pre-pandemic period. I have reviewed this issue before:
- The Mythology of Service Recovery – November 2024 Update
- The Mythology of Service Recovery [September 2024]
This article presents an update on previous reviews to service levels in January 2026 comparing it both with January 2020, and with November 2024 to show what has changed over the past year. Also reviewed is the evolution of travel times on major routes to show the effect of congestion-related schedule changes from 2020 to 2026.
All headway and travel time data here come from the TTC’s Scheduled Service Summaries. An archive of these files is available on this site here.
The usual citation is the number of vehicle and train hours operated today versus the “before times”. Here are the raw numbers:
| Planned Weekly Hours | Regular Service | Construction | Total |
|---|---|---|---|
| January 2020 | 185,825 | 7,068 | 192,893 |
| January 2026 | 193,662 | 5,234 | 198,896 |
These values can be misleading because the 2026 and 2020 networks are not the same. Moreover, one vehicle hour does not provide as much service to riders today because of slower operation and increased recovery times in the schedules.
From a rider’s point of view what matters is the headway, the time between vehicles.
Although many routes have more frequent service today than in 2020, this is not universal. Riders do not travel on “average” routes, but on those needed for each trip. Their experience could reflect a decline in scheduled service on their routes. This is compounded by reliability and the perennial problems of bunching and gapping.
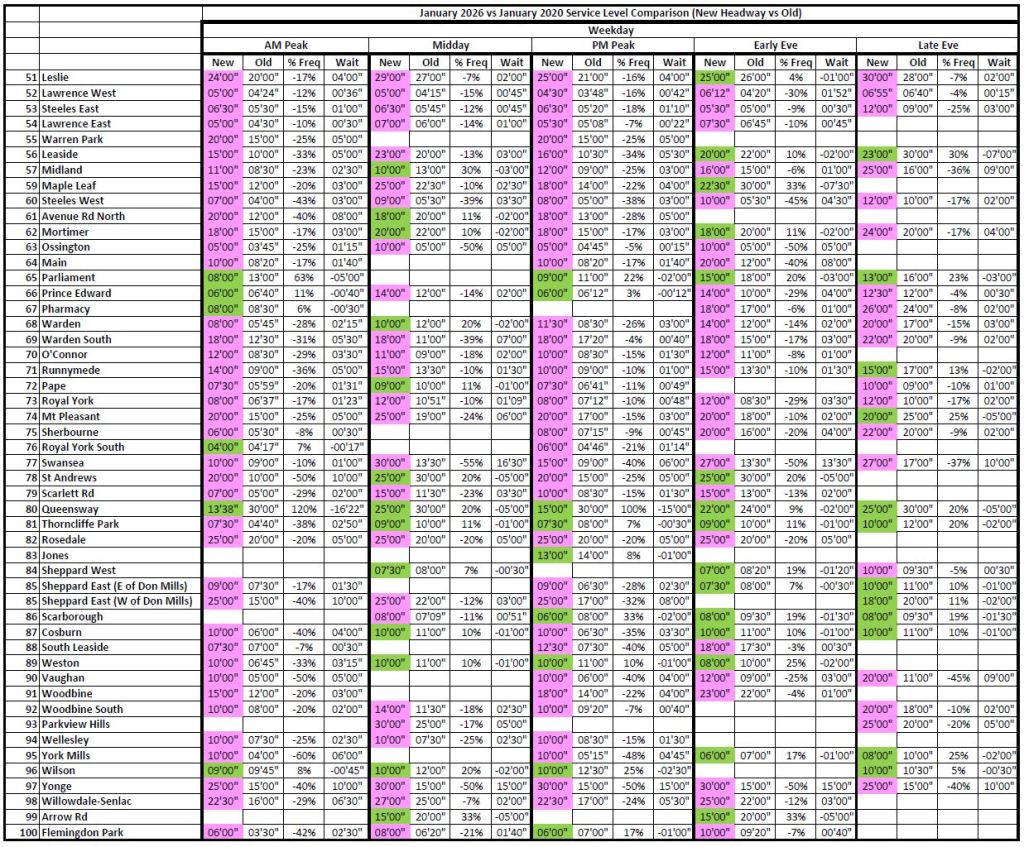
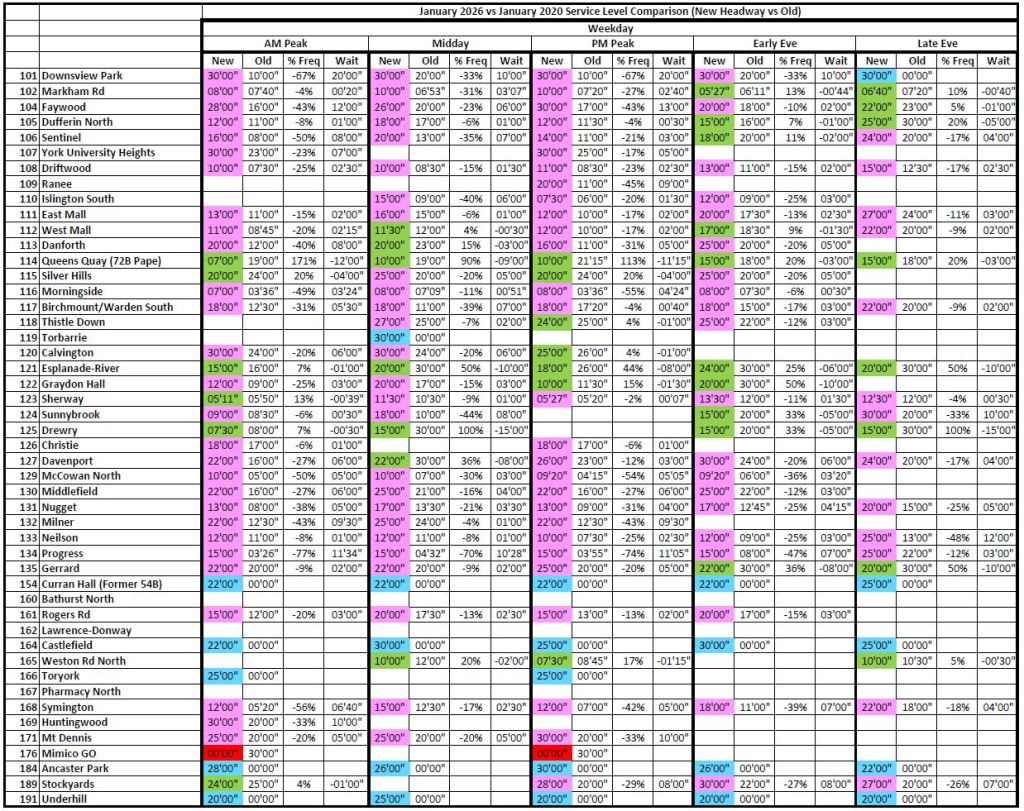
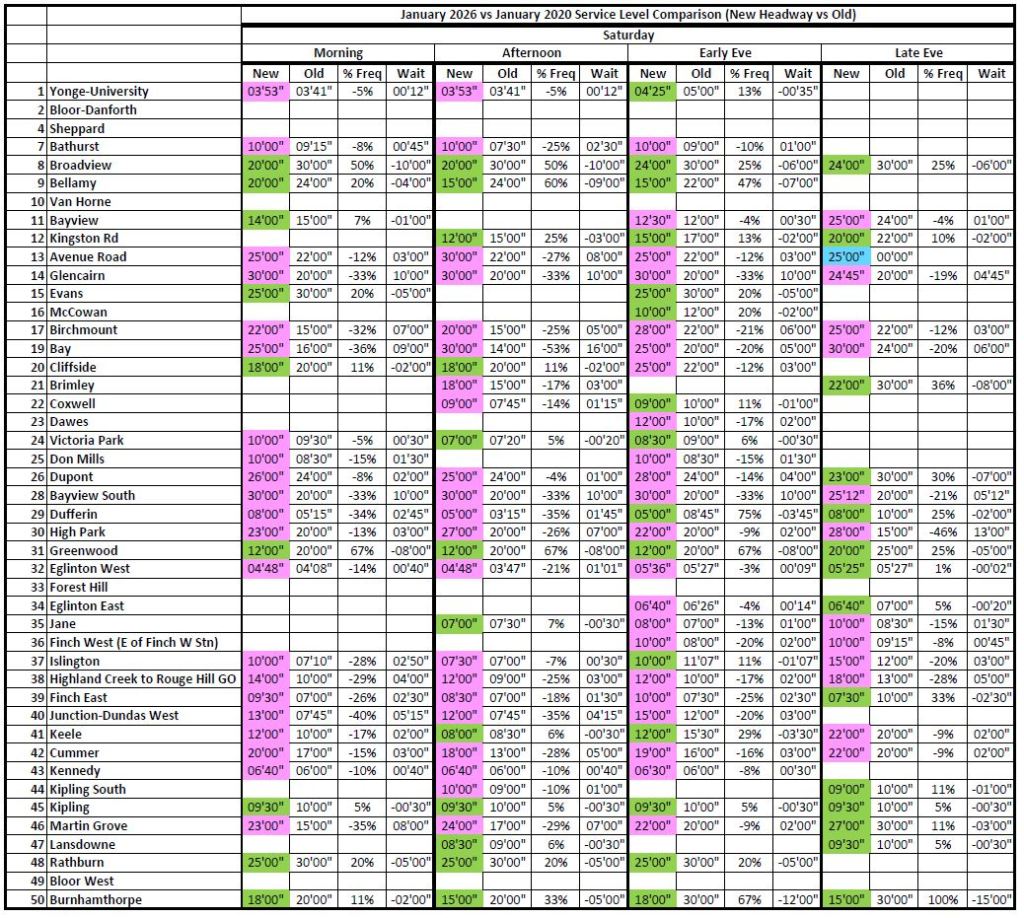
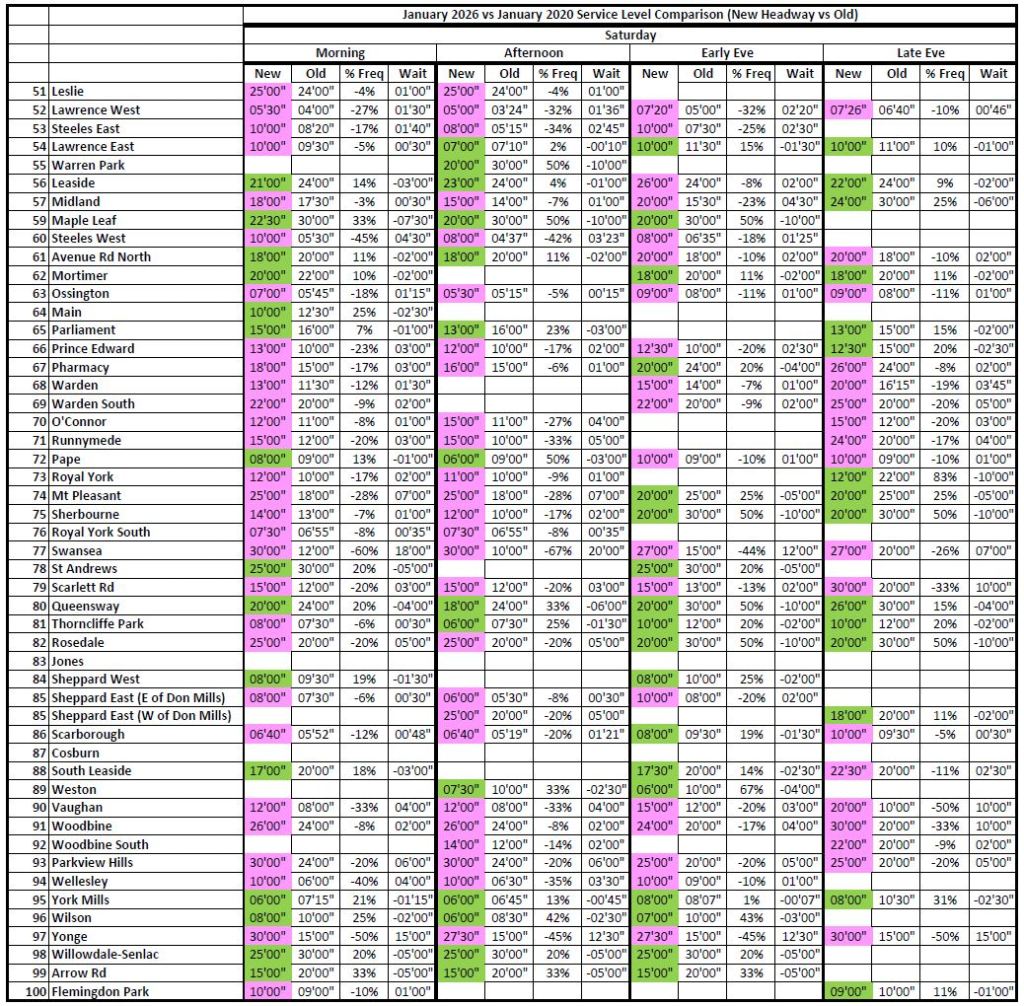
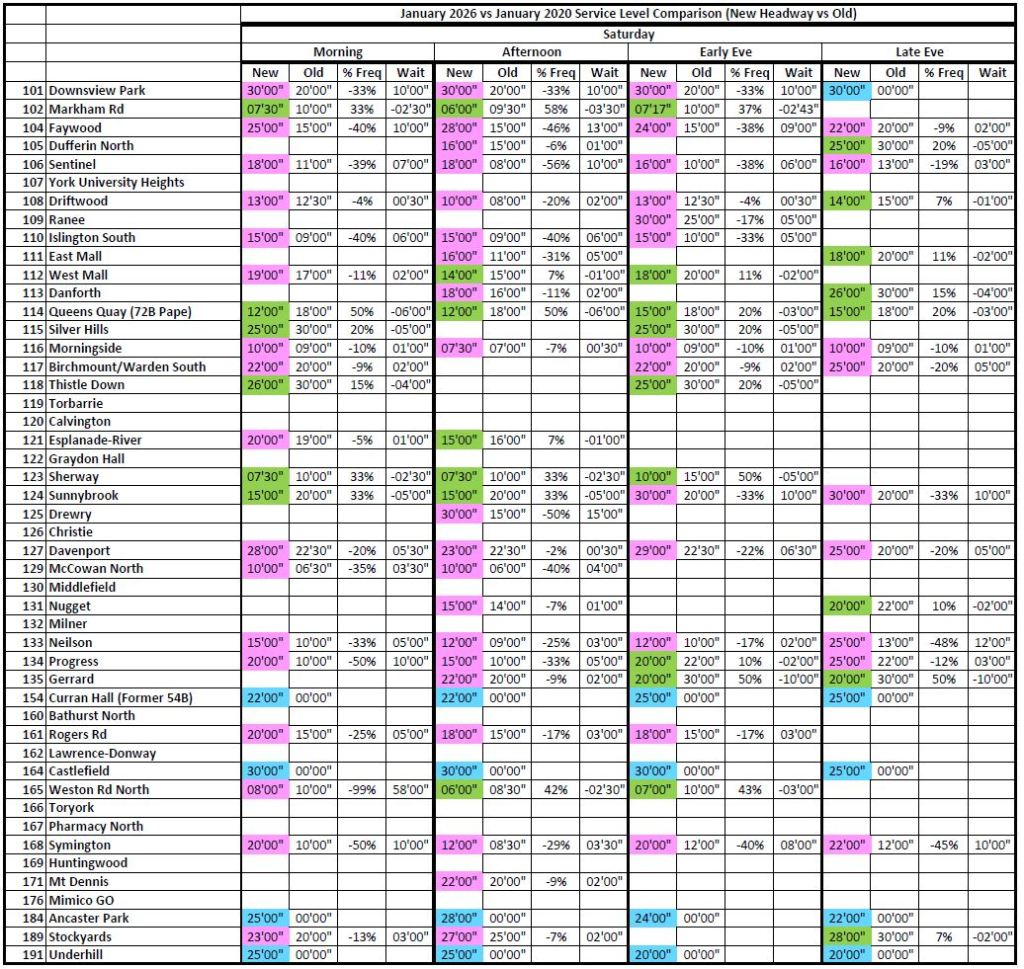
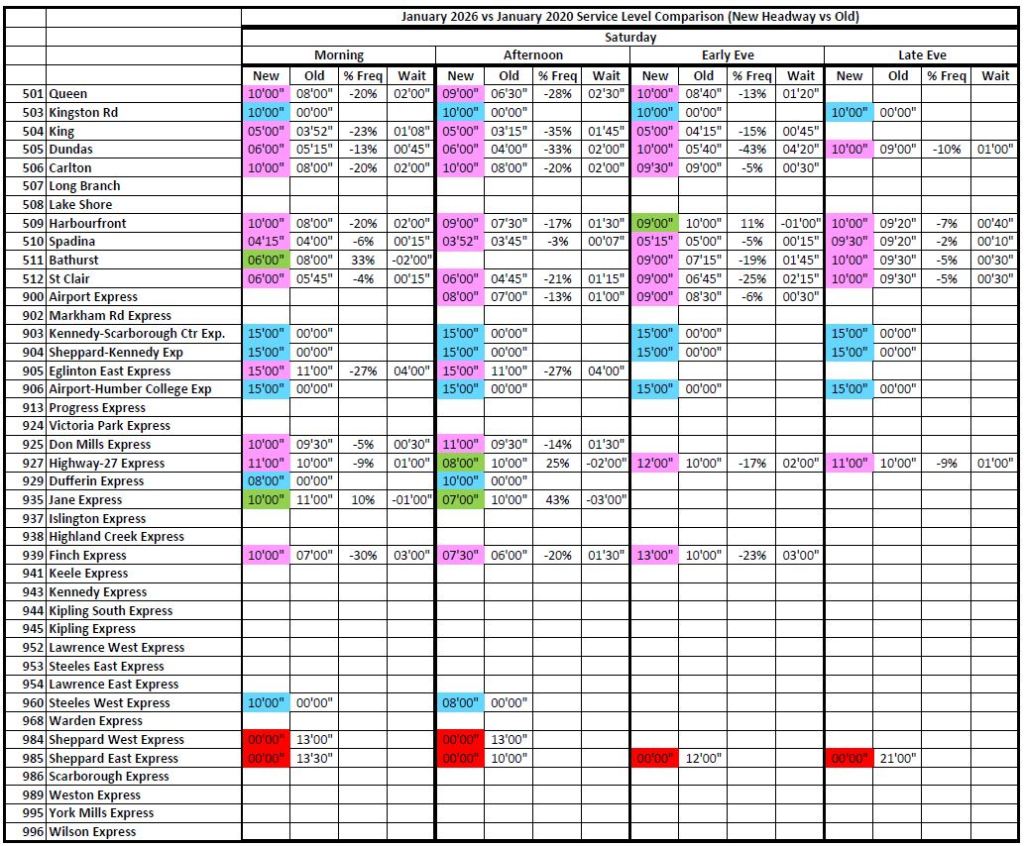
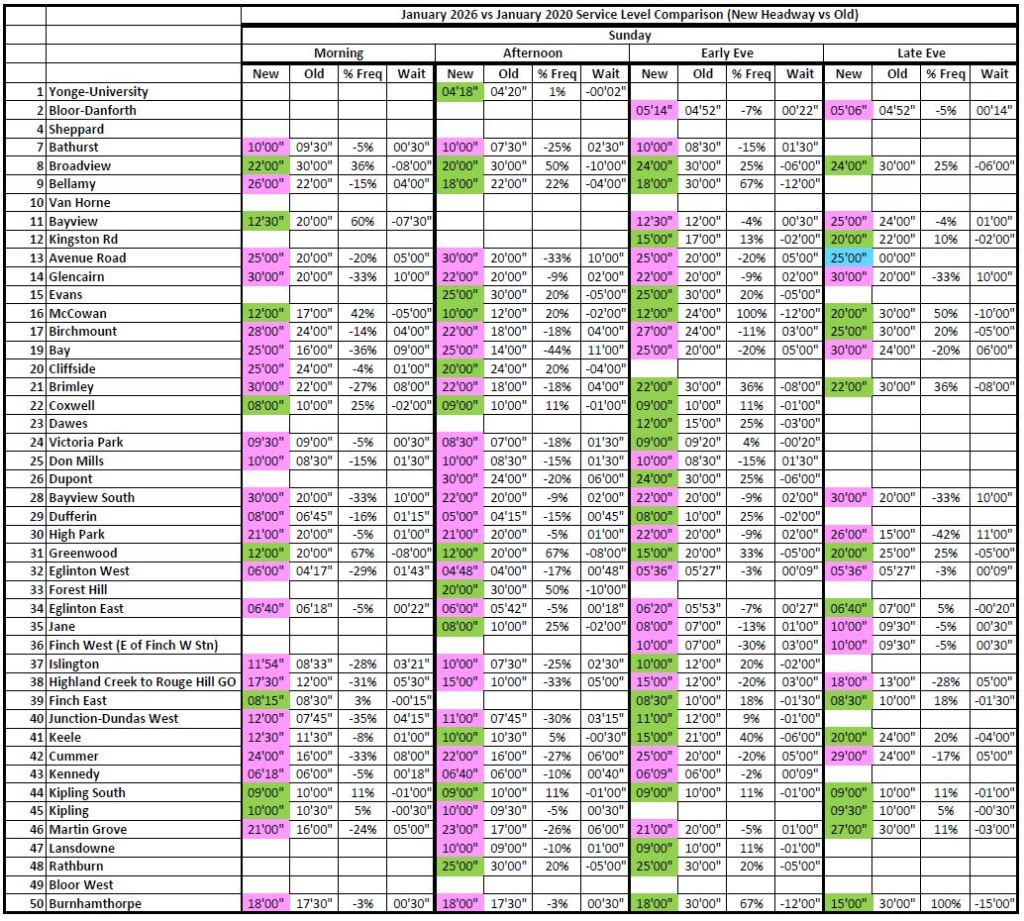
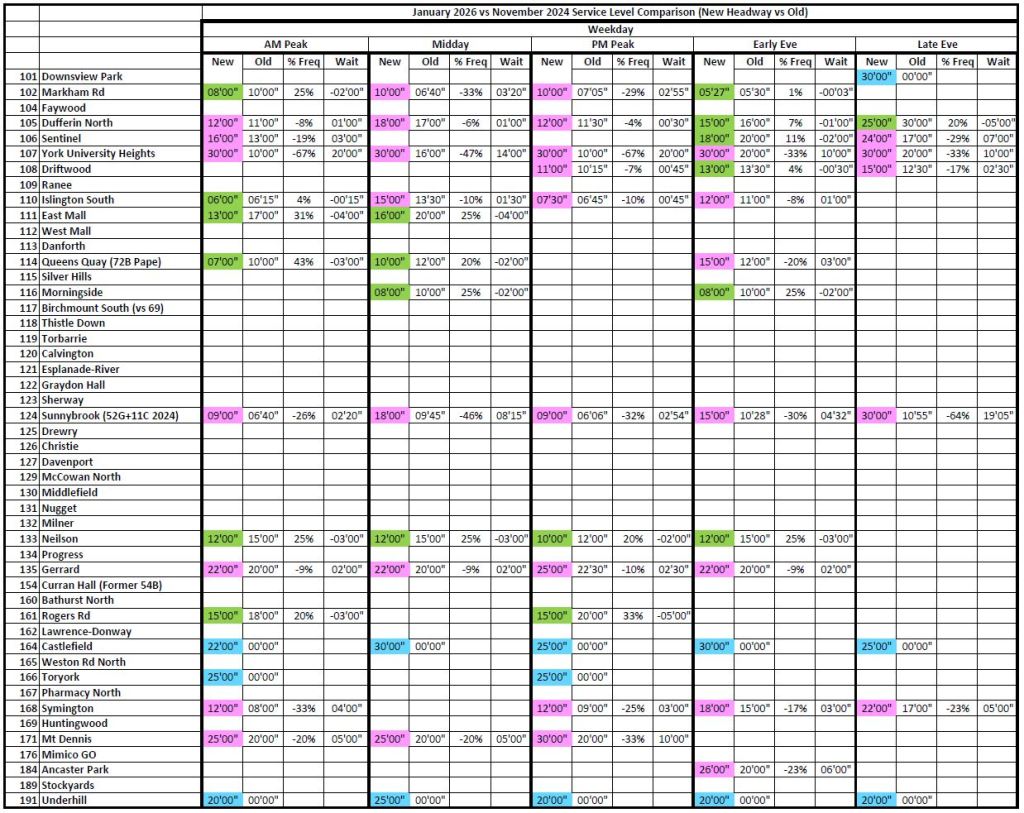
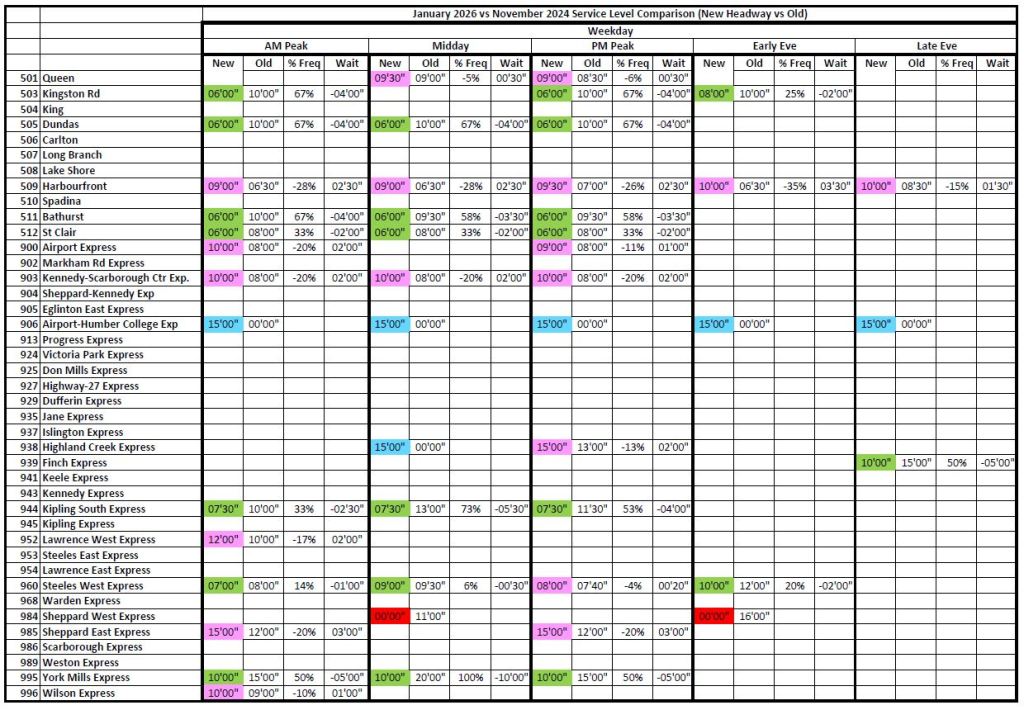
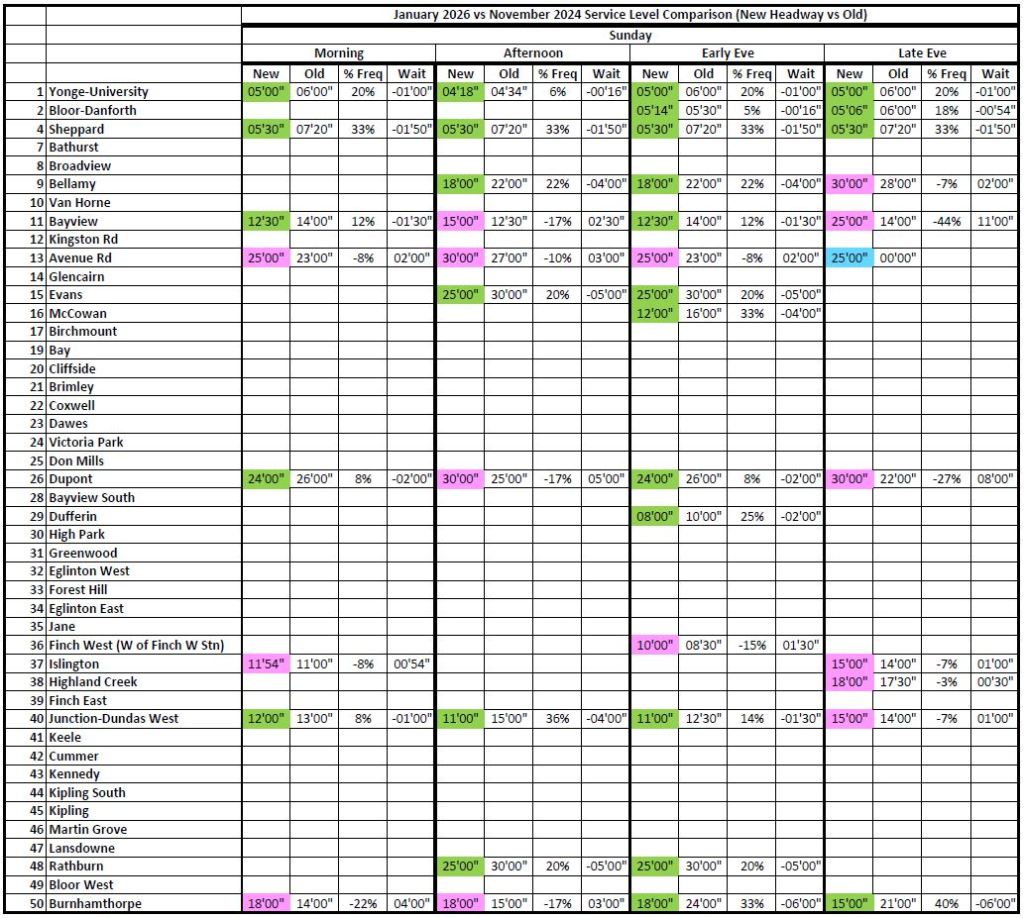
The table below compares January 2020 with January 2026 weekday headways. Five schedule periods are shown in the major groups reading across. Within these are the 2026 and 2020 headways, the percentage change, and the change in wait time.
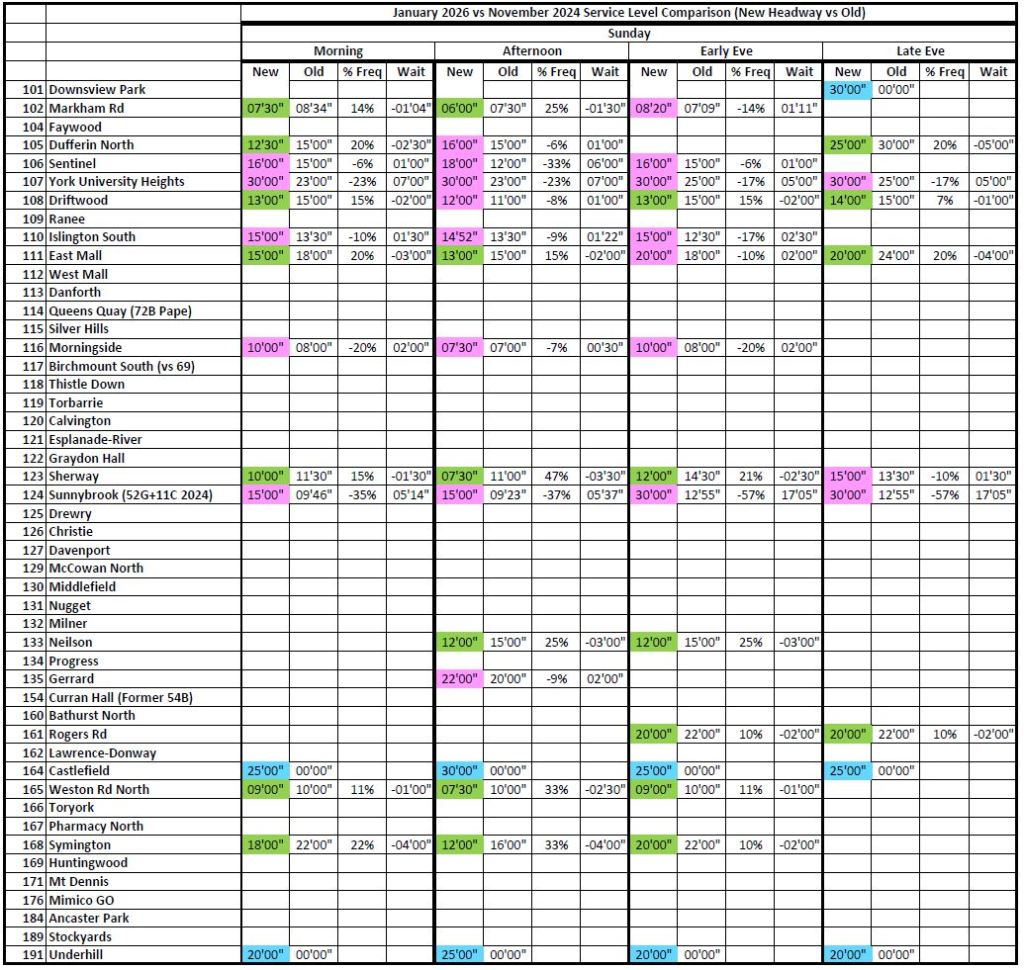
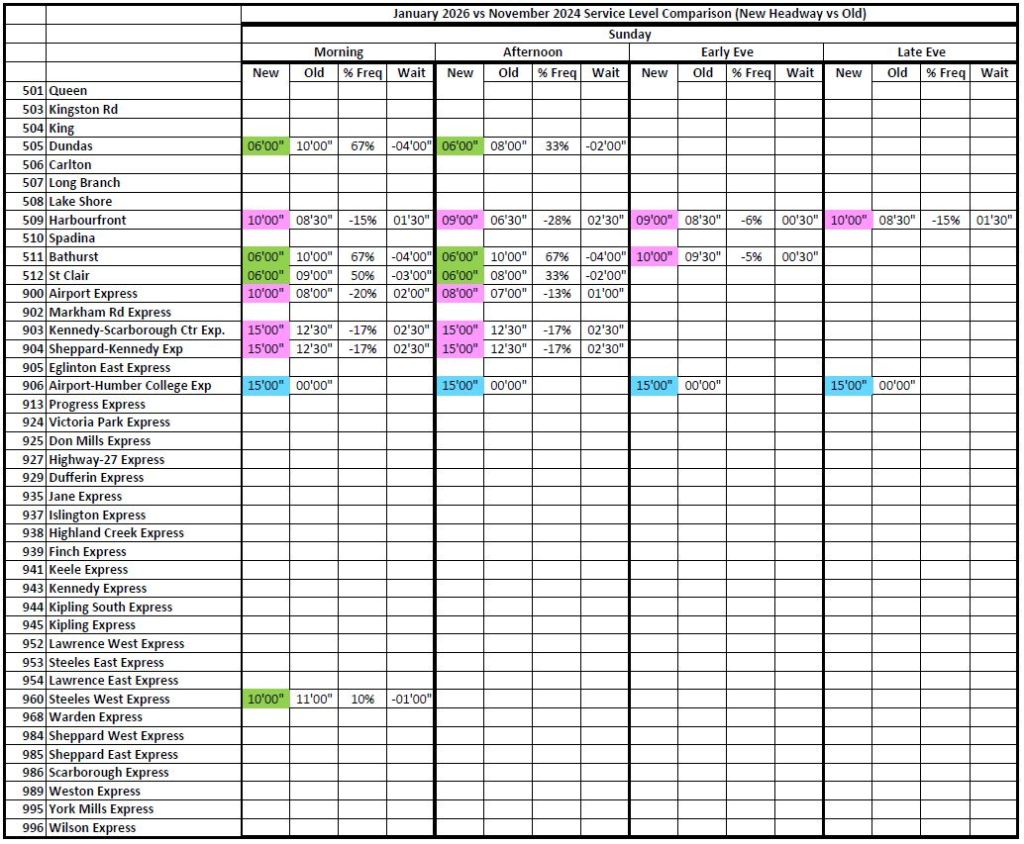
Where the 2026 and 2020 times are unchanged, the cells are blank to avoid clutter. Otherwise, the 2026 headways are colour coded:
- Green: Improved
- Pink: Reduced
- Blue: New service
- Red: Service discontinued
There is a lot of pink in these charts indicating that many routes are less frequent today than six years ago.
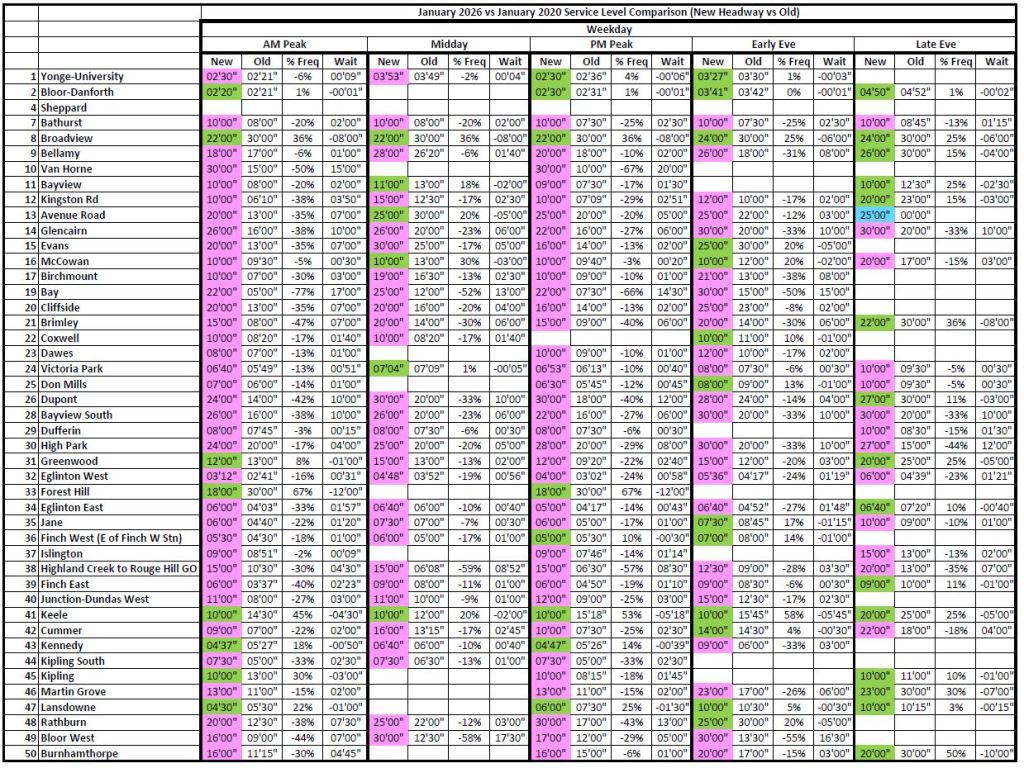
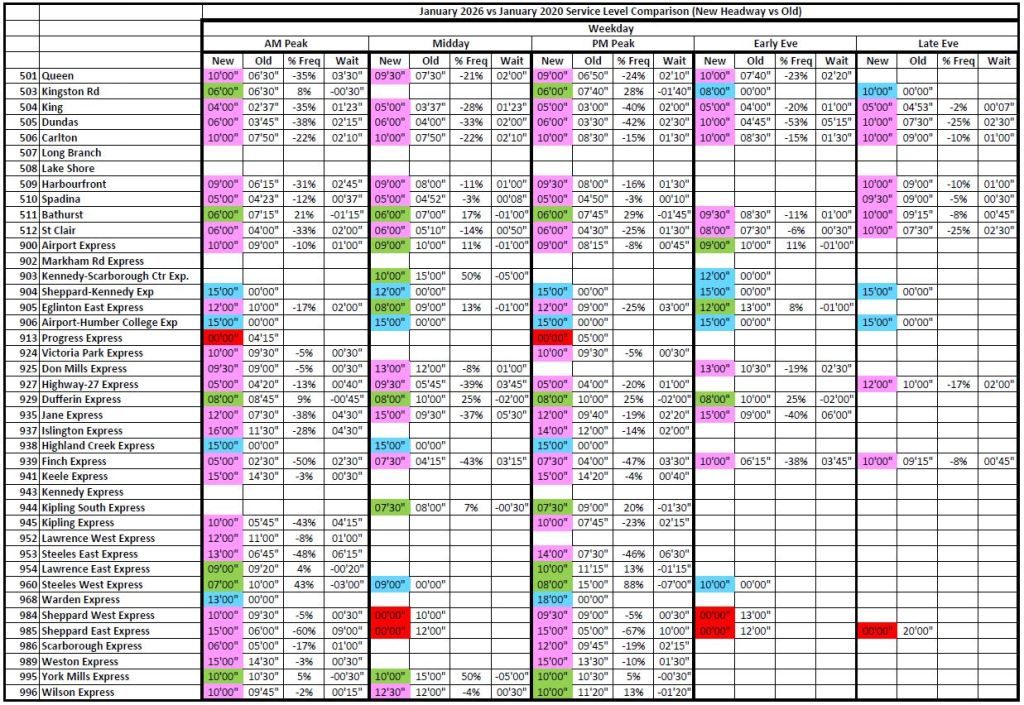
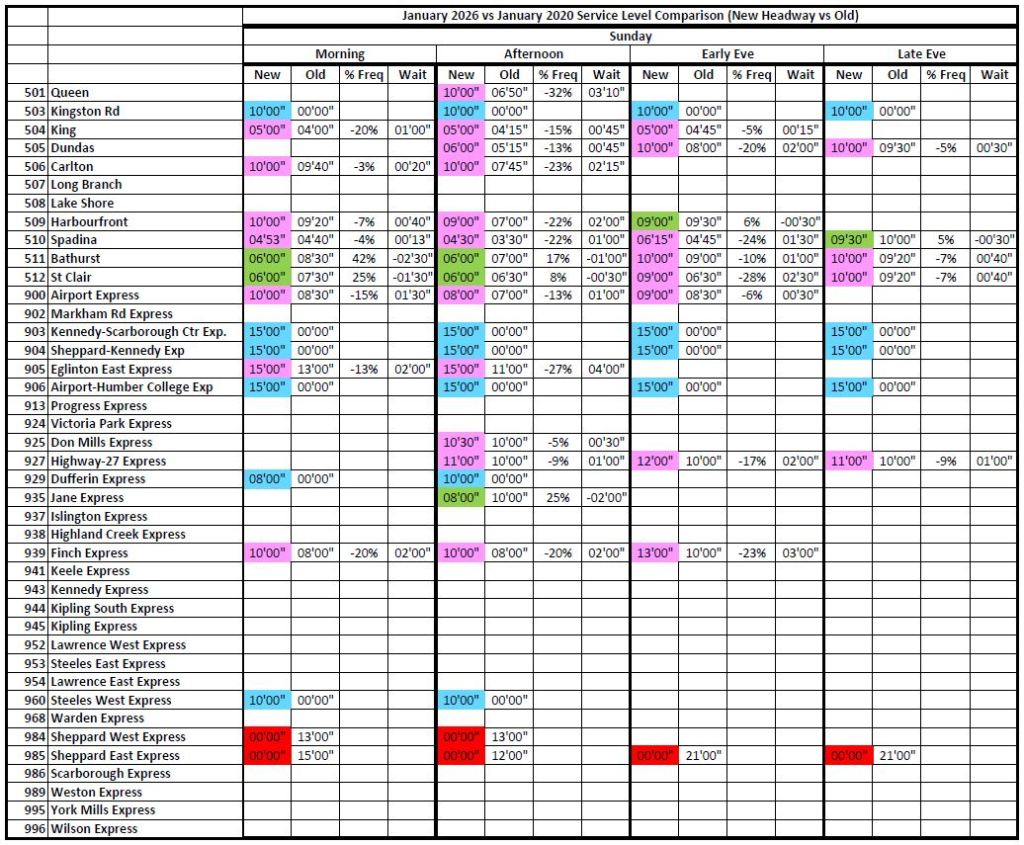
Note that in January 2020, 503 Kingston Road and 505 Dundas operated with buses, and headways then reflected the lower capacity of those vehicles.
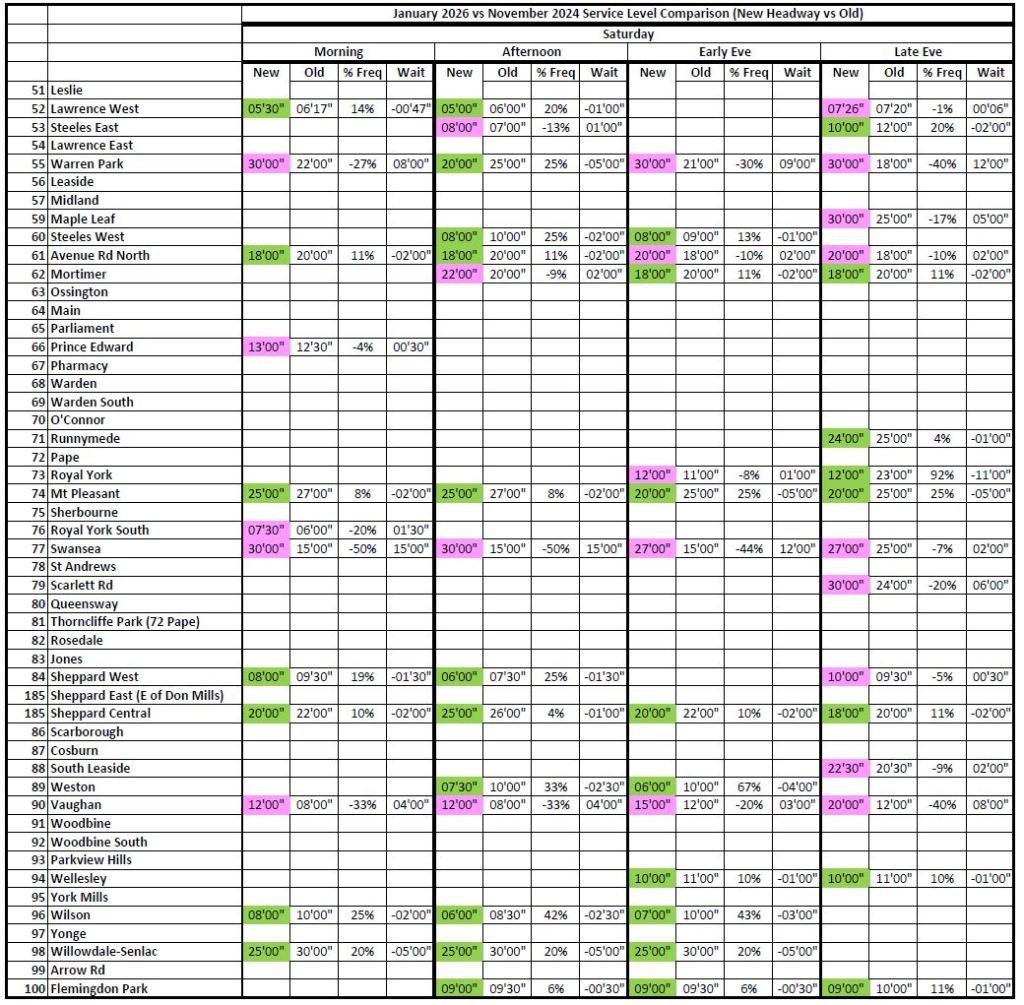
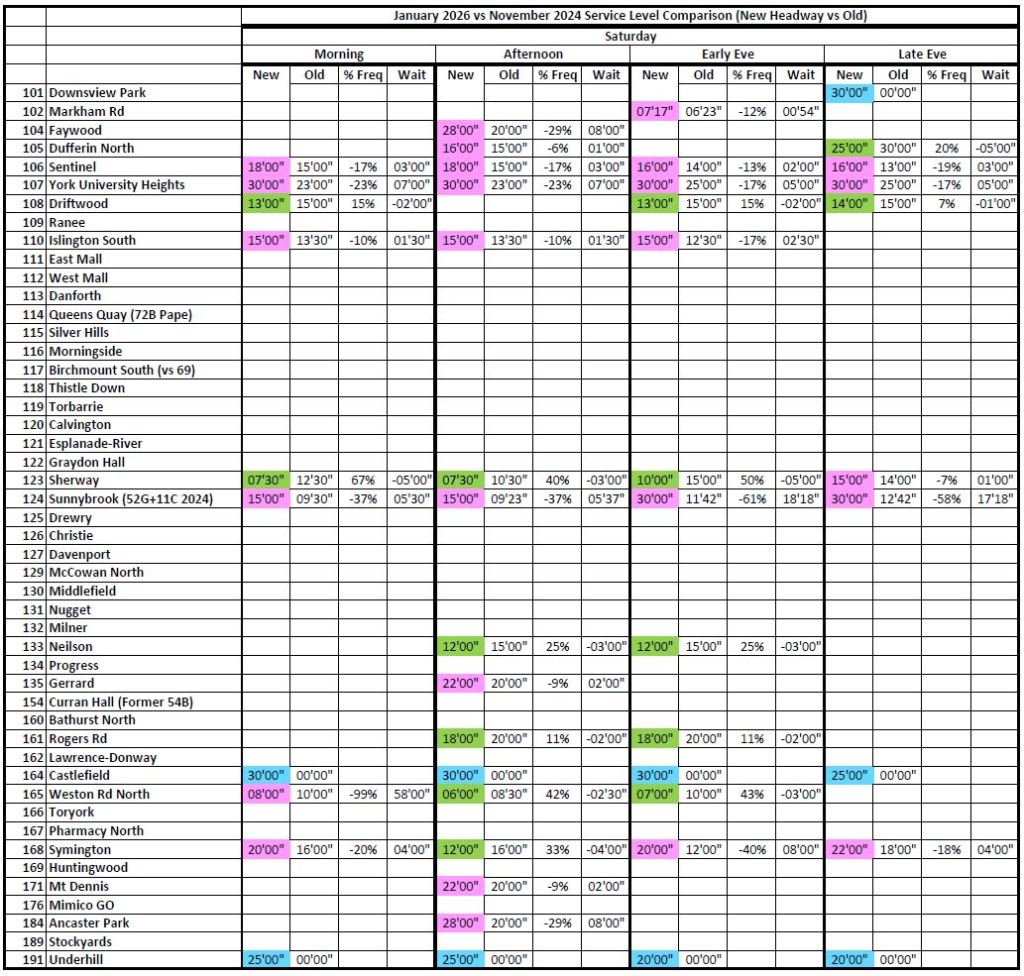
Saturday comparisons:
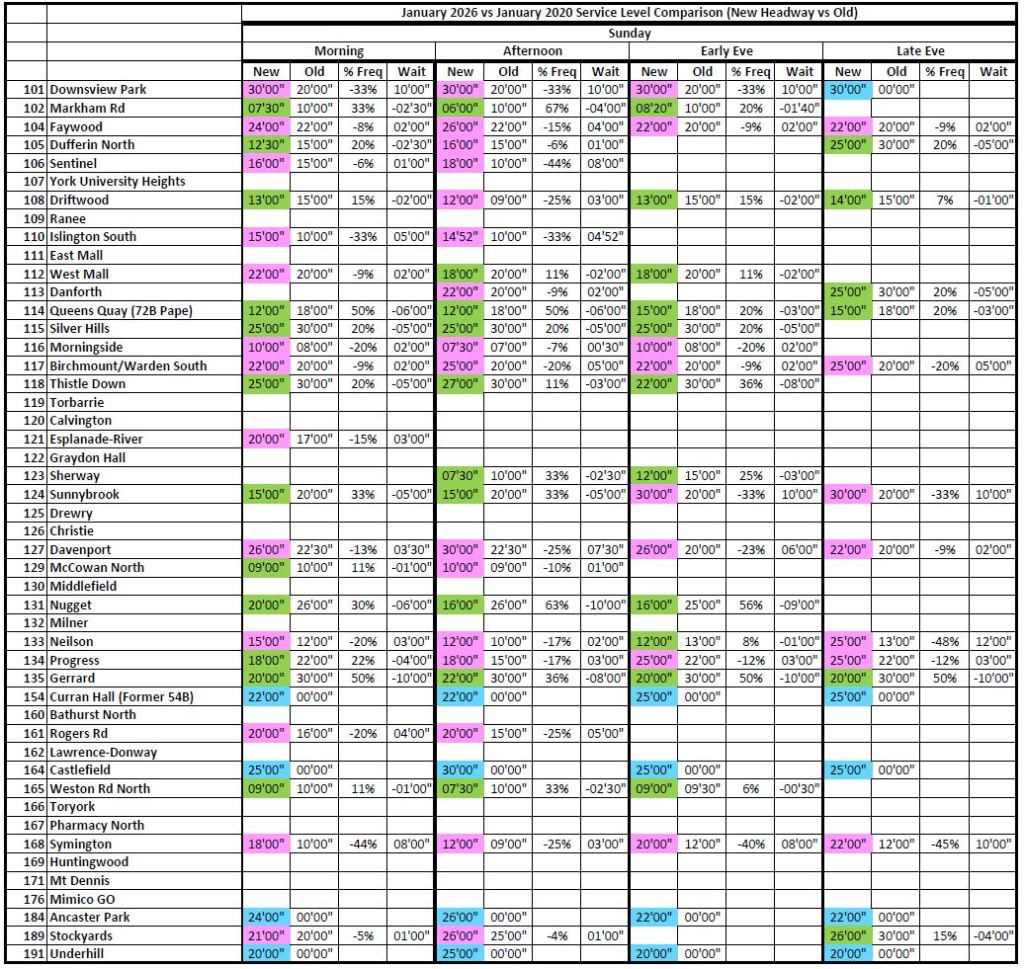
Sunday comparisons:

The full table is in this pdf.
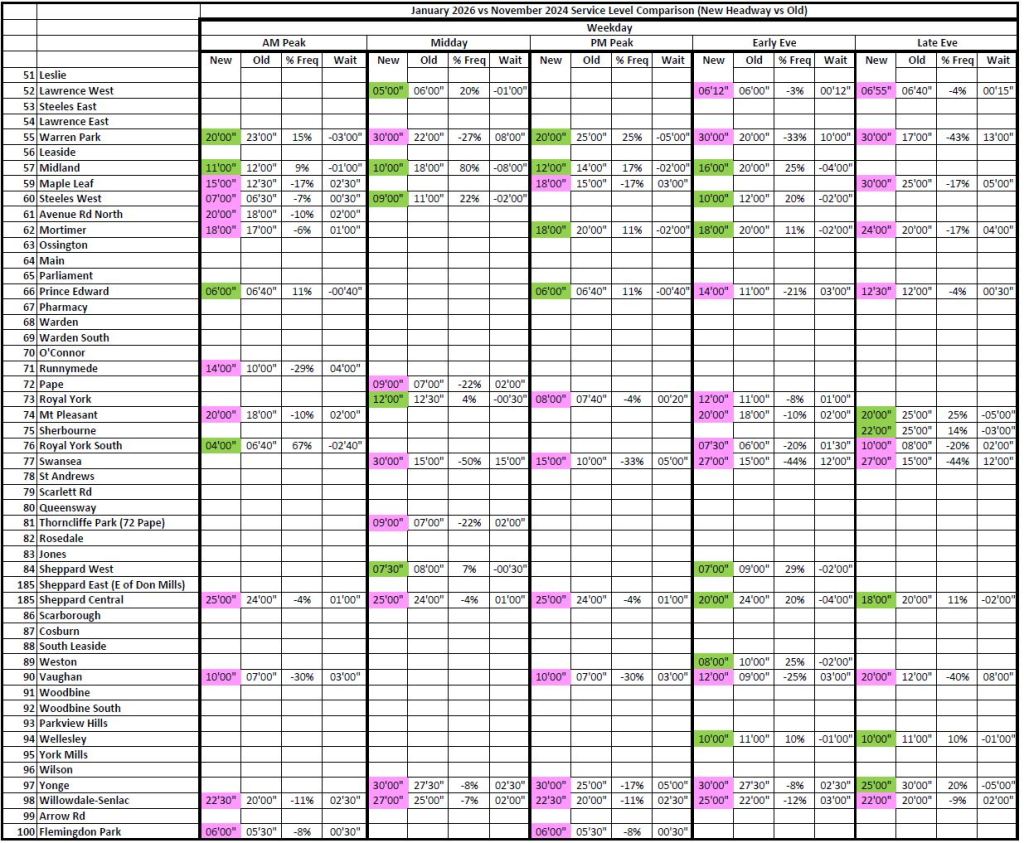
January 2026 vs November 2024
Over the past year, service has improved on many routes, but with the TTC’s constrained budget, this comes with a trade-off where some routes see cuts while others see improvement.
Weekdays

Saturdays


Sundays:

The full table is in this pdf.
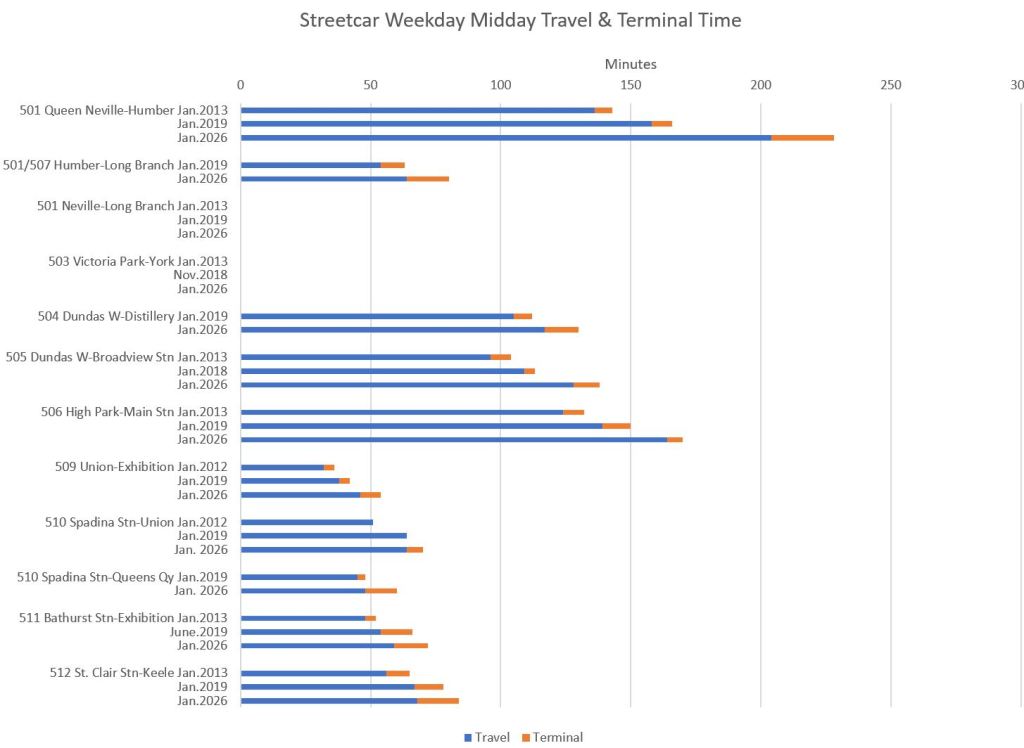
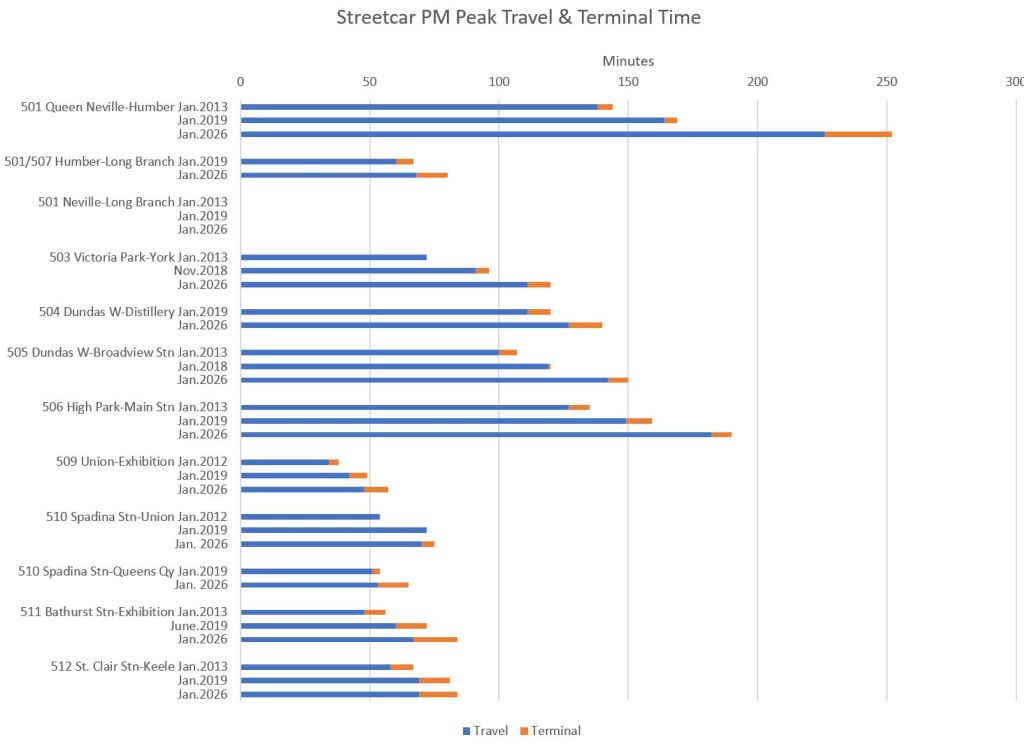
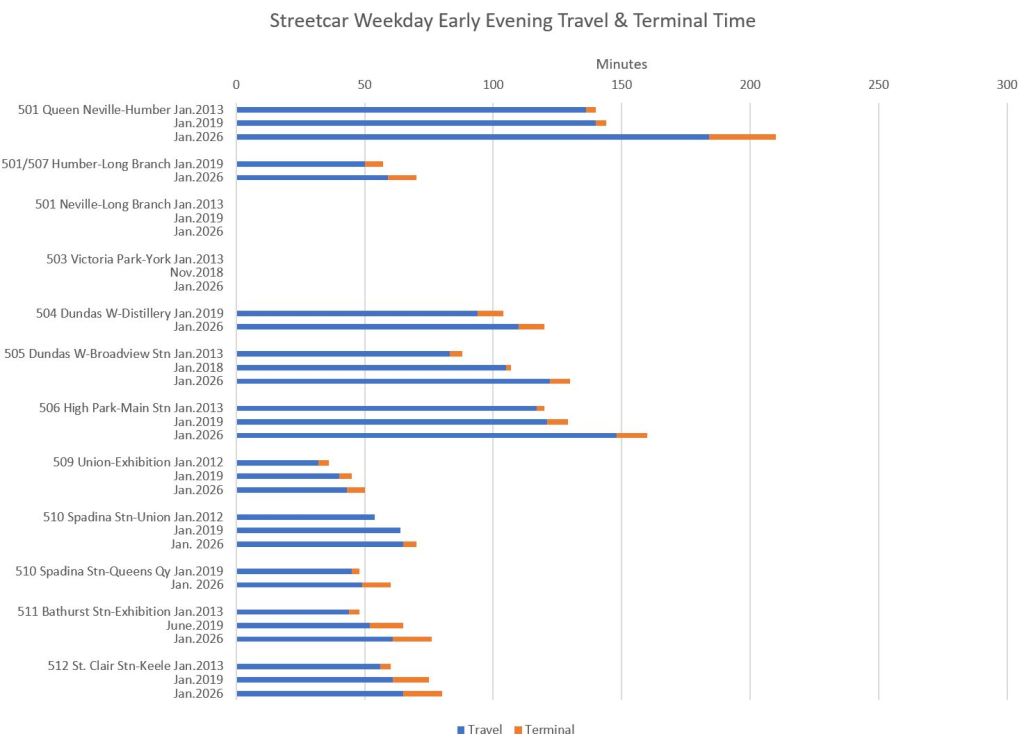
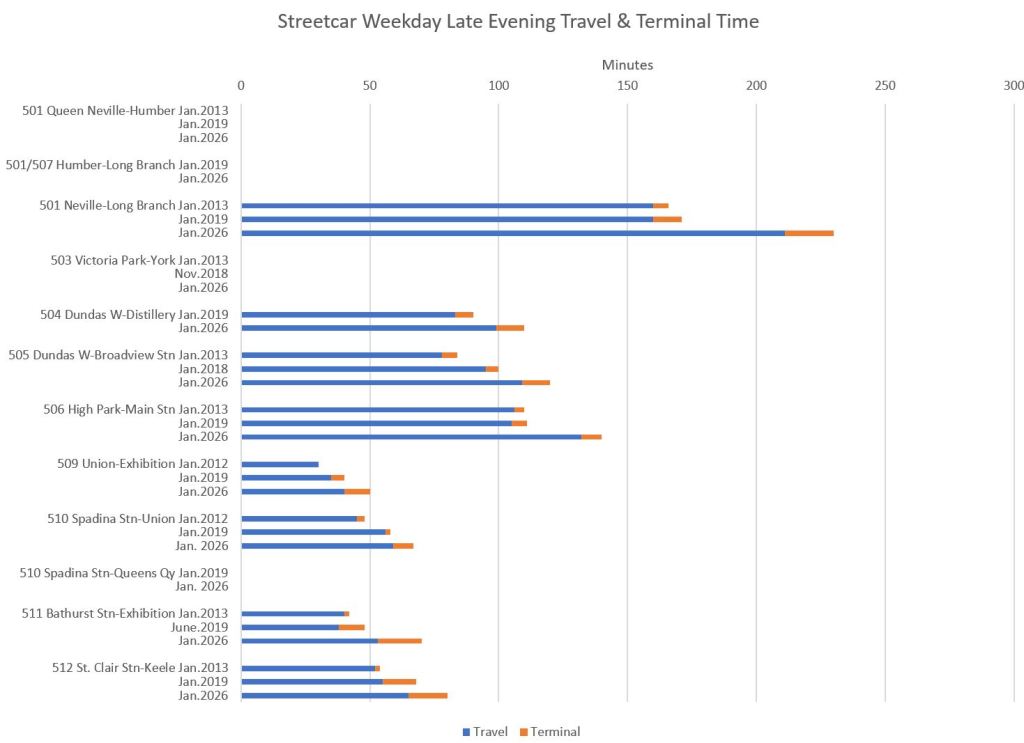
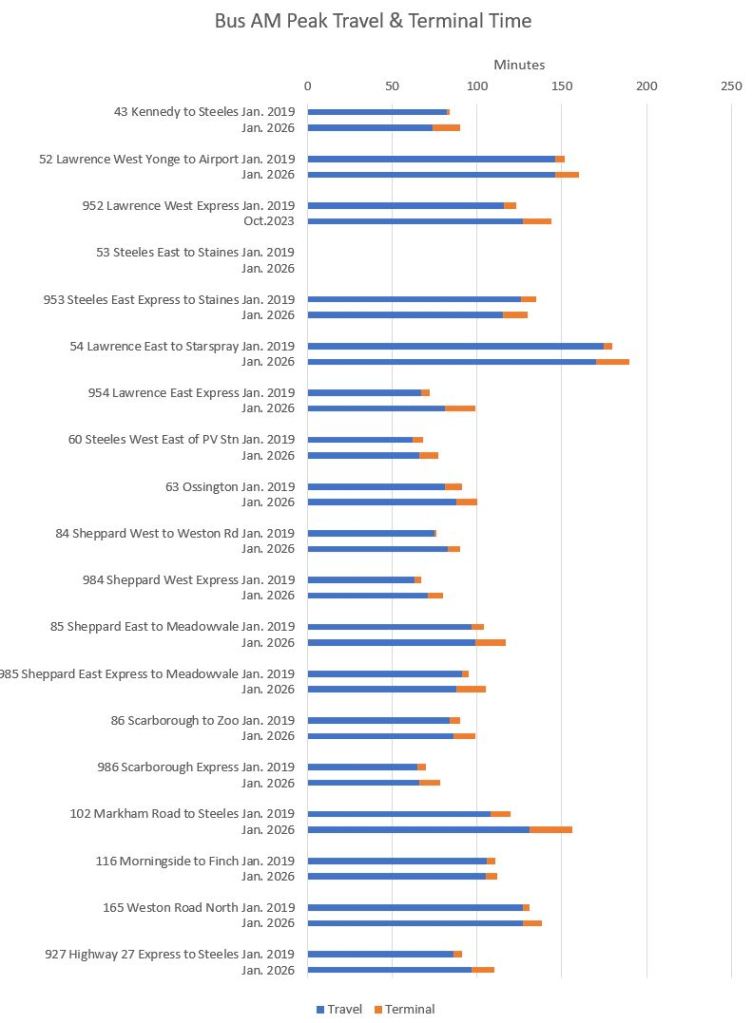
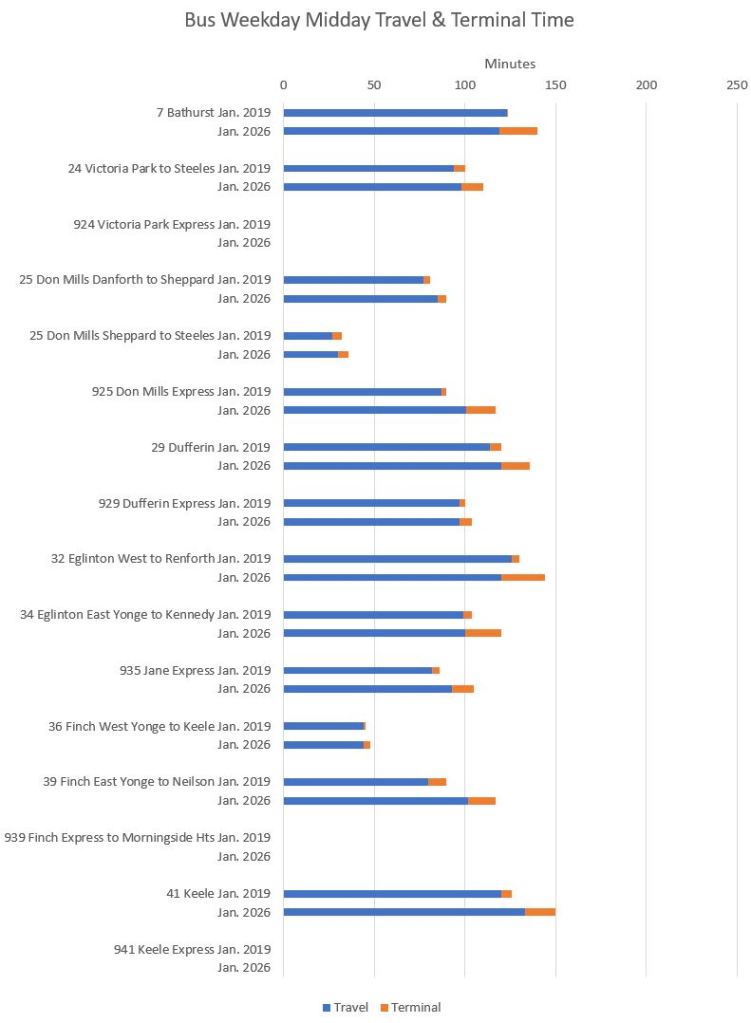
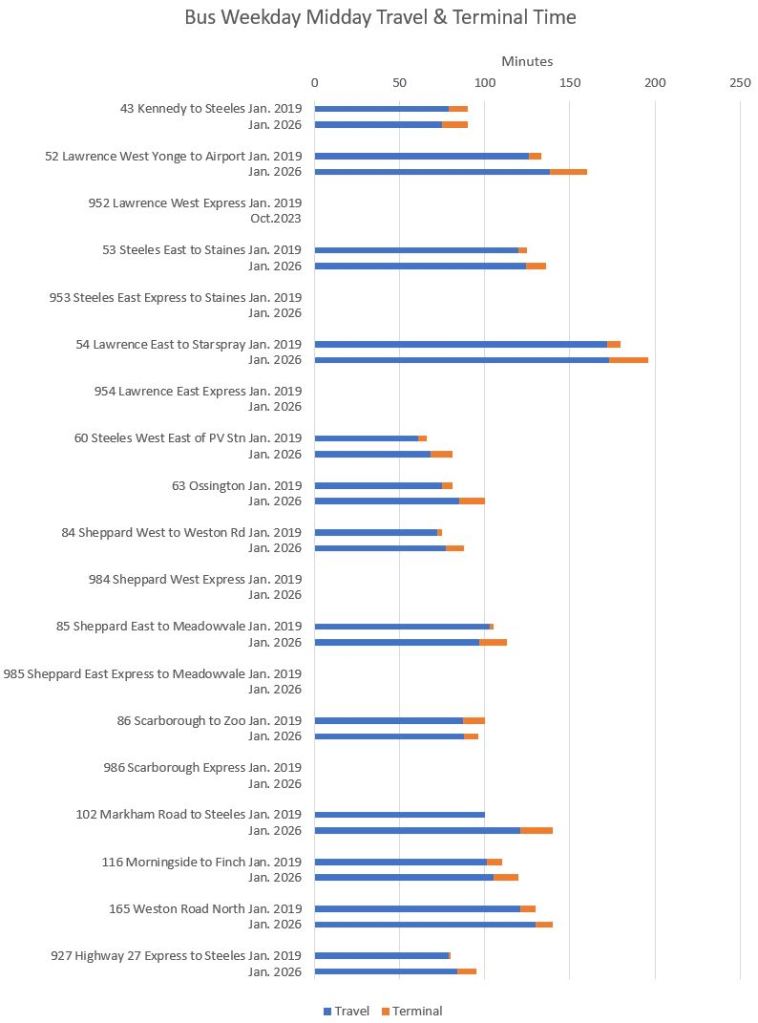
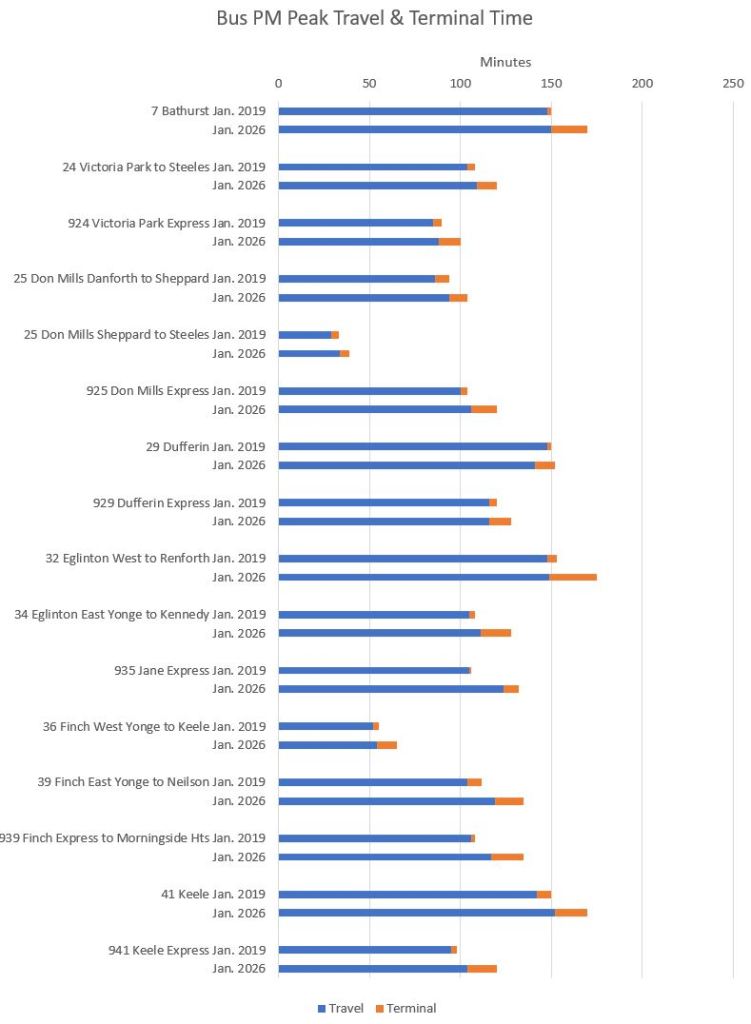
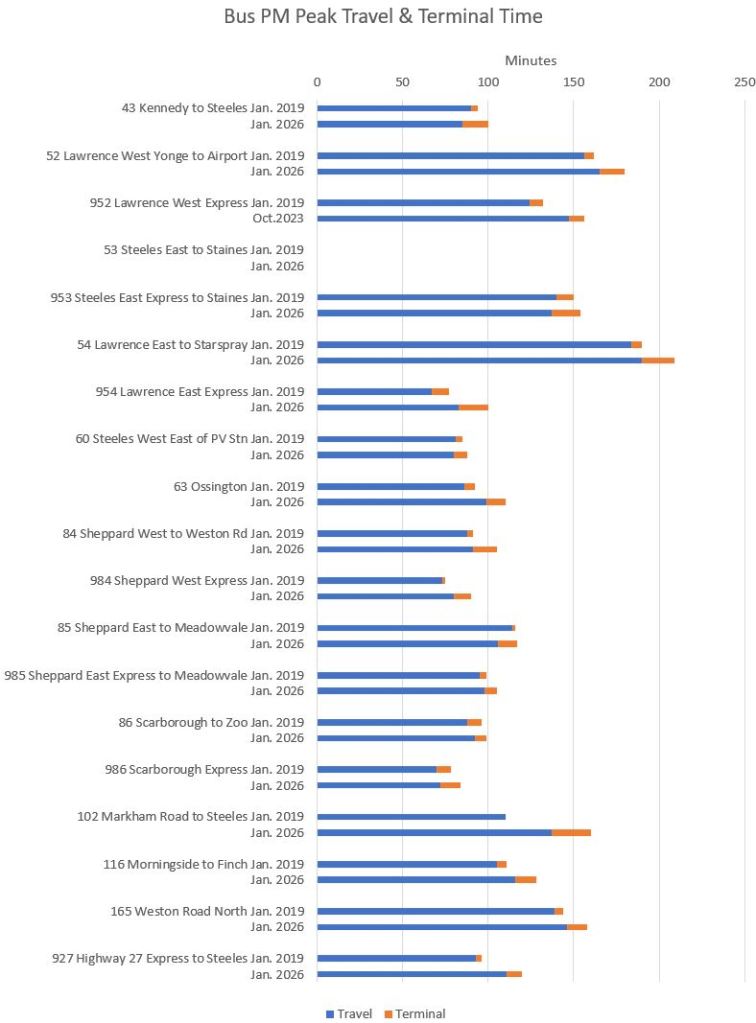
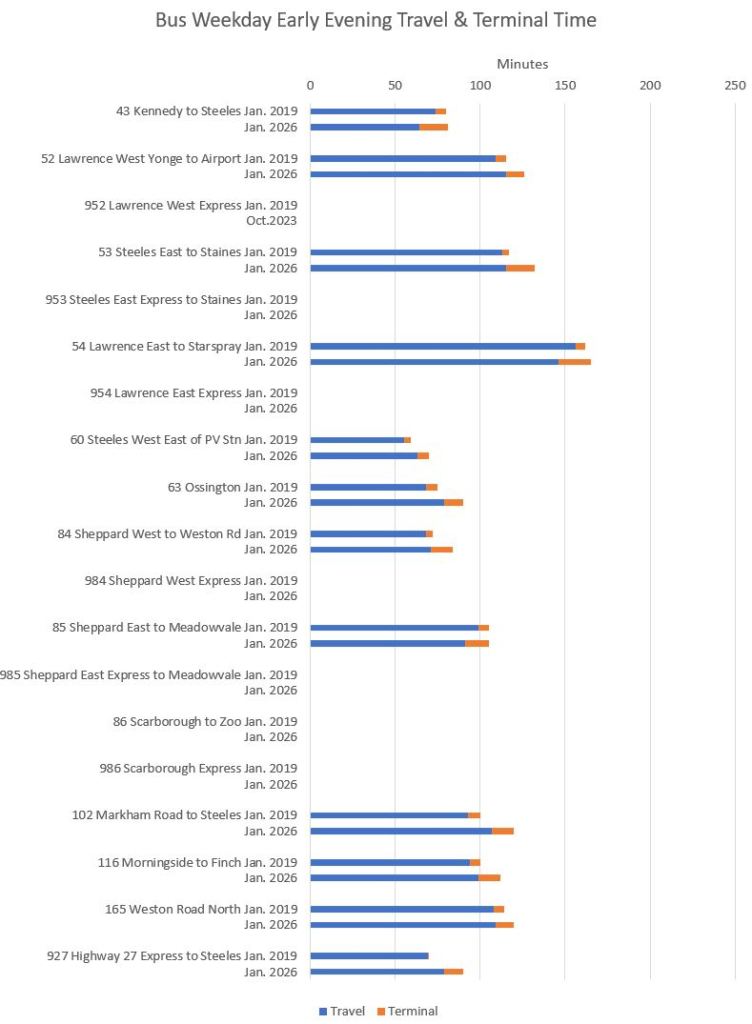
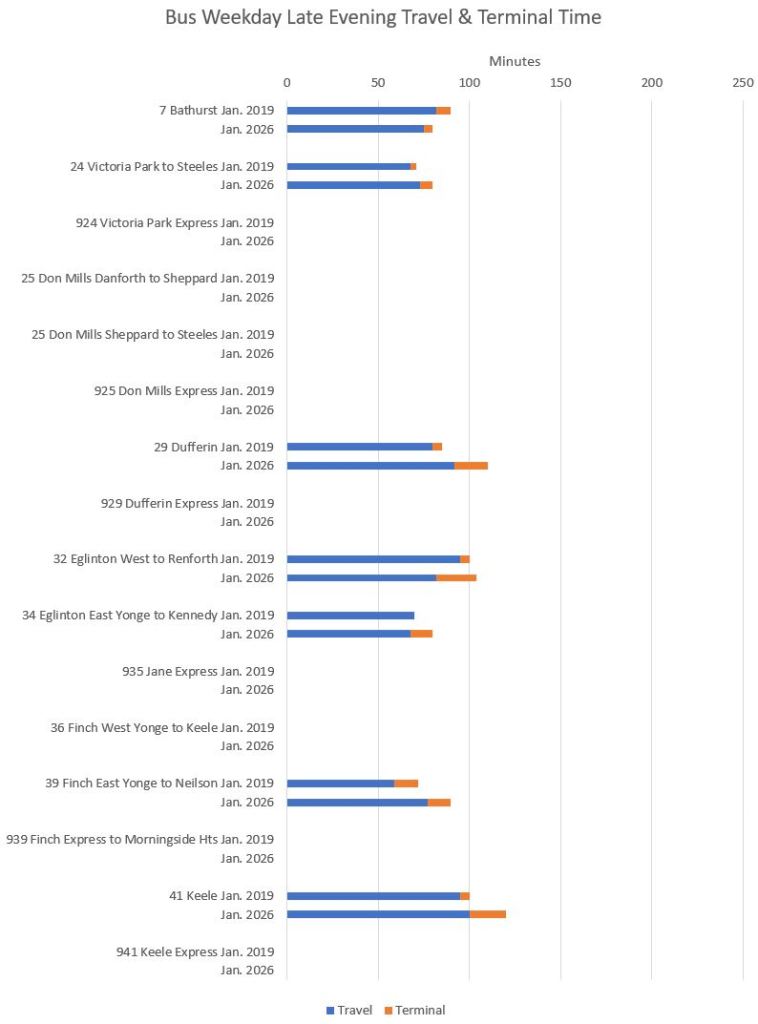
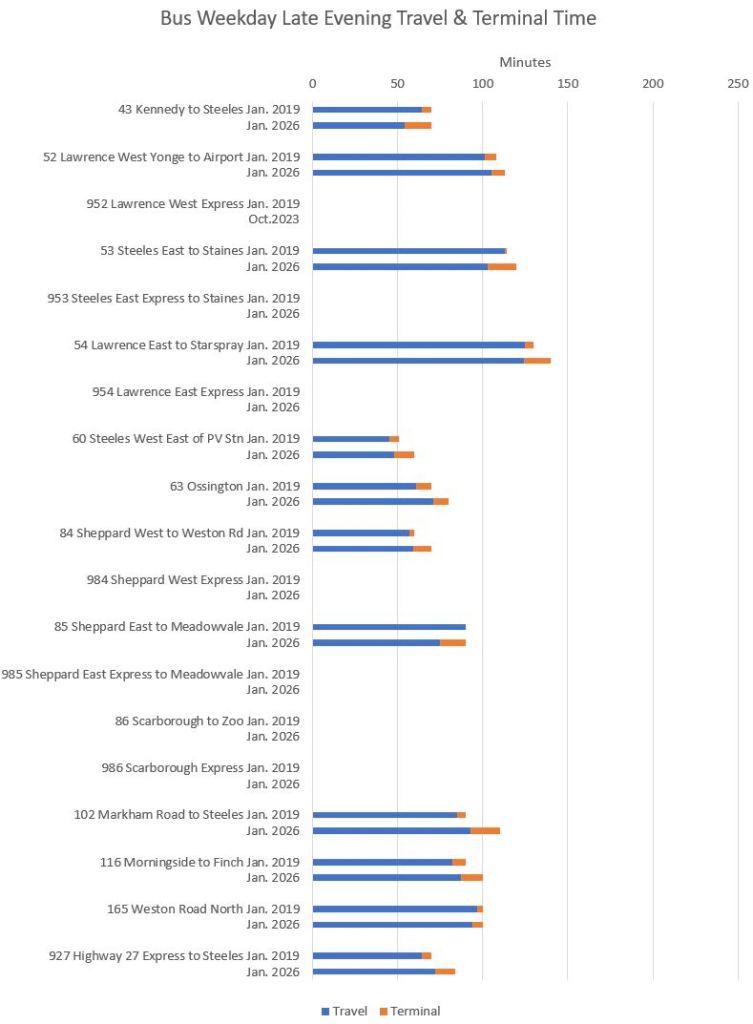
Travel Times 2026 vs 2019
The charts in this section compare travel times in January 2026 with values in 2019 and, for streetcars, with 2013. In almost every case, scheduled travel times in 2026 are longer than in 2019.
The times shown are for round trips, and they are subdivided into scheduled driving and recovery times.
Streetcars
Comparative values for streetcars are shown for 2013 before the introduction of the Flexity fleet and imposition of some of the more restrictive practices at streetcar junctions.
Note that travel times are longer in 2026 even on St. Clair and Spadina which have reserved lanes.
501 Queen times are noticeably longer due to provision for the Ontario Line diversion downtown.

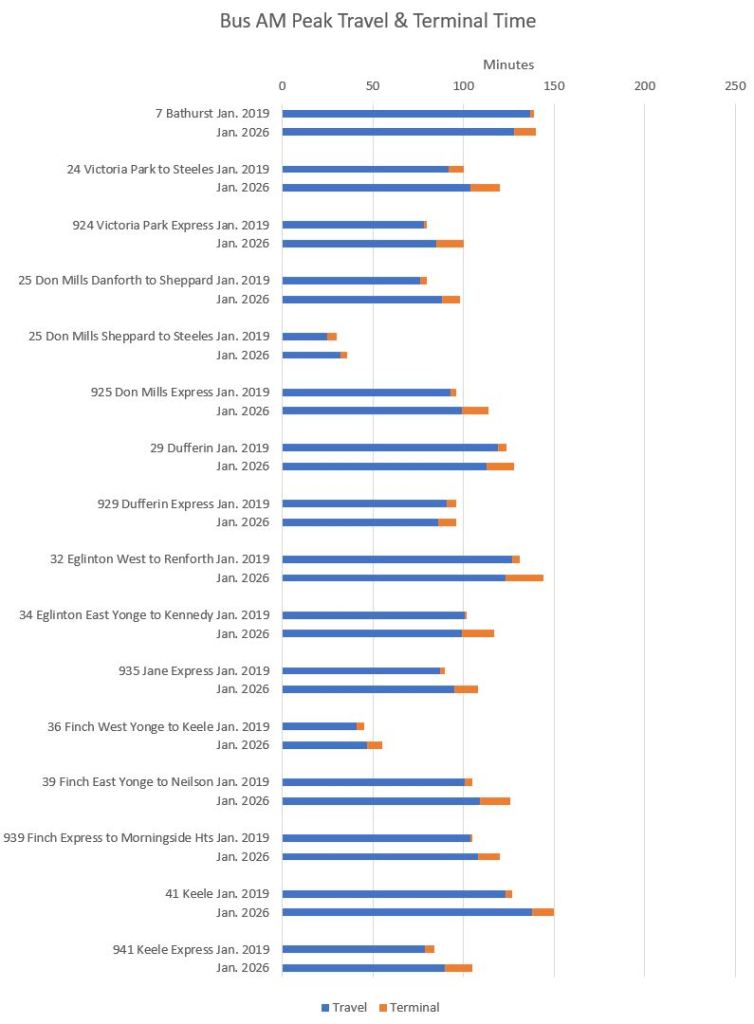
Buses
Like the streetcar routes, bus routes show a growth in scheduled travel times in almost all cases.


Good morning Mr Munro. Congratulations on 20 years of blogging. Can you please explain why service levels need to match or exceed pre-pandemic levels when ridership is much less than pre-pandemic levels? And why the TTC funding needs to be higher than ever before when ridership has declined dramatically since the first pandemic lockdown?
Steve: The twentieth anniversary is still a few weeks away. The issue with pre-pandemic service levels is that various pols and TTC management often make reference to this as if we’re almost back to normal when the situation is very different from early 2020. In some parts of the city and times of service, ridership was already back to 2020 levels and beyond a few years ago because workers there did not have the option of working from home. Other places including downtown and university campuses were in a different situation. By charting the change in all of the routes and time periods, I hope to give readers a fine-grained view. A related issue is that a lot of the restored “service” simply kept up with congestion and did not actually improve capacity.
What is often forgotten is that in years leading up to 2020, the TTC was badly overcrowded in places to the point that parts of the subway were considered unsafe. Restoration to that level of crowding and service should not be the goal especially if we want more people to ride the system. It is quite frustrating that the TTC does not publish detailed riding stats that could be used to audit service levels with actual demand. Remember also that boarding counts and crowding are not the same thing depending on the “churn” in riders getting on and off, and the degree to which demand is heavily weighted in a peak direction. This leads to lots of service hours, but a lower density measured as boardings/vehicle kilometre.
Also, your streetcar/LRT technology has failed in Toronto but you continue to support streetcars/LRTs saying that they work just fine in other countries but you dismiss the PPP model of building/operating transit saying that it has failed in Toronto when it has worked extraordinarily well in many Asian countries with some of the best transit systems ever built. Can you please explain the inconsistency in your position?
Steve: Streetcars and LRT “fail” in your words because of bad implementation in the case of Finch, and an anti-transit bias in City Transportation where streetcars get minimal transit priority despite all of their claims. LRT succeeds in cities that want to make it work and organize their operations and streets around it. Here the attitude is that streetcars are a nuisance, and they do not get the attention they deserve even from the TTC who, after all, proposed an LRT network back in the 60s when I was still a teenager, not the evil streetcar promoter many make me out to be.
There are countless streetcar/LRT systems in the world that continue to operate and expand. An important difference is that transit projects are seen as a public good, not as an industrial development policy for builders and a pork barrel for consultants.
As for Asian countries, yes they have built some impressive systems in corridors with demand vastly heavier than on Finch.
As for P3s, like so much to do with large projects, it depends on skill, experience and good project management. Here the attitude is that TTC doesn’t need a big engineering team because Metrolinx is doing the work, and at Metrolinx it’s all farmed out to consultants, some of whom do not have exactly an arm’s length relationship. The big gap comes in project and contract management, and we have seen how the Eglinton project repeatedly ran aground on the mismatch between Metrolinx and their “partners”. Meanwhile some cities that build continuously have their own resident cadre of engineers and project managers, even if they hire construction companies to build things. The UK is well into the arc from public to private and back again, and has seen just what the private sector does when things get bad. They run leaving the public sector holding the bag, or have to be fired for non-performance.
Congratulations on your 20 years.
Steve: You’re welcome!
LikeLike
If service levels are adjusted based on ridership levels, it’s the programmed logical end of public transit.
Steve: Especially if the goal is to attract new riders, not just to provide the minimum service needed for existing demand.
LikeLike
As a response to the Anonymous York U Student, I would add, its important to ask why ridership is lower.
Work from Home certainly eroded it to some degree, though much of that is now being wound down.
But a certain amount of the decline was fueled or exacerbated by increasingly poor service.
Vehicles that take longer to get where they are going, and for which waits have also increased, sometimes significantly.
There is a chicken and egg problem with the assumption that service should merely respond or react to ridership, where in fact, to at least some degree, it must lead it.
Fewer buses, running further apart are more prone to uneven loads, overcrowding and bunching. (there are many other reasons for this, but it is made worse by less frequent service). That, and more generous terminal (recovery) times result in slower service.
How many riders are staying away, because the service is less attractive than it was before?
I don’t have an exact answer, but its certainly worth considering.
LikeLike
The zillions of Lyft/Uber/whatever “rideshares” running around might have something to do with the situation.
One strategy that some might suggest is that the TTC should downsize given that some of its patronage has gone to “rideshare”.
But almost all rideshares appear to be leased cars driven by people who might not have been in Canada all that long.
I would not want to guarantee that the price of these “rideshares” won’t continue to rise, or, with the changes to immigration policy, the pool of willing drivers might not fall.
If so, suddenly riders start coming back to the TTC. And there would have to be a scramble to reverse the downsizing.
(You can put your bets on whether the technonirvana autonomous taxis will work out or not. I am skeptical. I’m pretty sure that self-driving vehicles would not do well today, Jan 15, the day of the blizzard. But I did see a 507 Long Branch streetcar pull out of the loop and head eastbound at about the normal speed.)
LikeLike
TTC is now publishing and displaying “proudly” their daily on-time performance on its website.
The numbers are pretty bad (even before snow day today). Of course there’s no definitions.
You’ve highlighted that those likely don’t take into account short turns, bunching etc. and are actually much worse than they report. Could you take a look at what those are please?
Steve: The “on time” stats are based on vehicles leaving terminals on time or up to five minutes late. They do not reflect their behaviour after they are enroute, and that five minute window gives lots of margin for bunching right at the end of the line. All bus routes and times of day are lumped together, and by comparison with the streetcars this means that issues on major bus routes are diluted by better performance on the many small ones.
This is a bogus stat.
LikeLike
Why stop at taxis? We already have the technology for self driving buses but it’s the unions holding back progress. That’s what some commenters on this blog were saying… a decade ago.
Steve: We do NOT have the technology for self-driving buses in mixed traffic. If you want to claim it’s a union problem, that avoids the basic issue of whether and under what conditions, if any, the technology actually works.
LikeLike
L Wall said,
If you can get a to where you need to go in a self-driving taxi for around the same cost as a TTC fare, and it provides door to door service, and it provides a private comfortable safe space, you need to ask yourself a very simple question. Why would you ever want to set foot on a bus?
Steve: If you think that a self-driving taxi will charge you a TTC fare to go anywhere in the city, you are dreaming. This is a bogus argument.
LikeLike
Although the self-driving taxi is in its early stage of implementation and the technology has not achieved optimal maturity, there are instances of providers in Austin Texas offering the service for $4.50 flat rate for a trip. In cases were two or three people car pool the costs of one of these rides becomes very competitive.
Steve: And it is also a matter of record that this industry is giving away rides to establish market share.
LikeLike
This is true, but with market share comes economies of scale, and with scale come significantly lower prices. What matters here is that the technology must studied and understood, because it will likely have a material impact on the way that the TTC delivers services in the future.
LikeLike
For tech, with increased market share comes increased revenue. Also a monopoly as competitors are driven out by artificially low prices at the start. Witness Uber.
In any case, “rideshare” and “self-driving rideshare” advocates haven’t explained how taking everyone off the bus and putting them in a self driving pod is going to improve traffic in Toronto. (It won’t.)
Finally, I suspect that the people who think self-driving vehicle services will be too cheap to meter, by taking the driver out of the picture, have never been responsible for operation and maintenance of a fleet.
LikeLike
As a regular rider of the 90 Vaughan bus, the decline in service standards is especially egregious. 2020 headway was 5 minutes, then 8 minutes in 2024, now 10 minutes in 2026. Not only has the target service worsened but the routing change leading to Cedarvale station has also now significantly increased the variance because of congestion on Eglinton and Oakwood. A 20+ minute wait is now common whereas a 10-12 minute wait was previously a rare occurrence.
Steve, if you’re looking for another analysis idea an interesting one might be how the change to the bus routing for anticipated Line 5 has impacted certain bus routes.
LikeLike