
When the TTC talks about service levels, a common comparison is to the pre-pandemic period. I have reviewed this issue before:
- The Mythology of Service Recovery – November 2024 Update
- The Mythology of Service Recovery [September 2024]
This article presents an update on previous reviews to service levels in January 2026 comparing it both with January 2020, and with November 2024 to show what has changed over the past year. Also reviewed is the evolution of travel times on major routes to show the effect of congestion-related schedule changes from 2020 to 2026.
All headway and travel time data here come from the TTC’s Scheduled Service Summaries. An archive of these files is available on this site here.
The usual citation is the number of vehicle and train hours operated today versus the “before times”. Here are the raw numbers:
| Planned Weekly Hours | Regular Service | Construction | Total |
|---|---|---|---|
| January 2020 | 185,825 | 7,068 | 192,893 |
| January 2026 | 193,662 | 5,234 | 198,896 |
These values can be misleading because the 2026 and 2020 networks are not the same. Moreover, one vehicle hour does not provide as much service to riders today because of slower operation and increased recovery times in the schedules.
From a rider’s point of view what matters is the headway, the time between vehicles.
Although many routes have more frequent service today than in 2020, this is not universal. Riders do not travel on “average” routes, but on those needed for each trip. Their experience could reflect a decline in scheduled service on their routes. This is compounded by reliability and the perennial problems of bunching and gapping.
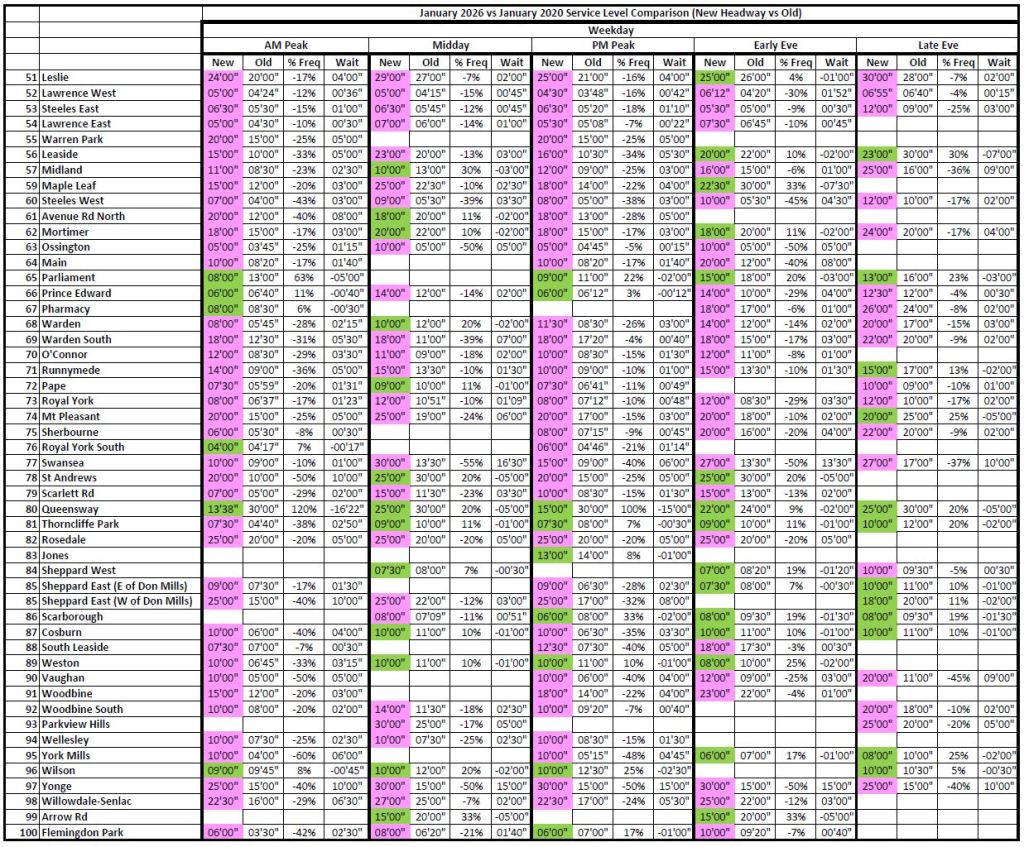
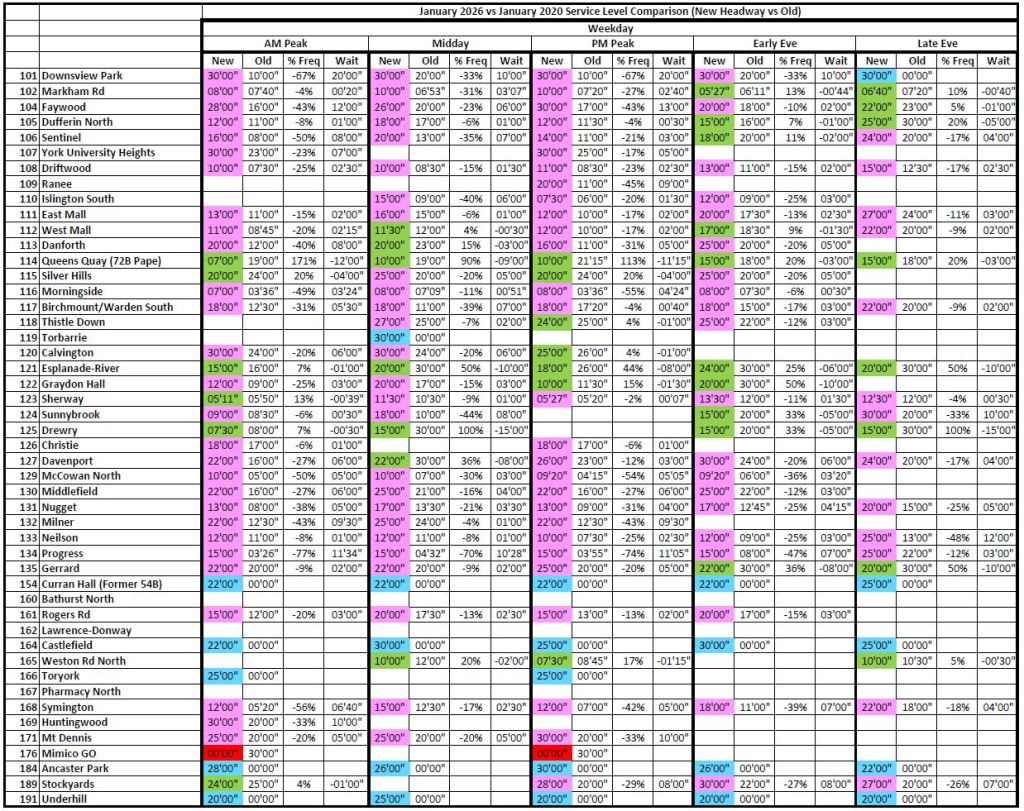
The table below compares January 2020 with January 2026 weekday headways. Five schedule periods are shown in the major groups reading across. Within these are the 2026 and 2020 headways, the percentage change, and the change in wait time.
Where the 2026 and 2020 times are unchanged, the cells are blank to avoid clutter. Otherwise, the 2026 headways are colour coded:
- Green: Improved
- Pink: Reduced
- Blue: New service
- Red: Service discontinued
There is a lot of pink in these charts indicating that many routes are less frequent today than six years ago.
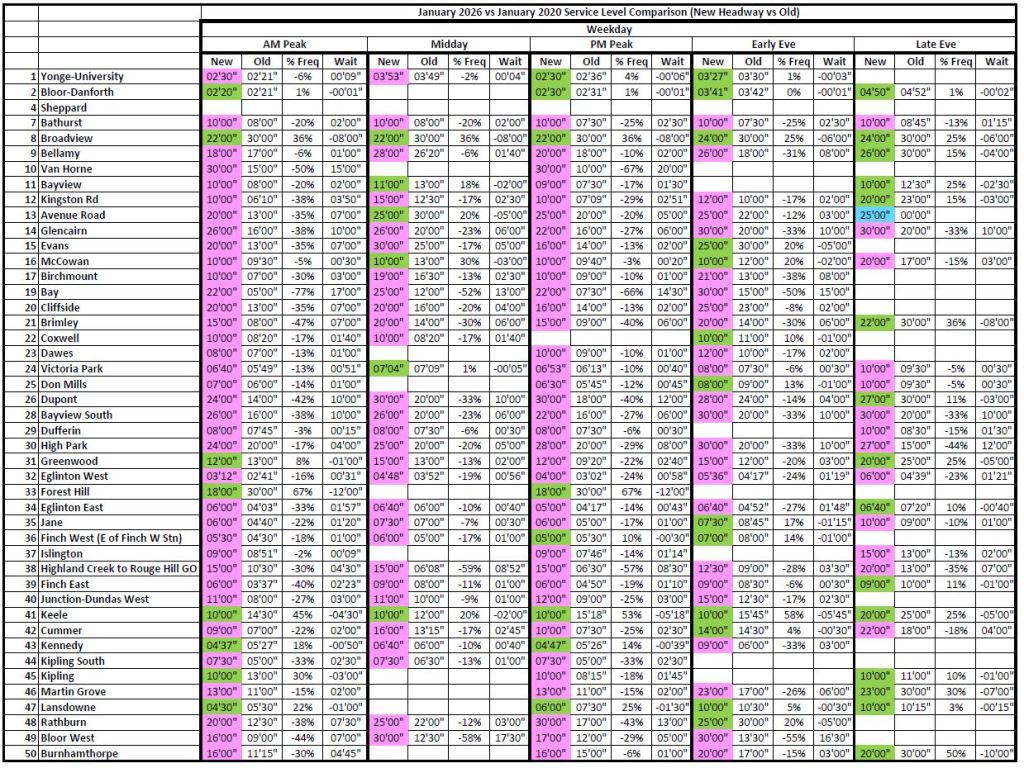
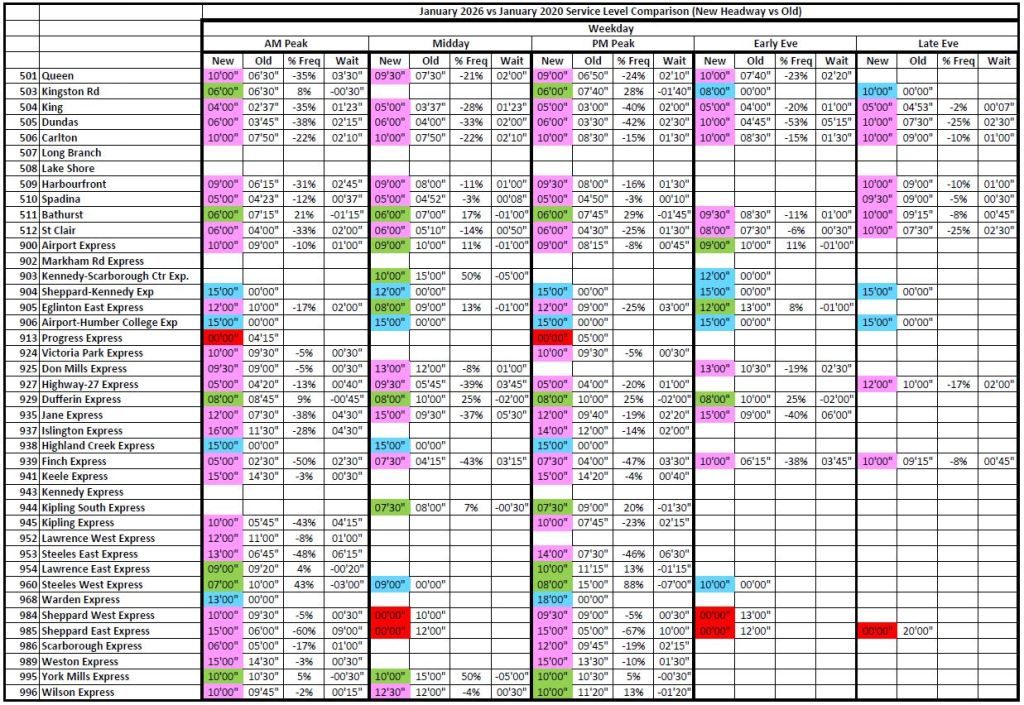
Note that in January 2020, 503 Kingston Road and 505 Dundas operated with buses, and headways then reflected the lower capacity of those vehicles.
Continue reading