
This article reviews the change in travel times and speed profiles on 510 Spadina, 511 Bathurst and 512 St. Clair between October 2019 and October 2025 (pre- and post-pandemic). In almost every case, streetcars are slower today than they were six years ago even though two of the three routes have reserved lanes.
511 Bathurst will soon have red lanes from Fleet to Bloor (except for a section north of Dundas), and I will publish updated charts for that route when the lane changes are in place.
By October 2019, streetcar service was almost completely operated with the new Flexity cars, and so the change over time is not explained with a comparison between the sprightlier CLRVs and the newer cars. (For 512 St. Clair, I have also included a comparison with the CLRV era to show the effect of the vehicle change separate from the pre/post pandemic change in traffic conditions.)
TTC is overly fond of laying blame for transit vehicle speeds on “traffic congestion”, but that is too simplistic an analysis especially for routes with reserved lanes. They also have a bad habit of presenting data without the granularity needed to identify patterns and problems by time of day and location. There are many charts in the main part of this article, but they are intended to show each route in detail.
One important point is that it is impossible to know how much change in speed comes from a more cautious operating philosophy as opposed to traffic conditions. There is, of course, the slow operation through junctions, but that does not explain slower travel on straight track with no special work. Traffic signal effects also show up, particularly in time spent holding nearside at intersections and then again at farside stops. Some areas are inherently slower than others such as Spadina from Queen south with many close-spaced intersections and signals that generally favour east-west traffic. The situation is particularly bad between Front and Queens Quay where the primary job of signals is to handle traffic to/from the Gardiner Expressway.
Any move to speed up operations on streetcar routes requires more than quick fixes like stop eliminations, and detailed block-by-block reviews are needed. In some cases there will be trade-offs between transit and other road users. Arguments for better priority will fare better if and when the TTC improves service so that there are actually transit vehicles to prioritize.
Introduction
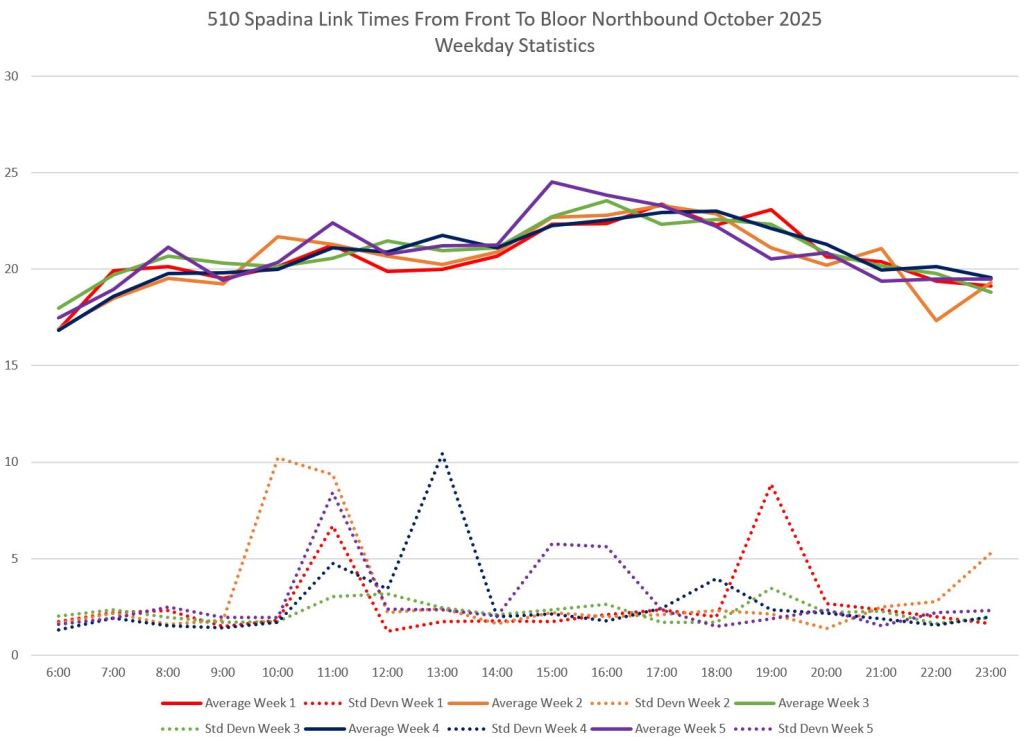
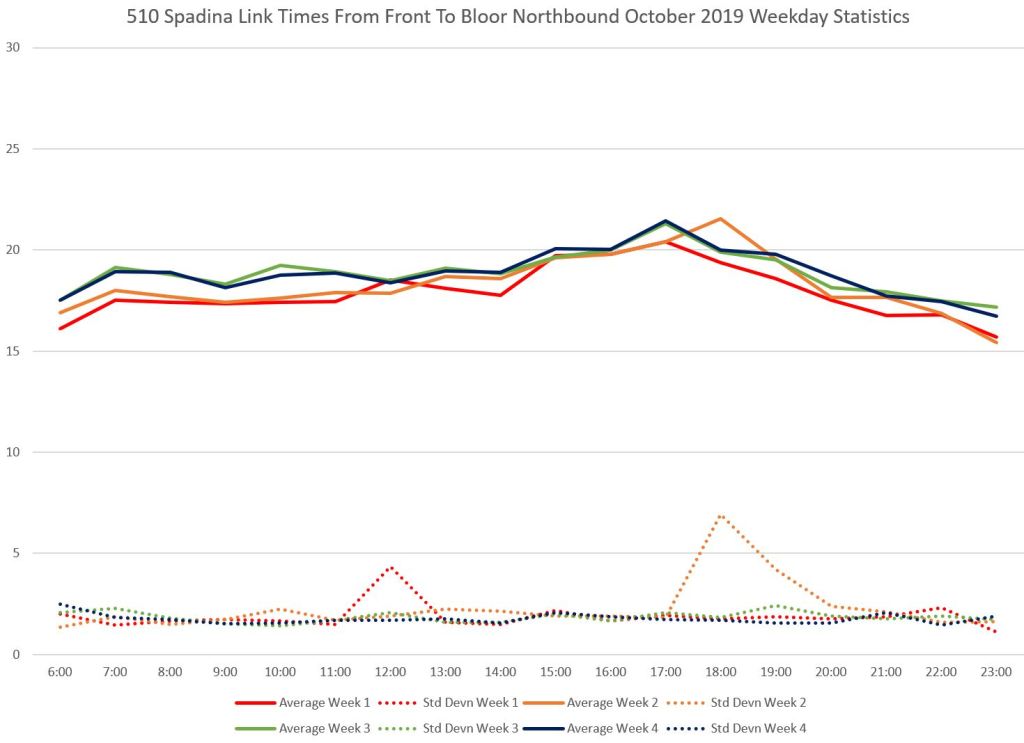
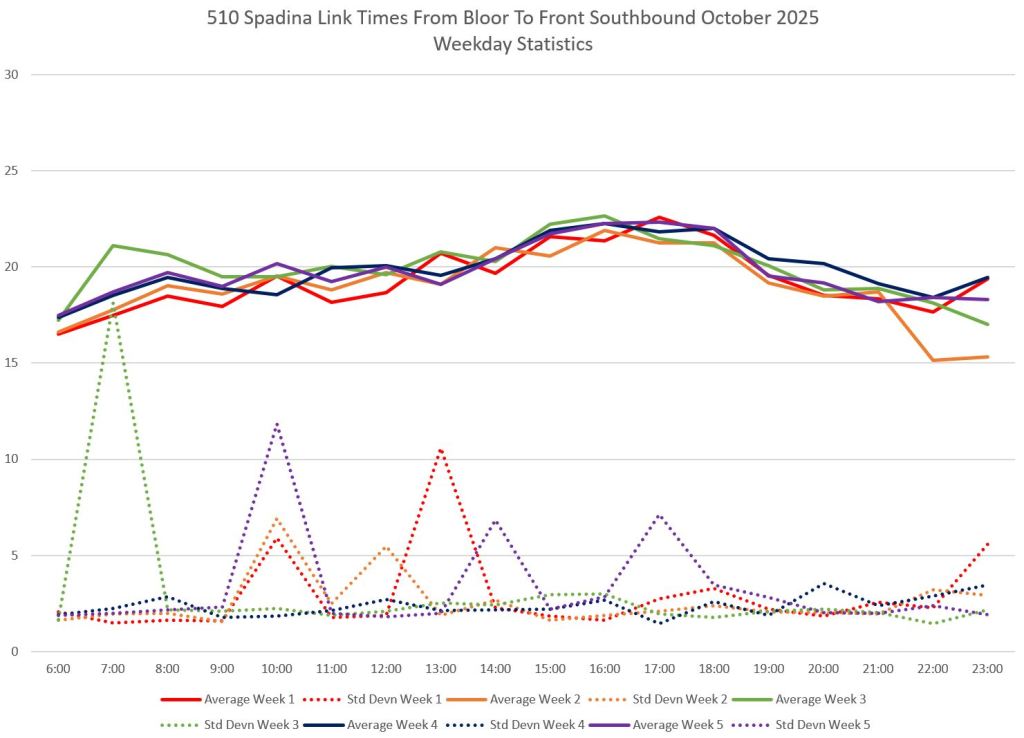
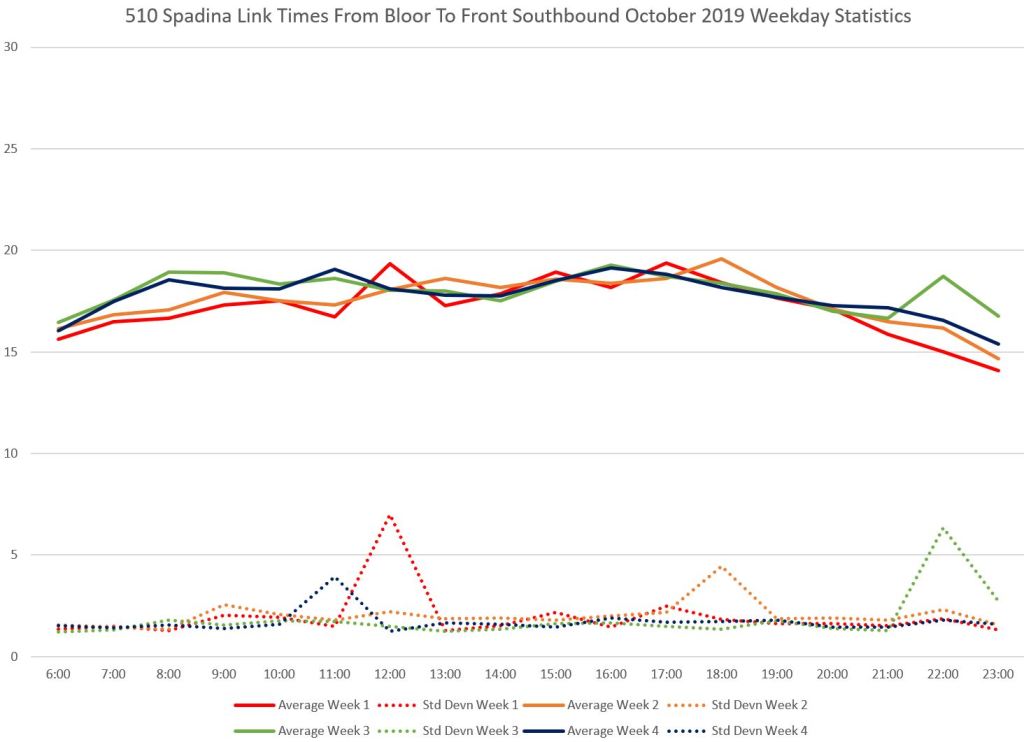
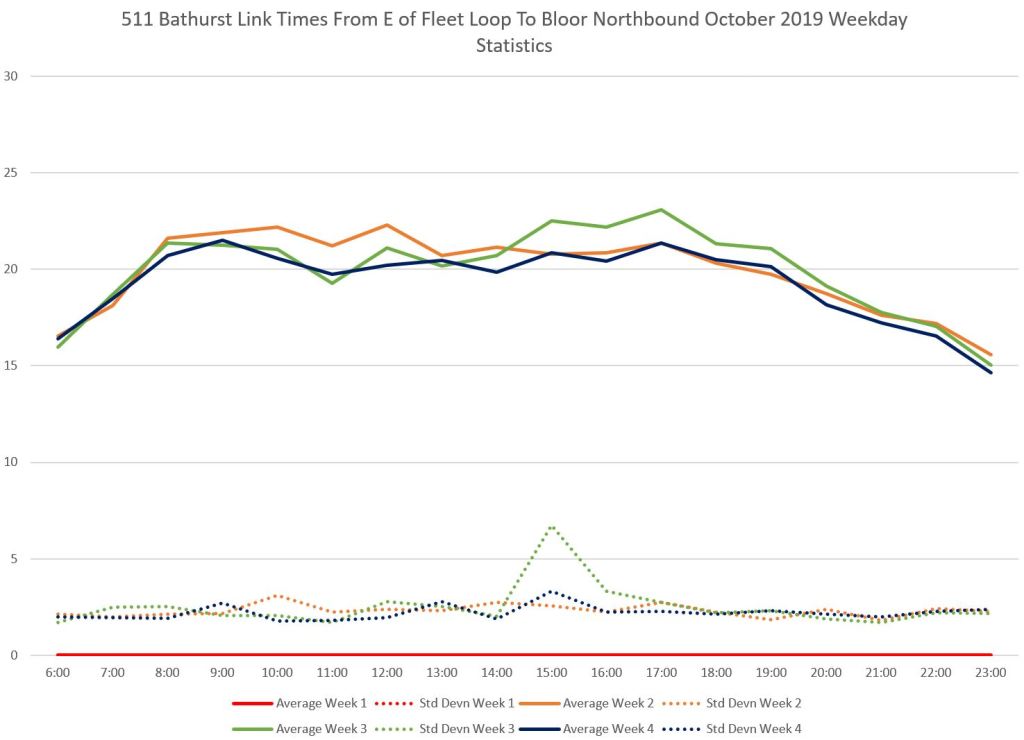
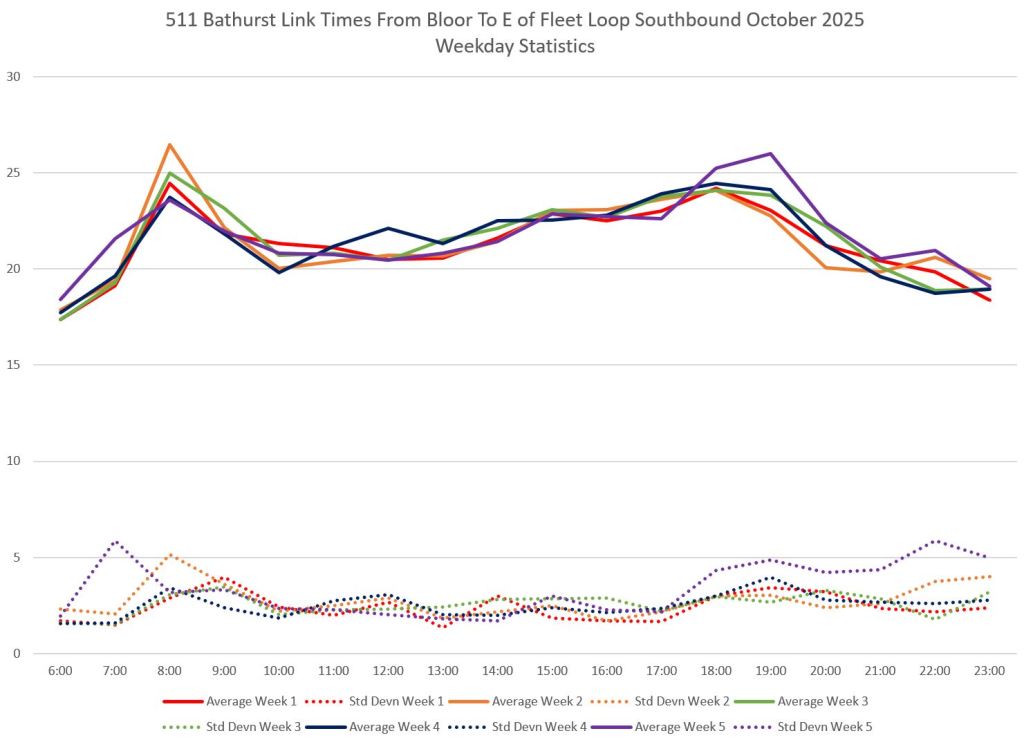
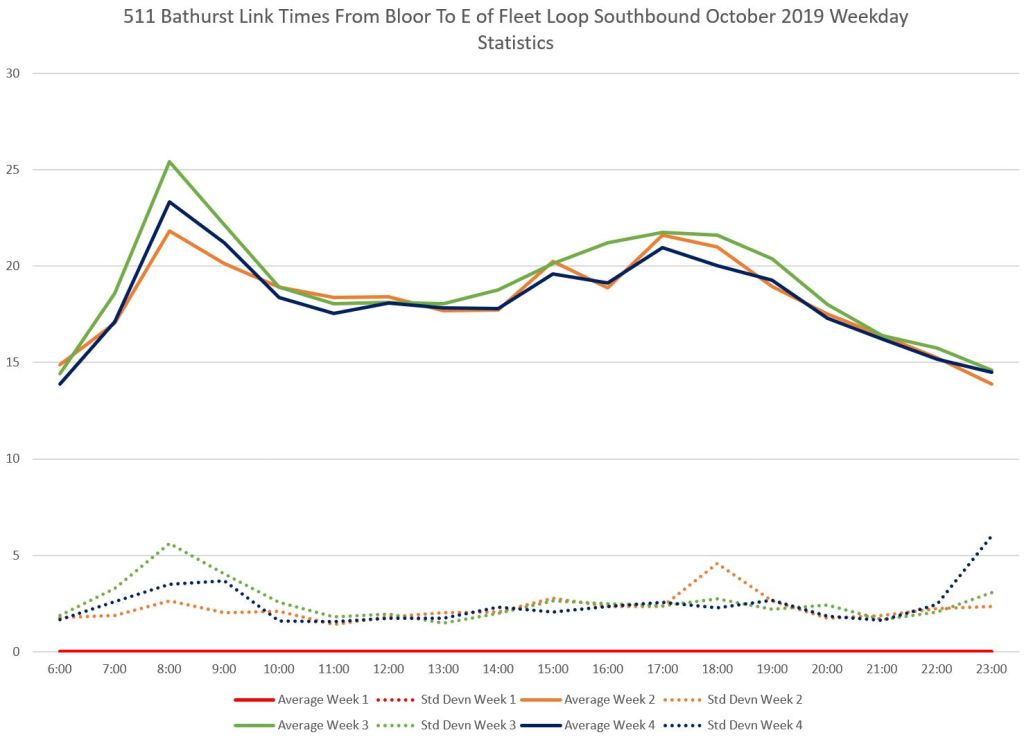
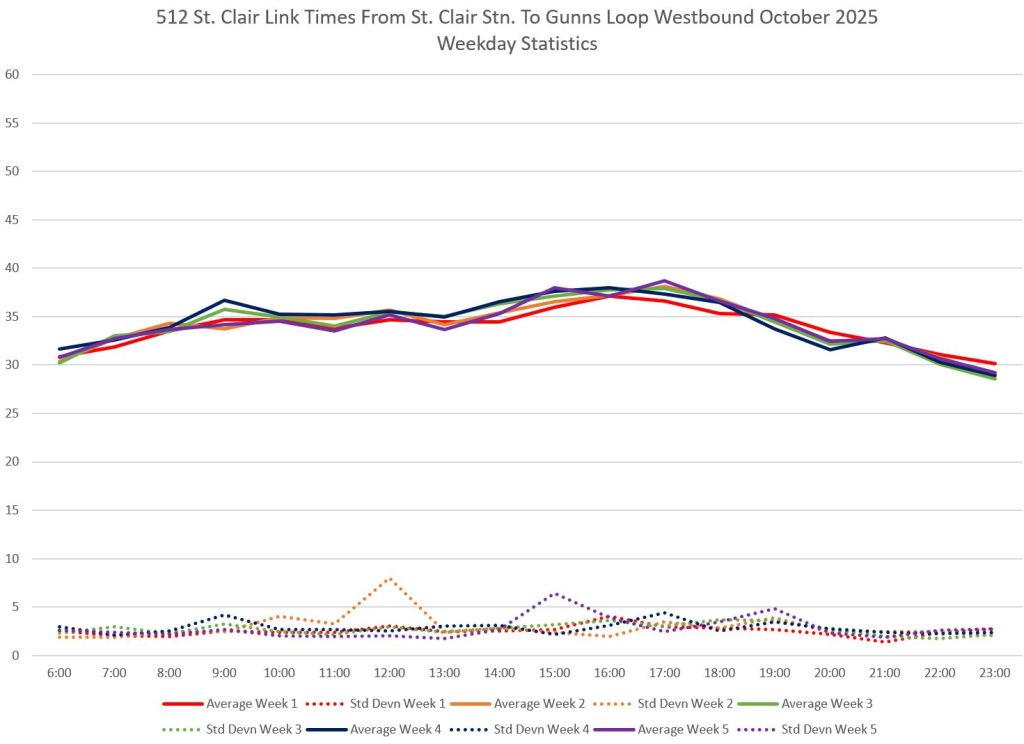
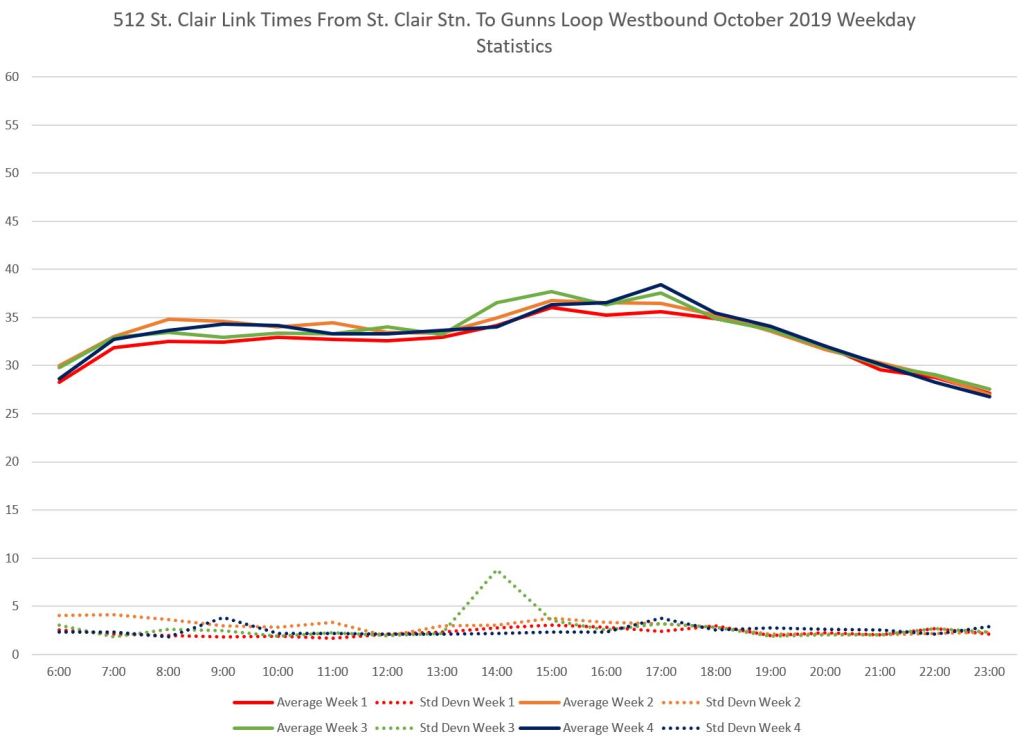
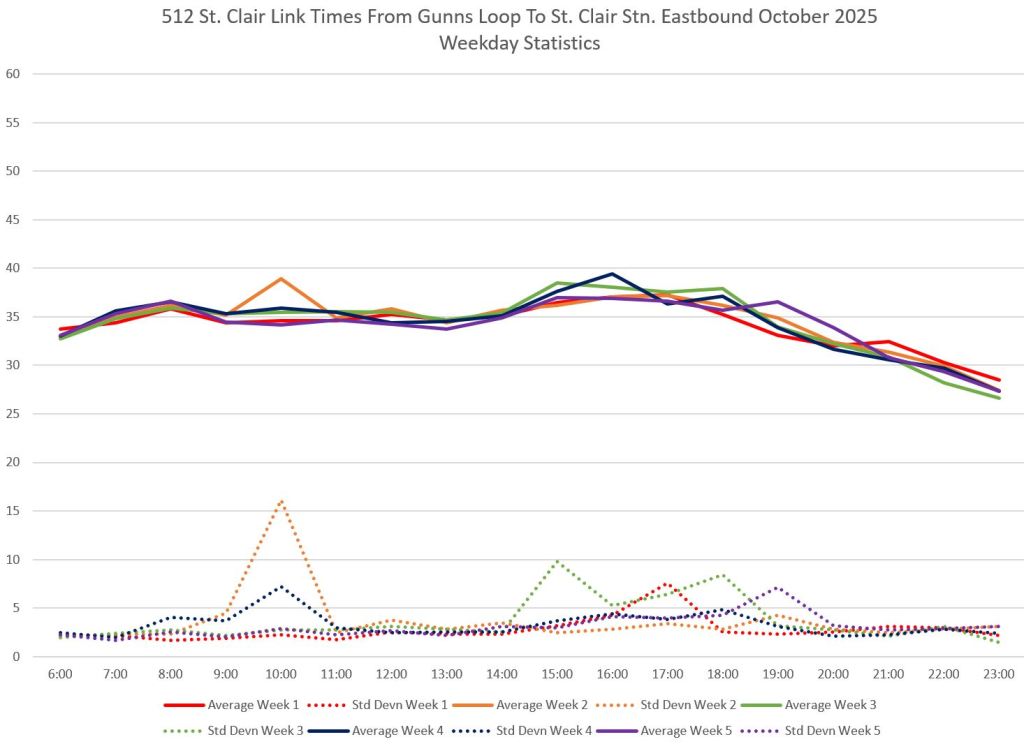
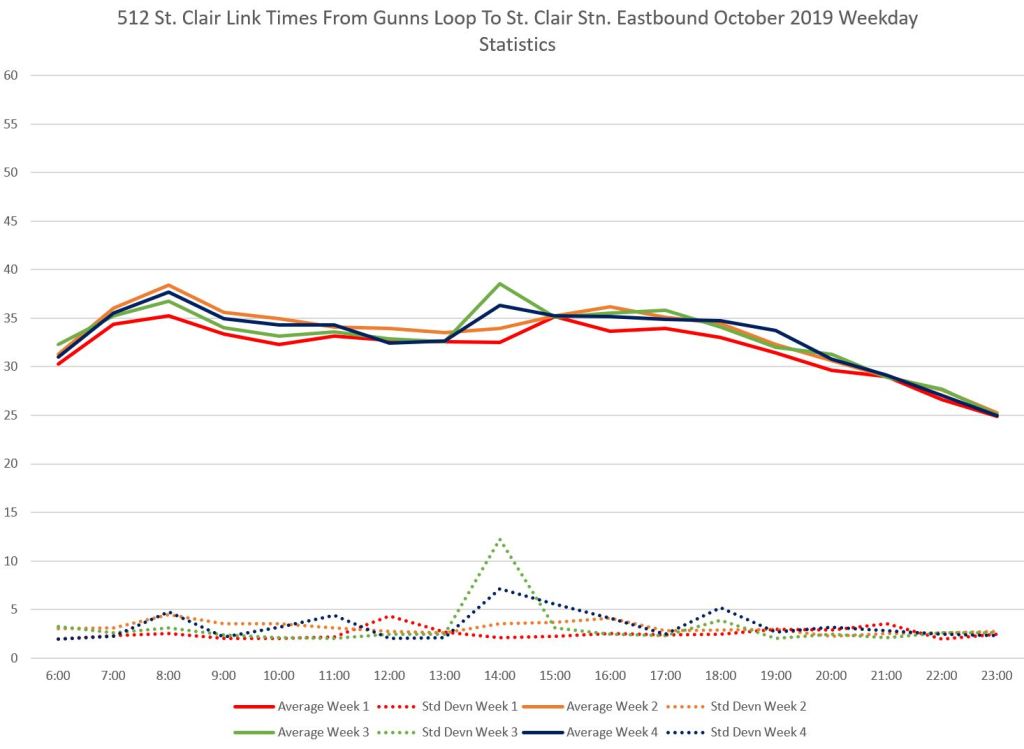
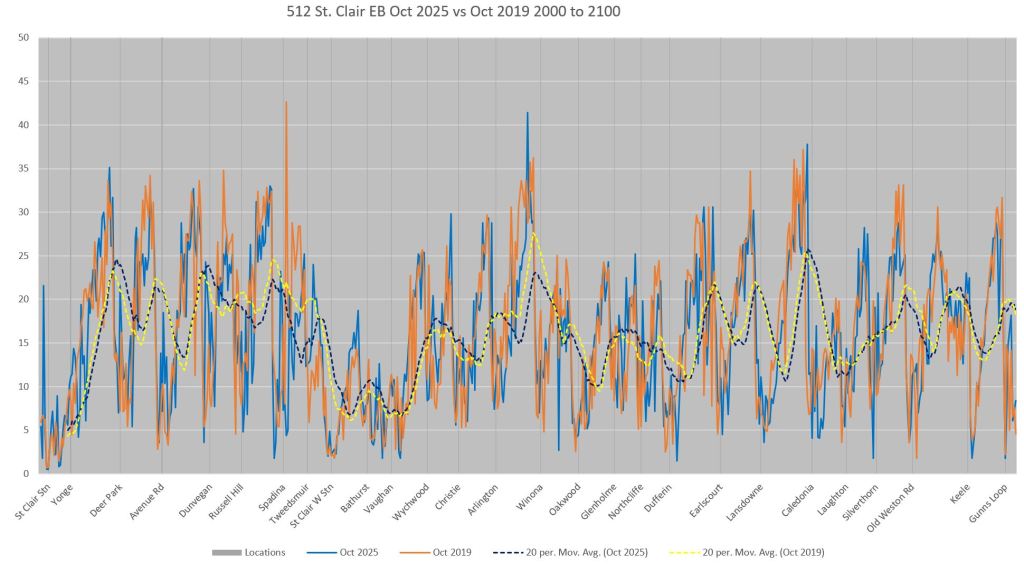
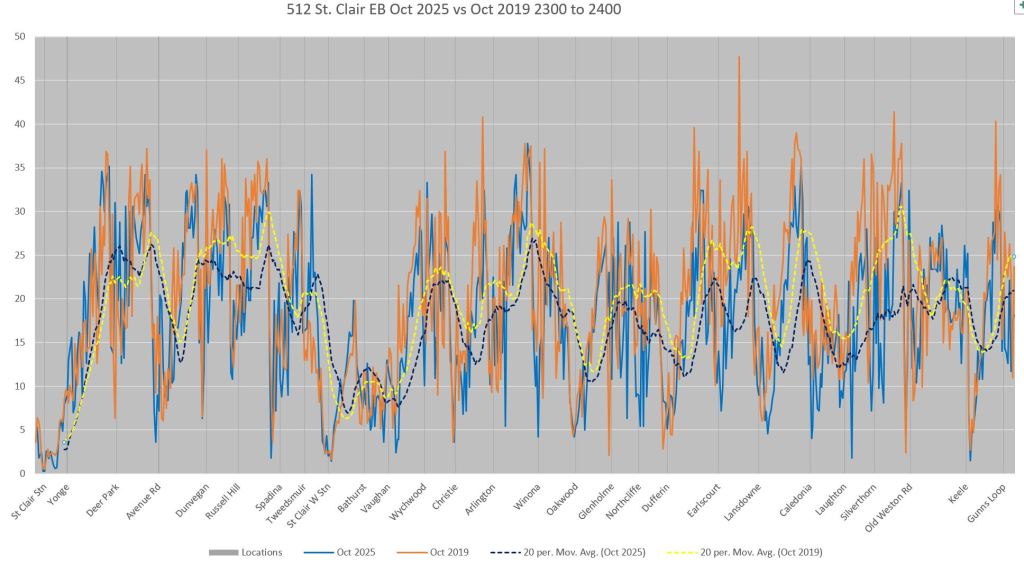
There are two sets of charts for each route. The first compares end-to-end times over a substantial portion of each route for October 2025 (left) and 2019 (right). There are small week-to-week variations, but in almost all cases, the 2025 values are higher.
The dotted lines show standard deviations of travel times, and a wider scatter in individual travel times is reflected in the SD values. With the SD values typically sitting at 2-3 minutes, this means that most of the trips lie in a band 4-6 minutes wide. I have omitted scatter charts of all of the data here to avoid chart overload for readers.
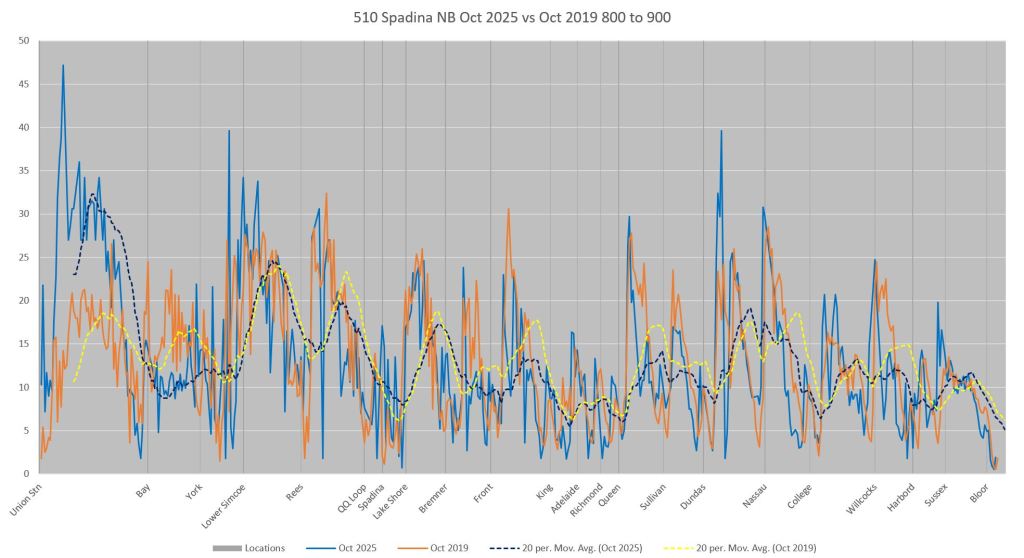
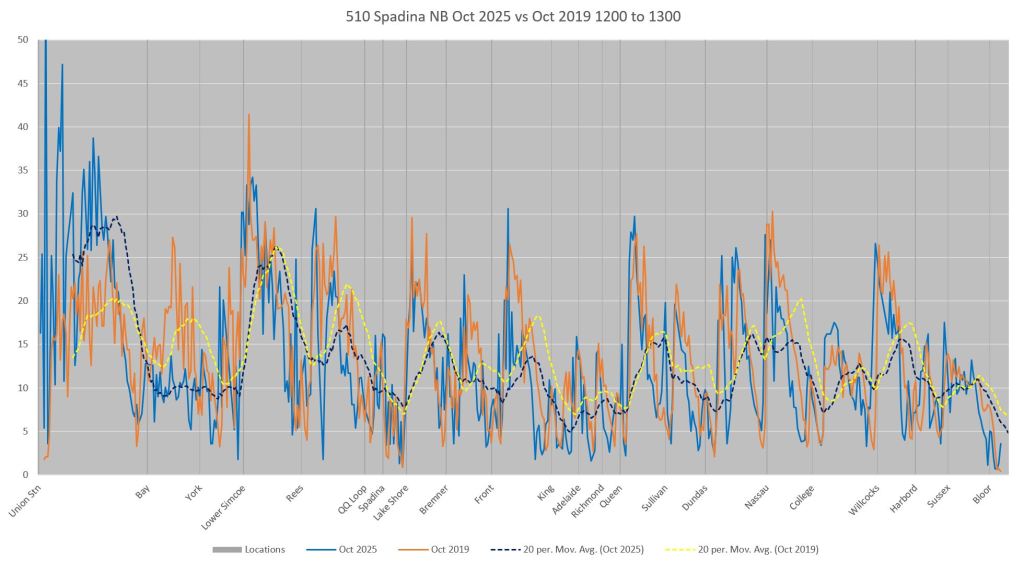
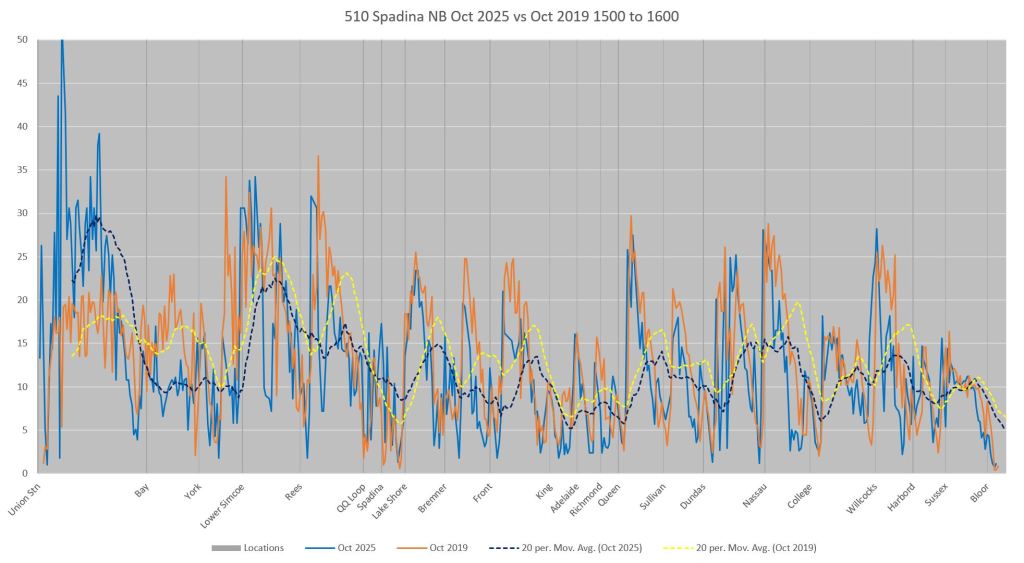
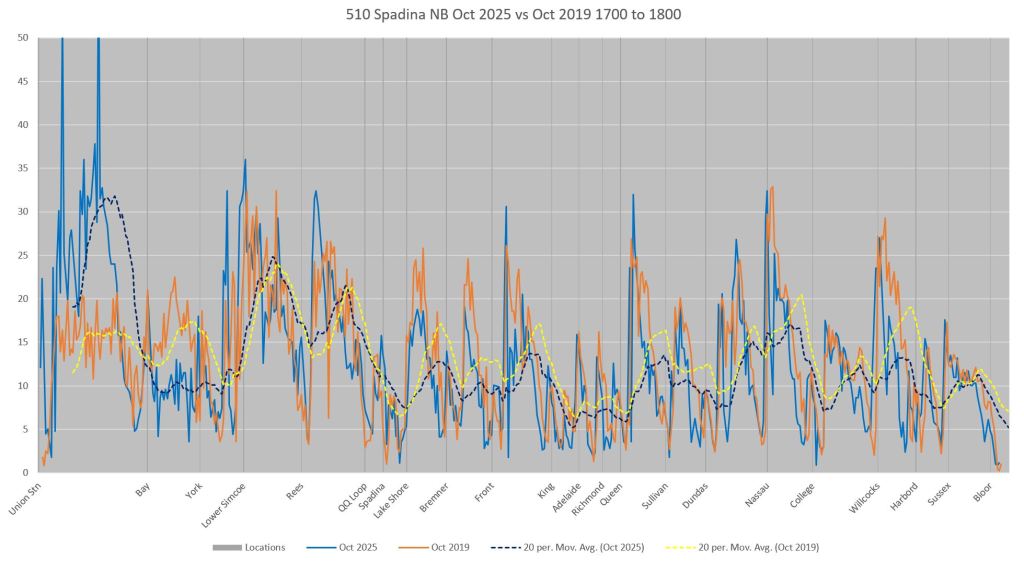
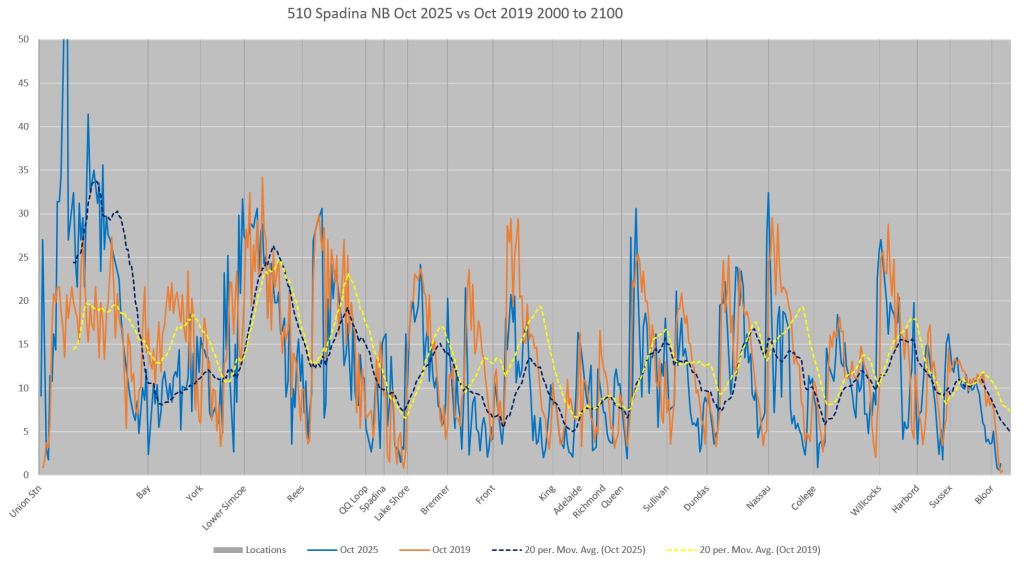
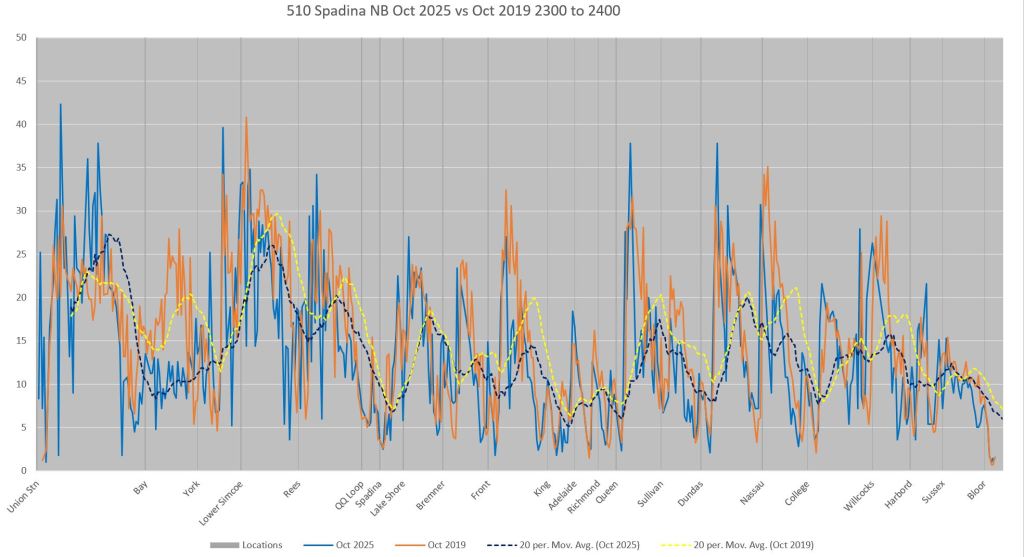
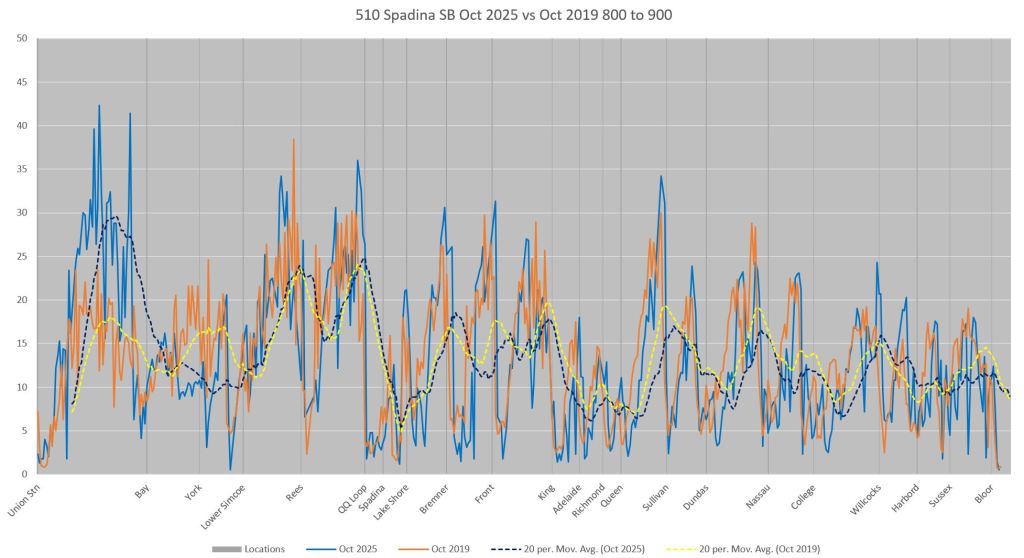
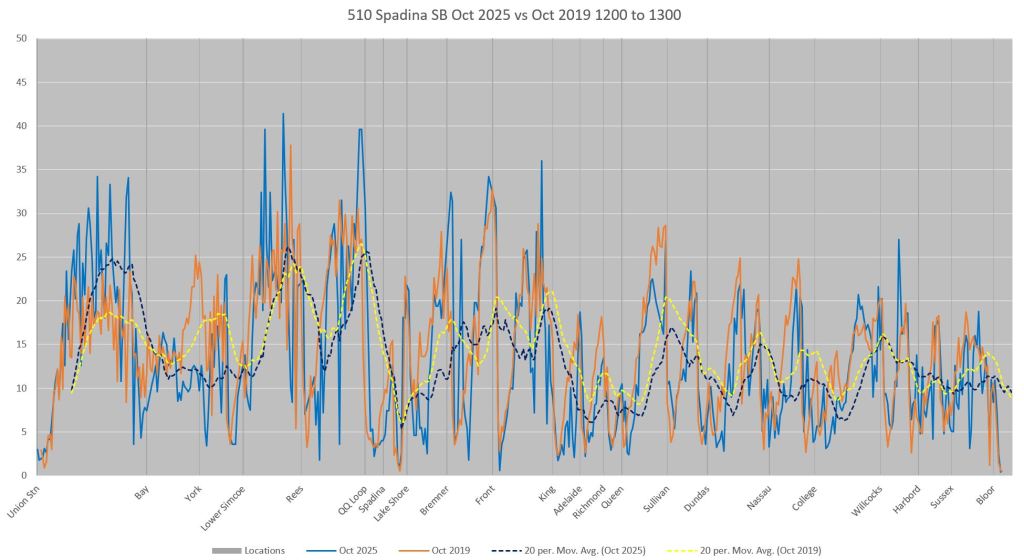
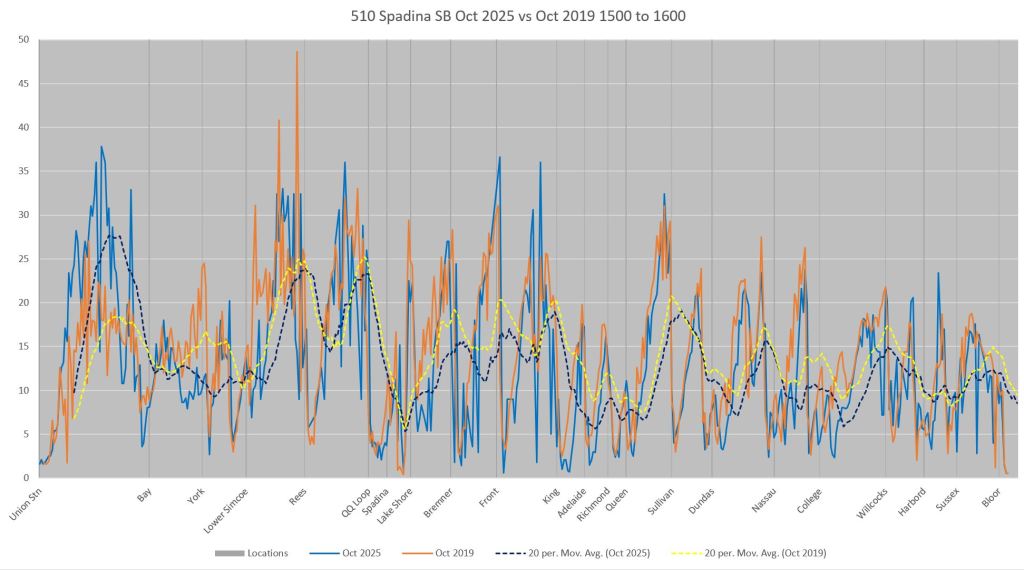
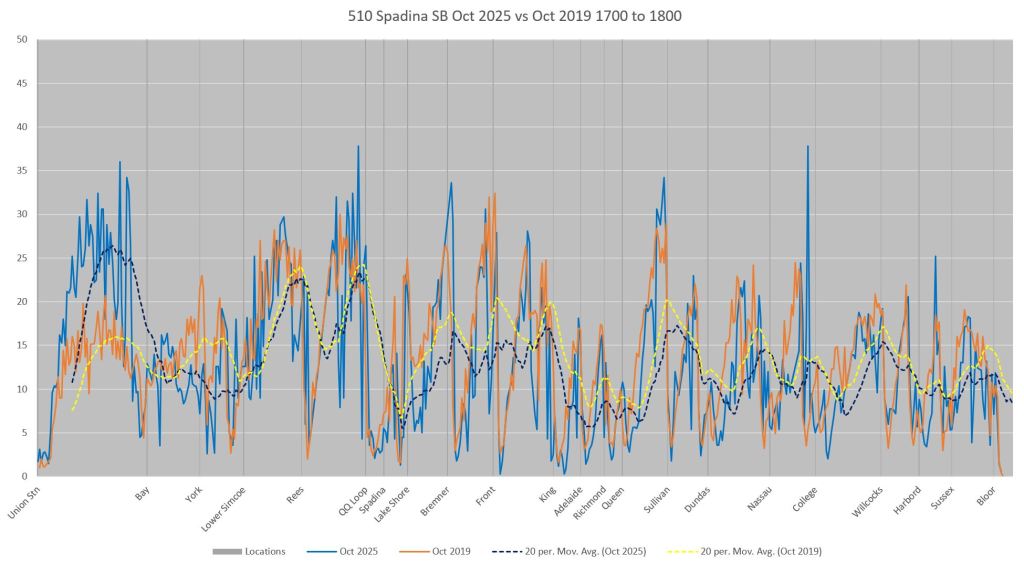
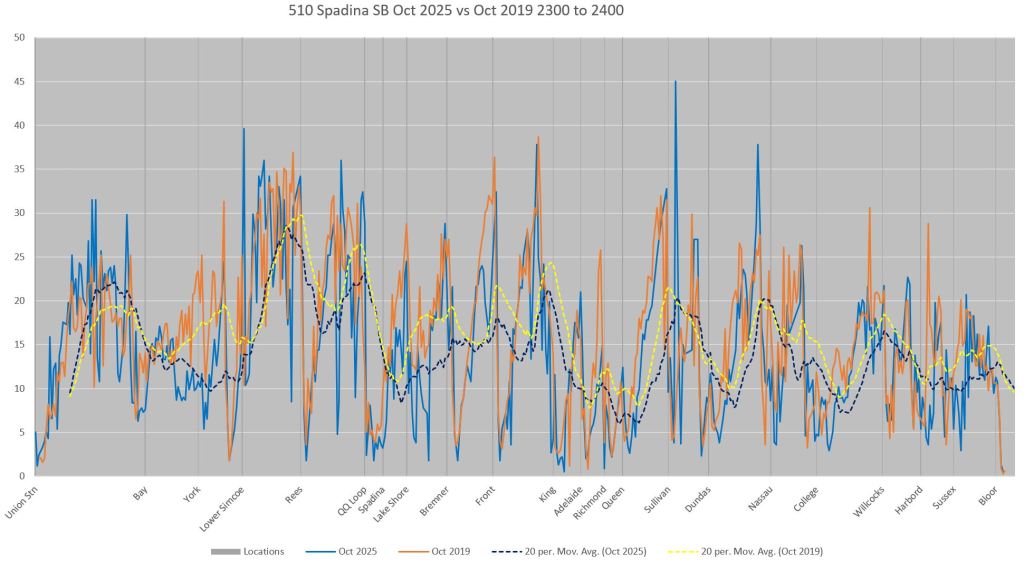
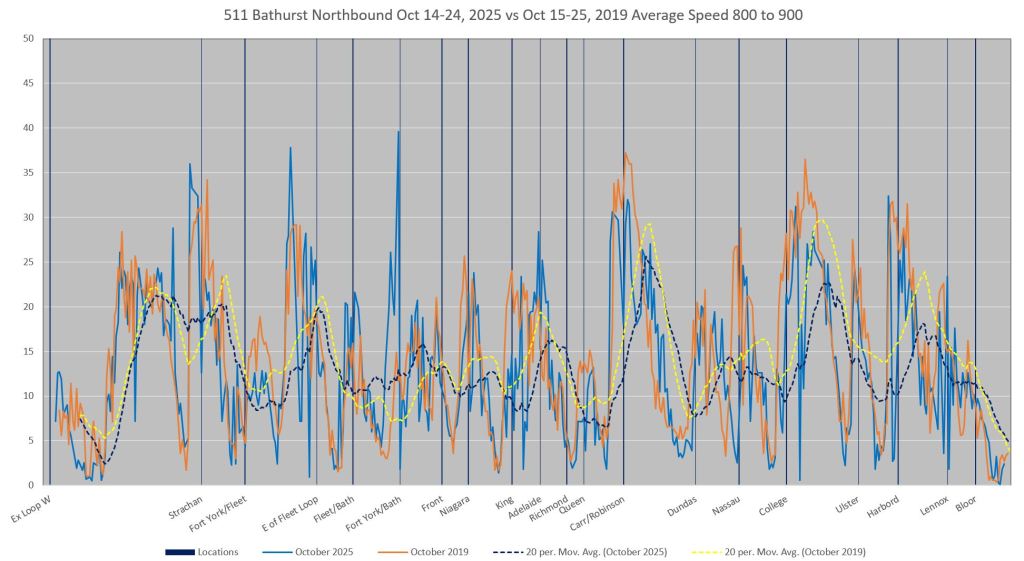
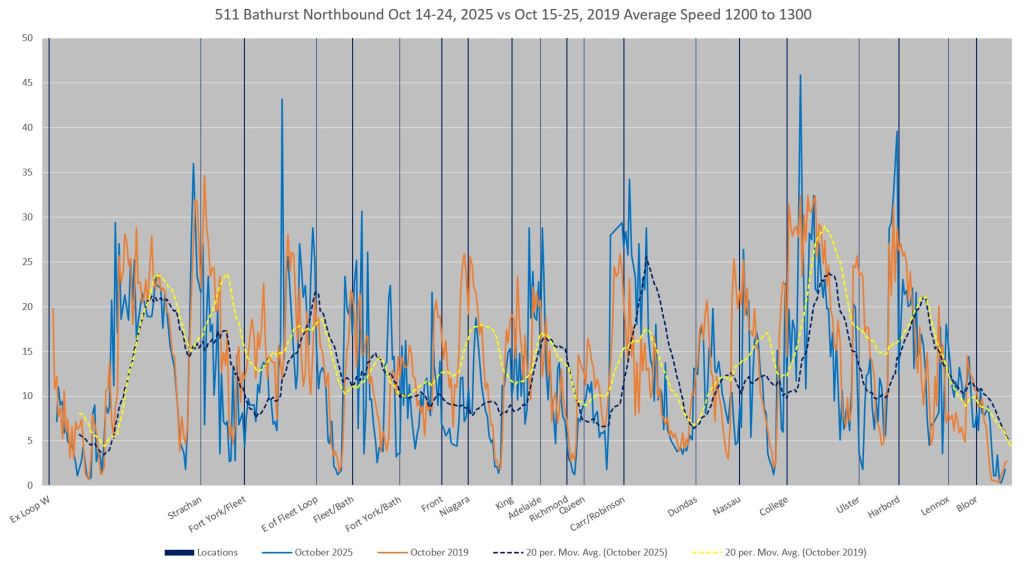
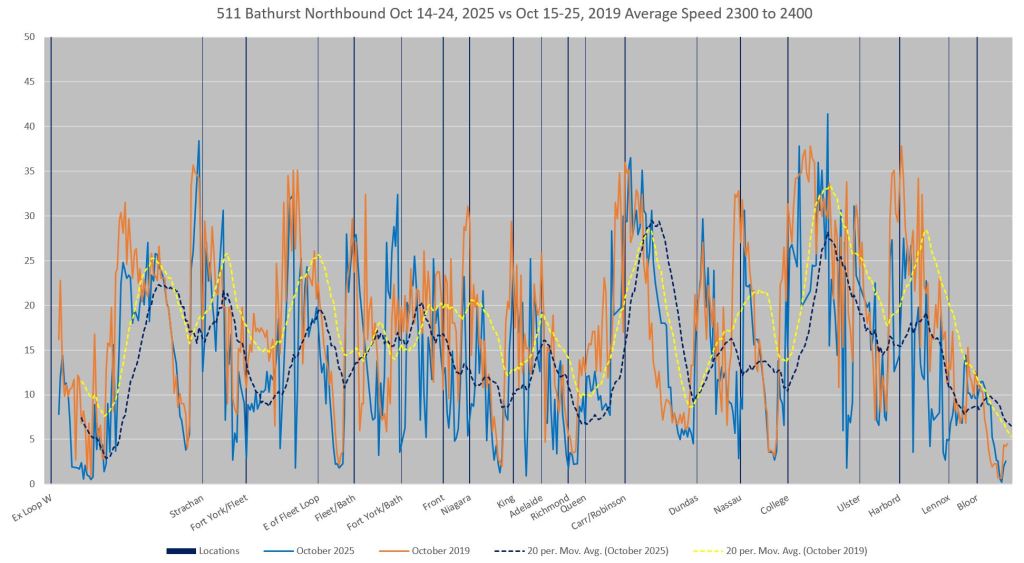
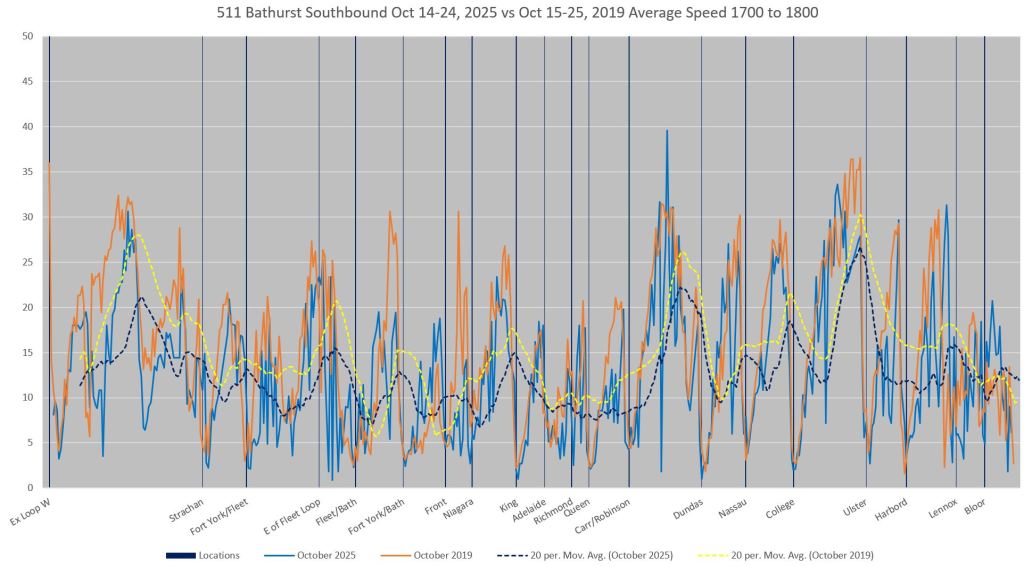
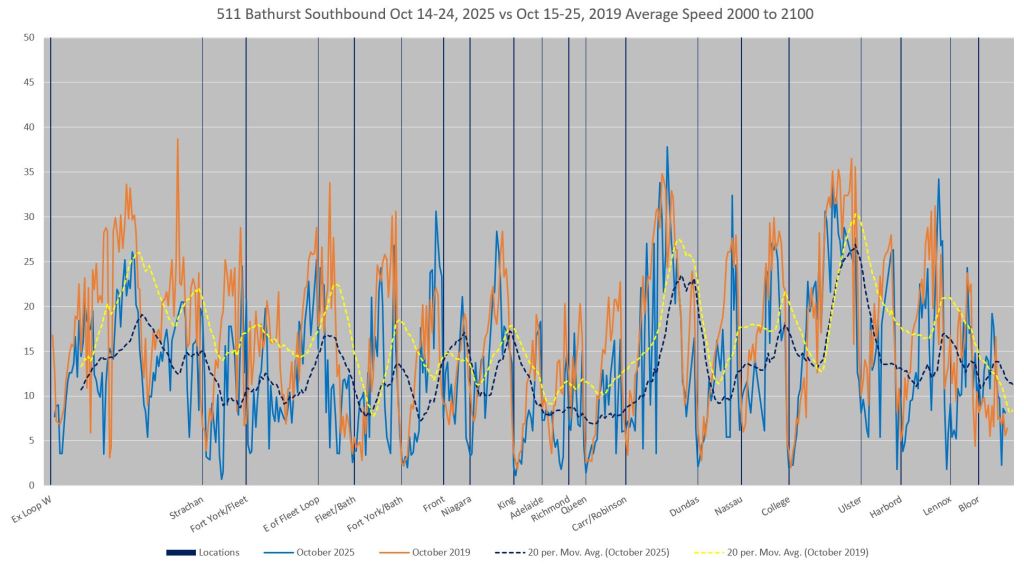
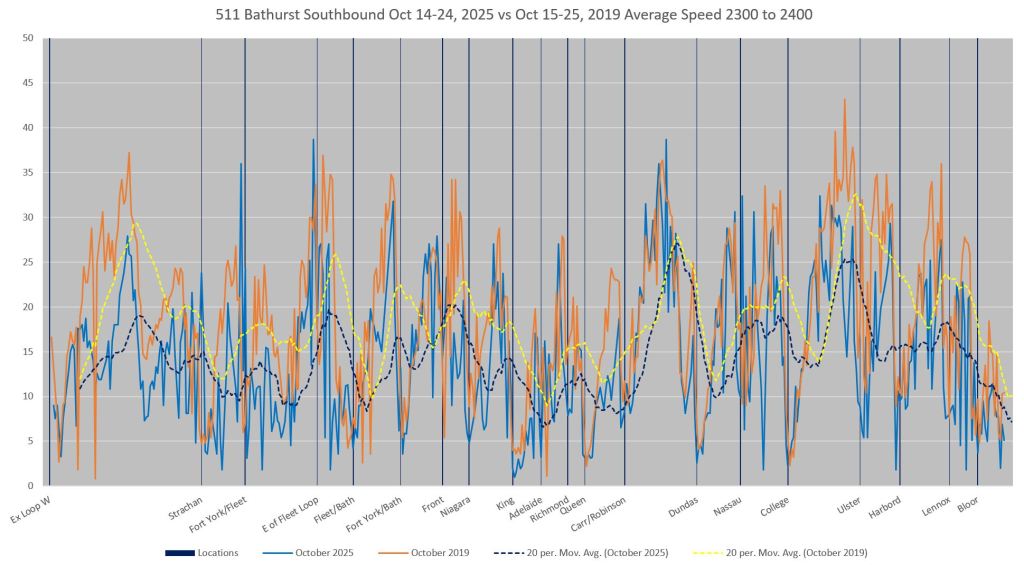
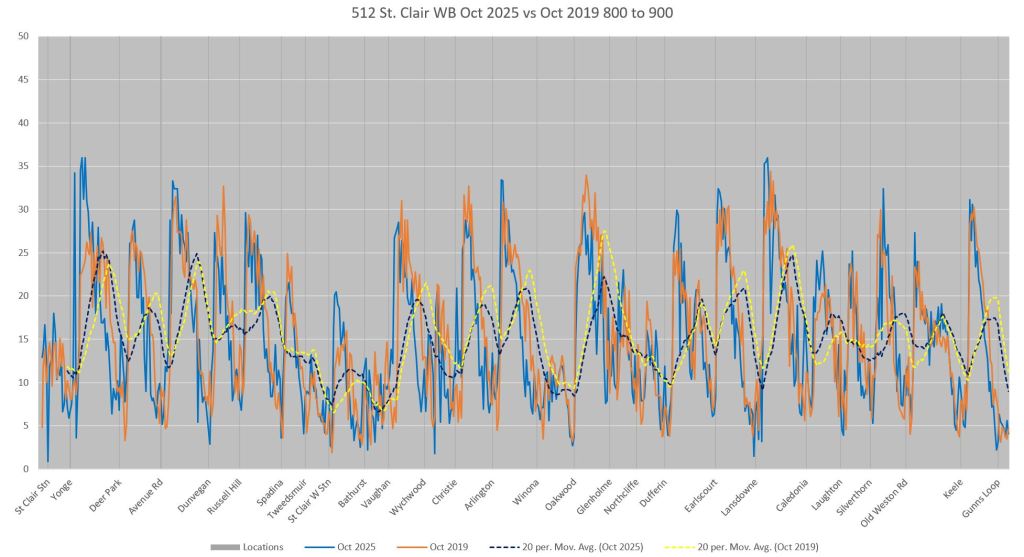
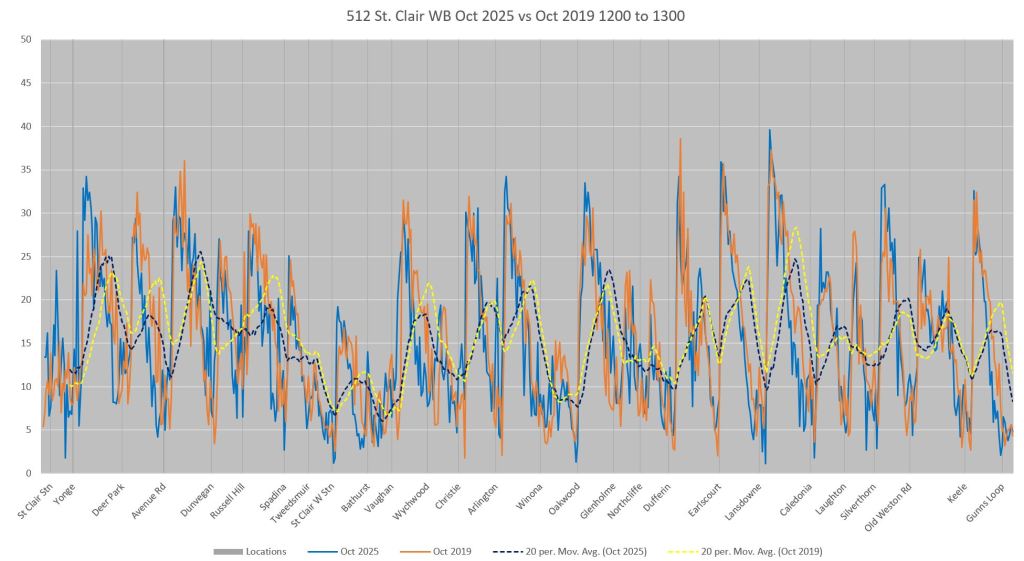
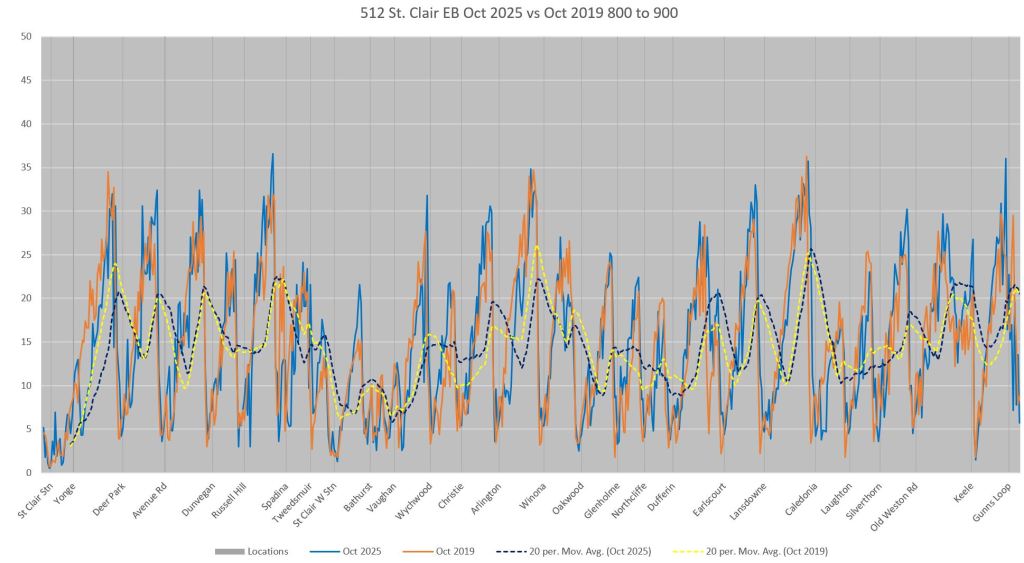
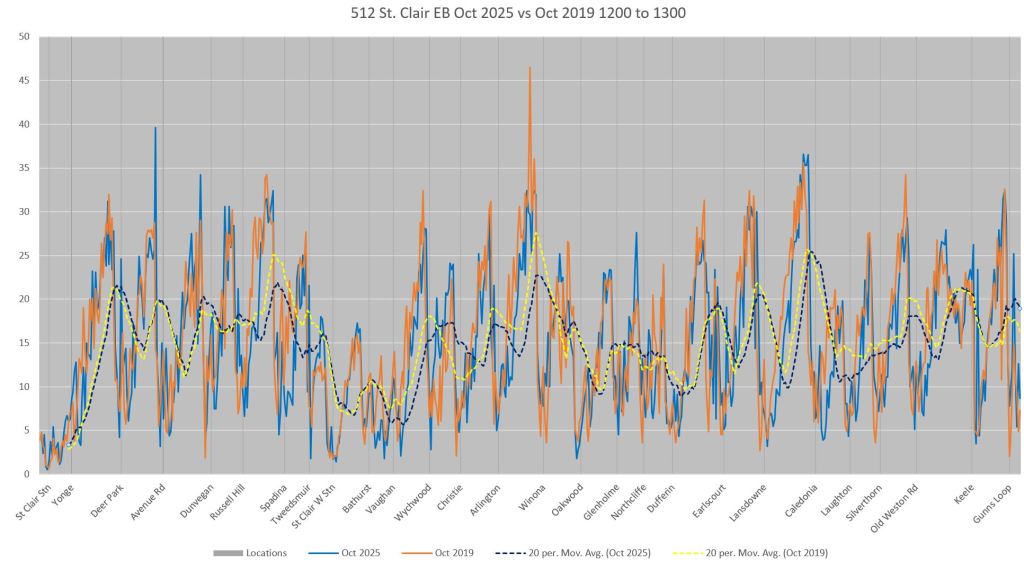
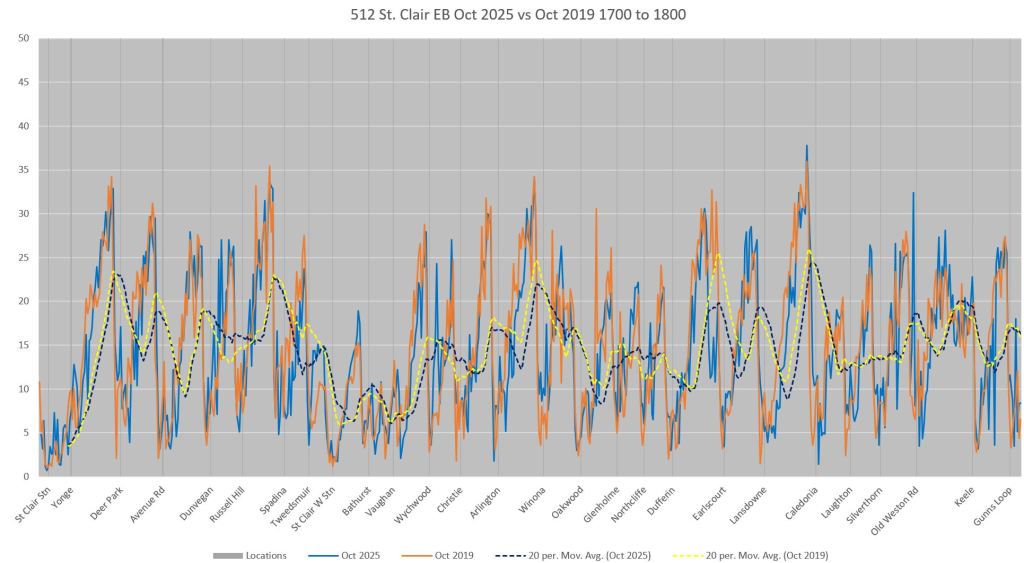
The second set of charts plots travel speeds along the route. There are four lines on each chart:
- Solid blue: Average speed at each point (10m segment) on weekdays from October 14-24, 2025.
- Solid orange: Average speed at each point on weekdays from October 15-25, 2019.
- Dashed blue: Moving average values for 2025 over 20 data points (200m).
- Dashed yellow: Moving average values for 2019 over 20 data points.
Travel is from left to right for westbound and northbound trips, and right to left for eastbound and southbound. There is a regular pattern of dips at stops and intersections, double dips in the case of farside stops where streetcars are often held on the approach to an intersection. After each peak (the faster operation when cars pull away from stop), speeds slope down in the direction of travel as they approach the next traffic signal or transit stop. All speeds are shown in km/hr.
Note that the 2019 speeds are generally above the 2025 values and this persists even late in the evening.
510 Spadina
Travel Time Between Front and Bloor
Travel Speeds Between Union and Spadina Stations
Read left to right.
Travel Speeds Between Spadina and Union Stations
Read right to left.

511 Bathurst
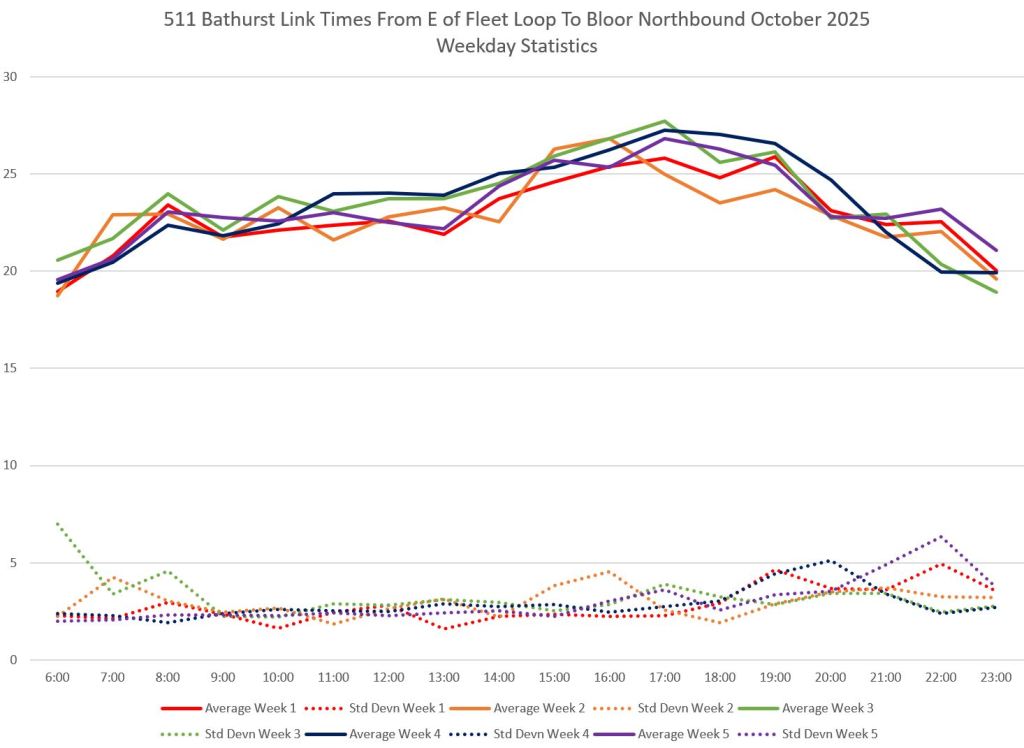
Travel Time Between Fleet and Bloor
Note: In October 2019, the 511 Bathurst service operated with CLRVs. Changes in travel time to 2025 will include both the effect of the vehicle type change and any traffic-induced additional delays that have accumulated.
In October 2019, there are no “Week 1” data. This is related to the migration between old and new tracking systems at TTC underway at the time. The period used for comparison covers Weeks 3 and 4.
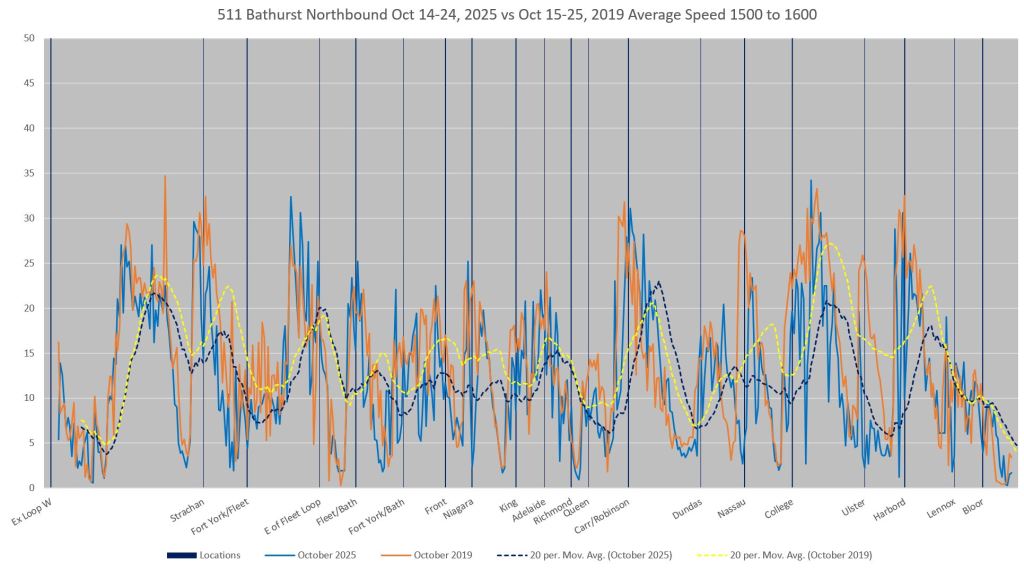
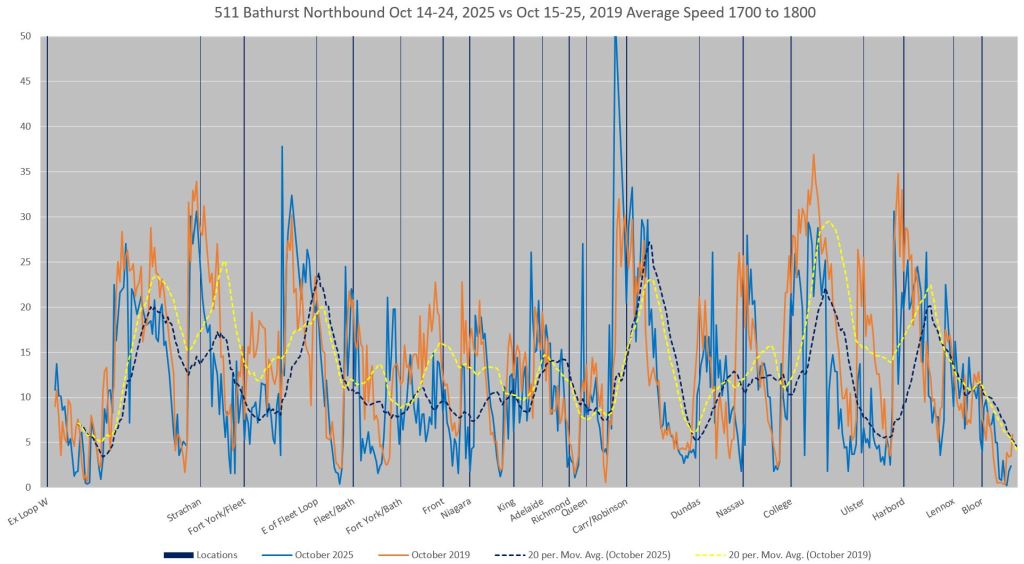
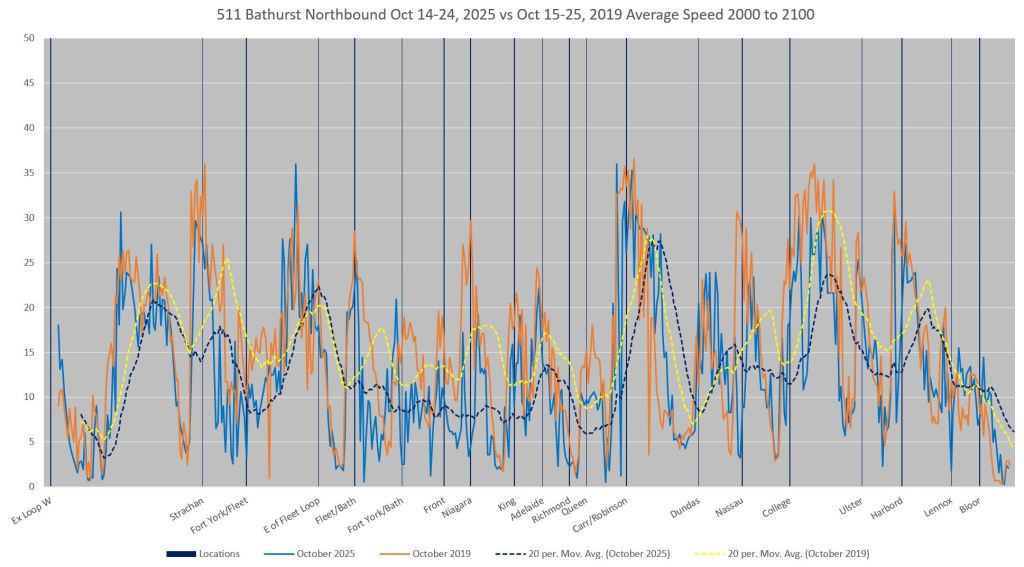
Travel Speeds from Exhibition Loop to Bathurst Station
Read left to right.
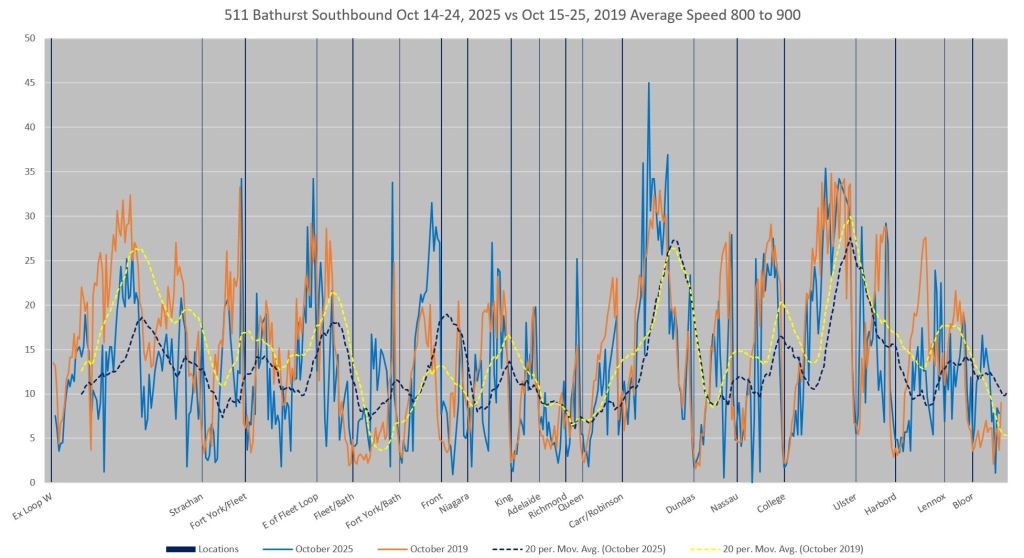
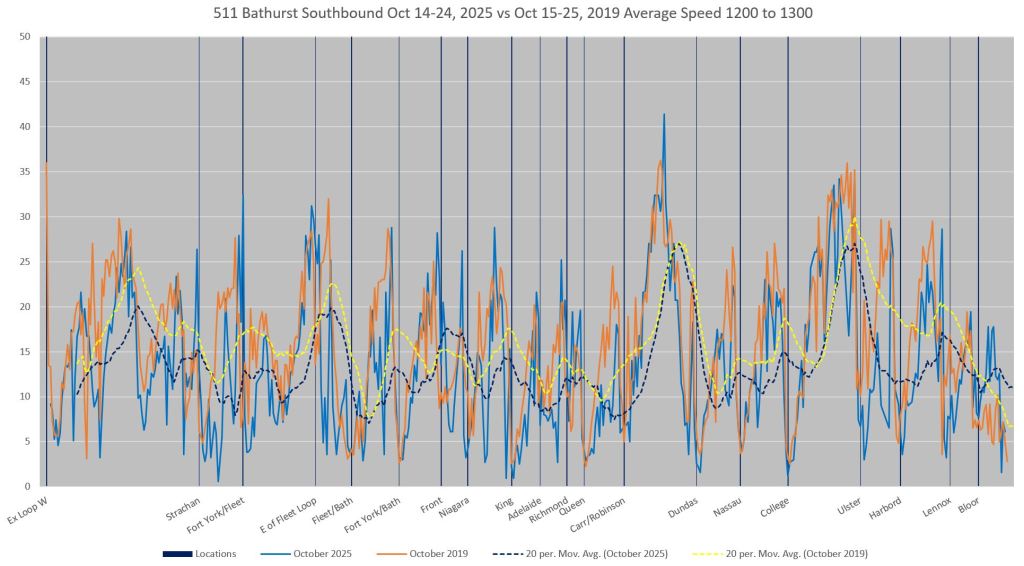
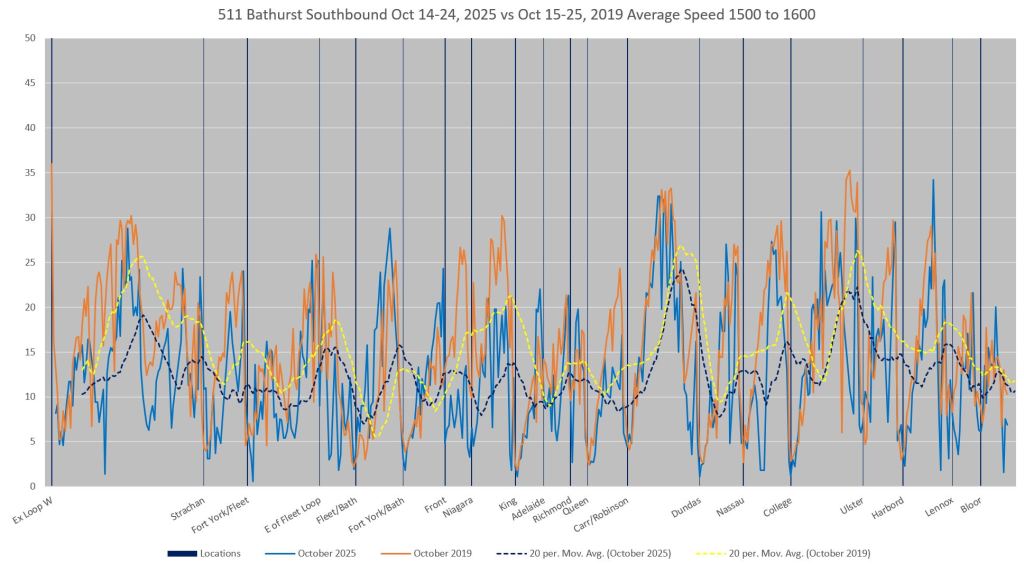
Travel Speeds from Bathurst Station to Exhibition Loop
Read right to left.
Bathurst vs Spadina
Note that the speeds on the north end of 511 Bathurst are generally higher than the corresponding part of 510 Spadina even though the latter has its own right-of-way. Here are the southbound charts for each route presented side-by-side. An important distinction here lies in street geometry, stop location and signalling.
There is the same number of transit stops on both streets from Bloor to Queen southbound, but there are major differences in the the intersections:
- Because Spadina is a wider street (8 lanes) than Bathurst (4 lanes), the east-west green times are longer so that most pedestrians can cross. The transit islands, where they exist on Spadina, are not designed as refuges for two-stage crossing.
- The intermediate stops on Bathurst see less turning road traffic interfering with streetcars than on Spadina. Signals on Bathurst do not have dedicated left turn phases for motorists. Where left turn arrows exist, streetcars can travel straight through in the same direction. Some left turns are banned during part of the day. (This arrangement will change with the Bathurst Street red lanes.)
- Of the eight stops on Spadina, five are farside forcing a double-stop unless a streetcar catches the green signal. There is one intersection on Spadina (St. Andrew) where there is a traffic signal but no stop.
- Spadina cars must slow to round Spadina Crescent, and this has no equivalent on Bathurst.
The Spadina car has the edge in locations where traffic can become congested, and Bathurst cars have no escape. That’s the whole point of reserved lanes – to maintain speed when traffic would otherwise get in the way, not necessarily to allow bullet-speed operations.
512 St. Clair
Although there are faster trip times in 2019 (right) than 2025 (left), the difference is less marked than on other routes.
Travel Times Between St. Clair Station & Gunn’s Loop
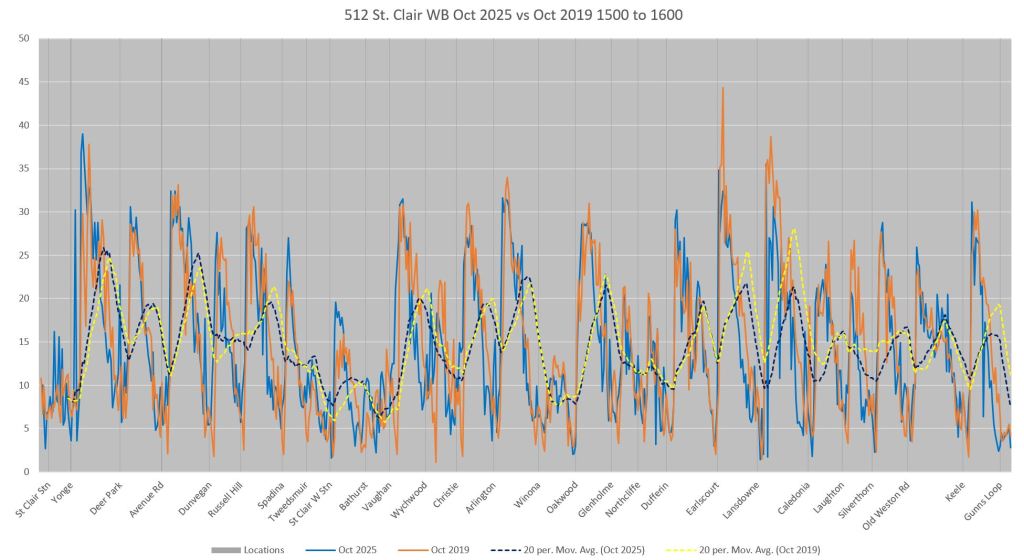
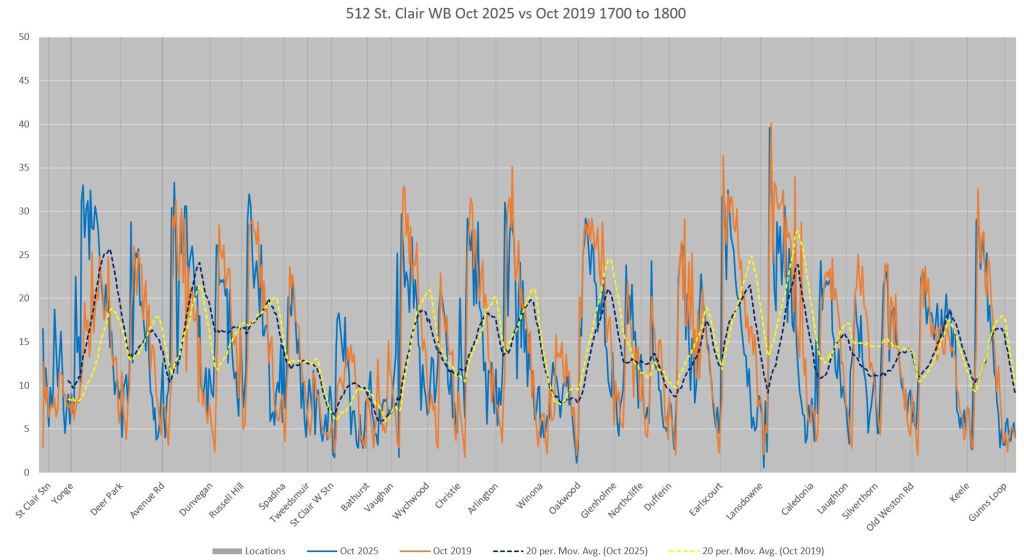
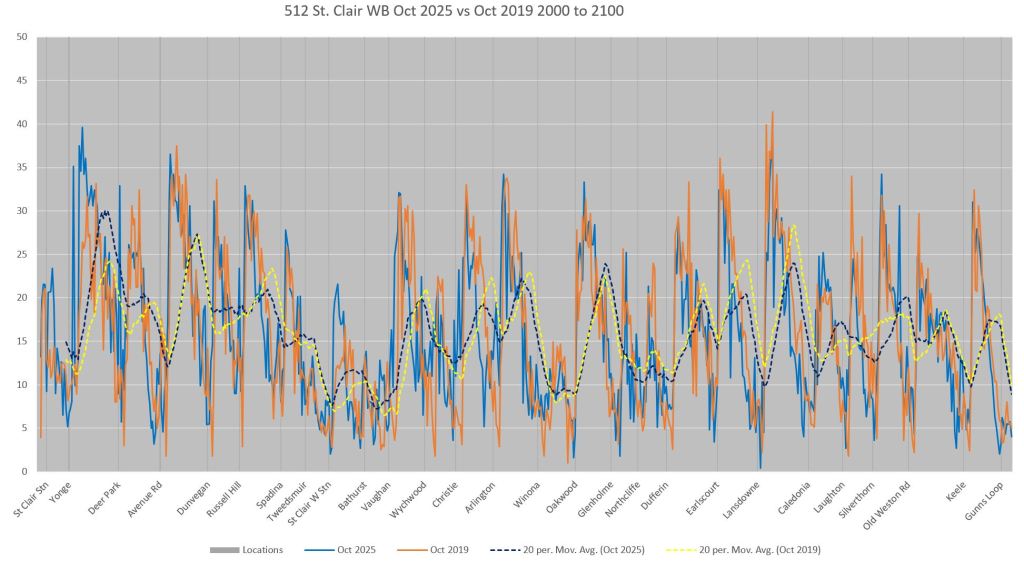
Travel Speeds from St. Clair Station to Gunn’s Loop
Read left to right.
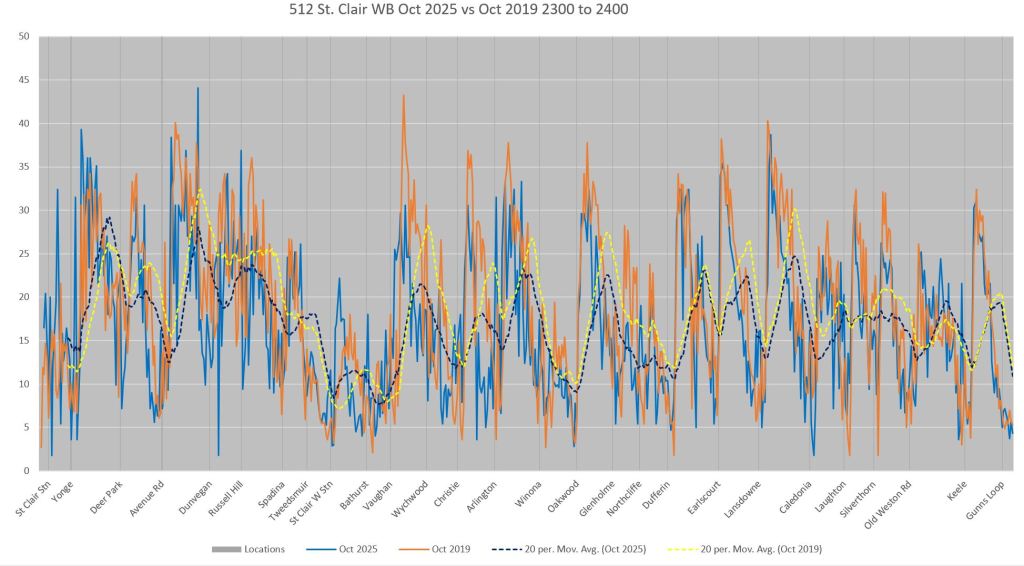
Travel Speeds from Gunn’s Loop to St. Clair Station
Read right to left.

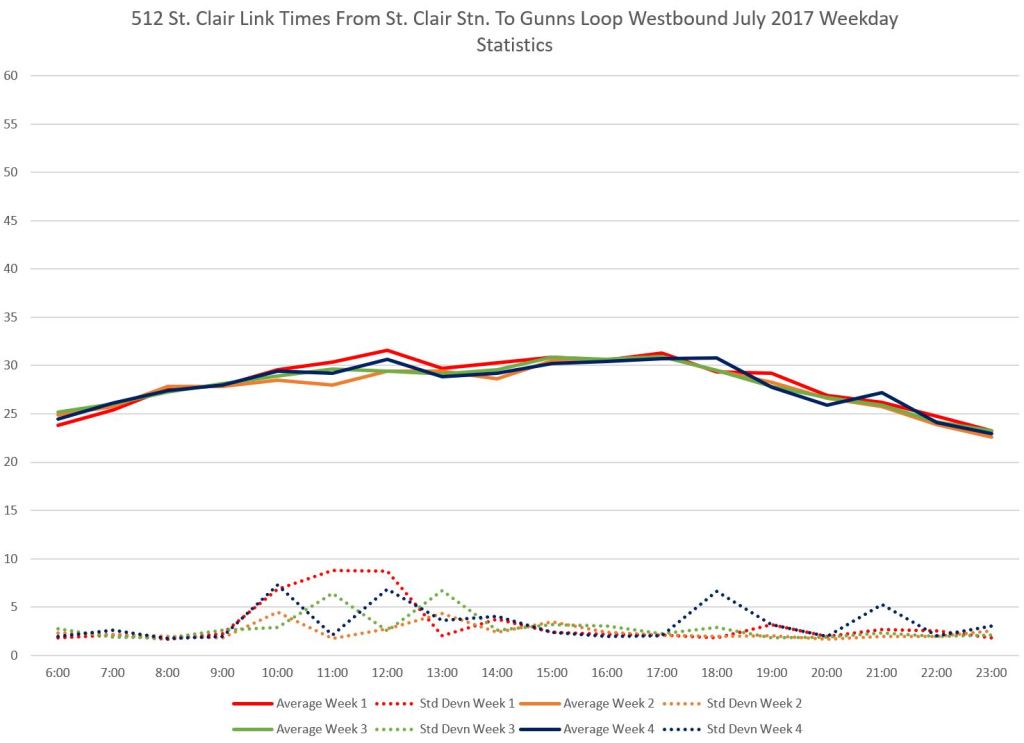
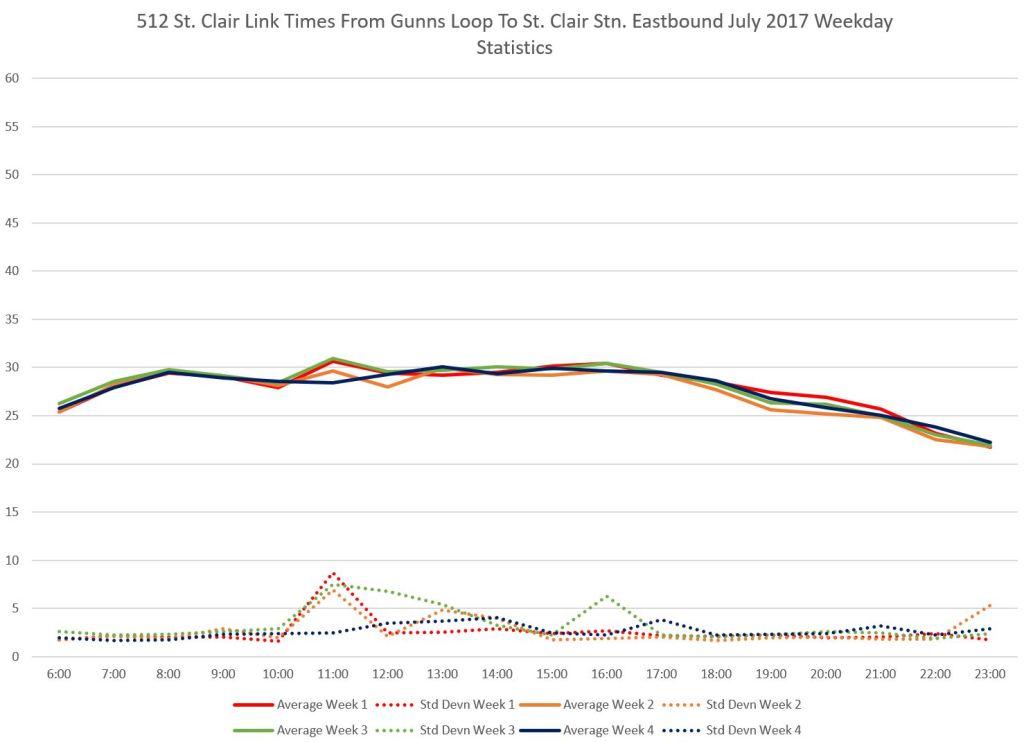
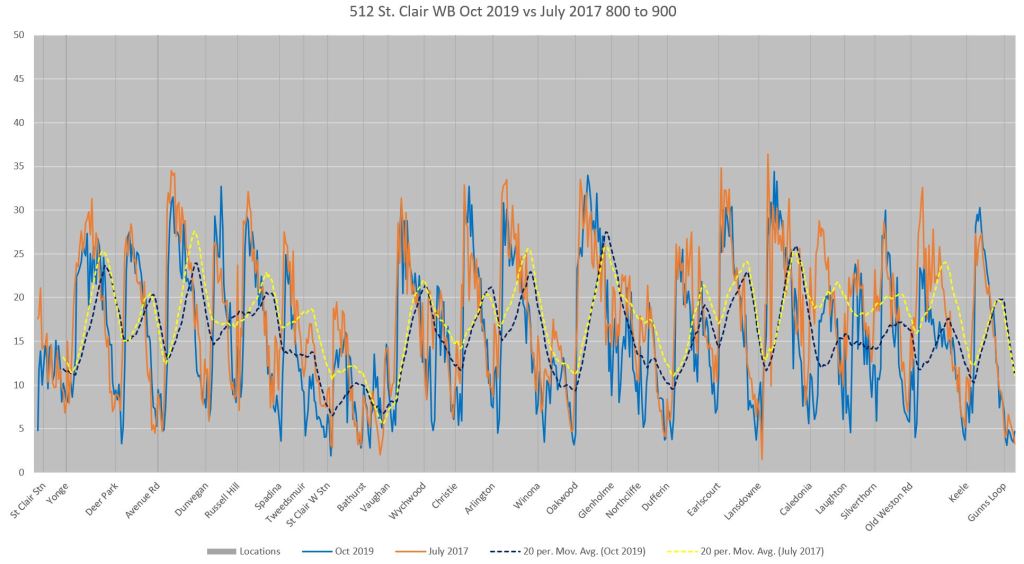
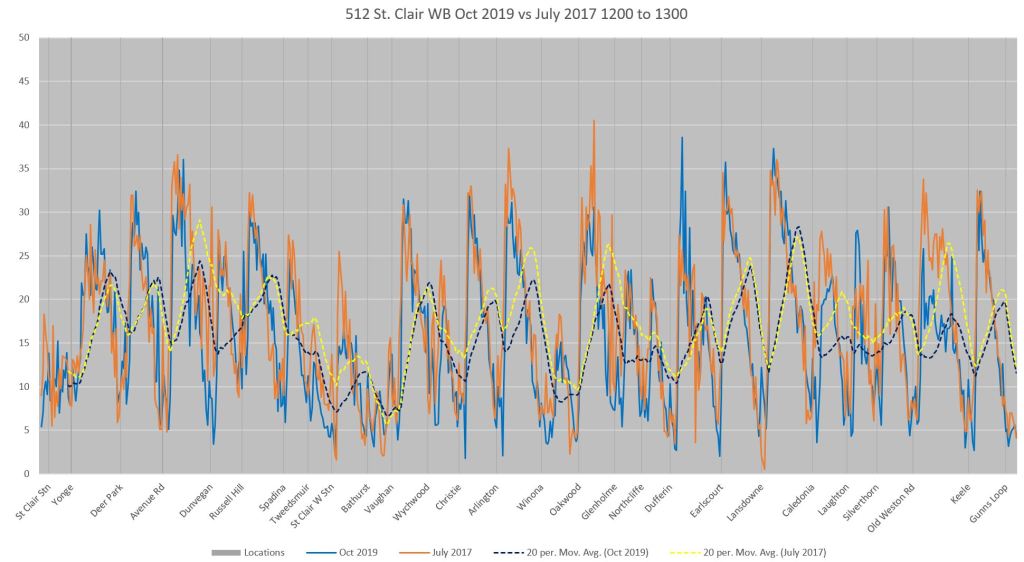
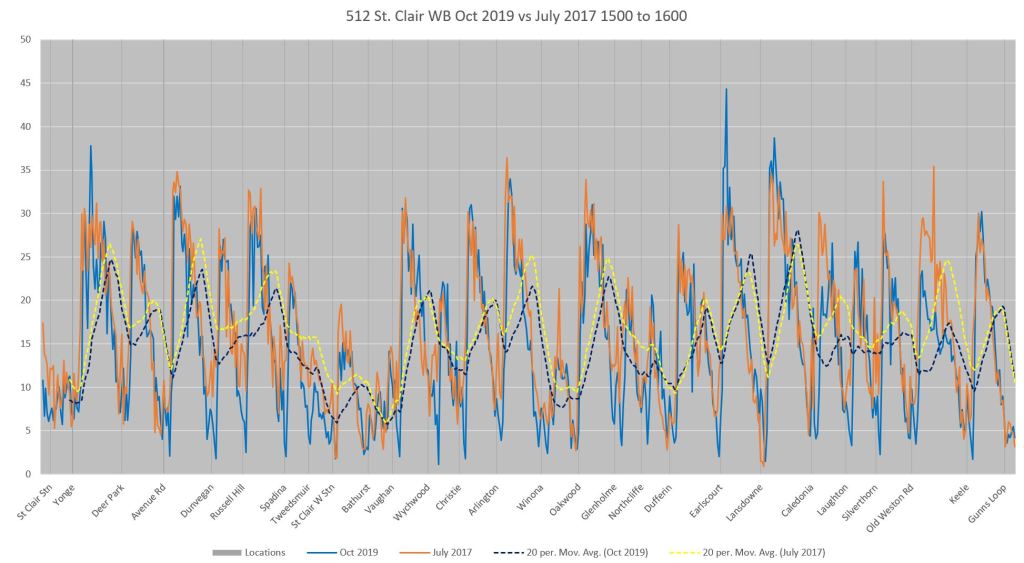
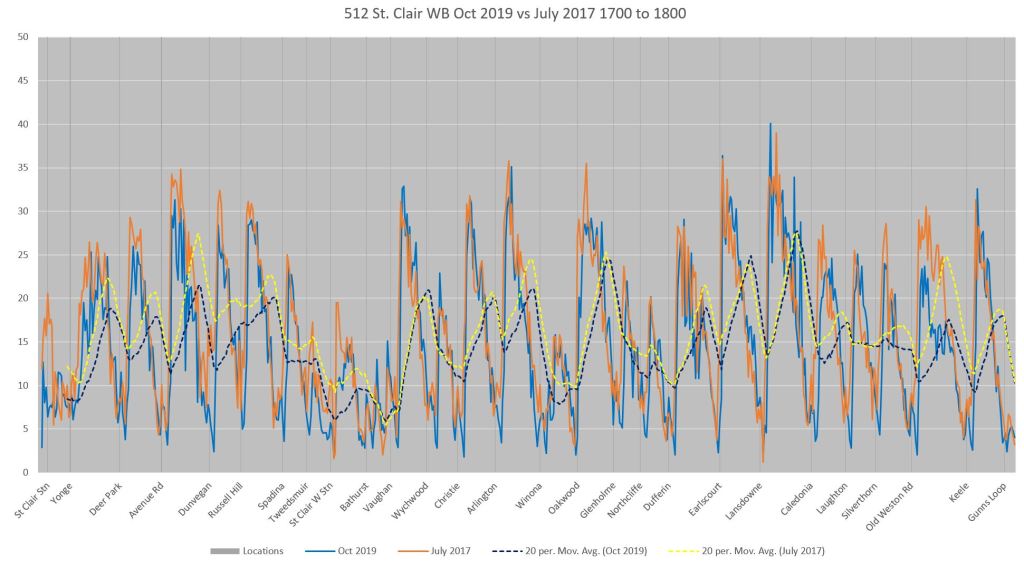
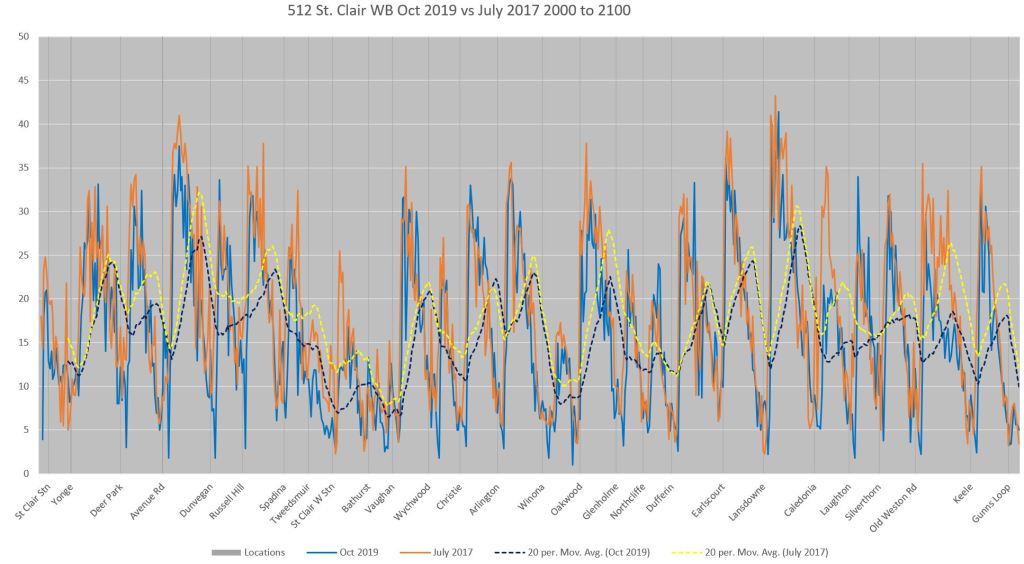
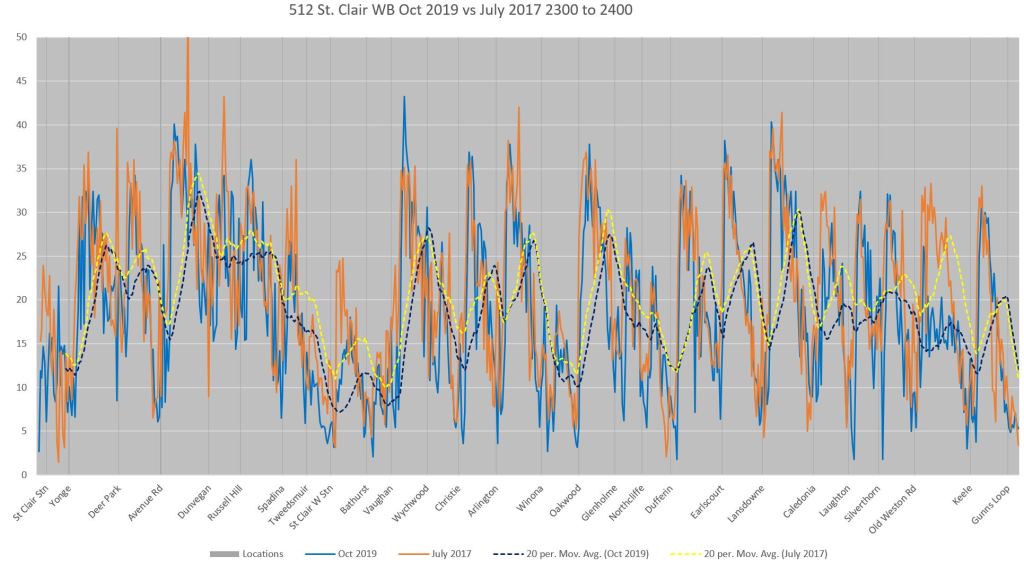
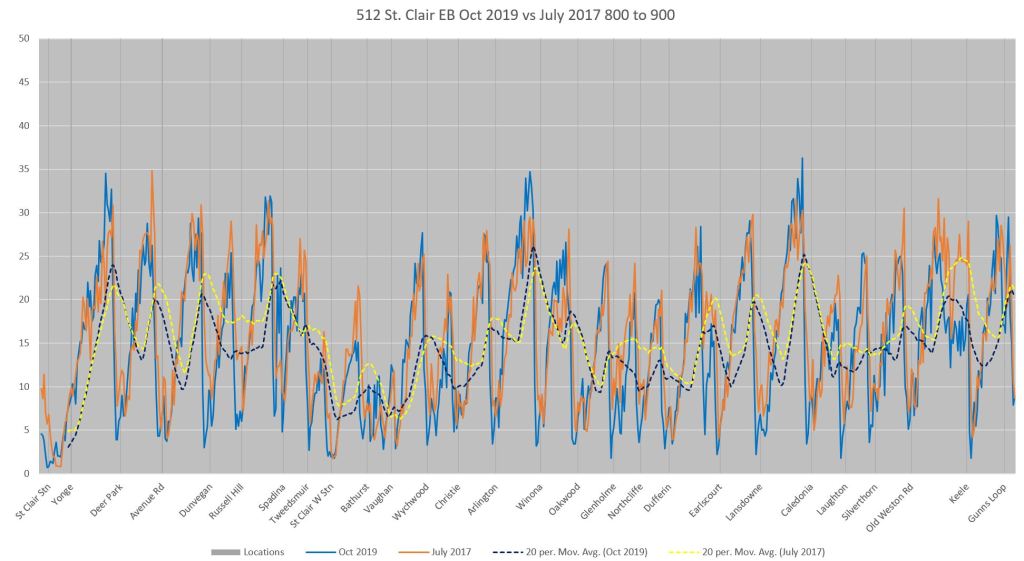
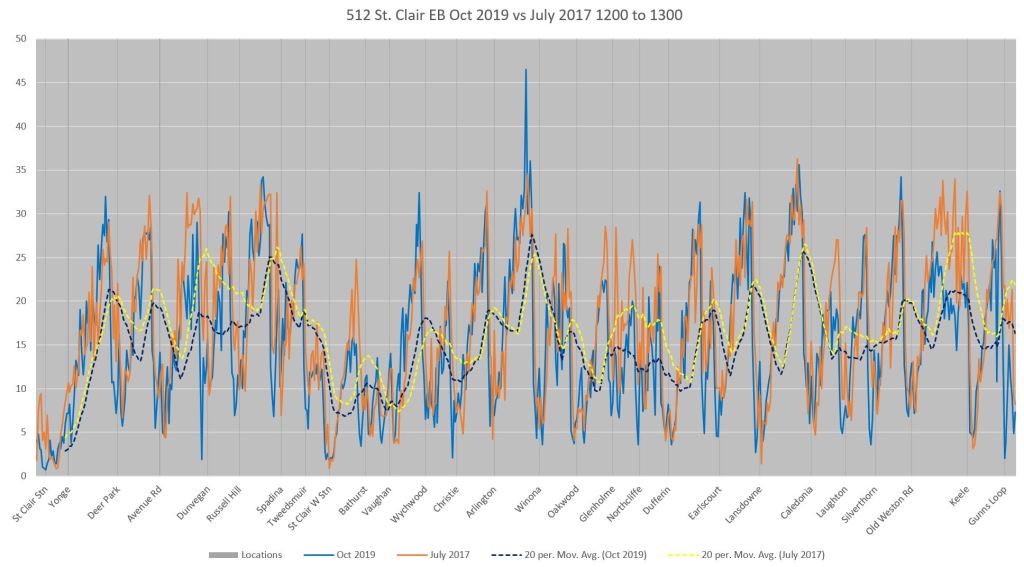
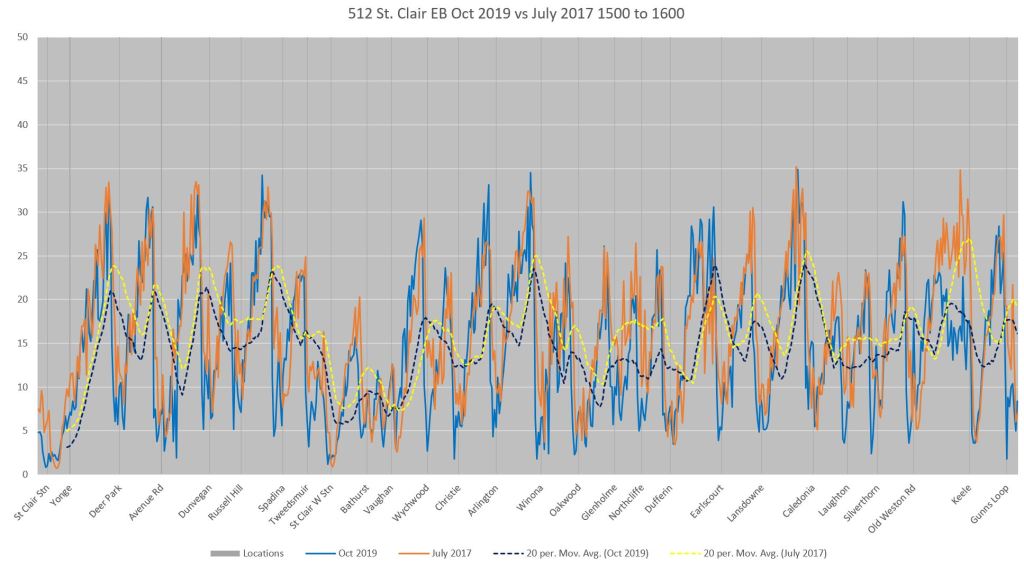
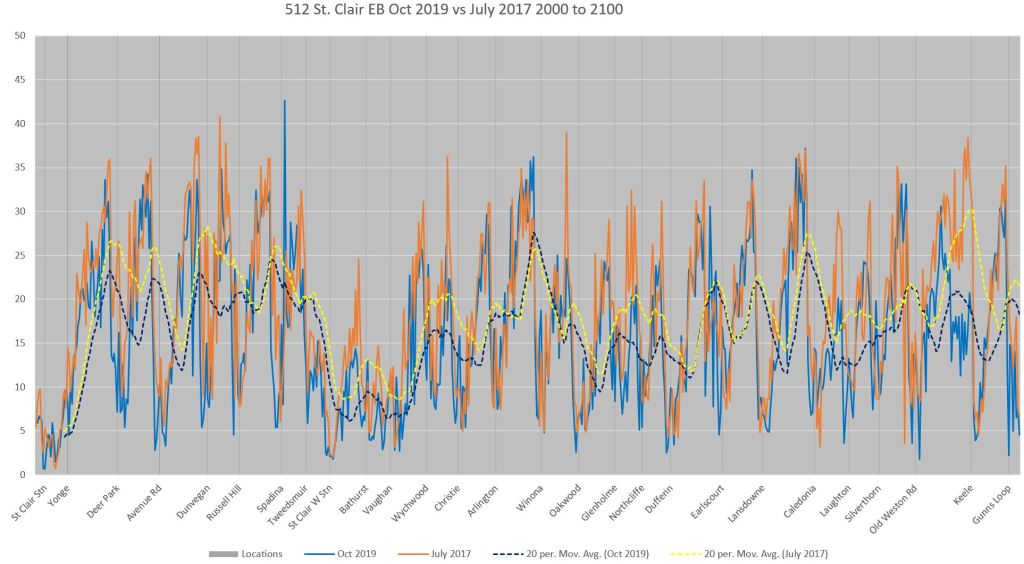
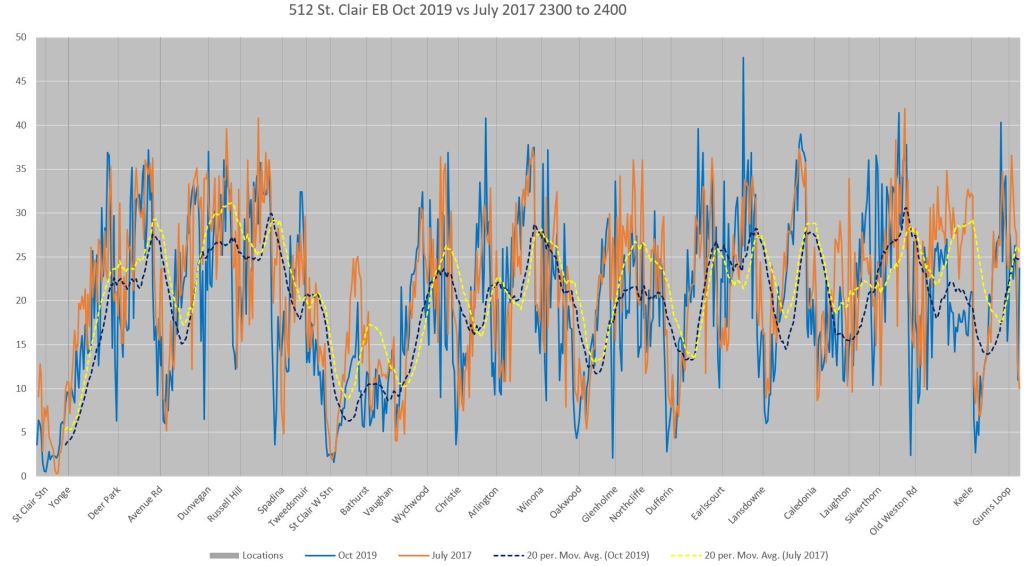
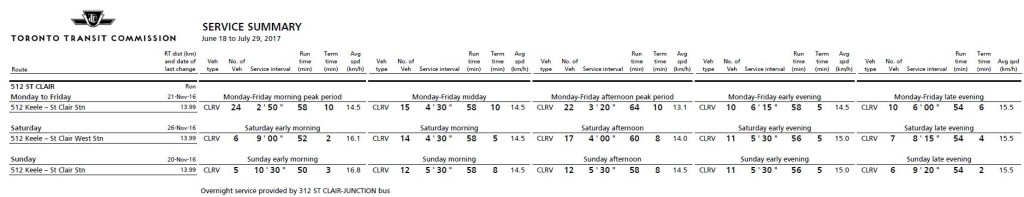
512 St. Clair: CLRVs vs Flexitys
By 2019, the 512 St. Clair was operating with Flexitys. The next set of charts compares July 2017 to October 2019 data for this route to contrast CLRV speeds with Flexity speeds. The change is much more pronounced here than in the 2025 vs 2019 charts above.
In the speed comparison charts, note that the 2017 lines (orange) do not dip as far down as the 2019 lines (blue) indicating that a stop of any kind does not penalize overall speed as much in 2017.
Travel Times Between St. Clair Station and Gunn’s Loop
Travel Speeds from St. Clair Station to Gunn’s Loop
Travel Speeds from Gunn’s Loop to St. Clair Station

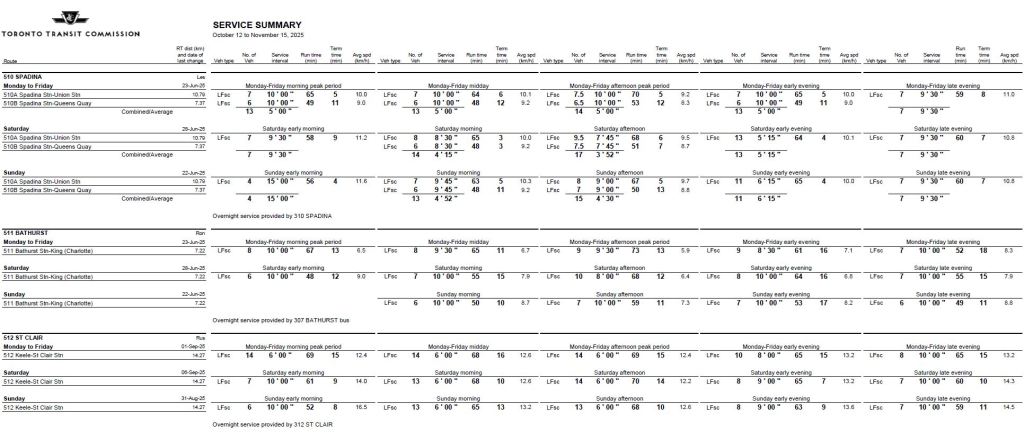
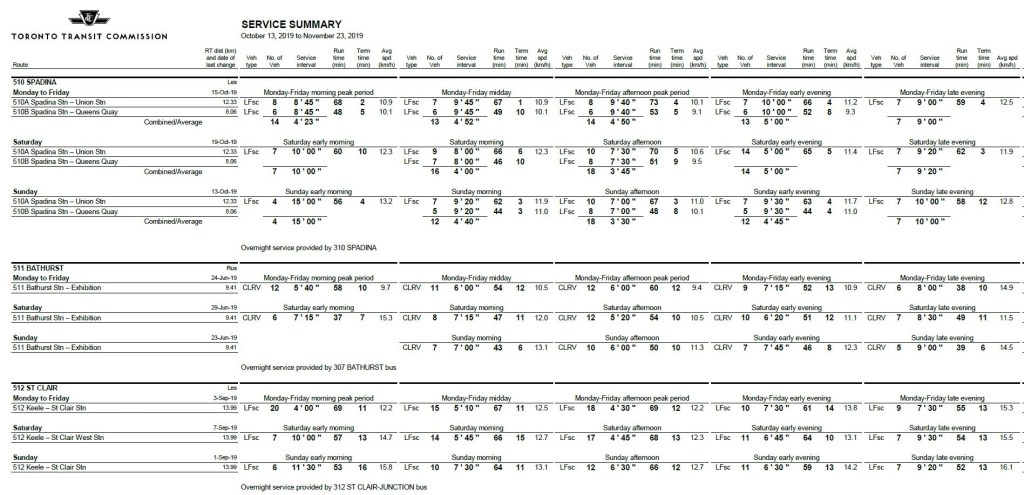
Scheduled Service Levels
The scheduled service designs for the three routes discussed here are shown in the tables below.
Methodology
In the service analyses on this site, the GPS-based vehicle tracking data are converted to a linear scale treating the route as if existed as a straight line. Routes are scaled with units of 10m.
Travel times between points are calculated using screenlines at major intersections.
The speed of each vehicle between reported locations is assigned to each 10m segment, and averaging over all passing cars. The individual data points are close enough in time that the change in location is small between each report. Data were taken from the nine weekdays following Thanksgiving Monday in October of 2025 and 2019, and they are presented on an hourly basis to show how speeds vary over the course of a day.

Don’t compare streetcars with streetcars, compare streetcars with buses but you won’t do that because it would be a strong argument in favour of phasing out streetcars for good based on real scientific data. Other jurisdictions around the world have already done detailed scientific comparison of streetcars and buses the result of which included the permanent phasing out of streetcars for good.
Steve: You really don’t read this site often. If you did you would know I have done those comparisons. The results are mixed depending on the route and location. Meanwhile, there are lots of cities that keep and expand their systems. If streetcars really on their way out, nobody would be making new ones (very much like the North American situation in the 1950s), but there are several international car builders. Somebody must be buying them.
LikeLike
In hindsight, should the TTC have been better served by getting shorter-length streetcars (similar length to the CLRV) rather than getting the Flexity ones that we eventually did?..
I am looking at your comments of 2017 vs 2019 speeds on St Clair…How much of the speed issue is down to the size of the streetcar …or is it to do with acceleration?
From what I remember of the CLRVs they would accelerate very fast and decelerate very fast too.
Steve: There is a interplay between factors here. First off, acceleration also affects power draw, and I suspect this might have been a challenge for trolley-pole equipped cars when the Flexitys arrived. Whether this can be changed, or if we are stuck with the existing acceleration profile I don’t know. TTC is still going through not just pan conversion of its overhead, but increasing the capability of the system to deliver power to cars. There is no map showing the current status or planned work to complete this. It’s worth my chasing TTC for this info as they used to publish maps showing overhead work plans.
The length of the cars partly affects how they are driven (timidity?), but also the length of time needed to clear intersections thanks to the TTC’s absurd operating practices in the name of safety which really are a hyper conservative reaction to poor track conditions. Even if cars could accelerate faster, there are many locations where this ability would be constrained by slow orders.
A big problem is cultural: the slower operating style of the Flexitys has been in place long enough that many have no concept of how the streetcar system used to operate or could do so again.
LikeLike
Hi Steve,
When the line 5 opens, the 191 will replace the northern section of the 91 (which I find really stupid since they can just share it), but what will happen to the 91 via Eglinton & Sunrise school trip? Also will they use the old 91B destination sign for this new change for the 91?
Steve: I believe that the top end of the 91 Woodbine will be lopped off now it is served by 191 Underhill, but an obvious question is where do the people on that chunk of the route actually want to go? Will the TTC compare ridership on the two routes while they still overlap? Re the school trip, I’m not sure how that is affected by the north end of the line given that Sunrise is south of Eglinton. And re destination signs, your guess is as good as mine.
LikeLike
I understand the TTC has placed a top speed governor on the Flexity cars and likewise for the door mechanism. It wouldn’t surprise me if they’ve adjusted the power curve for acceleration and purposely slowed that down too.
Steve: I await a reply from TTC on this and other questions re Flexity operations and infrastructure plans.
LikeLike
Glad there’s mention of power draw – electric mobilities aren’t the free and green lunch as hyped. And the tonnages of the streetcars are large – c. 26 tons for a smaller one, and up to 50 maybe for larger, and please correct me Steve and others. True energy efficiency in transport of course eludes us, as it’s Caronto, OntCario, and we’re spoiled on hypermobilities right away. And we tend to ignore all of the embodied carbon/ghgs in both vehicle and the infrastructures, and it should include concrete too, which in the eg. of some bike lanes is to keep the motorized vehicles out, rather than being truly an inherent requirement, though a solid base does help (and could we have an OK surface with modular components vs. monolithic that can support trucks?). I think the #2 draw on the power grid in TO is transit, the #1 being water, and yes, it would be Fun to see power draw charts like the many Steve and the TTC have been able to generate for service.
Likely the most energy efficient mobility is the human-powered bike, then the e-bikes, much as I dislike many of them and operators.
Steve: If you want to see big power consumption as well as embedded energy in the infrastructure, look no further than subways.
LikeLike
I notice there’s a lot of time taken for ramps to deploy for wheelchair/mobility scooter users, especially because the operator has to get involved. I assume this is to make sure there are no cars blocking the ramp. Can you confirm this is the case, Steve?
Logic would dictate that the TTC marks where it’s safe to deploy the ramps without operator involvement, such as the platforms on Spadina, or the stops on King St., but similar to the blanket slow orders at intersections, it must have too much inertia, as you mention.
Steve: There are various issues with ramps including non-functioning, catching, or if done without supervision extending where there is an obstacle including traffic and snowbanks. Then there is the question of ensuring that the passenger boards or exits safely. None of this lends itself to automatic deployment, and not much time would likely be saved.
LikeLike
Like for traffic signals, the wait for a ramp deployment feels like half an hour but in practice is probably less than a minute. If it’s at a busy stop the effective delay is even less, because passengers are alighting and boarding through other doors while the operator is supervising the ramp.
Are ramp delays actually measured by anyone? I’d guess not, just as I’m pretty sure the TTC’s claims that removing a few little-used stops from a surface route make a significant difference to running time are not backed up by measurements.
Steve: A ramp deployment for a street level stop takes about 15 sec. Then there is boarding/alighting time, then 15 sec to stow the ramp. And yes this often overlays passenger activity at other doors, but can still be a delay.
There is probably more consistent delay from streetcars trapped at nearside stops by signals and by last minute boarders than by ramps.
Removing stops has varying effect depending on how busy they were and if they were at traffic signals that trapped the stopped vehicles. I will be interested to report on the effect of some recent changes once enough data accumulates fora before/after comparison.
LikeLike
Yes, subways in the less-wise to wrong places are Not good uses of all types of resources. For me, the SSE, the Yonge Extension and even the OL are not good enough value in present and future costs of energy/capital. Neither is the burying of the Eglinton W LRT vs. surface, but carservative transit puts the transit out of the way of cars vs. political will to ensure faster travel, or somewhat smarter placement of RoWs on existing and under-used linear corridors, like the DVP, or the Gatineau Hydro Corridor.
But there’s billions for some things, $igh.
LikeLike
I can’t say I fully agree with the need for operator supervision for ramp deployment, especially when there are platforms such as on Spadina (This is based on my experience in other countries, so not necessarily wholly reflective of Toronto conditions), even if it adds no delay. Does ION have level boarding?
Steve: Yes. Unlike Toronto where the platforms are at roughly the same height as sidewalks, the ION platforms are higher making for level boarding.
I hope at least that Lines 5 and 6 have level boarding at all stops.
LikeLike
West of Humber loop, there is generally not much congestion except the eastern end out to about Legion Road in rush hours, due to traffic to and from Park Lawn and all the condo high-rises.
There is also only one slow-operation junction, at Kipling and Lake Shore. (Unless we also want to count the comical stop-check-go entering Long Branch loop, just in case the manual switch to the spare layover track has been activated.)
Comparing 501L service summary information from 2019 with current 507 service summary info, even here it’s slowed down.
Scheduled speeds for weekdays for CLRVs was 15.7/17.4/15.7/18.8 for morning peak/midday/evening peak/early evening. No late evening as it became a through operation from Neville to Long Branch.
By comparison, Flexity scheduled speeds are 13.3/14.8/13.9/16.1.
I would bet that the Flexities could maintain the 2019 scheduled speeds if they had to.
For one thing, the terminal time listed is 9/16/12/11 for the different weekday periods. However, at Long Branch loop, it’s pretty reliably observed that one car will leave as the next car is arriving. That suggests a terminal time at the west end approaching 10 minutes, which is the headway. I don’t know what happens at Humber loop, but if it’s similar, the cars are taking pretty much a 20 minute total terminal time break on each run. Which is way more than the listed time, definitely in some periods.
Which then means that the cars are routinely exceeding their scheduled speed along the route.
LikeLike