
At the TTC Board meeting on November 3, management presented statistics on streetcar delays broken down by type of incident. TTC is quite fond of portraying external incidents, especially those related to congestion, as the root of (almost) all evil. The following page is from the CEO’s Report.
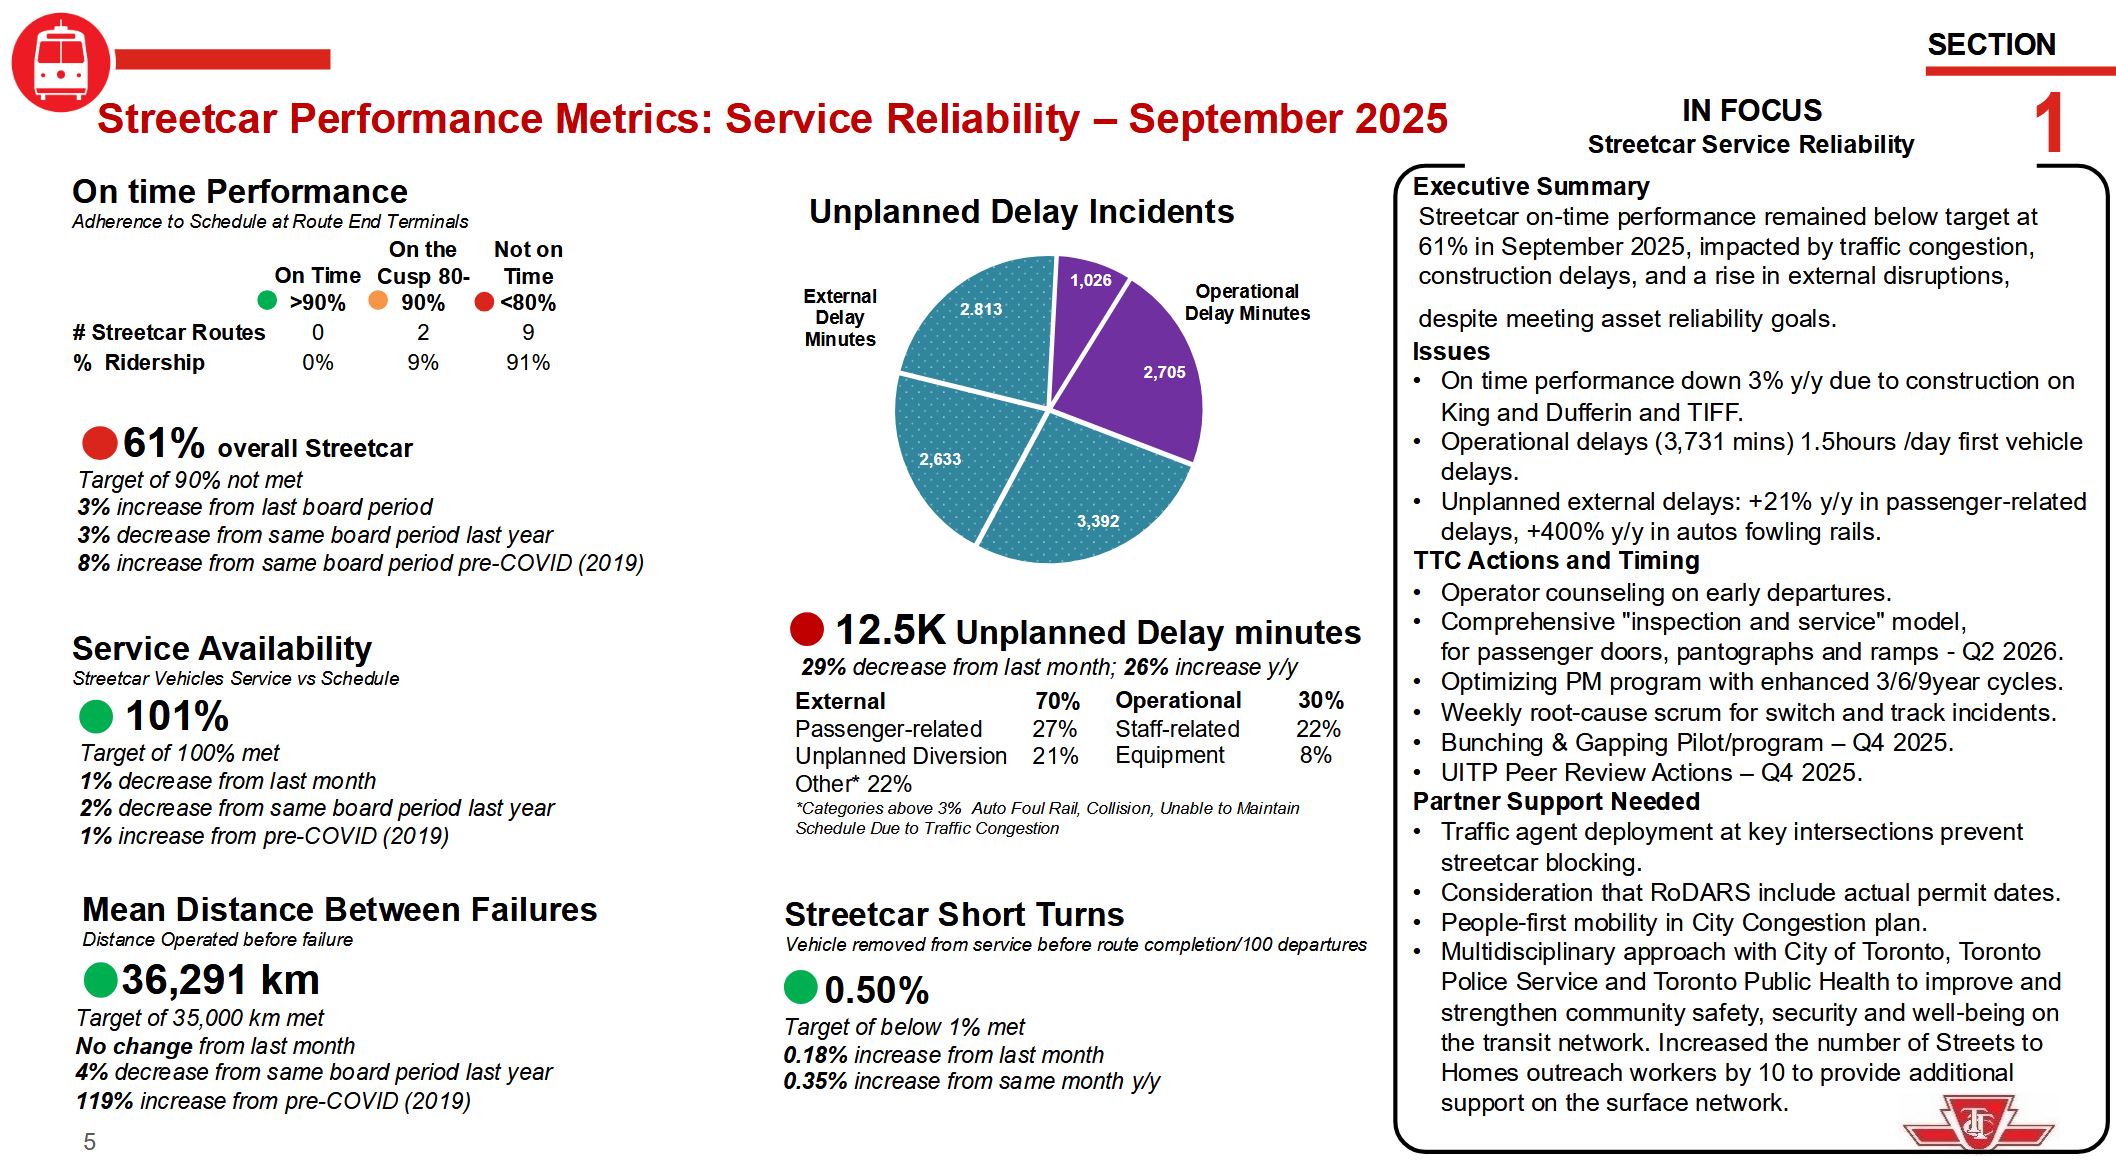
Note that external delays (turquoise) occupy the majority of the chart. During discussion of the problem of autos fouling rails, a passing remark by the Interim Chief Operating Officer piqued my curiosity when he said that there were many delays due to the winter storm.
This sent me to the TTC’s delay statistics which are available on the City’s Open Data site. There are codes for many types of delay including “MTAFR”, short for “Auto Fouling Rails”.
According to the “In Focus” box above there has been a 400% year-over-year increase in these delays, although they are styled as “fowling” implying a flock of chickens might be responsible for service issues.
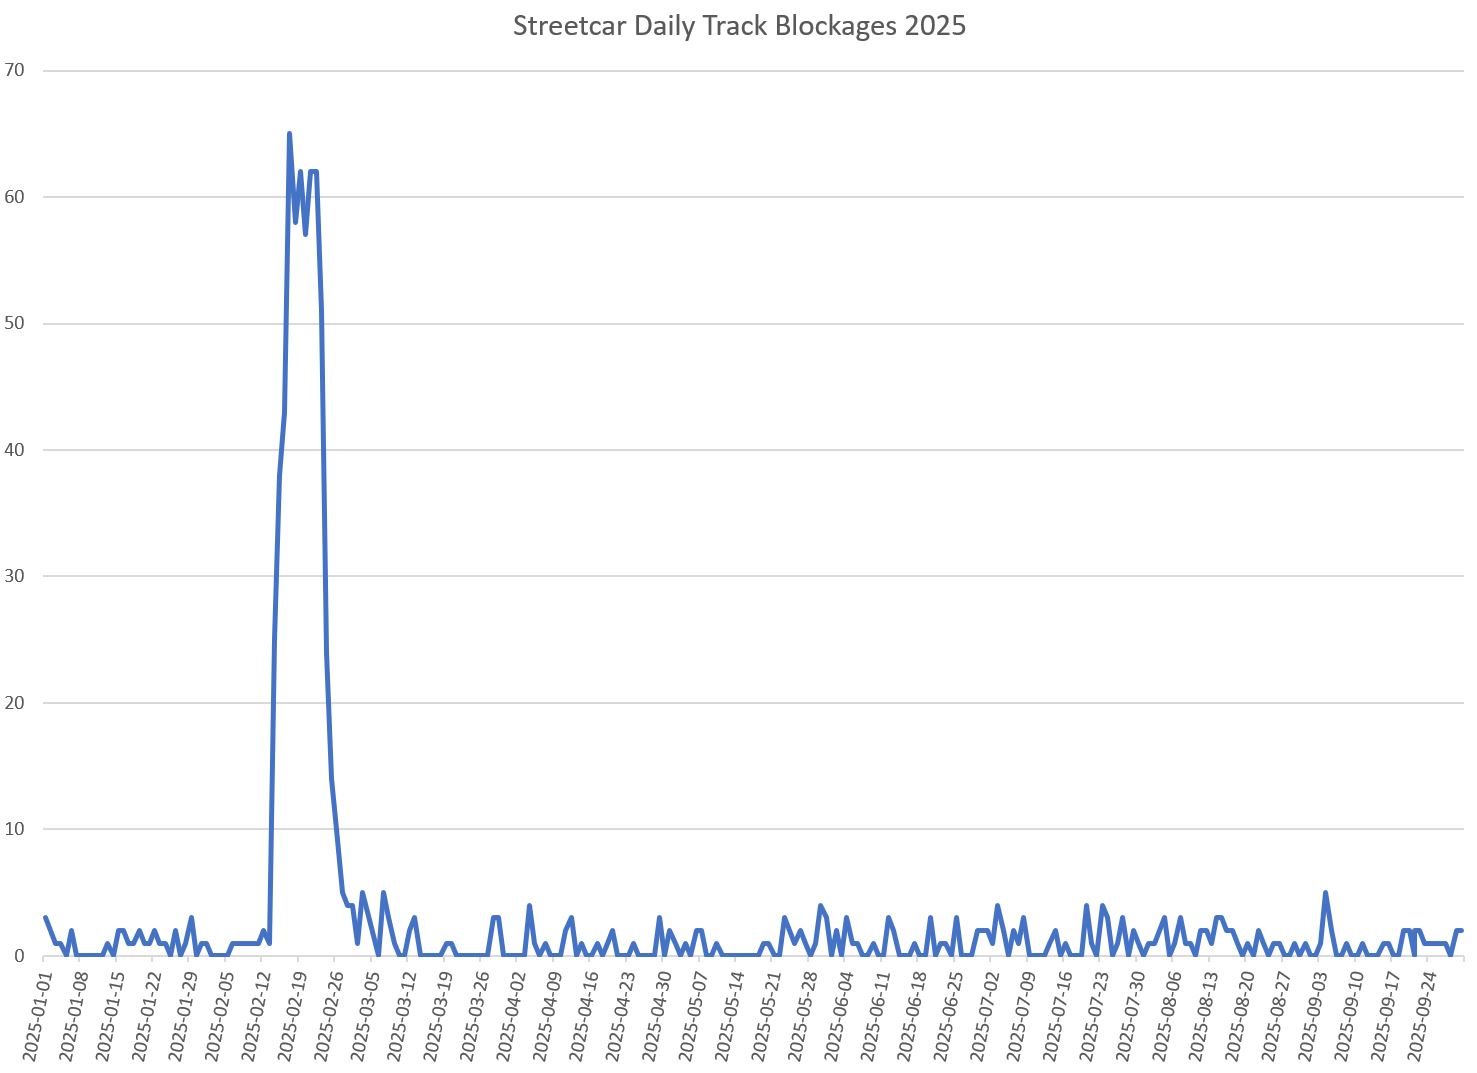
Sorting the data by code and summarizing by date produces interesting results.
- Between January 1 and September 30, 2025, there were 843 MTAFR events logged.
- Of these, 586 fall between February 14 and 26 hitting a daily high of 65 on February 17.
These blockages were not caused by the typical traffic congestion, but by the City’s utter failure to clear snow on key streets.
- 105 were on 501 Queen
- 42 were on 503 Kingston Rd.
- 84 were on 504 King
- 93 were on 505 Dundas
- 186 were on 506 Carlton
- 3 were on 507 Long Branch
- 1 was on 508 Lake Shore
- 2 were on 509 Harbourfront
- None were on 510 Spadina or 511 Bathurst
- 6 were on 512 St. Clair
- A few dozen were on various night cars
The pattern here is quite clear: routes on wide roads or rights-of-way were not seriously affected, but routes on regular 4-lane streets were hammered. (How 511 Bathurst was spared is a mystery. At the time it was running with streetcars from Bathurst Station to King & Spadina, and with buses on the south end of the route.)
To claim that the 400% increase from 2024 is some indication of worsening traffic problems is gross misrepresentation of what actually happened. Although this is the CEO’s report and he almost certainly did not assemble the information himself, he wears this issue for having reported misleading data to the Board and public.
Direct comparison with published 2024 data is difficult because until 2025 the TTC used a much coarser set of delay codes that lumped many types of events under generic headings. There was a category “Held by” in which there were 625 incidents from January to September in 2024. The 843 MTAFR codes in 2025 are quite clearly not a 400% increase over 2024.
Whenever there is a discussion of unreliable service, we hear endlessly about traffic congestion. This definitely is a problem, but not the only one, and certainly not in the way presented by the CEO.
A question arose during the debate about the problem that performance stats are consolidated across all routes. Route-by-route service quality is presented in detail in the second part of this article for all streetcar routes. This shows that problems are widespread in the system, even on routes with reserved lanes.
As for the delay stats cited by the CEO, it is clear that we are not comparing September 2025 to one year earlier as the text implies, but using events from the entire year to date including a major snowstorm that had no equivalent a year earlier. The so-called 400% jump in delays from blocked tracks is due to snow and poor road clearance by the City.
TTC management owes the Board and the public an apology for blatant misrepresentation of the delay statistics.
Continue reading