
The TTC has a pilot program underway on several routes with increased supervision in an attempt to improve service quality by addressing service gaps and bunching. These are complementary effects in that a gap is often followed by a bunch, although gaps can also occur due to missing vehicles and short turns. See:
The pilot evolved over the year as some of the challenges and resource needs to manage service became apparent.
| March 2025 | Pilot launched on 7 Bathurst, 24 Victoria Park, 924 Victoria Park Express, 25 Don Mills, 925 Don Mills Express, 29 Dufferin, 929 Dufferin Express, 100 Flemington Park, 165 Weston Road North, 506 Carlton, 512 St Clair. Dedicated staff to manage each route were not used initially and results were poor. |
| June 2025 | The pilot was scaled back to 7 Bathurst, 24 Victoria Park, 924 Victoria Park Express, 506 Carlton, and 512 St Clair. One route supervisor was assigned to each route. |
| September 2025 | 100 Flemingdon Park and 165 Weston Road North were added. |
| October 2025 | Pilot “refined” to focus on the weekday peak periods. |
The TTC recognizes that delays leading to gaps can be caused by several effects: “including including Operator behaviour, customer incidents, traffic congestion, city events, construction, and operational factors, such as door/ramp operations.” [p. 2]
Later in the report, there is mention of the effect of passenger loads and long traffic signal wait times.
If vehicles are crowded either because service is inadequate for demand, or because a gap creates an extra load, they will take longer at stops. Filling vehicles to the brim can be counter-productive and inefficient. Space limitations onboard can delay passenger movement especially for those with large objects (e.g. strollers, luggage) and mobility devices. Although ramp operations are mentioned, there are many other types of passengers with extra space and boarding time needs.
Transit signal priority is also mentioned, but there is no indication of where or what priority measures were added on the pilot routes.
The remainder of this article reviews the metrics used by the TTC to track the success of the pilot project, as well as problems and actions that might be taken to resolve them.
Metrics and Results
The pilot set a target of a 10% improvement over 2024 operations, and two metrics were used:
- Terminal punctuality defined as a headway within ±50% of schedule.
- Headway adherence enroute defined as a headway no more than 50% greater than scheduled. Over 150% is considered to be a gap.
Two issues immediately jump out here.
Terminal punctuality has not been historically reported versus headway, but rather against the schedule. Recently we have heard a lot about how streetcars only achieve 61% “on time” performance, but that is a completely different metric from simply asking if they are evenly spaced. Cars could all be half an hour late, but running on a regular headway. From a rider’s point of view, all would be well, but on time performance stats would be appallingly bad.
If a line is managed to be “on time”, service can suffer especially when vehicles are missing.
As for gaps enroute, it is not unusual for a gap to be followed by multiple vehicles, but the metric counts only gap incidents, not the number of vehicles involved nor the size of the gap.
Results at terminals are summarized in the table below on the left. These data have an obvious problem in that they are based on all time periods, but the extra supervision under the pilot is only during peak periods. It is not clear how much of the improvement happened during the peaks, and how much at other times.
A second table, right below, measures headway adherence at various points enroute. These are not defined, and again the data are all day results, not just the route behaviour when extra supervision is in place. Note that the column headings erroneously refer to punctuality at terminals.

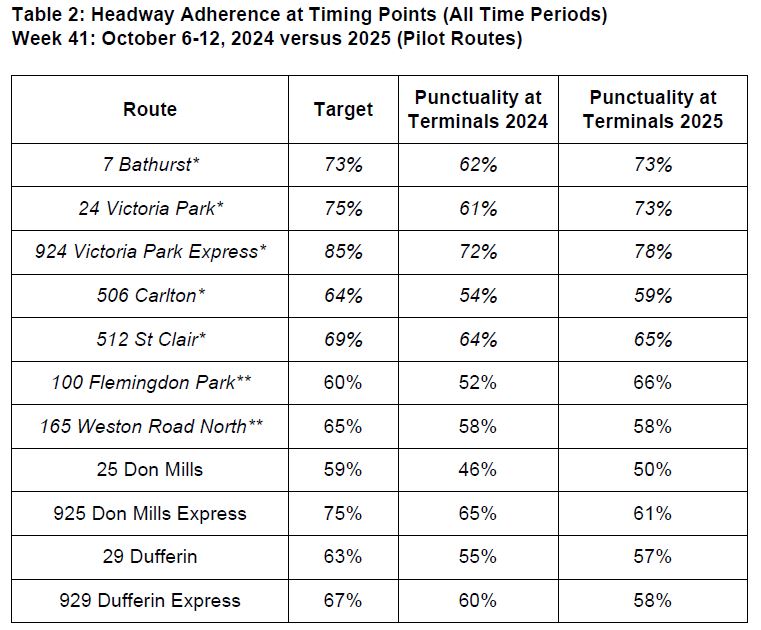
(Starred routes are part of the more intensive management pilot beginning in June, and the double-starred routes were added in September.)
The important point here, aside from the quality of the results, is that mid-route performance is substantially below performance at terminals. This is no secret to riders nor to anyone who has reviewed actual route behaviour, but it underlines how metrics based only on data from terminals presents a better picture of service than most riders see.
There is a further issue with the metrics in that the swing they allow can translate to fairly wide allowable gaps.
For a route on a 6 minute headway, the allowed spacing is ±50%, or a range of 3 to 9 minutes. For a 10 minute headway, the range is 5 to 15 minutes. In effect, riders on less frequent routes are doubly penalized because wider service gaps meet the “target”. This is a basic flaw, and the allowable deviation should be the same in both cases.
Hot Spots and Tactics for Improvement
The report lists the type of problem encountered on various routes and some of the tactics that are or might be used to counter them.
- 7 Bathurst: Delays from parked cars, left turns, school traffic, with mitigations including vehicle spacing, additional vehicles, on-street and Transit Control Centre supervisor support, and left-turn restrictions.
- 25 Don Mills/925 Don Mills Express: main drivers of poor performance include Ontario Line construction and heavy traffic, with mitigations proposed to include pre-positioned extra buses and additional supervisory support.
- 165 Weston Road North: main drivers of poor performance include construction and parked vehicles, with the mitigation measures proposed to be focused on service management, and additional Supervisor deployment.
- 506 College streetcar route: poor performance driven by increased dwell times due to higher passenger volume, traffic congestion, CaféTO installations, and mitigation measures proposed include: vehicle spacing, Supervisor deployment, service adjustments, and implementation of transit signal priority.
- 512 St Clair: experiences slower travel times through St Clair West Station as a mid-point location, along with traffic congestion at the end terminals. To mitigate these impacts, service adjustments have been implemented, including the addition of four vehicles and four minutes of running time, continued discussions with City of Toronto traffic management on added mitigation measures and the ongoing review of stop spacing.
A few of these points deserve comment.
The use of pre-positioned buses begs the question of “Run as directed” (RAD) vehicles which have been touted for many years as a generic response to service problems. Why are these not already used? How well are they used?
On St. Clair, the number of vehicles added was not four, but only two. The “old” service was 10 scheduled plus 3 RAD cars, and the “new” schedule is 14 scheduled plus 1 RAD. This implies a better use of vehicles to improve service overall rather than counting on spot changes. A problem with RADs is that although they can be used to fill gaps, they have to be in the right place at the right time to do so. Better service across the route with more scheduled cars could have an overall better effect for riders.
For streetcar routes, RADs pose an extra problem because the standby cars must be stored somewhere, and places for this are limited. How much of the operational problems at St. Clair West Station were caused by using the spare track as storage rather than as a bypass for regular service? (The track allows eastbound cars to bypass stopped westbound cars.)
The “506 College” should read “506 Carlton”, but added to the incorrect table headings noted earlier suggests a sloppiness in report writing.
Stop Spacing
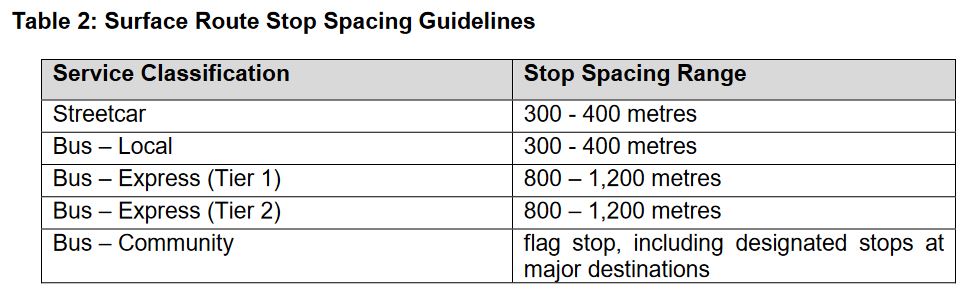
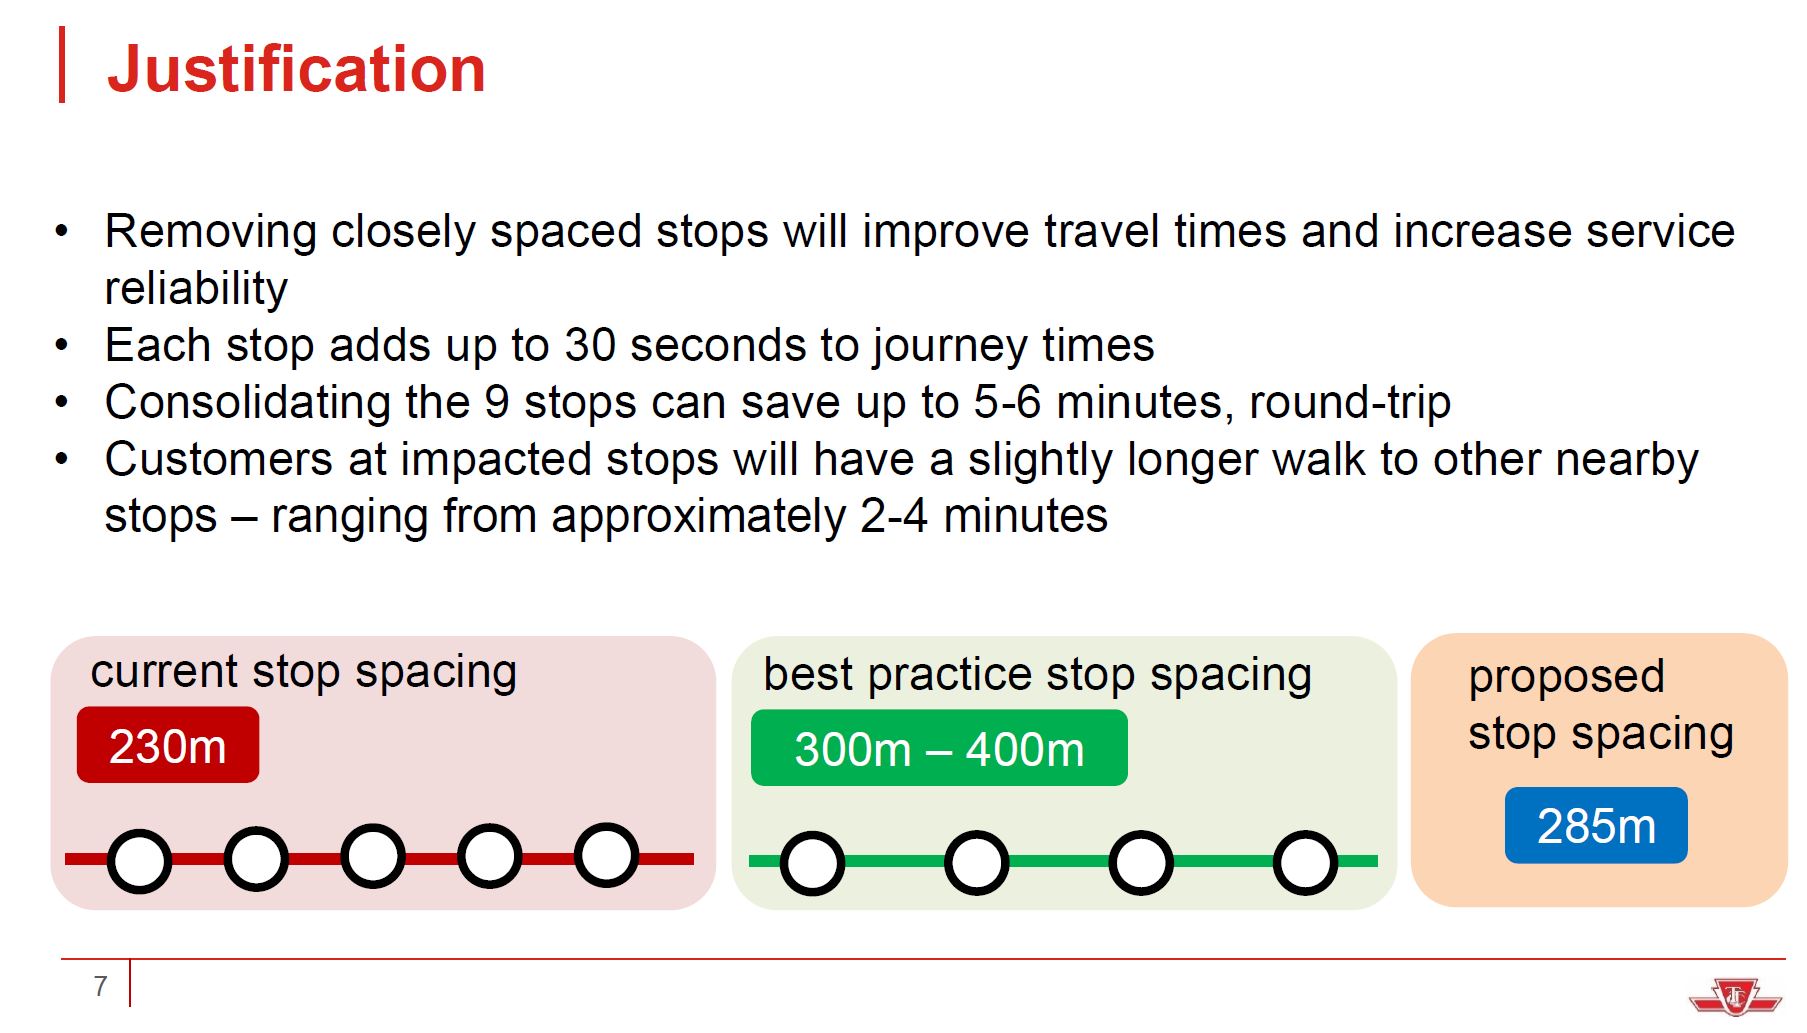
TTC often cites closely spaced stops as a problem, and management on its own has been trimming excess stops in some locations. However, the delegated authority from the Board for these actions is tied to the Service Standards which prescribe the target ranges for each type of service.
At a recent community meeting, the TTC proposed the removal of various stops along 512 St. Clair as shown below.
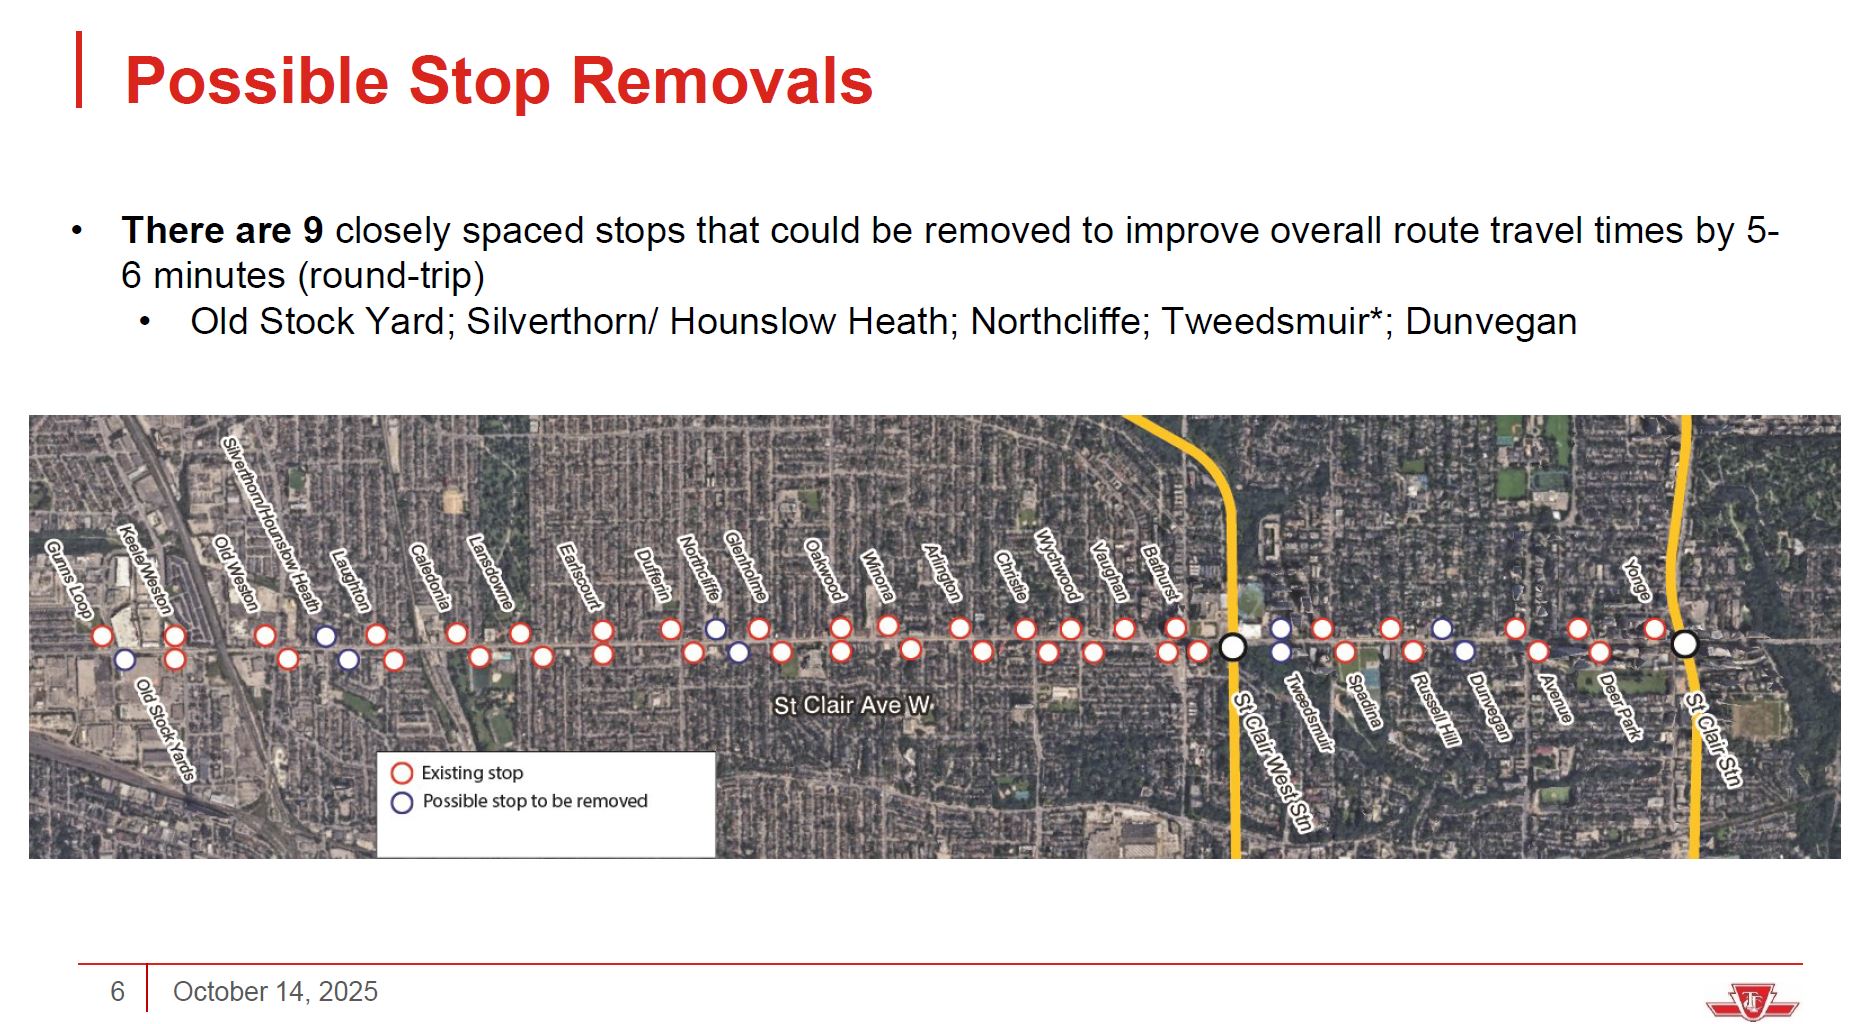
However, the term “closely spaced” does not align with the Service Standards because some of the resulting stop spacings are greater than 400m. The charts below show the existing (blue) and proposed (orange) stop spacings for each direction. Where a stop is eliminated, only a blue bar remains, and the orange bar at the next stop is correspondingly longer. (Stop data taken from the GTFS schedules for 512 St. Clair.)
The new spacings caused by removals at Hounslow Heath/Silverthorn, Tweedsmuir (EB) and Dunvegan all exceed the 400m standard.
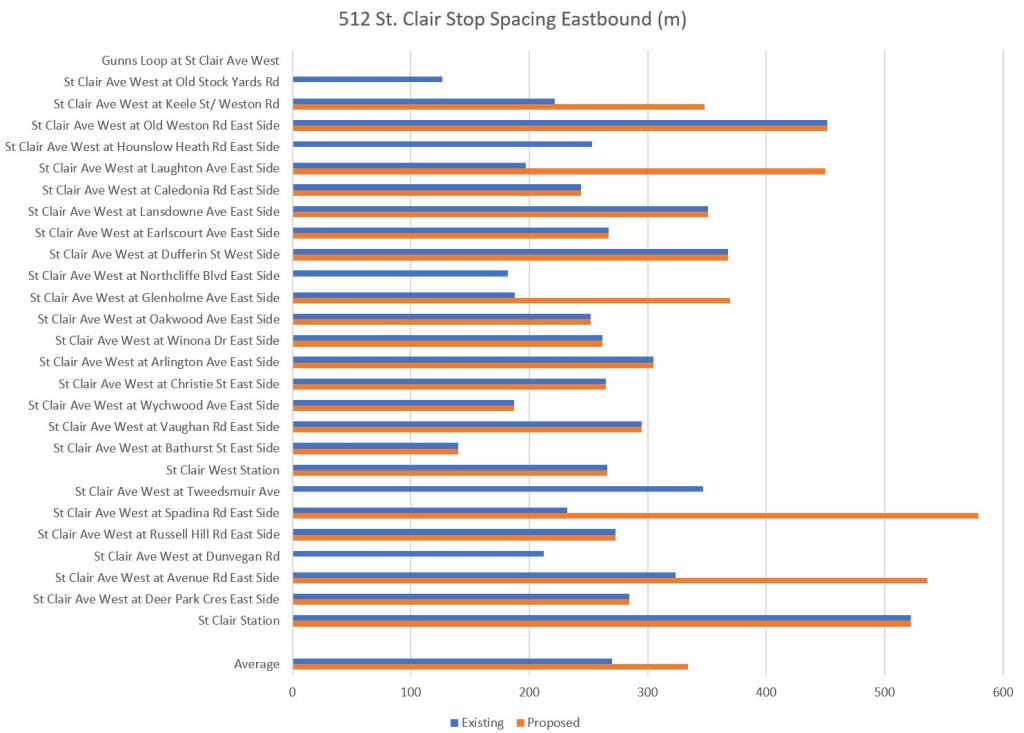
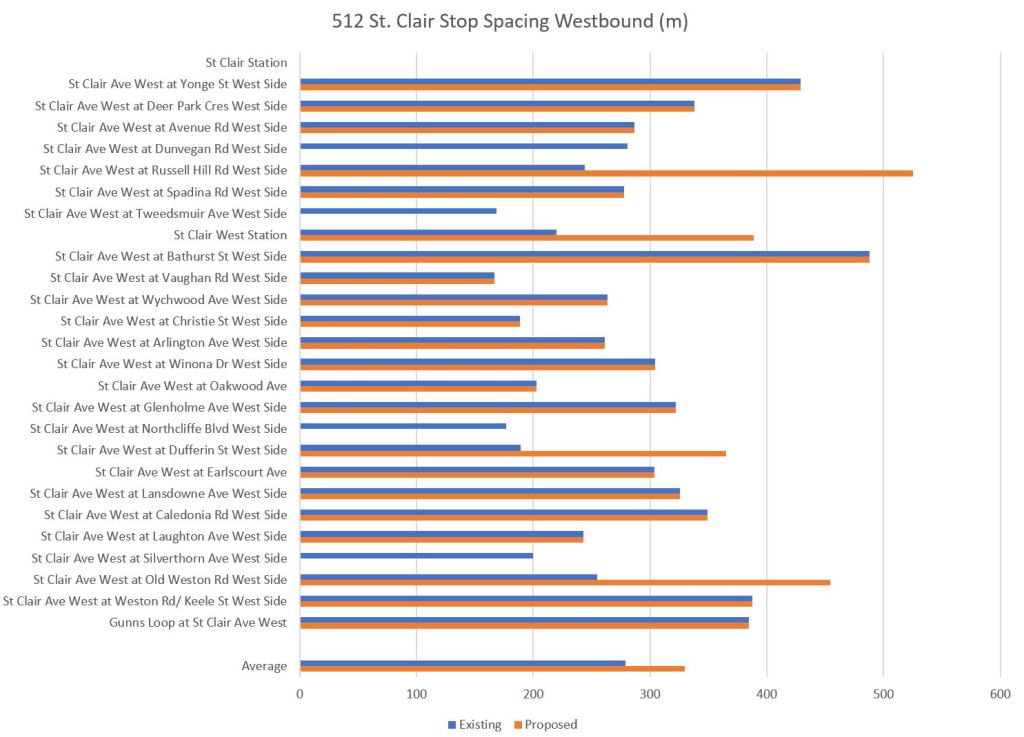
In the community presentation, the TTC cites the change in average stop spacing, but the Service Standard applies to individual stops.
Some past stop removal proposals have misinterpreted the standard to require a maximum walking distance to a stop of 400m as opposed to the spacing between stops. This is a fundamental difference because stops could be 800m apart while the walking distance from any intermediate point is 400m or less.
More generally, this is an example of management pushing the envelope on Service Standards just as they did with arbitrary relaxation of crowding standards a few years ago. Correction of that problem has still not fully worked its way into service levels thanks to budget constraints.
If management’s desire is that stops should be further apart in general, then this requires a change to the Standards accompanied by an explanation of the effects on routes. The TTC recognizes that accessibility to service is important, but stop spacing is part of that goal. Stopping to actually pick up riders may be an annoying inconvenience, but this is basic to transit’s function.
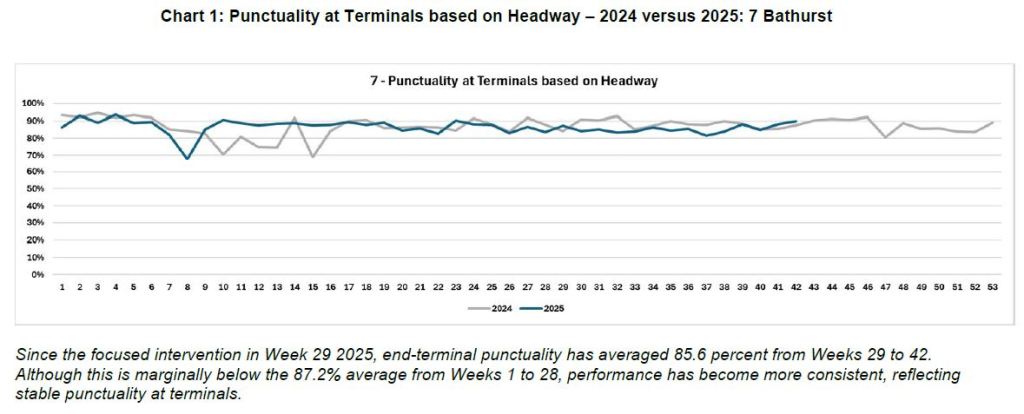
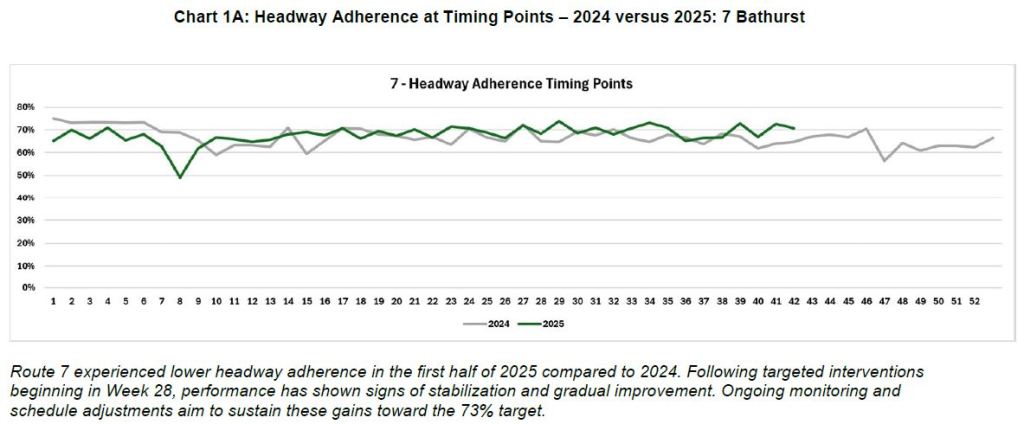
Charting the Metrics
The report includes pairs of charts for each route under study. Those for 7 Bathurst are shown below. The format has several problems including:
- “Improvement” is not clearly shown by the presentation.
- Data are averaged over weeks and likely, by reference to the main report, for all time periods, not just those with added supervision.
- Data for both terminals, and for multiple time points and directions are combined into one metric.
- There is no indication of the range of headways either inside or outside the target values, nor of how these might vary by time or location.
- The charts do not use a consistent y-axis scale from 0% to 100%.
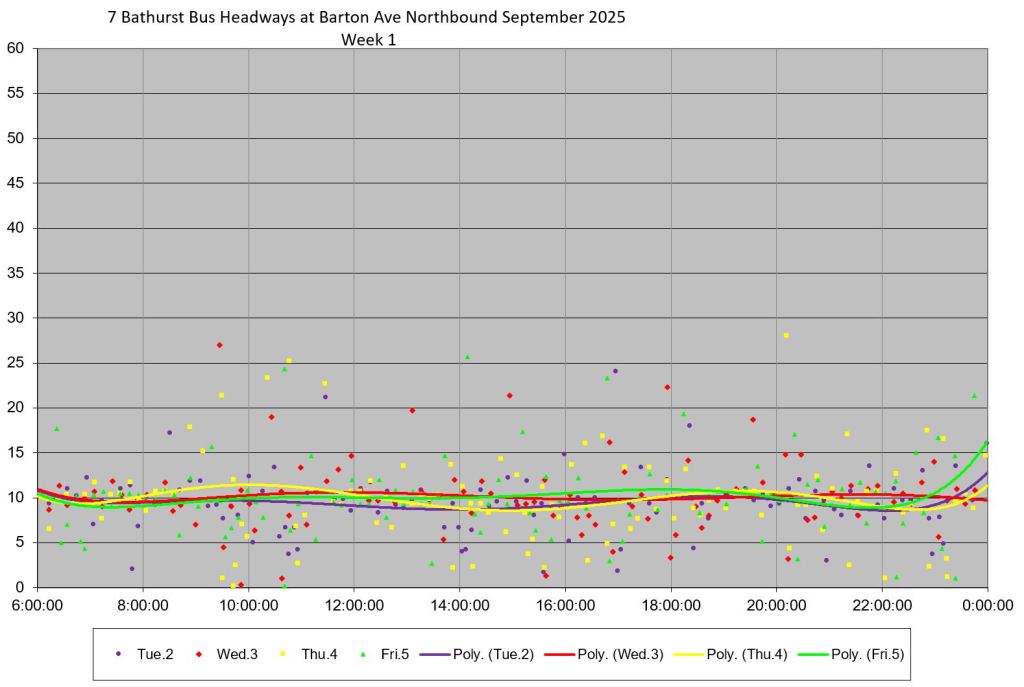
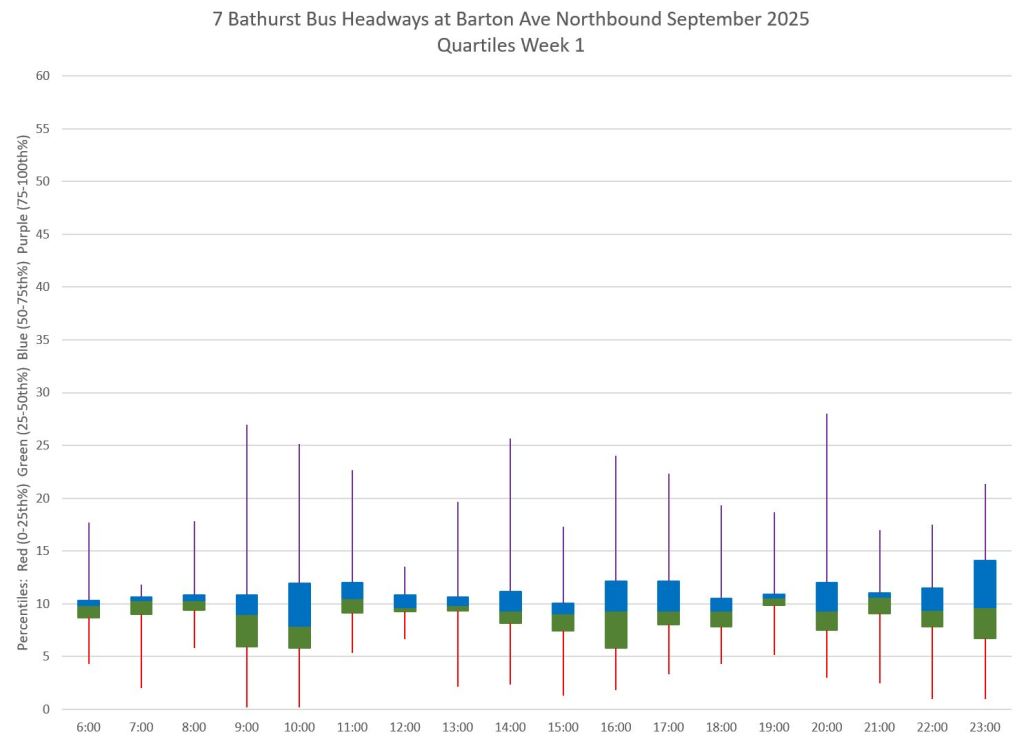
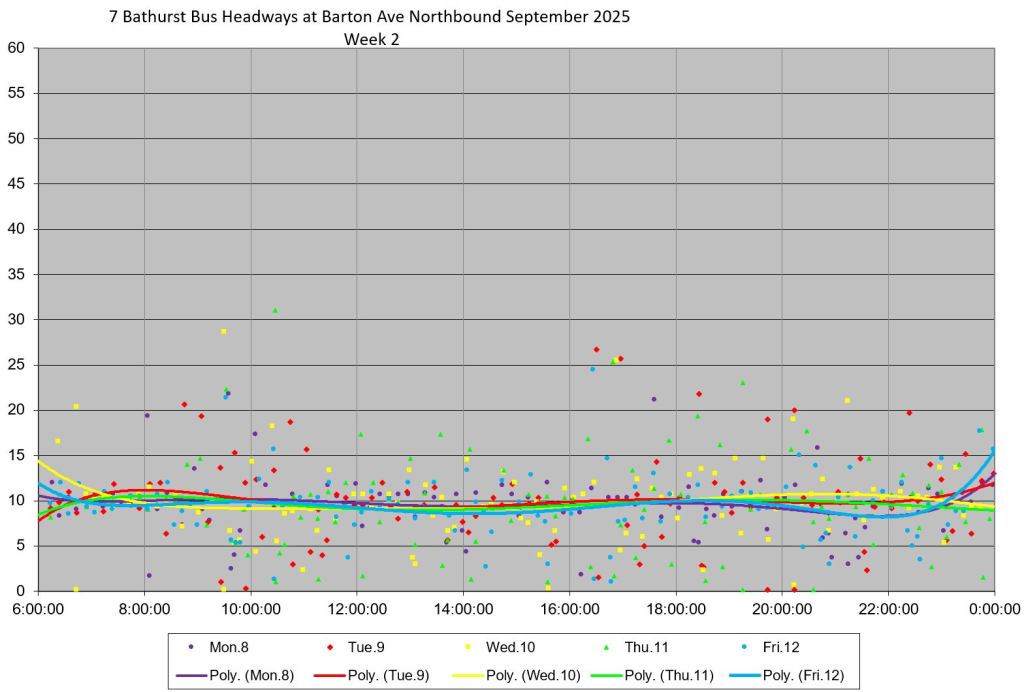
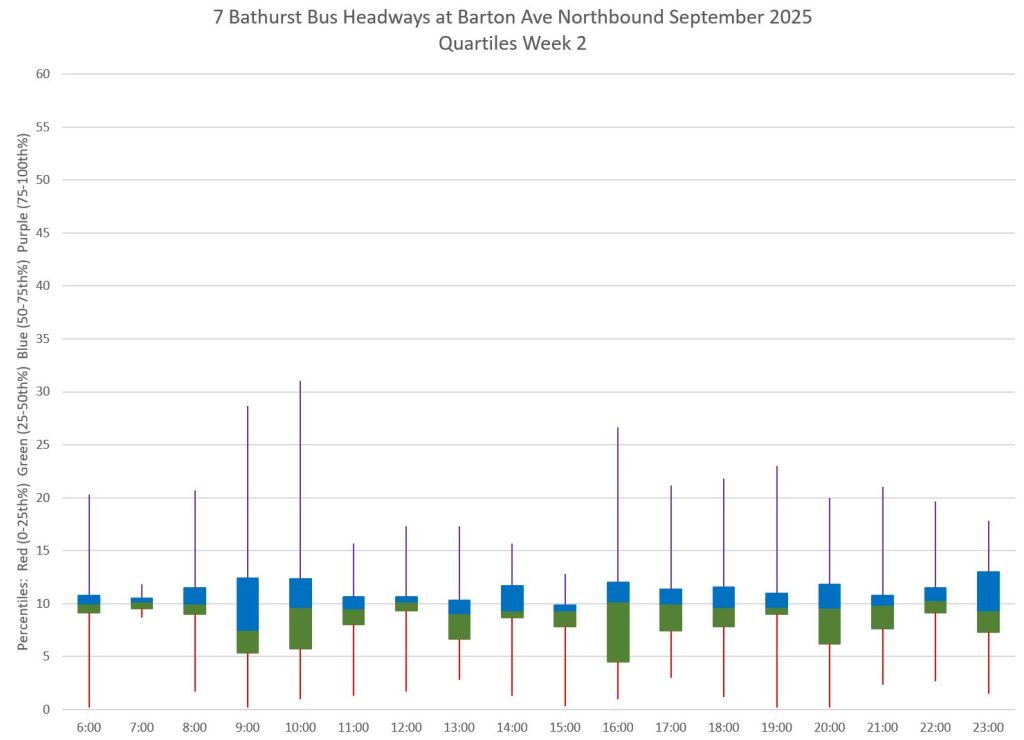
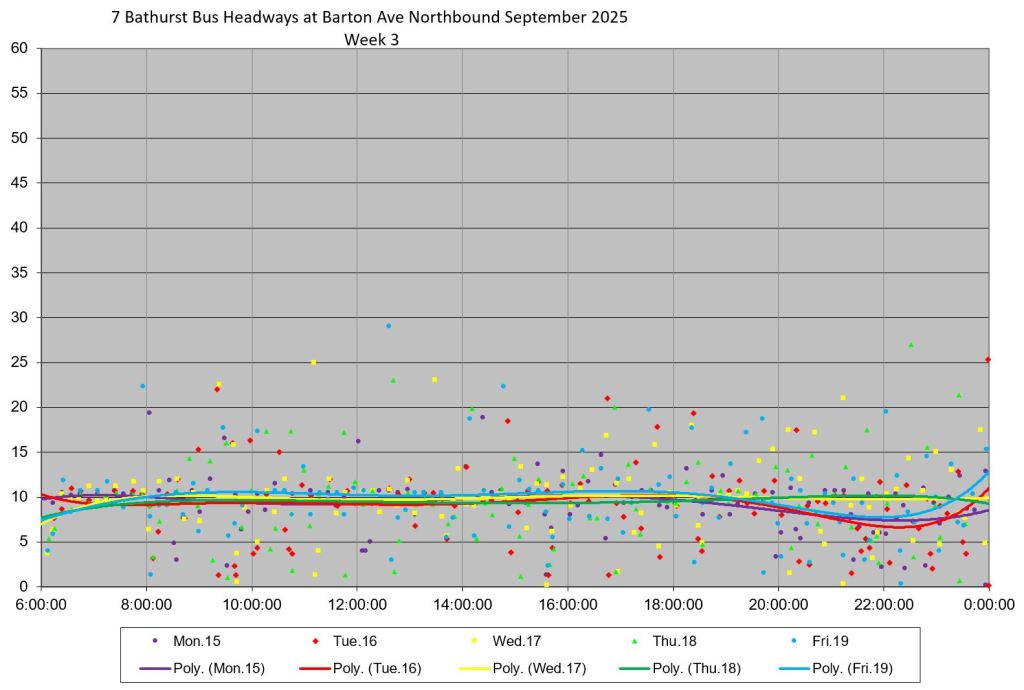
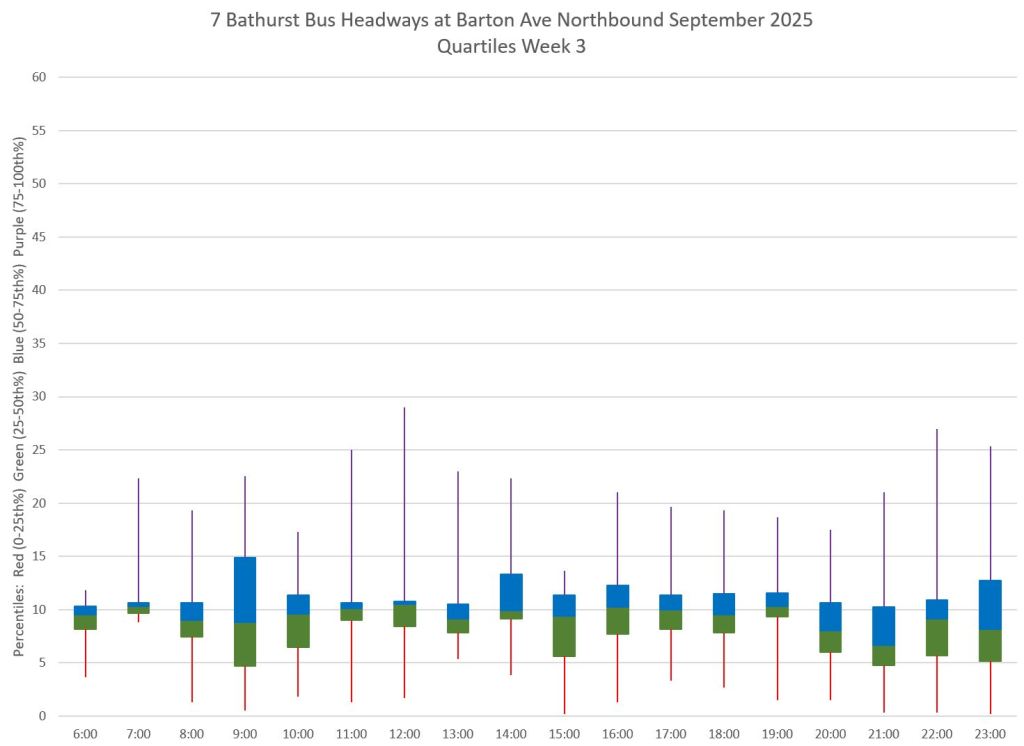
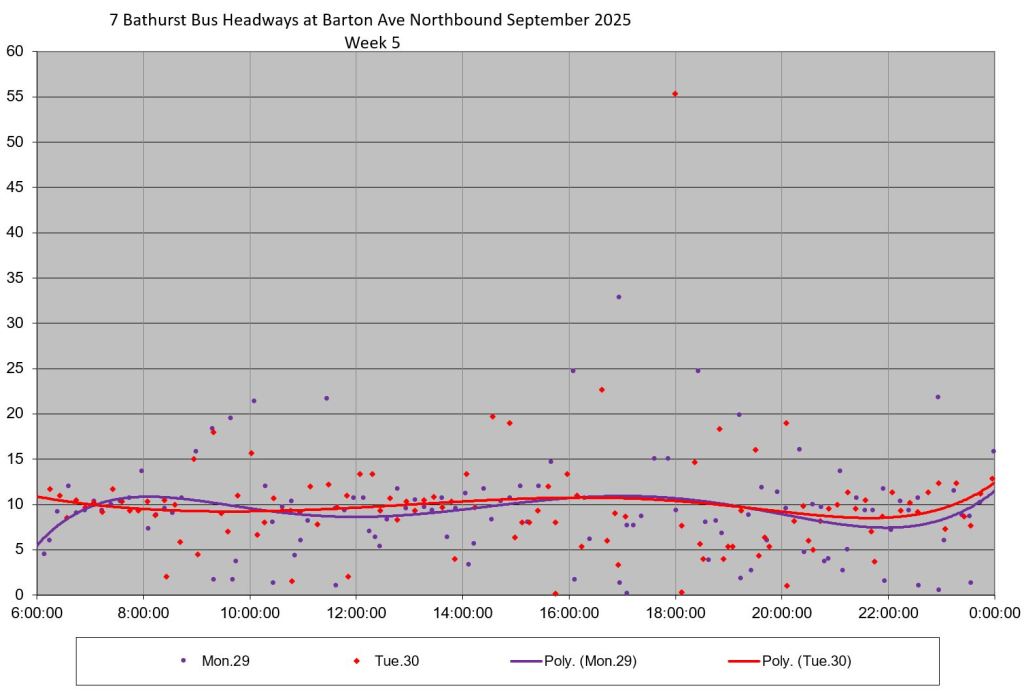
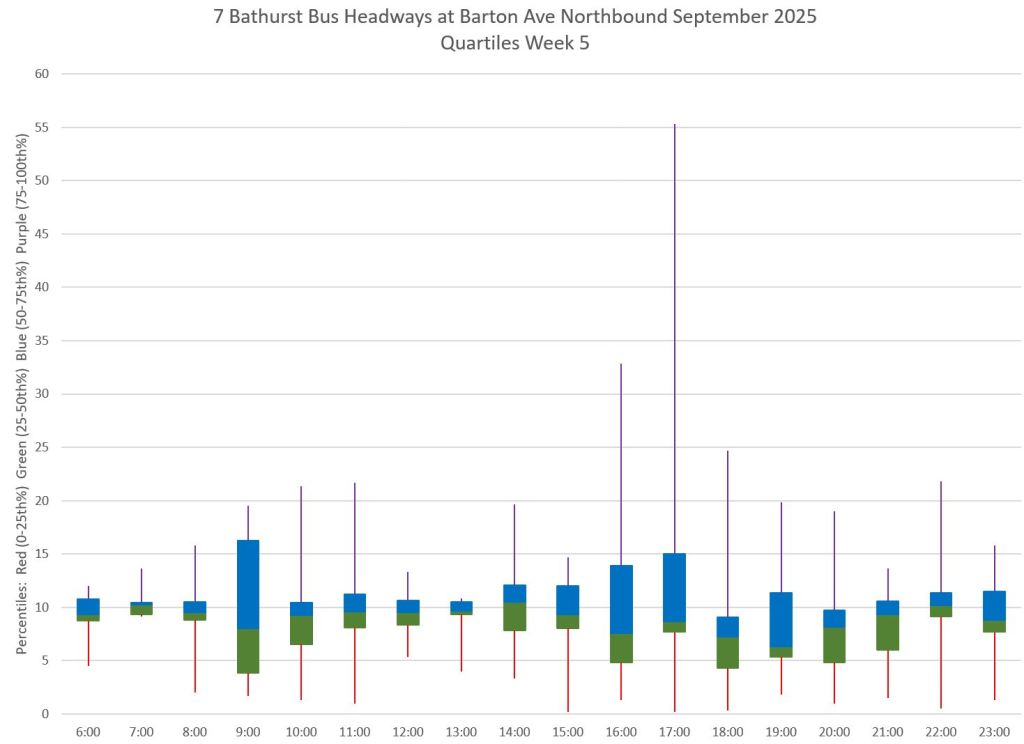
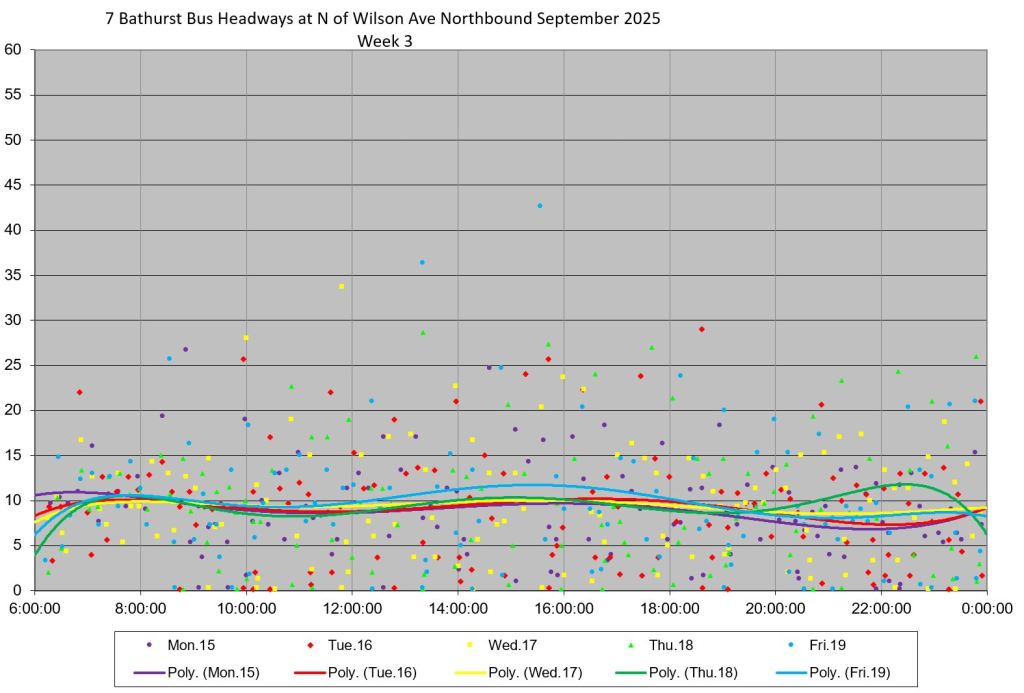
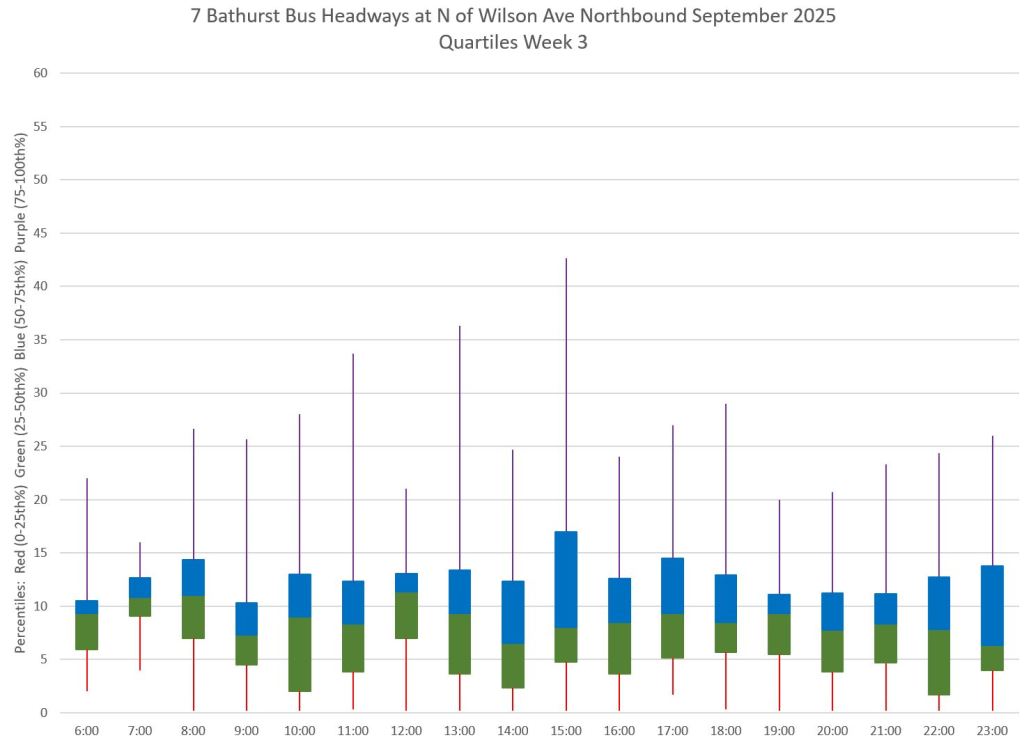
Charting Detailed Data
The charts in this section are in a format familiar to readers of service analyses on this site. They show the details of actual headways by time and day, as well as the range of values by quartile in September 2025. The location is at Barton Avenue, just north of Bathurst Station, showing the headway data for 7 Bathurst.
The headway standard allows a ±50% range from the scheduled 10 minute headway, and so anything from 5 to 15 minutes is considered within the standard. That is a very generous interpretation of reliable service.
The quartile charts show that half of the service (the central blue and green boxes) stays within this range, although there are outliers in the quartiles above (gaps) and below (bunching).
This level of detail is completely masked by the TTC’s charts above.
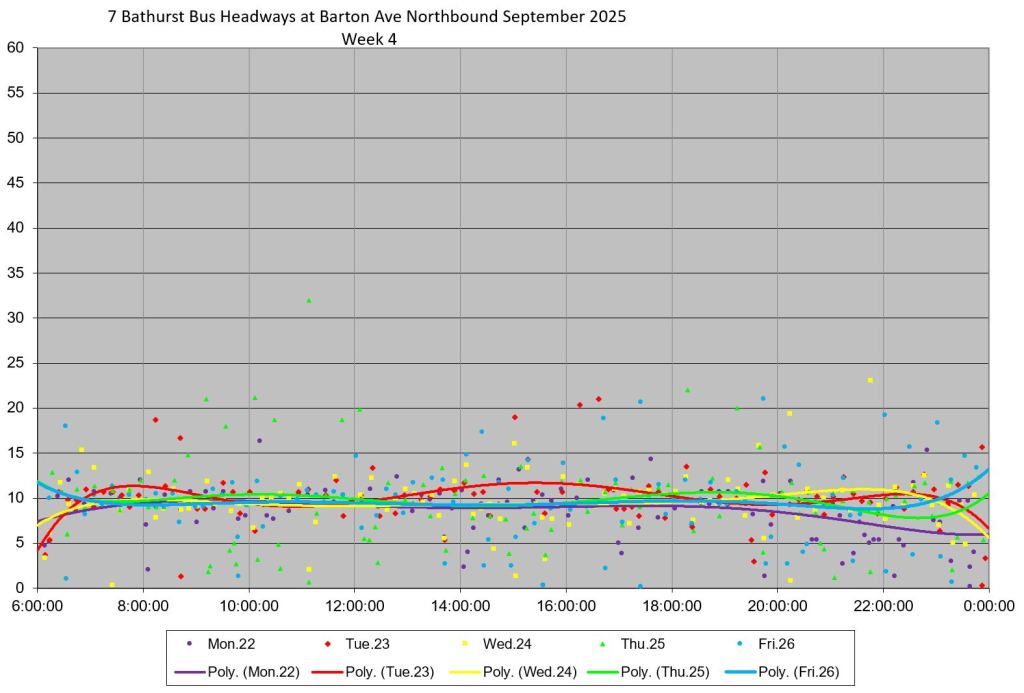
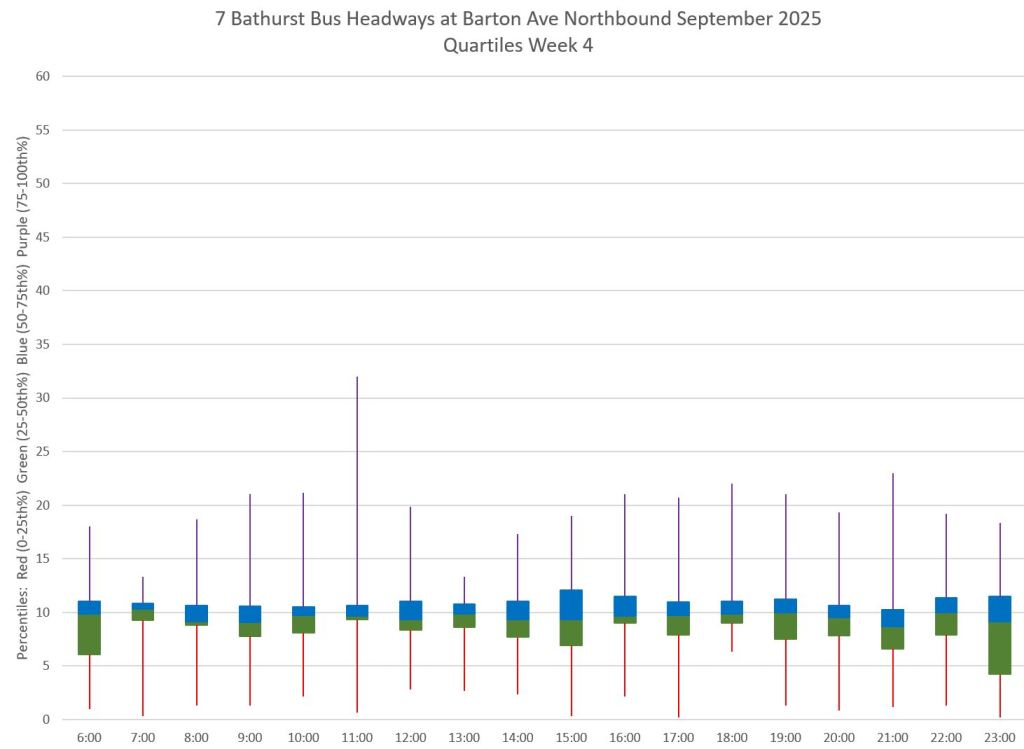
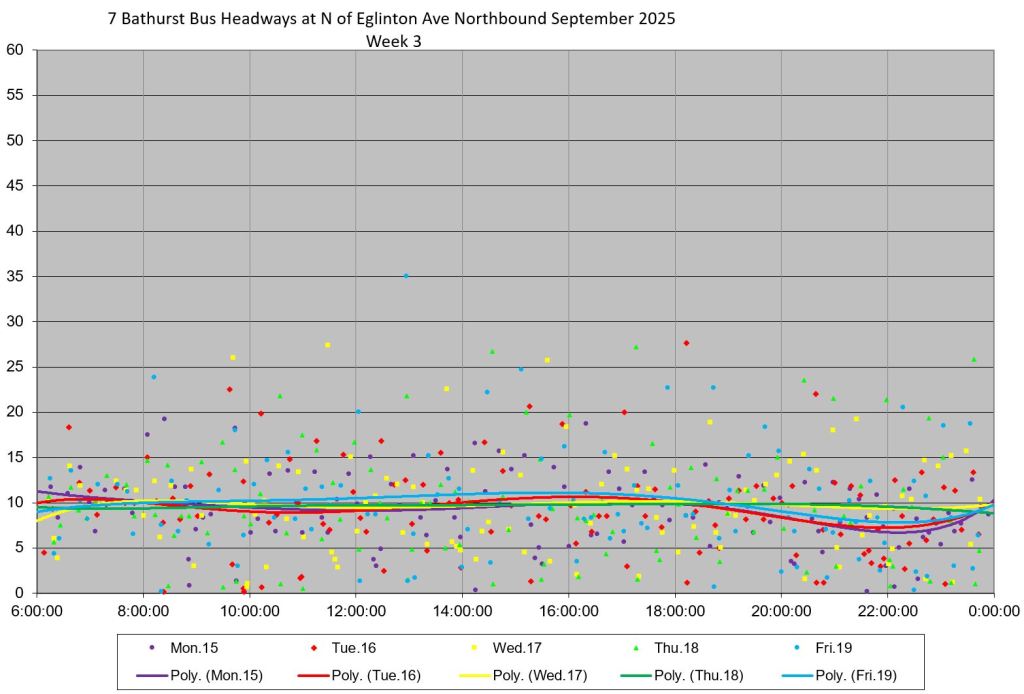
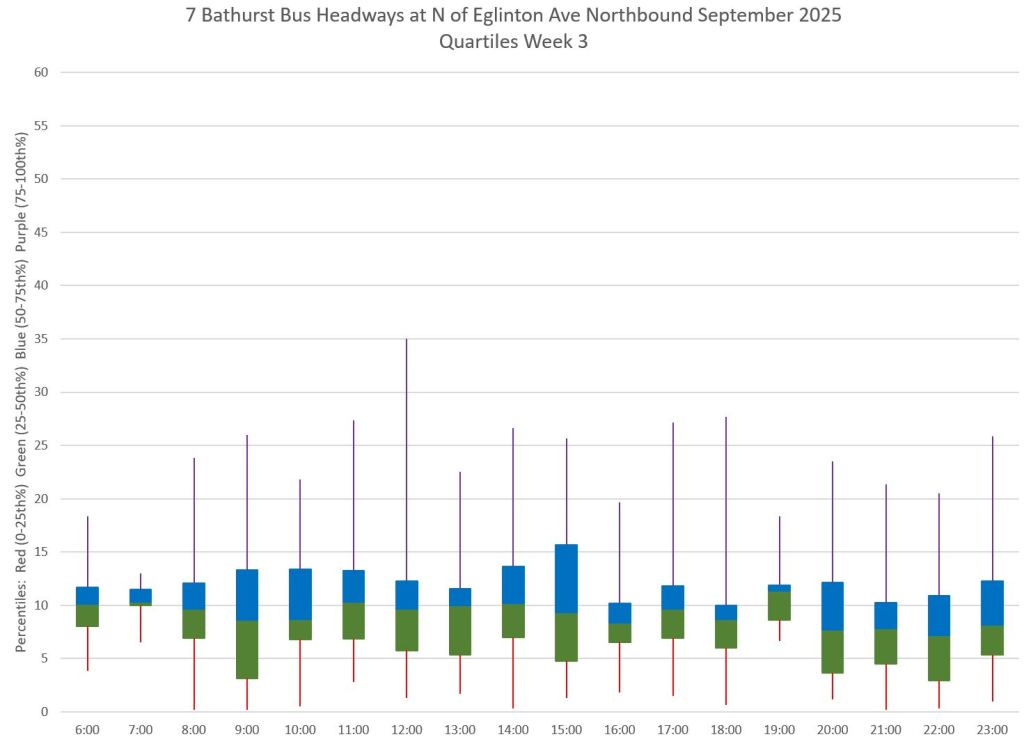
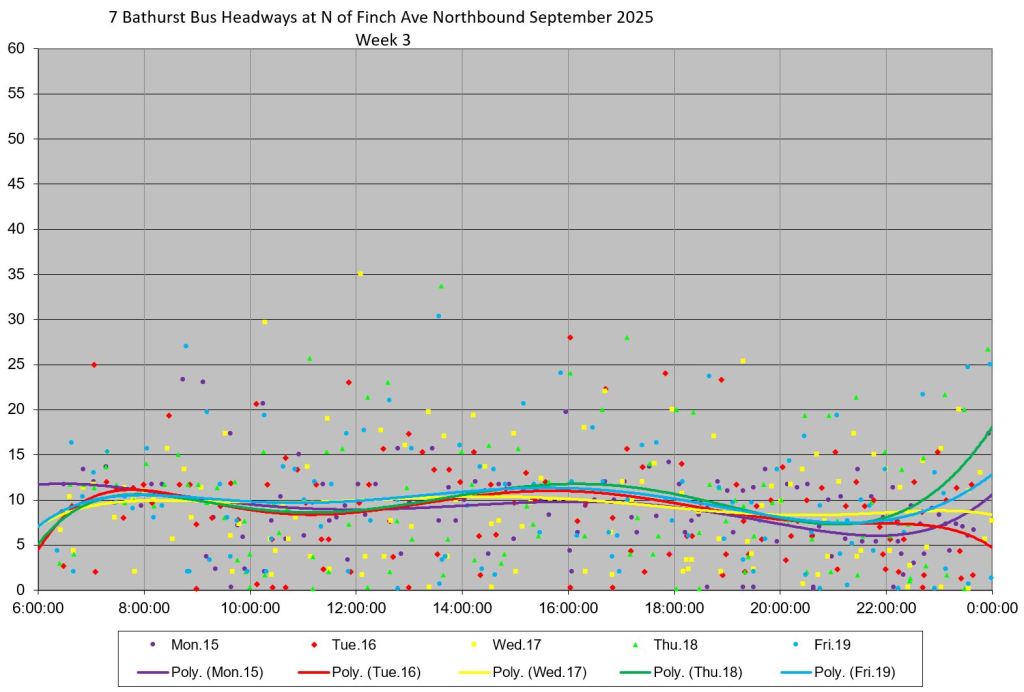
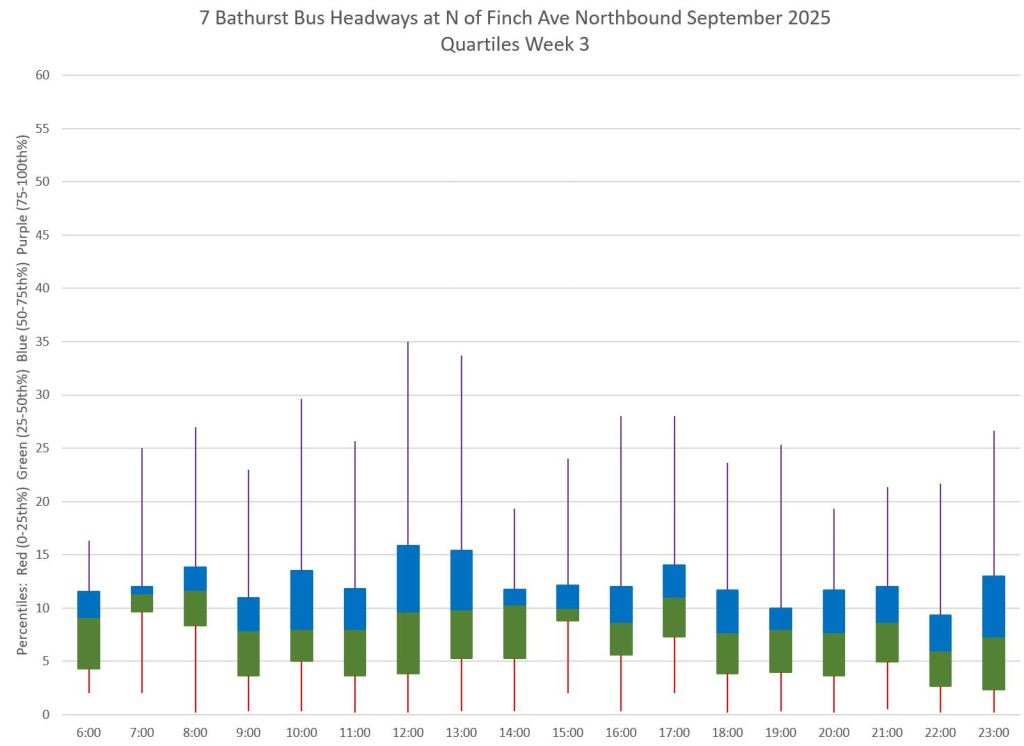
The situation is different as one moves along the route. The charts below show the evolution of data values at Barton, Eglinton, Wilson and Finch for Week 3 of September. The range of headways widens as the service travels north showing how gaps widen and bunches shorten along the trip. This pattern is seen on almost every route and is a basic challenge for mid-route headway management.

Is there anywhere in the stop spacing guidelines for usage vs just distance? It seems strange to potentially remove stops that are frequently used by riders.
(On the other hand removing rarely used stops would also not appear to be worth it as it makes little impact on travel times).
Steve: There is no reference to usage in the standards. Your point about rarely used stops should also tie into the degree of inconvenience to on board riders who obviously have no time penalty if the bus does not stop. There is a related issue with stops that are not at traffic signals where a bus can leave immediately rather than being caught by an expiring green while it loads passengers. Yes, TSP should prevent that, but signals at minor streets are lower priority for TSP than at major intersections.
LikeLike
CafeTO and street parking are a major cause of congestion in the city slowing down cars and transit alike. Big Surprise there… NOT!
LikeLike
Are drivers waiting at designated stops for being ahead of schedule part of the issue for bunching? I understand the reason for it, it seems it can be more efficiently done at rush hours, when buses are crowded.
I’ve heard delays are built into the schedule – is this true?
Steve: The information presented to drivers is based on scheduled times, and so buses might wait at some locations. However, there is enough leeway in what is considered “on time” that bunching can still occur. The TTC has yet to make a transition to dispatching based on headways.
As for schedules, they are supposed to be designed so that most buses under most conditions can make the scheduled times. Depending on road conditions, ridership and the aggressiveness of operators, there can be more time than buses and streetcars need. How they deal with this varies from route to route.
I think this could be improved by signalling changes, such as yield signs instead of stoplights. But it would would have to be a city-wide overhaul, or at least done in larger areas to be more effective. i.e. it’s a street design problem more than a TTC problem in itself.
Steve: Many locations with less restrictive traffic controls including PXOs are being converted to signalled intersections as part of an ongoing citywide safety policy where pedestrian and traffic volumes warrant it. Reversing this trend is very unlikely. The issue is to have “transit priority” that actually works in transit’s favour.
LikeLike
Shouldn’t Vaughan be also deleted? It’s very close to Bathurst stop and that segment from Christie to St Clair West is full of stops. Unless they can find a new stop to replace Wychwood and Vaughan, I guess not.
LikeLike
Not even yield signs but simple four-way stops. On a visit to Chicago last year I was surprised how many intersections had this setup that were not major streets, but still were moderately busy and thought how in Toronto there would be no way they weren’t setup as traffic signals. The drivers seemed to be much more deferential to pedestrians there, actively waving you through knowing they only had to wait a few extra seconds, not 60 for a light to change.
But then they are used to that since it’s all over the city. Toronto has gone all in on traffic lights telling you what to do. It actually felt safer to be a pedestrian there than here.
LikeLike
Frankly this program seems to be unlikely to succeed for multiple reasons.
1) scaling is prohibitively expensive – if the goal is 10%, and they haven’t achieved it on the lines they are running it on then the number of staffers required will likely have to scale to more than one person per route…figuring out what this number of staff to be successful is – should be a basic data point coming to council, especially if they want it to be successful outside of rush hour (2x, 2.5x the number of staff)
2) asking staff to do multiple tasks – are they supposed to be actively managing the route, or are they travelling the route looking for ways to improve it – the latter seems like something drivers should be able to get together and provide info on…the former is likely best done mostly or entirely by software
3) lack of capacity and political will to actually make roadside changes to parking, lights, etc…so even if changes are identified, what amount aren’t getting done, and never will
4) most big improvements to roadside infrastructure (ie with significant time savings) would show up in stats, and be identifiable by drivers, small changes might not, but won’t get you to 10% easily
5) active management by humans of transit is dumb…imagine if we got rid of all the signalling and put a person on the platform at Kipling and told them to “manage the subway line”…just tell each driver that comes in when they should leave…even if you give them an iPad and some tools, it’s too much for a human to do…software is required, and will be significantly cheaper, more effective and won’t get bored, or have to go for a bathroom break and break the system…
The TTC would be best to task these folks with looking at stats or talking to drivers in groups…maybe occasionally standing at an intersection or riding on a route…and proposing changes from their experiences…
Steve: I worry about ideas of automating route management. Already TTC is talking about AI, but the fundamental part of any system development is understanding what you are trying to do. First there must be the basic decision about schedule-based vs headway-based dispatching. Some TSP proposals talk of giving transit priority only when a vehicle is “late”, and if this in entrenched in the system it will be hard to change. Next is the fact that services are often disrupted and diverted. What does “on time” mean under those conditions? Would mixed operation of routes (e.g. King cars on Queen) see an “early” Queen car waiting on its time holding up a King car trying to get through a diversion as quickly as possible? It is the “exceptions” that are everyday occurrences that are today and will be the challenges in any management scheme be it manual or automated.
LikeLike
I’m curious about the source of the stop spacings. Using Google Maps’ measure distance tool, the midpoint of St Clair West Station to the eastbound side of St Clair and Spadina is 435 metres, while your data show it as nearly 600m. Perhaps they are counting a full lap of the station in the distances, which does not reflect the real world experience. I think Tweedsmuir is a slam dunk removal.
As for the station being a contributing factor in slowness, I have long thought that they should reconfigure the tunnel by adding a platforms along the tunnel. Eastbound passengers could either go through the ravine entrance or have a controlled crossing like we have at Queens Quay. That eliminates two turns that have to be done at a snails’ pace with a negligible change in walking distance for eastbound passengers and no change for westbound passengers.
Steve: The distances are from the TTC’s GTFS schedule files which will include the distance from the platform inside the station. Anyone walking, say, from a streetcar in the station to Tweedsmuir would have to include that distance. Re using the south side entrance and the tunnel, note that this entrance is not fully accessible. Putting an eastbound platform parallel to the existing track would probably bump into utilities under the curb lane. It’s not just a question of digging a hole. As for a pedestrian crossing over the tracks, remember that there is also bus service using that tunnel. If the WELRT is ever built, that crossing at Queens Quay station will also be problematic.
LikeLike
I think what Steve and I both mean (correct me if I’m wrong) are intersections of minor streets with major ones (e.g. Eglinton and Nairn), so my proposal is to have a yield sign for cars entering Eglinton from Nairn, compared to the light they have now. But as Steve says, it is not likely.
For smaller roads, the 4-ways stops as you suggest work fine, I would argue they should even be roundabouts (depending on intersection size).
The bigger issue is effective street heirarchy, and parking on major streets. That’s a required cultural shift that doesn’t seem tenable right now.
LikeLike
If I was running an automation program, my main goal would be to reduce the need for human interaction in the simple cases first…and flag anything out of the ordinary to humans.
This means focus on the base case before getting too complicated.
1) can we tell a driver to leave, slow down or stop automatically…this shouldn’t require human interaction – unless it’s requested
2) can we manage simple routes to headway and to schedule in an automated fashion – again if something goes wrong flag it
This is probably 30-50% of what the bus network does all the time. That’s a lot less humans needed in the system.
Then start adding complexity…can we figure out how long a short turn will take, and figure out logic on when it makes sense to do them…
Can we draw a new route on a map, and have the system figure out what the new times will be and start managing to that…
Can we deal with end of shift, and beginning of shifts.
Can we deal with automatic rerouting if we close a road or there is a collision.
Each of these features allows for a bit better way of eliminating the need for people to do that thing.
It’s also pretty clear a lot of these features exist in certain software packages already…whatever is provided will have gaps that people will have to fill…
But at the end of the day, trying to cover even the basics would be better than what is happening today…
Steve: When I write it up, you will see that TTC is working with York U on an AI route management pilot. My gut feeling is that this will only be as good as the targets it is given to meet, and the understanding and “training” that goes into the model.
Yes, the basics are fairly easy to deal with, but a problem at TTC is that they tend to ignore the other cases and how they would deal with unscheduled circumstances. A staged implementation is a common approach to any new system, with the proviso that te “Mark I” version not include built-in assumptions/constraints that would hobble future additions.
LikeLike
Living along the 512 route and using it nearly daily, it is really baffling that they can’t manage this route. A 6km route with a full ROW and increased “supervision” yet you still have long gaps with no explanation.
Seeing the comments about “congestion” at St. Clair West doesn’t add up to me. Very rarely is a RAD car stored there- more often they’re at the Earlscourt Loop (or in service). Also very infrequently is any service bypassed from SCW to get back on schedule. More often, any congestion or delays is from operators taking a bathroom break, or arriving late as a few board periods ago, the change off spot moved to SCW. As well, if you look at the schedules, westbound cars are given about 7 mins from St. Clair station to St. Clair West, and then another 7 minutes to get from St. Clair West to Bathurst so any delays should be accounted for. Congestion at endpoints comes from the excessive layover time built into schedules, plus operators taking extended breaks. Far too often do I see an operator arrive at St. Clair station behind schedule, then take another 5-10 minutes to use the bathroom or go to the McDonald’s at the station.
A lot of the issues I found with this pilot was that it never seemed to be about managing headways. Rather, it seemed to want to keep cars on time. You’d still have bunching, gaps and short turns, rather than attempts to hold cars to maintain an 8-minute or 6- minute headway. Doesn’t make much sense as St. Clair shouldn’t have the same issues as other routes.
Signal priority would probably trim down 10 minutes on each trip. You’d think the TTC and city with a budget shortage and not enough streetcar operators would try to maximize their driving time, but alas…there 8-10 minutes of layover time after each trip
LikeLike