
In a previous article, I examined headway reliability on several routes that had been flagged for improved management by the TTC.
The 512 St. Clair car received improved service in September 2025, and this article updates the charts with headway stats to September 30 showing the combined effect of more service and route management.
Weekday service over the 2024-25 period has had three main levels: bus operation during a long-running construction project in 2024, followed by streetcar service with headways improving only in the last month.
| Effective | AM Peak | Midday | PM Peak | Early Eve | Late Eve |
|---|---|---|---|---|---|
| 5-Sep-23 (Bus) | 3′ | 5′ | 3’30” | 6′ | 10′ |
| 24-June-24 (*) | 8′ | 8′ | 8′ | 8′ | 10′ |
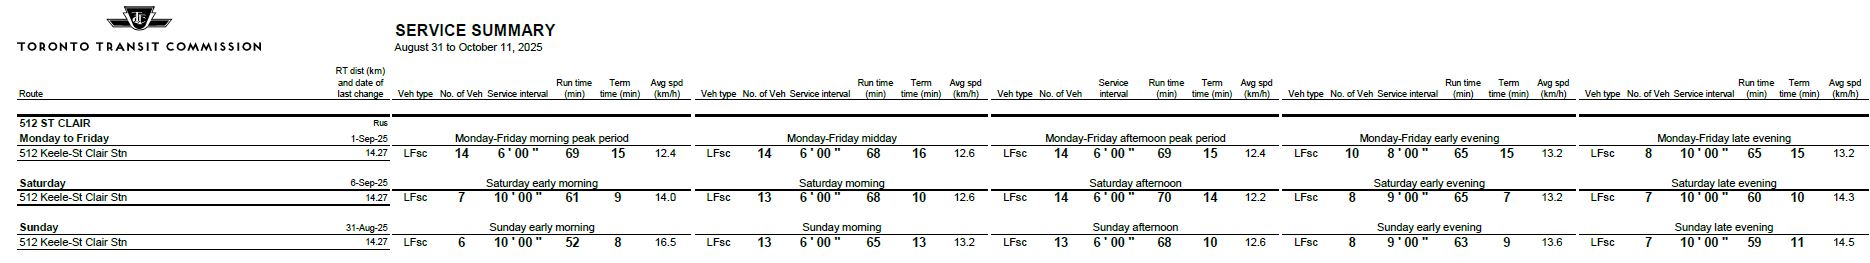
| 2-Sept-25 | 6′ | 6′ | 6′ | 8′ | 10′ |
(*) For a period in Oct-Nov 2024, the route was split with streetcars operating from Gunn’s Loop (Keele) to Bathurst Station, and buses from Oakwood Loop to St. Clair Station. This was not shown in the published service summary, but does show up in the observed data for the portion of the route operated with buses.
Generally speaking, the range of headways at various points on St. Clair did drop in September 2025, although the effect is more pronounced early in the month than later. Whether this indicates a trend away from tighter headway management as the month wore on will not be clear until more data have accumulated.
During the period of bus operation, the median headway (50th percentile) did not move around much, but this is not the case with the streetcar periods. A reason for this is that with wider scheduled headways, it is more likely that within one hour the scheduled number of vehicles will be higher or lower by a more substantial amount than with the more frequent bus service. Conversely, with the shorter scheduled bus headways, it is much more likely that vehicles will run in pairs because it is much easier to catch up to the bus only a few minutes in front.
A long-standing problem on streetcar routes with larger and larger vehicles (PCC/CLRV, ALRV, Flexity) is that scheduled headways to provide comparable capacity widen, but the laissez-faire attitude to line management results in much worse swings in vehicle spacing. This is compounded by Service Standards that accept a wider range of headways for less frequent service. The issue of meaningful Standards is to be reviewed in coming months by the TTC, and this is an area where Standards should not be compromised just to preserve “good” performance stats for management.
As shown in many analyses published here, there is a general problem with headways becoming more erratic as vehicles move along the route. St. Clair is entirely on its own right-of-way, except for a short stretch at the western end. It also has a mid-point opportunity for headway regulation at St. Clair West Station. Data for departures from that point suggest that little or no headway management occurs there.
TTC Service Standards for terminal departures specify a range of 1 minute early to 5 minutes late, although recently the service metrics were change to eliminate early departures. In any event, a 5 minute window for being “on time” combined with a 6 minute scheduled service means that service can be badly bunched and still “on time” for reporting purposes.
Along the route, the Standards prescribe headway variations of ±50% so that for a 6 minute headway, an actual range of 3-to-9 minutes is permitted. For an 8 minute headway, the permitted range is 4-to-12 minutes. To compound credibility problems, this only has to be achieved on 60% of trips. [See TTC Service Standards at pp 15-16.]
Needless to say, when the TTC says that service meets their standards, the quality can vary quite widely from what riders might expect as “reliable” operation.
Following the “more” break, the first section looks at the evolution of headways along the route west from Yonge and east from Keele during various periods over the day. AM Peak values tend to be slightly more reliable, but even they worsen the further from the terminal one goes.
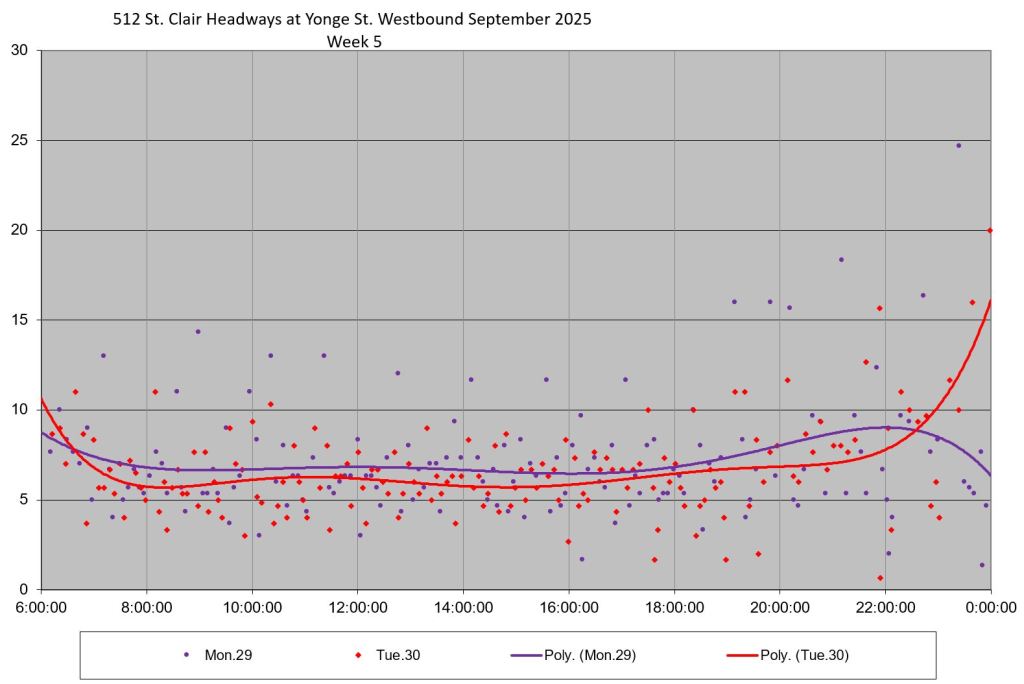
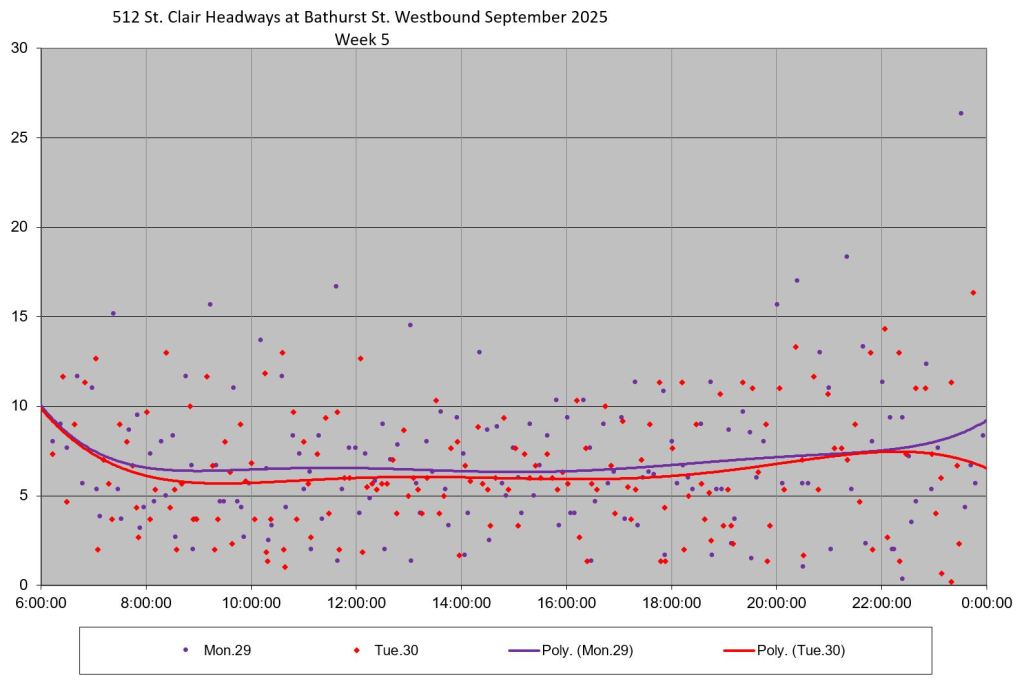
The second section presents the detailed headway data from September 2025 to show the actual scatter of headway values by day and week, and including weekend data.
There is some indication that the TTC has attempted better headway management on 512 St. Clair, but the results are uneven and there are clear signs of locations and time periods where service is not regulated at all. In turn, this shows what “normal” operations are like without active dispatching and spacing of cars along the route.
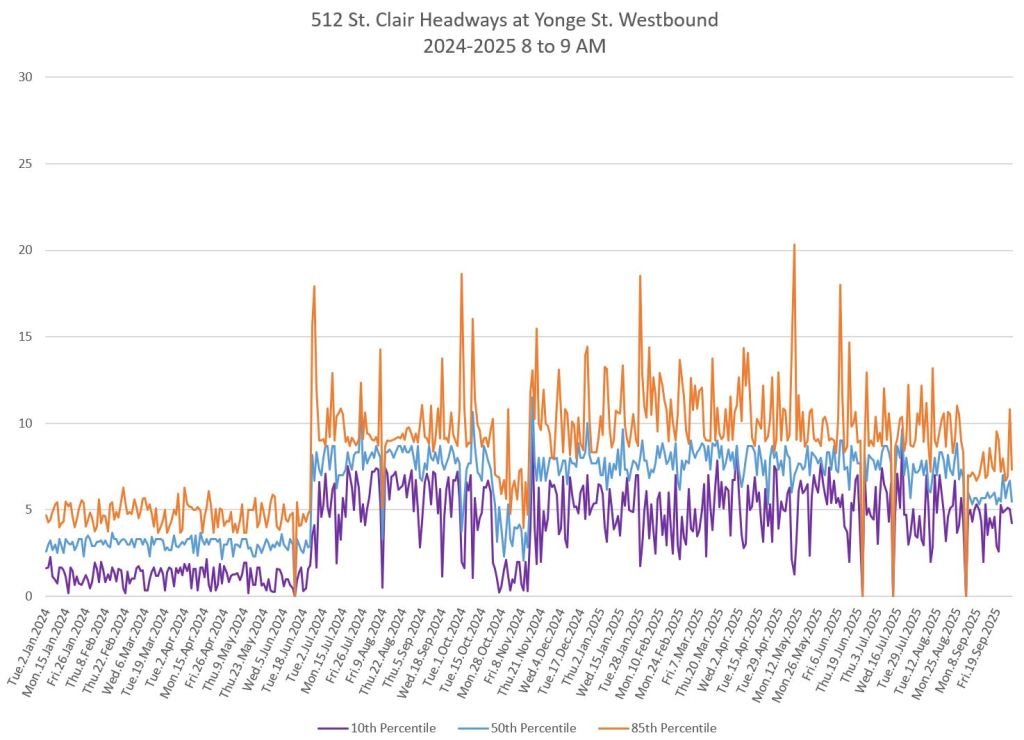
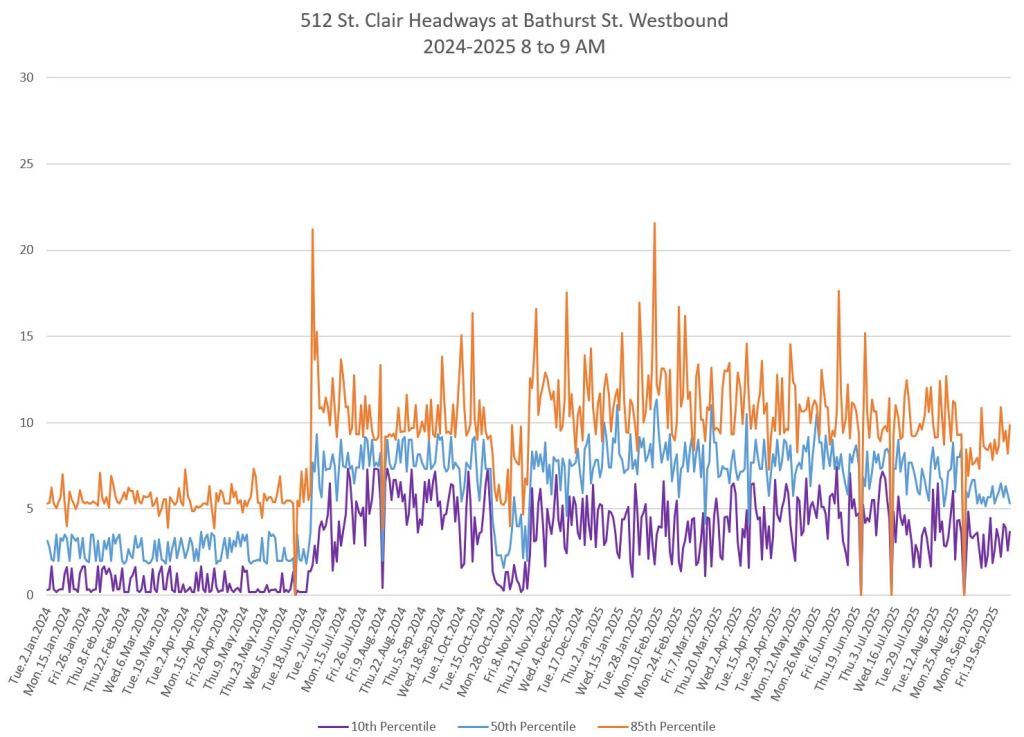
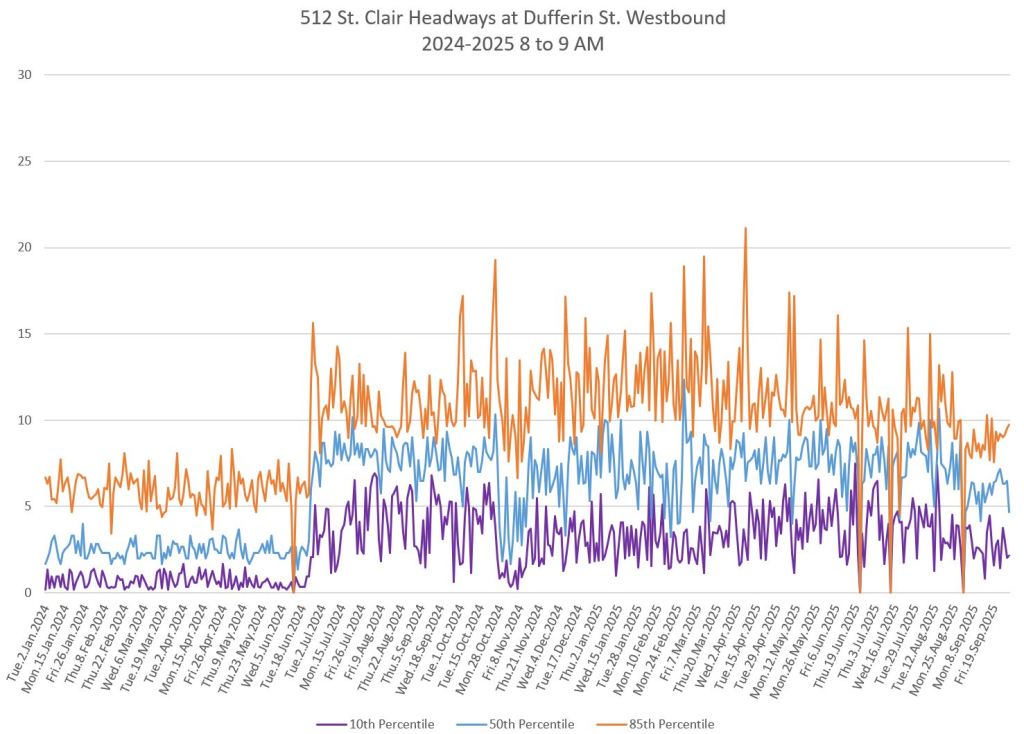
AM Peak Westbound
The median headway westbound at Yonge ranges over roughly two minutes from day to day during the streetcar era, but this variation becomes wider the further west one goes. According to the standards, the acceptable headway was from 4-12 minutes until September 2025 when the range dropped to 3-9 minutes with the more frequent scheduled service. The space between the 10th percentile (purple) and 85th percentile (orange) sometimes, but not always, lies within the band set by the Standards.
The drop in values shown in fall 2024 is due to the split bus and streetcar operation.
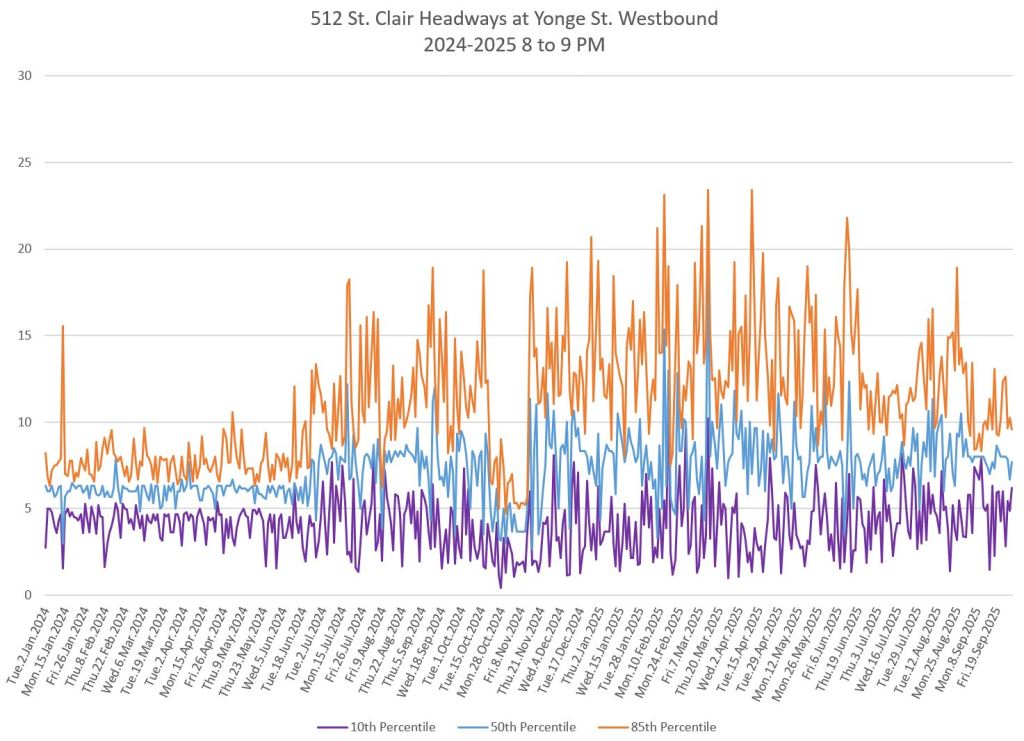
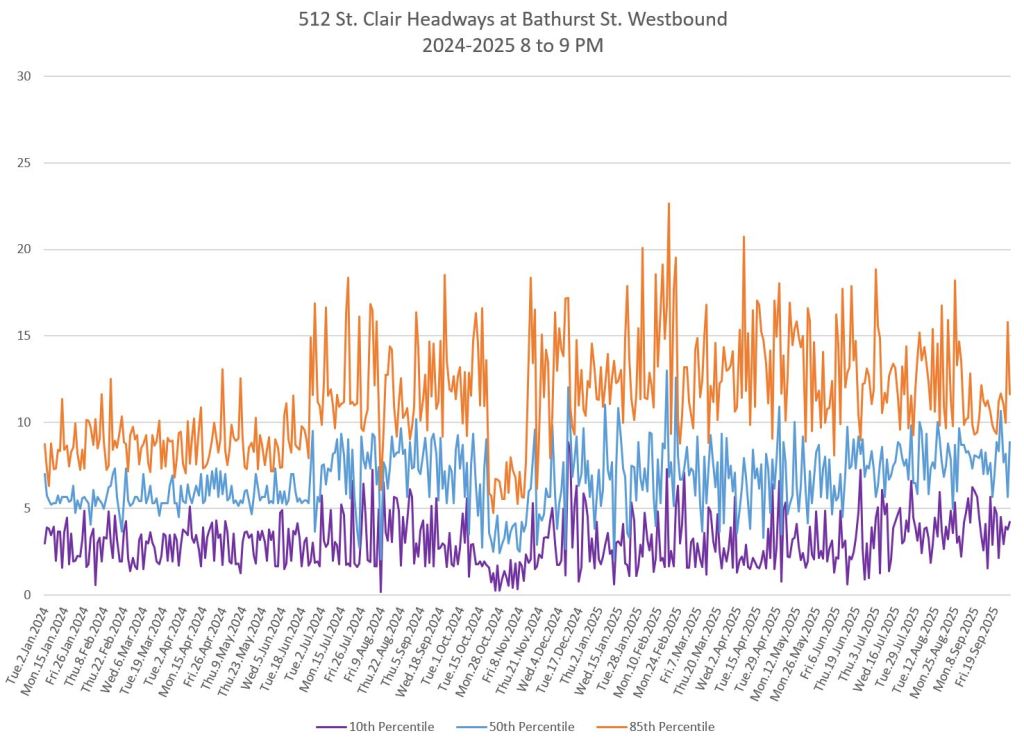
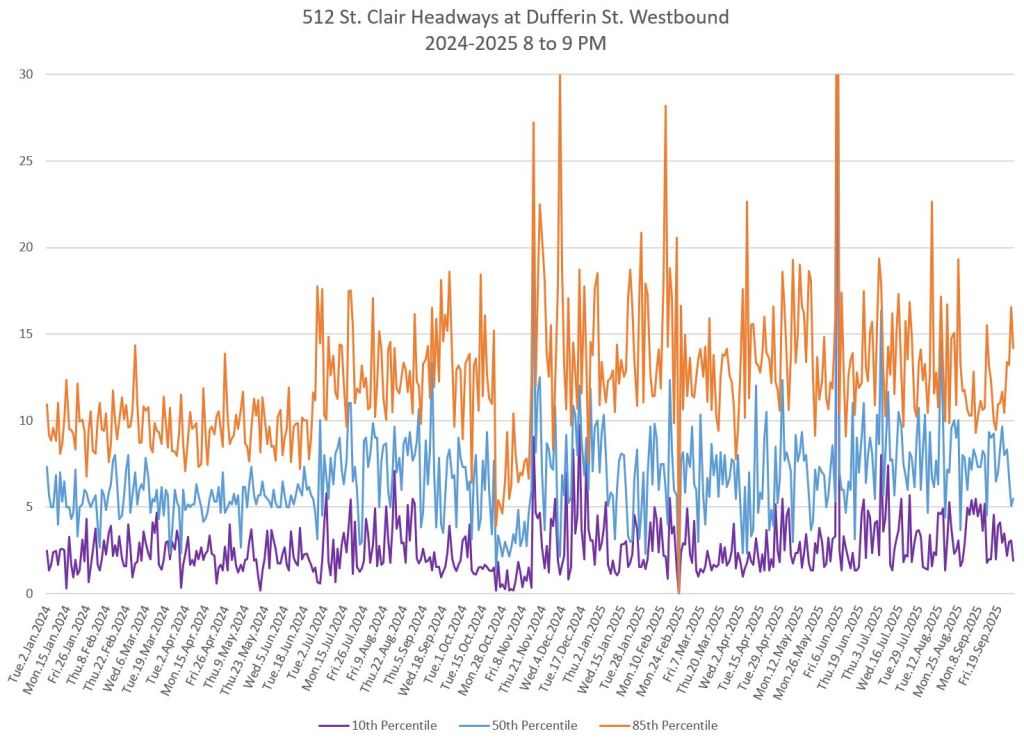
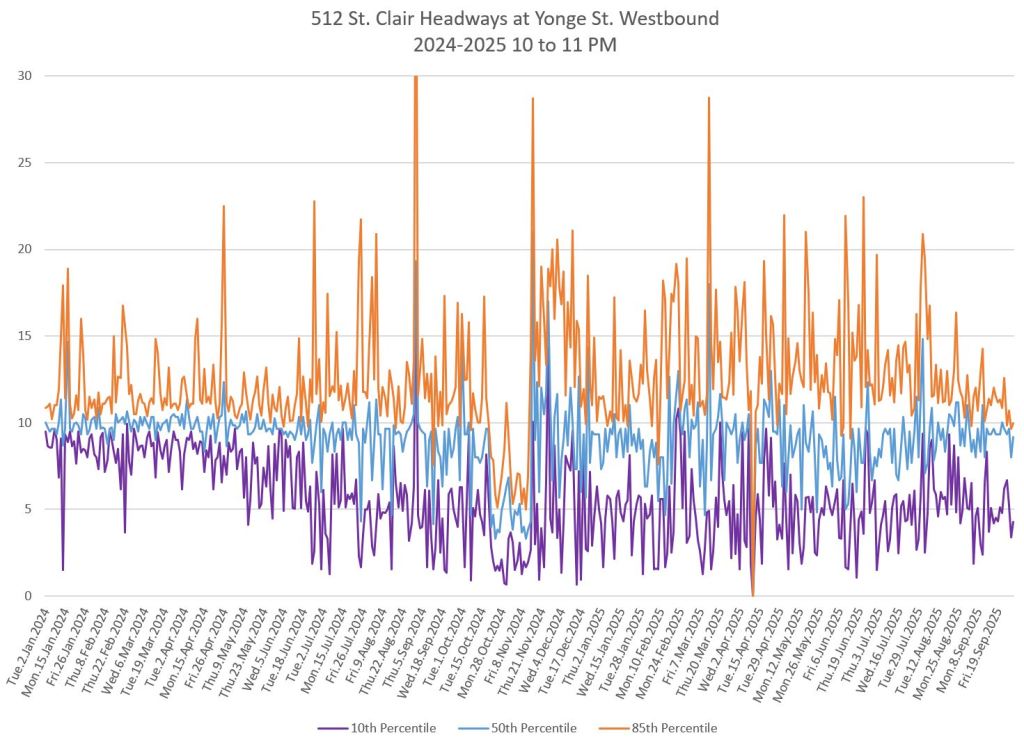
Midday Westbound
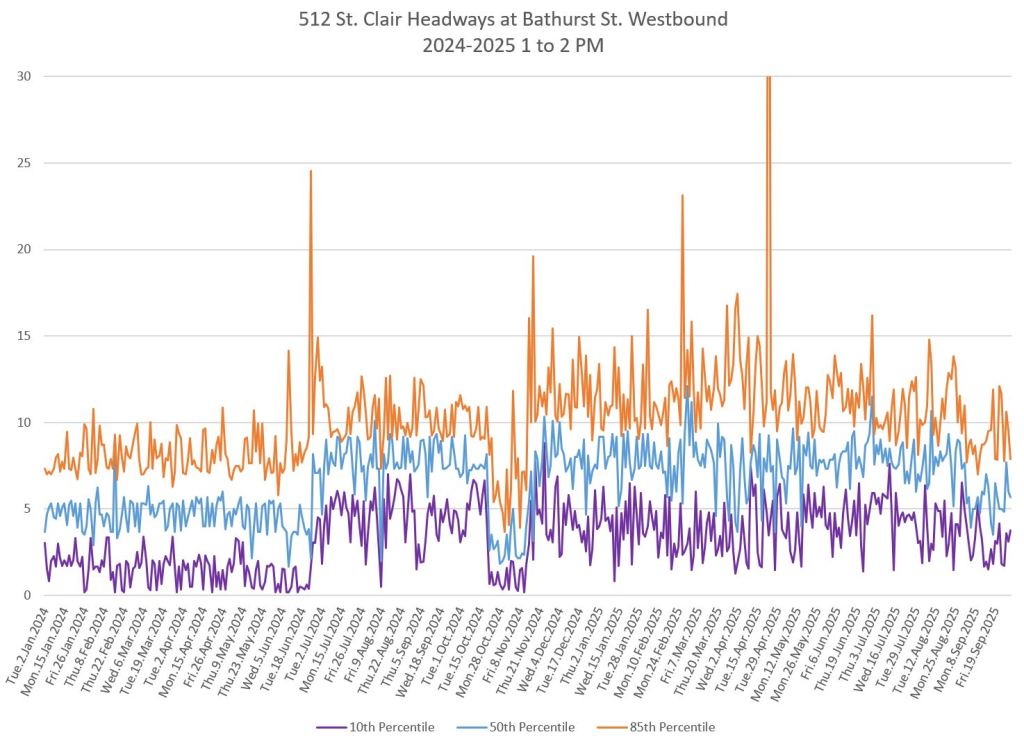
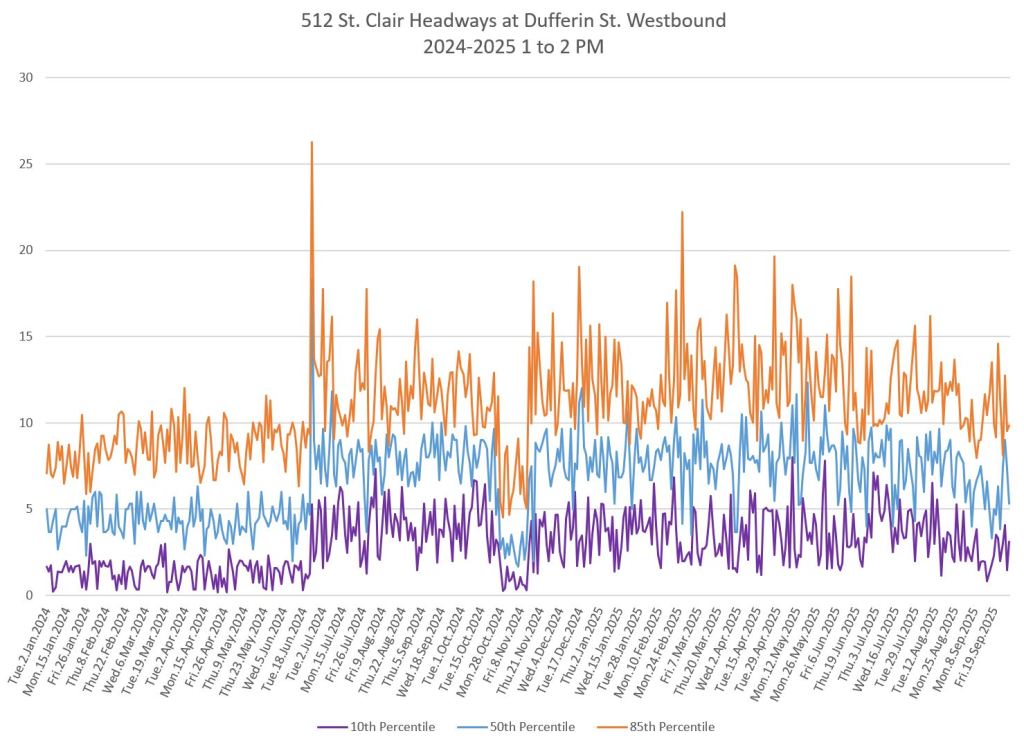
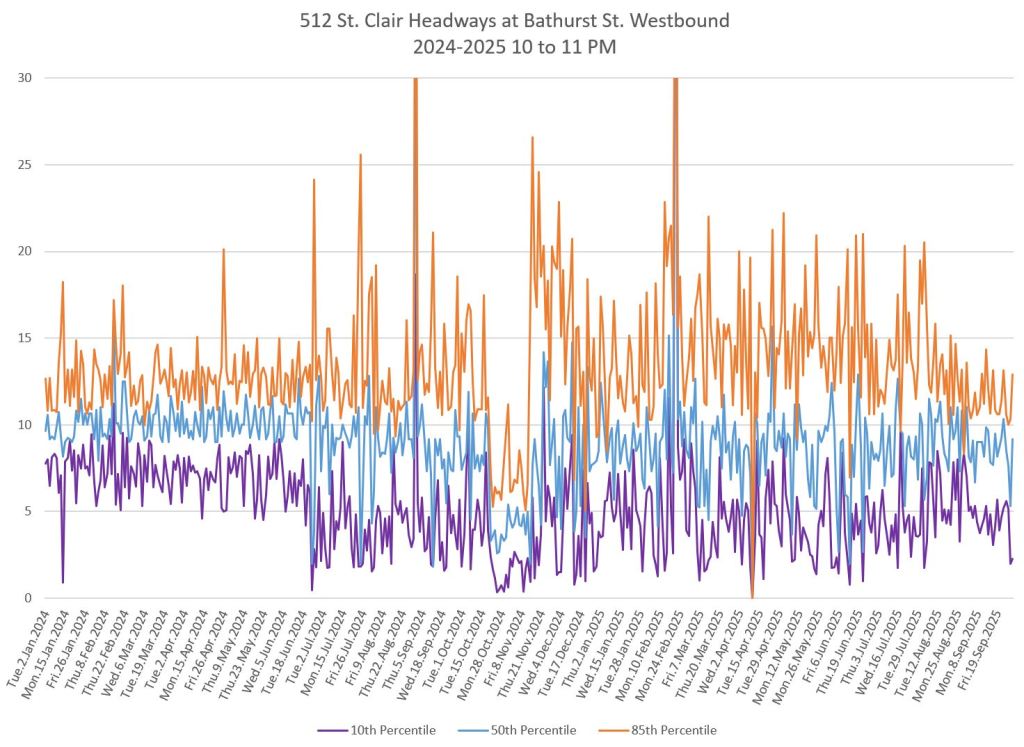
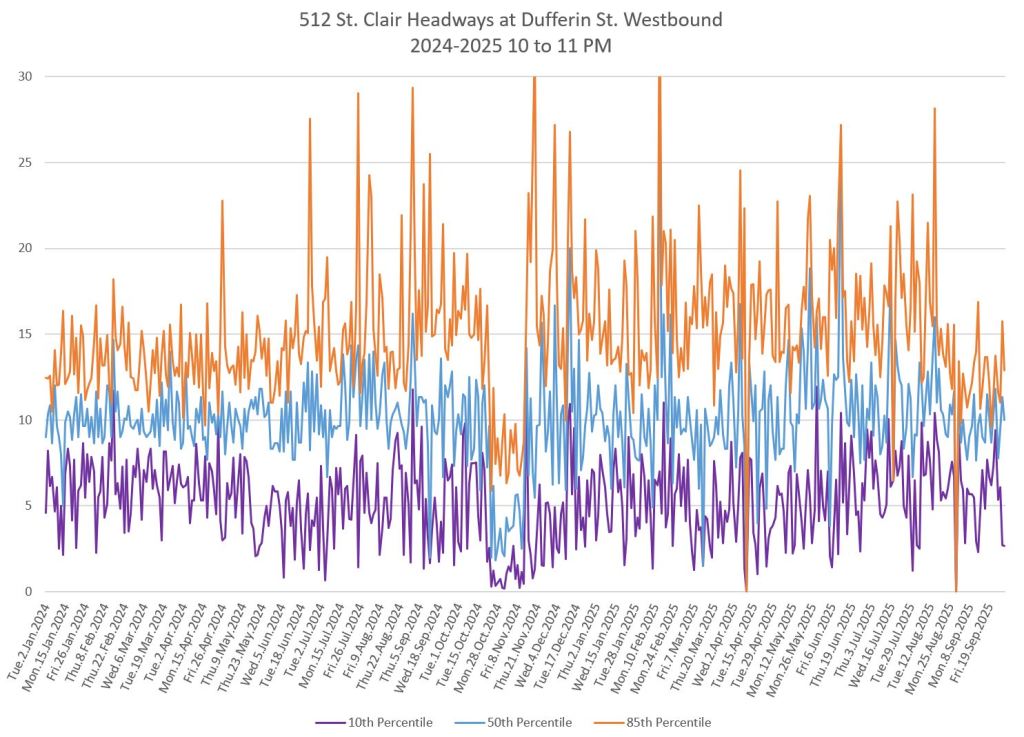
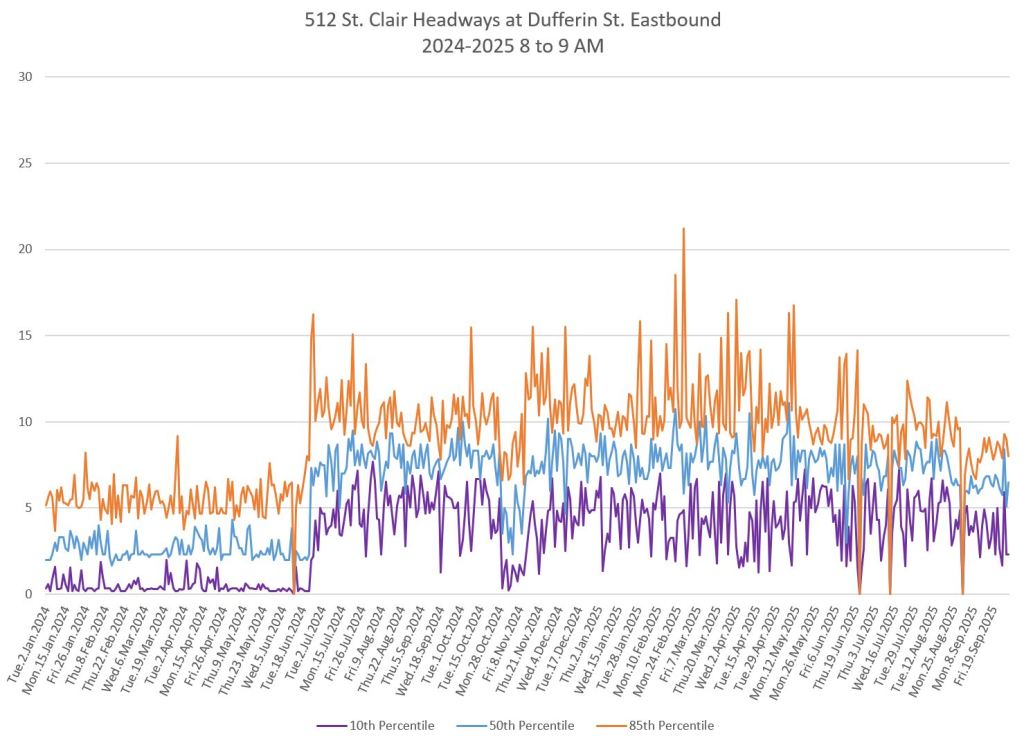
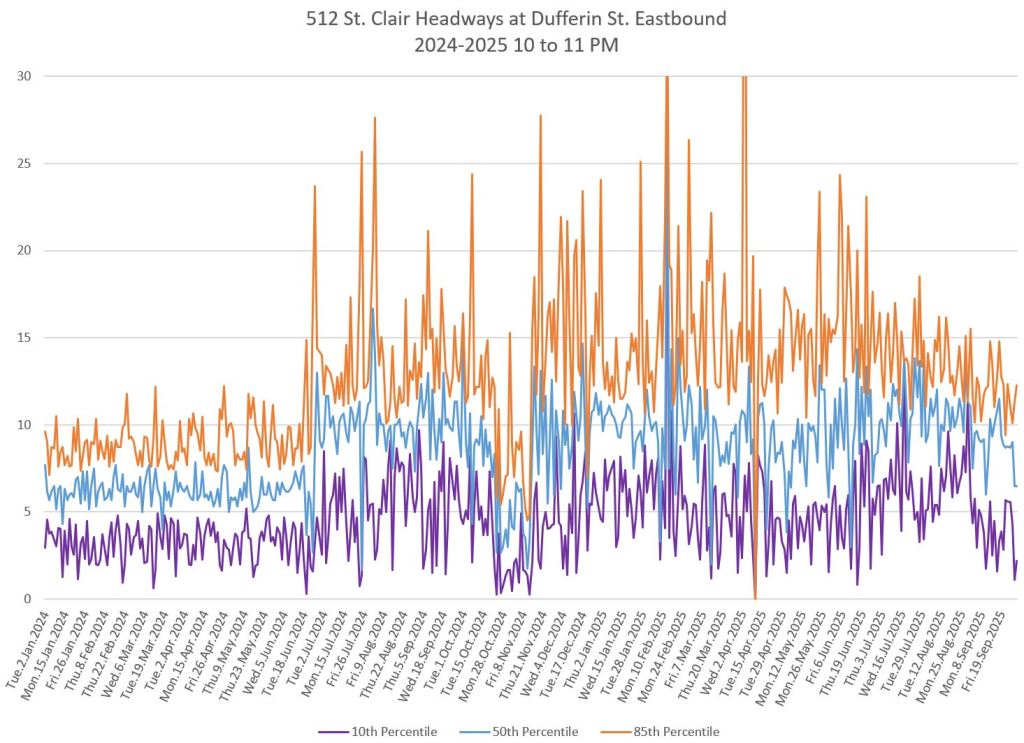
The median headway is fairly well behaved westbound at Yonge, but its range opens up westbound at Bathurst (west of St. Clair West Station) and even moreso by the time cars reach Dufferin Street.
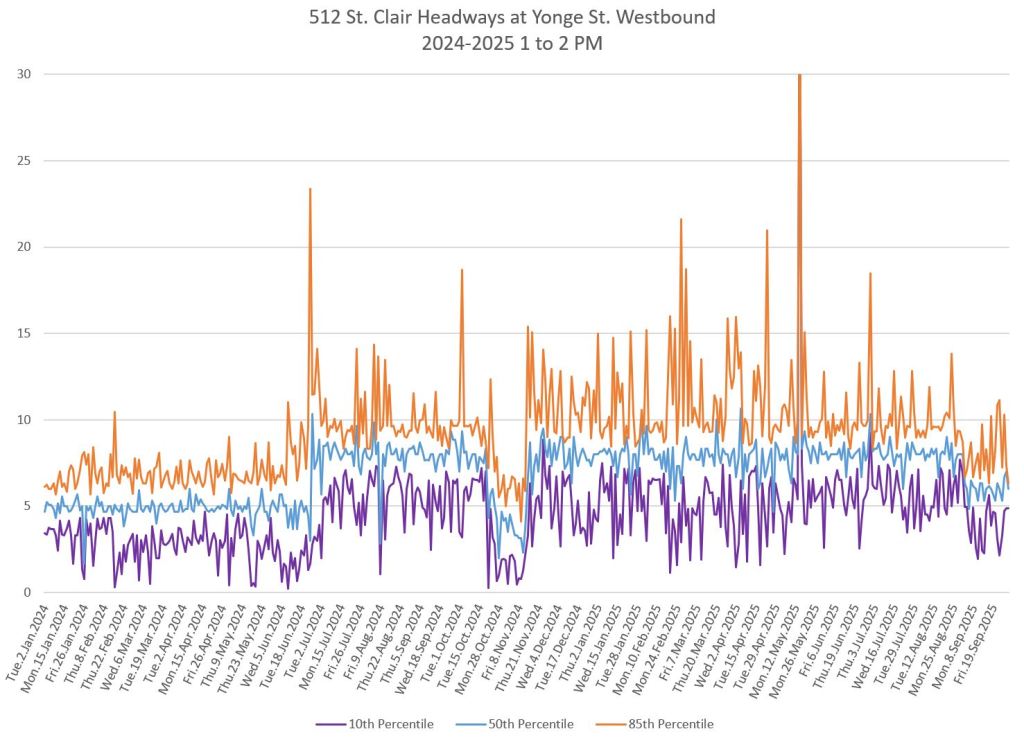
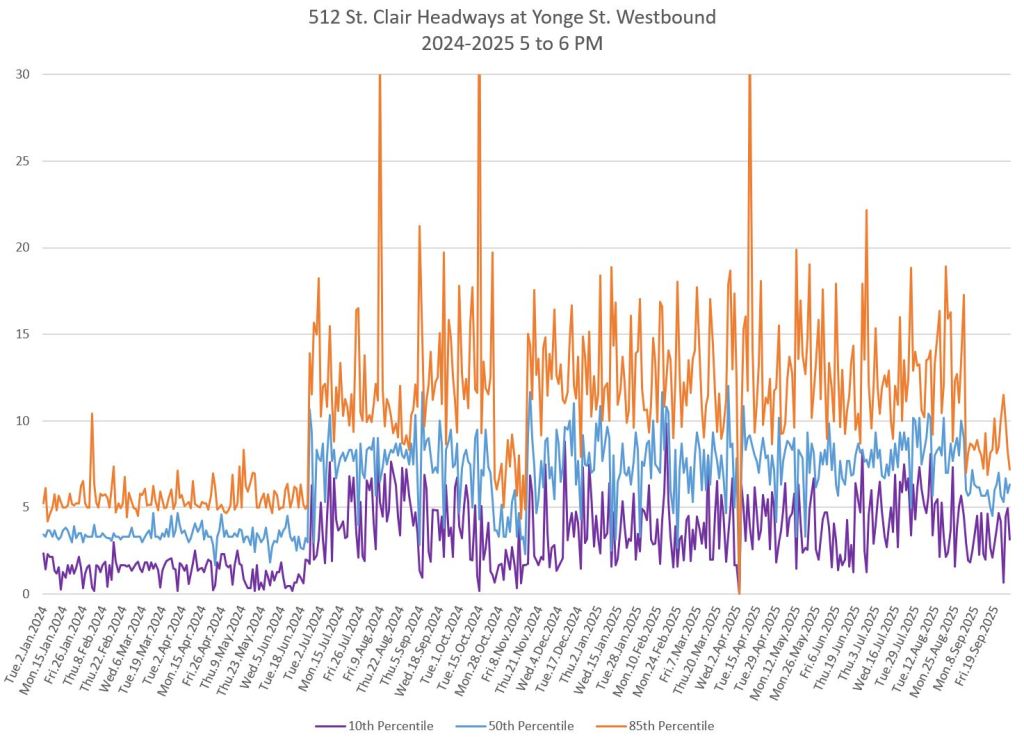
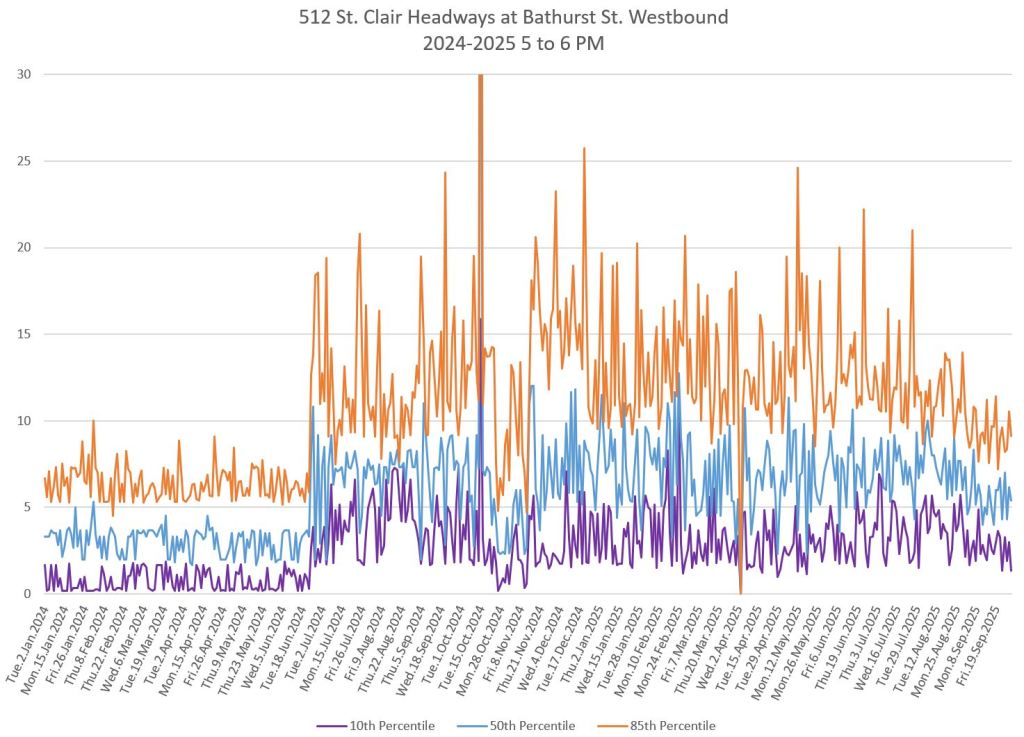
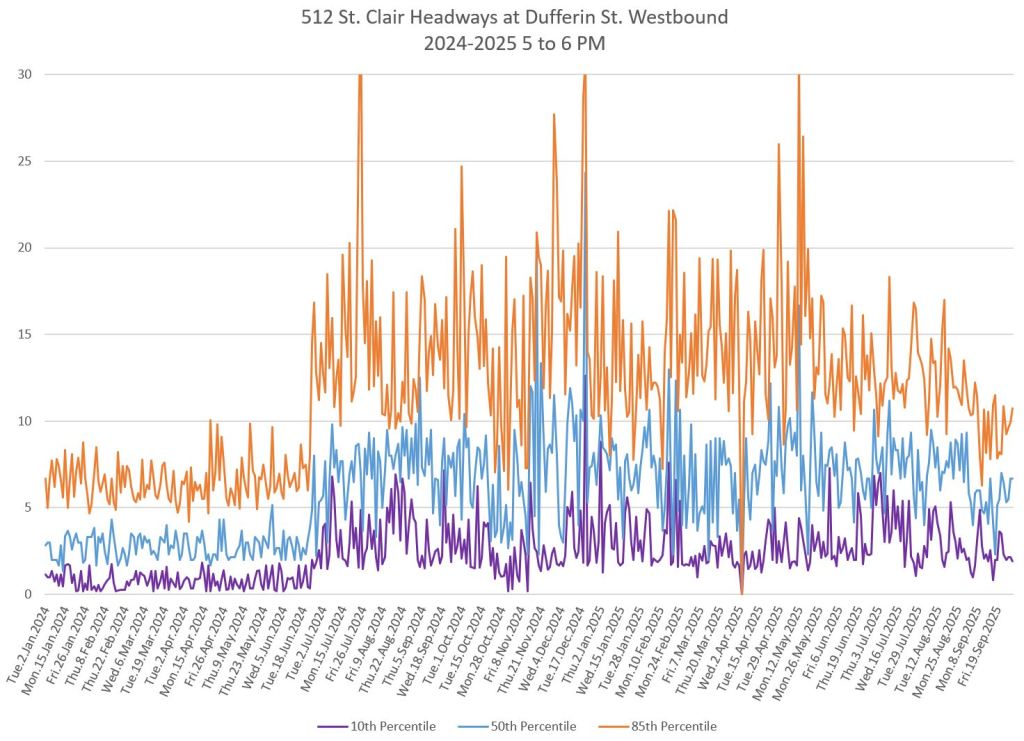
PM Peak Westbound
By the PM peak, median headway is inconsistent showing a variation in the service from day to day. This is echoed in the wide range of 85th percentile values until partway into 2025. The range of headways is smaller in September, although the effect is seen much more at Yonge than at Bathurst and at Dufferin westbound.
Early Evening Westbound
Early evening service shows many of the same traits as the PM peak. Note that unlike the daytime periods, the evening service has the same headway for streetcars throughout and there is little visible change in the range of headways in September 2025 compared to earlier months.
Late Evening Westbound
Late evening service remains on a 10 minute headway, but unlike the early evening data above, does show an improvement in the range of headways starting in September 2025.
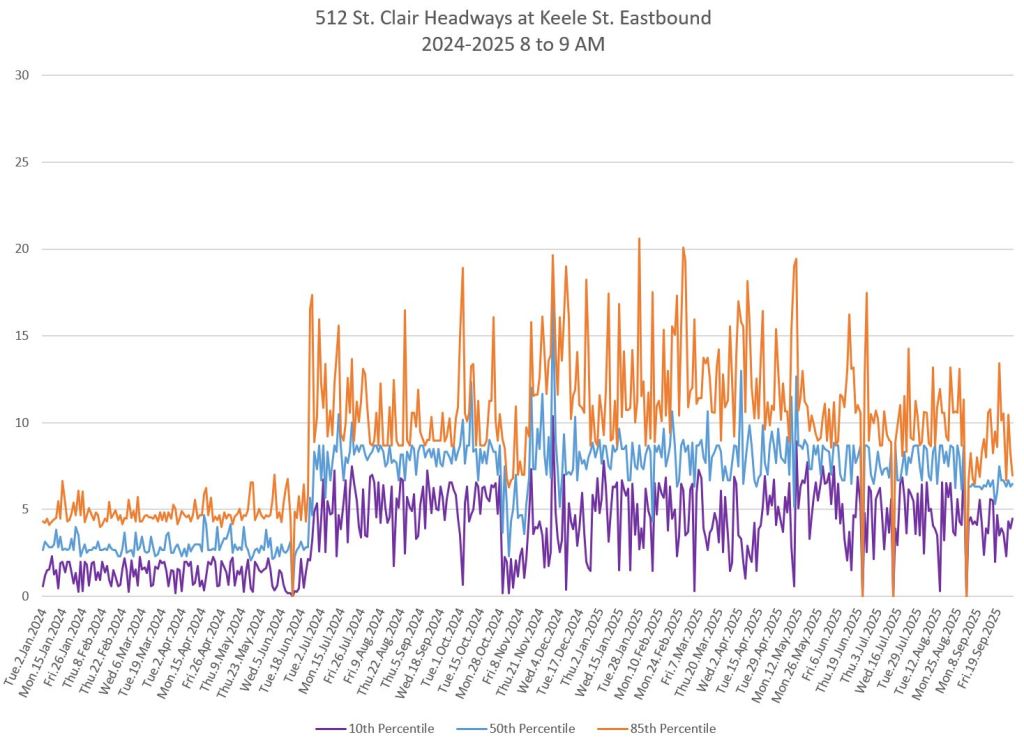
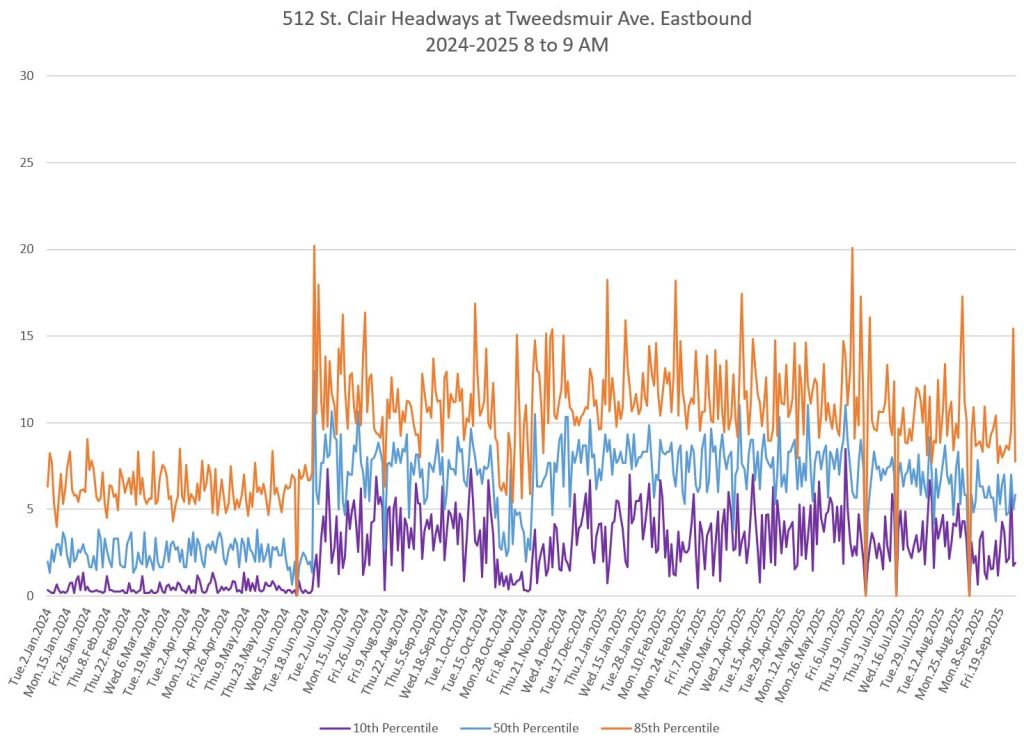
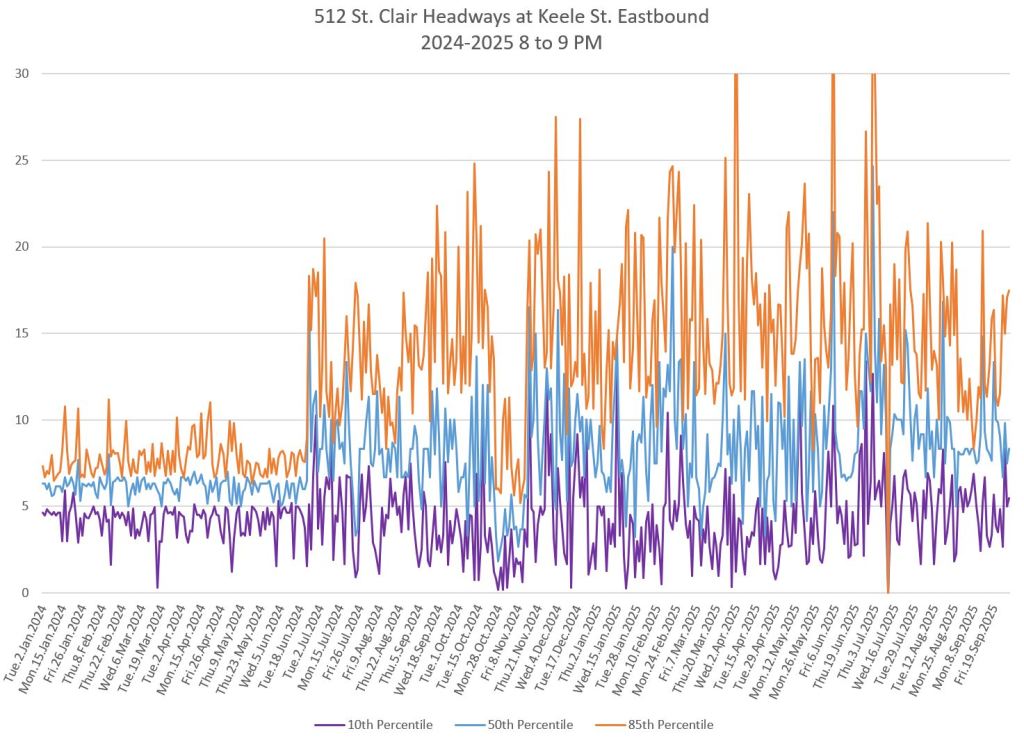
AM Peak Eastbound
The eastbound service shows a pattern similar to westbound. Although Keele Street is just east of Gunn’s Loop, headways there vary widely. Even during the period of bus operation in 2024, pairs of buses (indicated by the low 10th percentile values) left the terminal together. In mid-2025, the range of headways at Keele narrows somewhat, but the values are still not tight to the median. In September 2025, with more frequent service, the median drops and the range of headways is tighter to it.
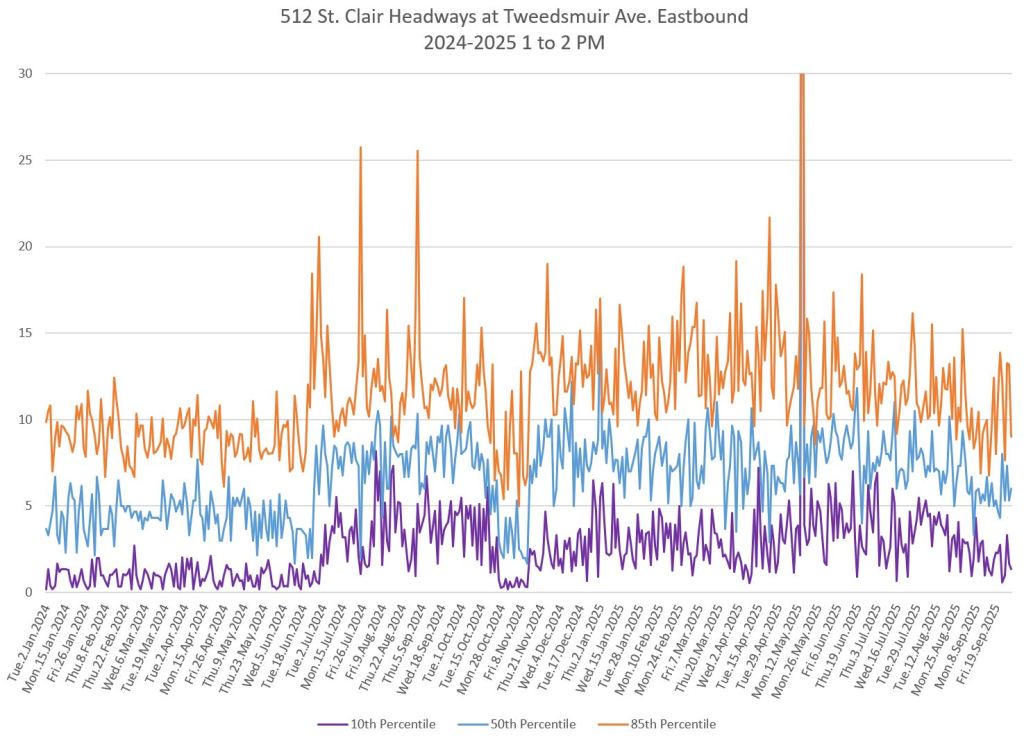
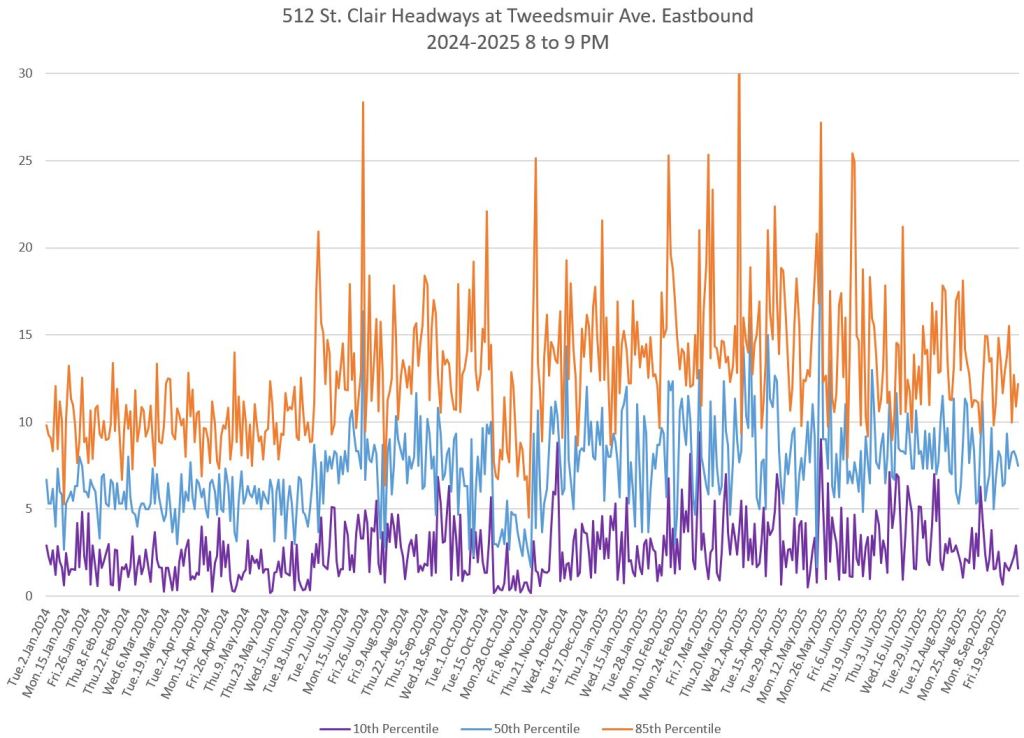
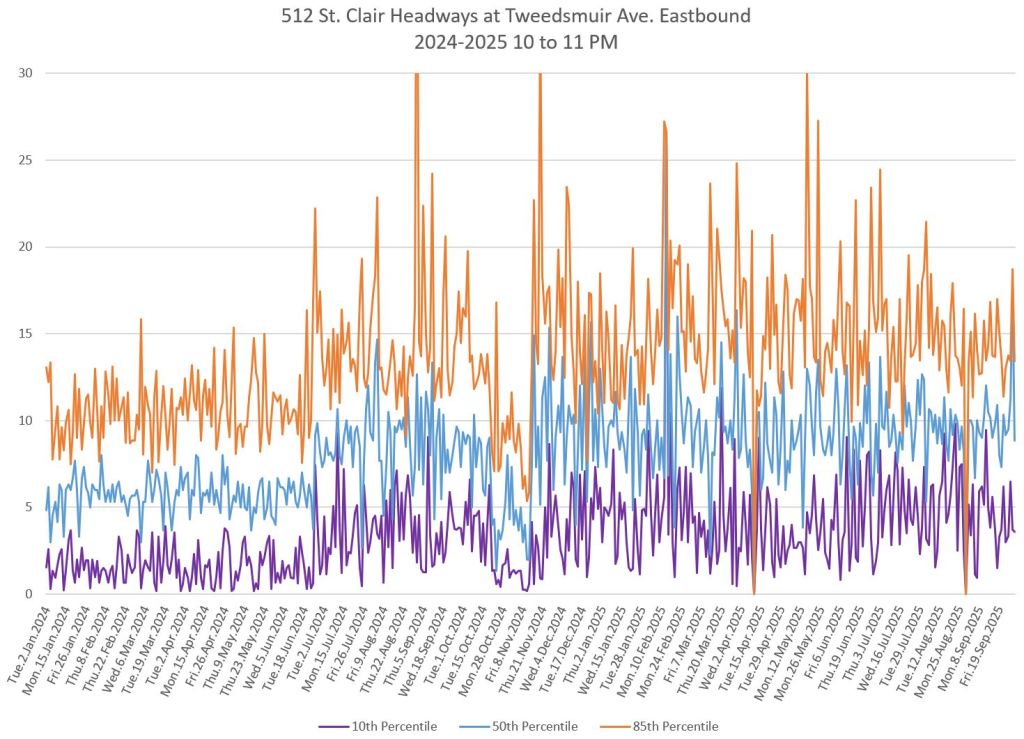
As service moves east, the range of headways grows and is particularly bad eastbound at Tweedsmuir, just east of St. Clair West Station even though this is a point where regular spacing could be restored.
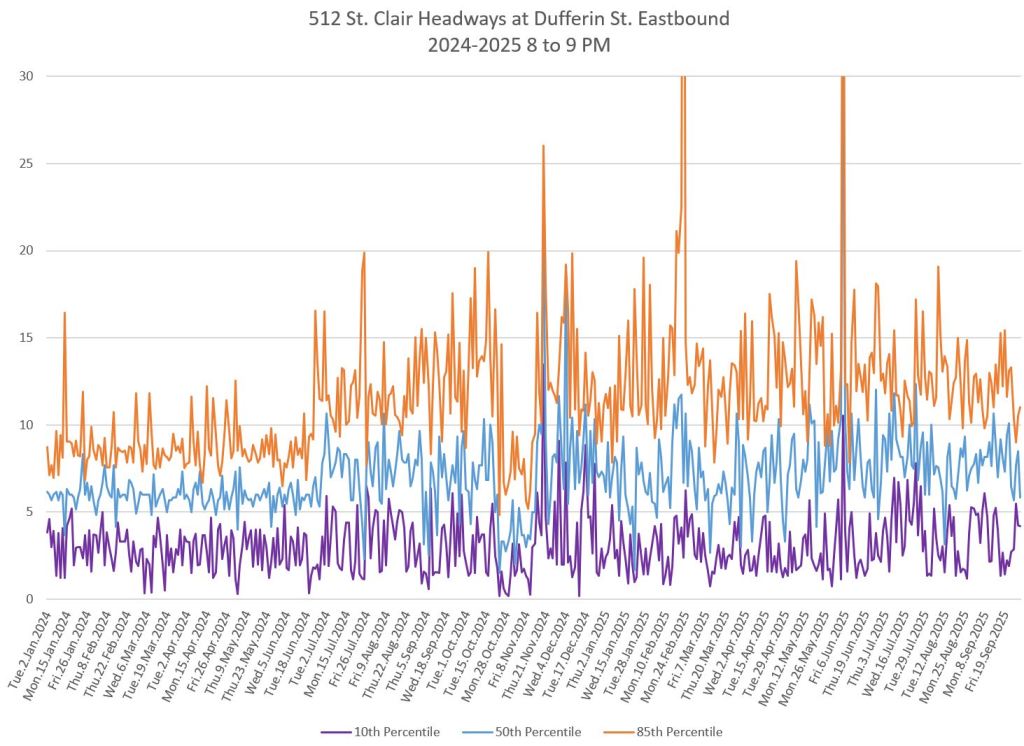
Midday Eastbound
Midday headway are spread over a wider range than in the AM peak, and they show the same pattern with a wider spread on the eastern part of the route.
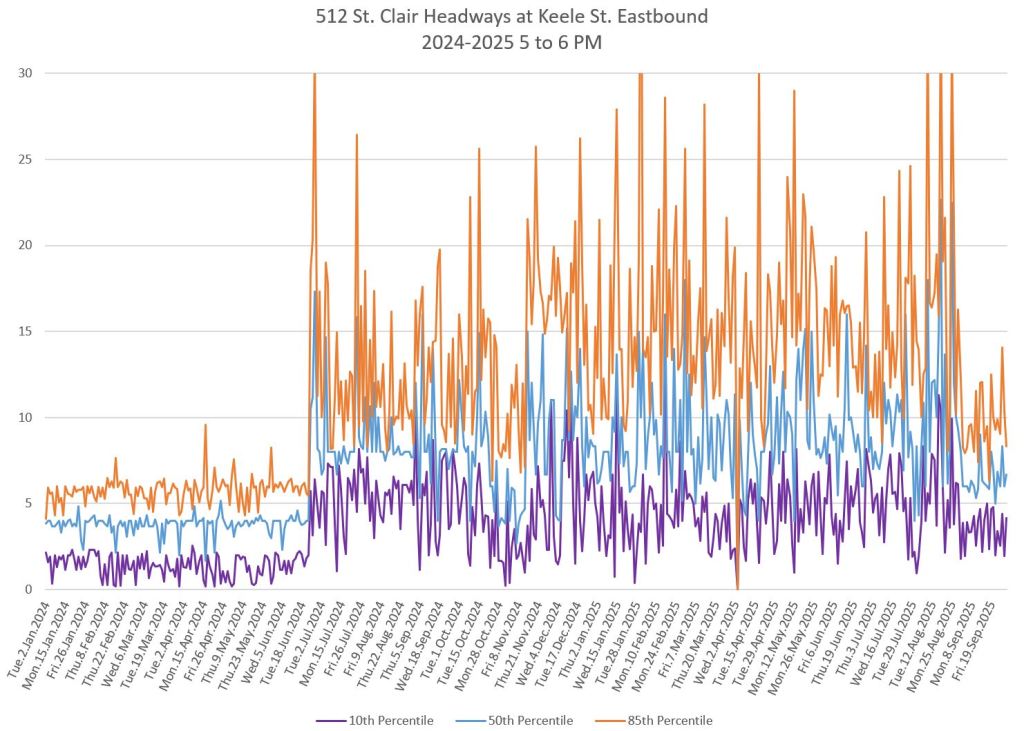
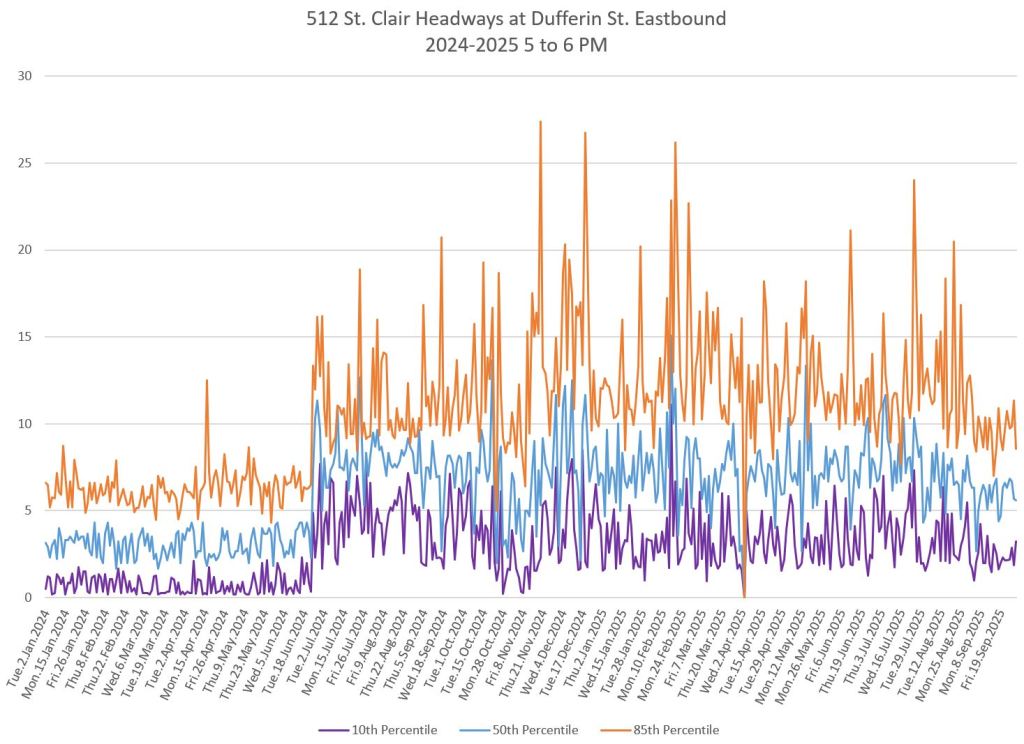
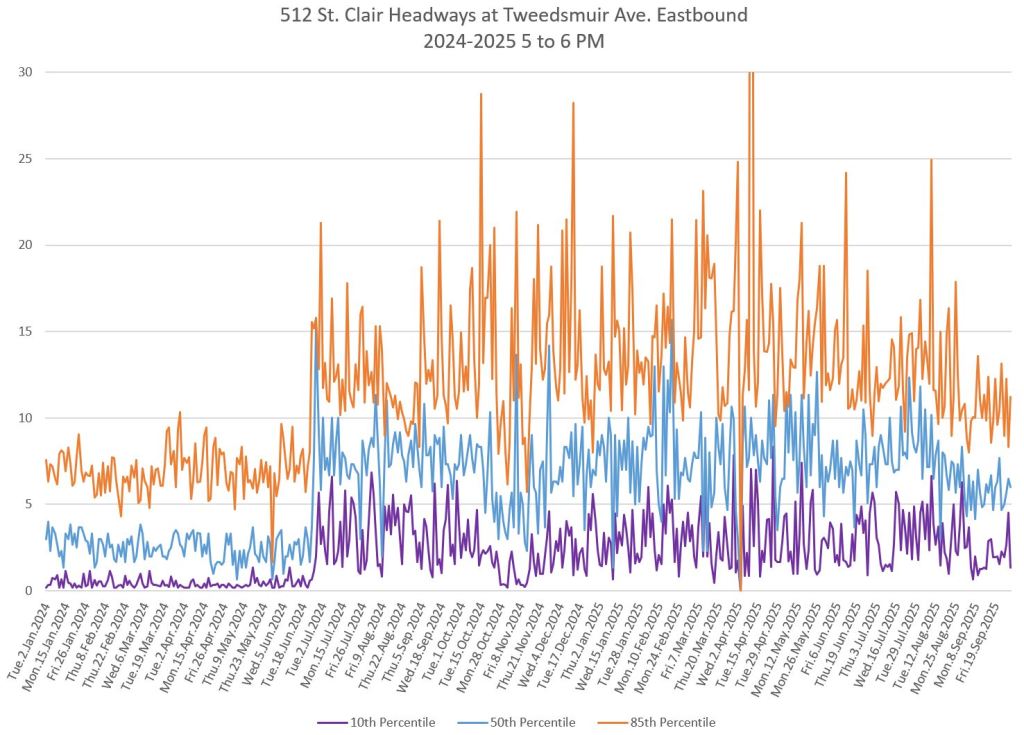
PM Peak Eastbound
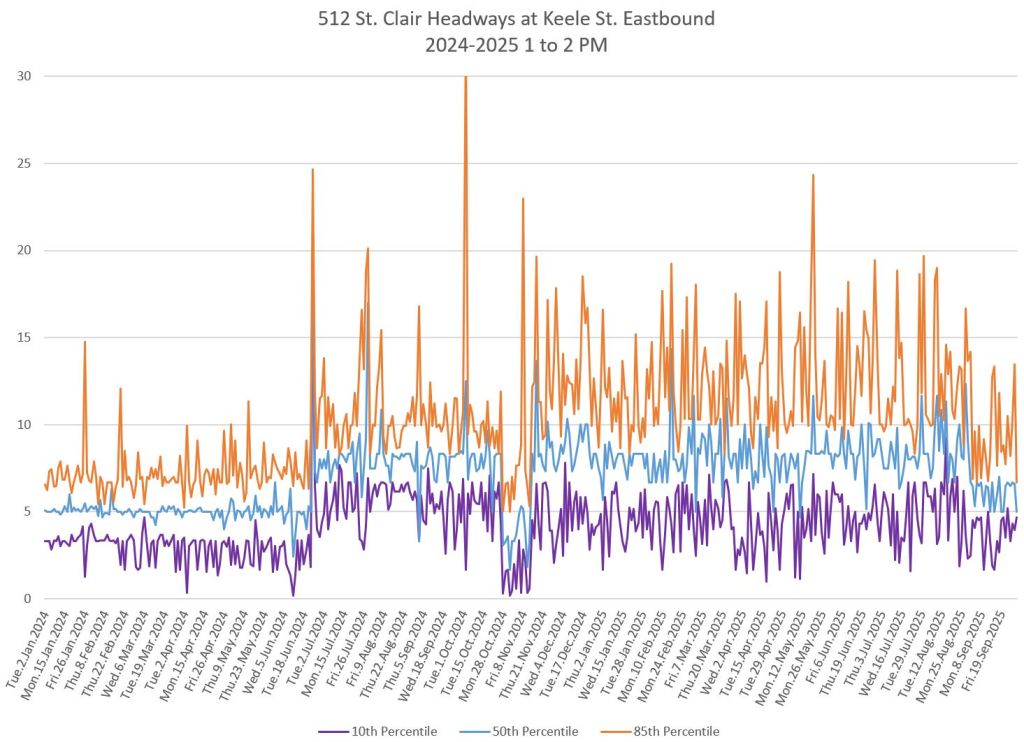
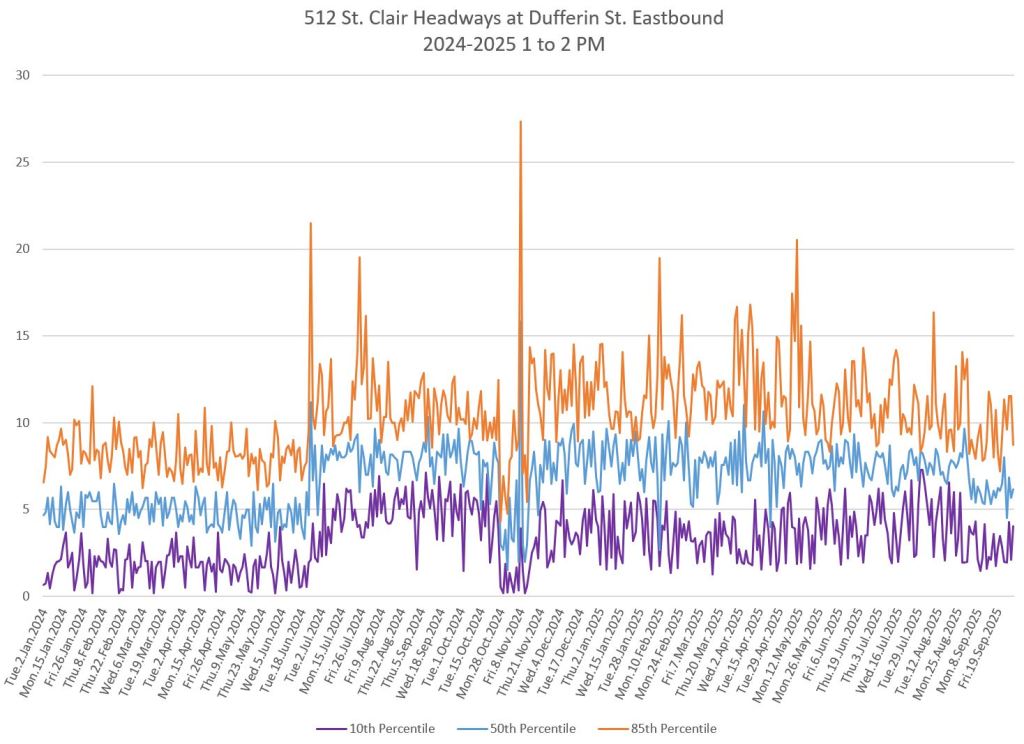
PM Peak headways from Keele are particularly bad until midsummer 2025. The range of values at Dufferin is noticeably lower, although still far from ideal, indicating that the higher values at Keele are due to cars short-turning at Lansdowne (Earlscourt Loop). Again, the headway values eastbound at Tweedmuir extend over a wider range showing an absence of regulation at St. Clair West Station.
All three locations show an improvement in headways with a narrower range of values in September 2025.
Early Evening Eastbound
Early evening data mirror the PM Peak situation with more erratic values at Keele than at Dufferin due to short turns at Lansdowne. Again, service eastbound at Tweedsmuir is more erratic than at Dufferin showing a lack of regulation at St. Clair West Station.
There is only a modest improvement in regularity in September 2025.
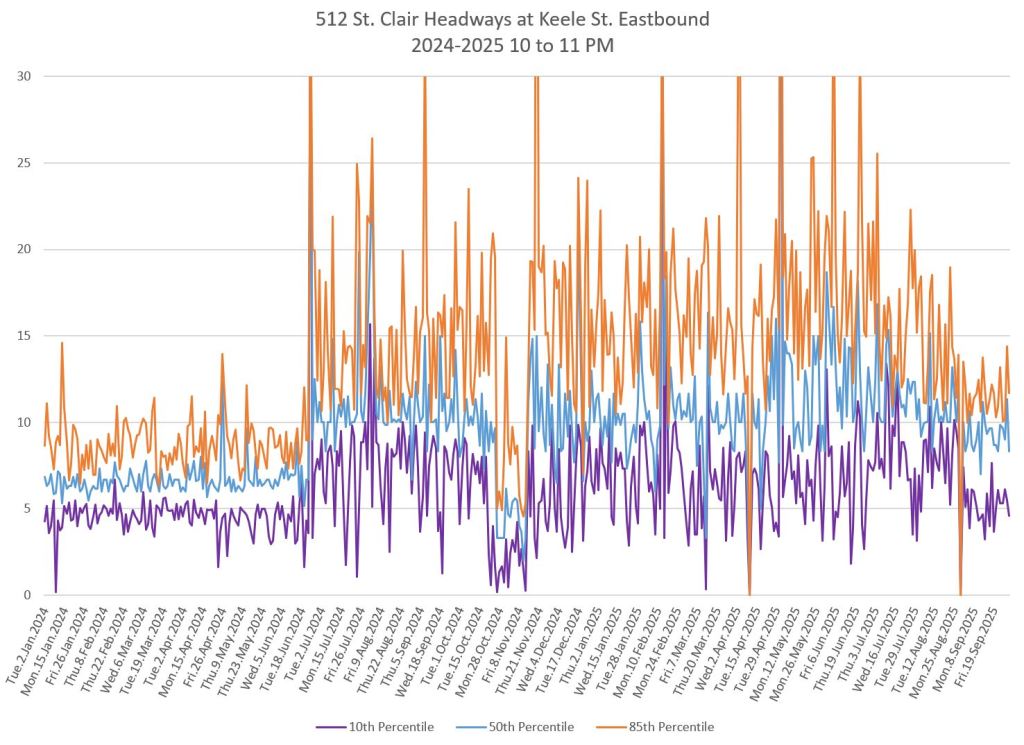
Late Evening Eastbound
Late evening service is similar to the early evening, except that the scheduled headway is longer (10′) and the range of actual headways is wider with the 85th percentile regularly topping 15 minutes while the 10th percentile is often below 5.
Note that the problem with a spread in headway values from west to east also affects the bus service in 2024, but it is so much more frequent that even the worst of the 85th percentile values are well below the streetcar values.
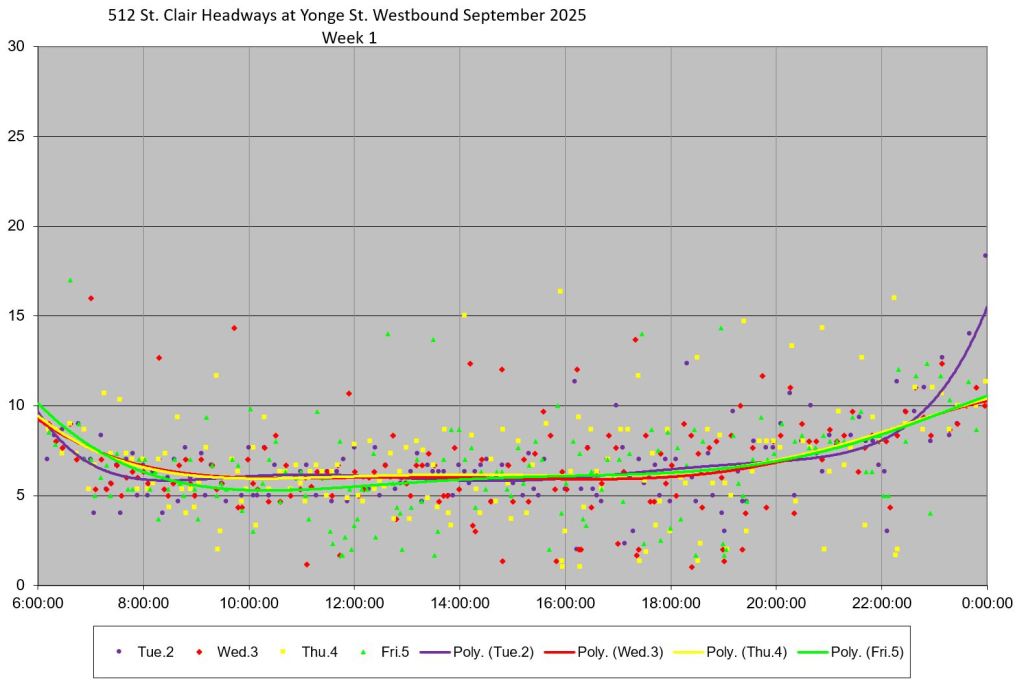
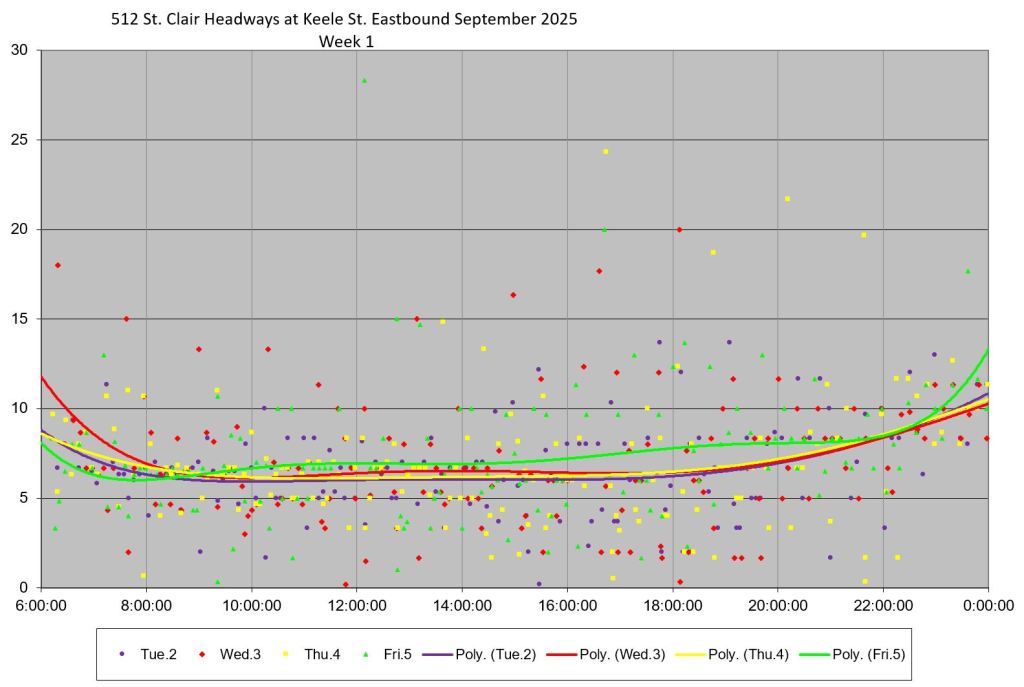
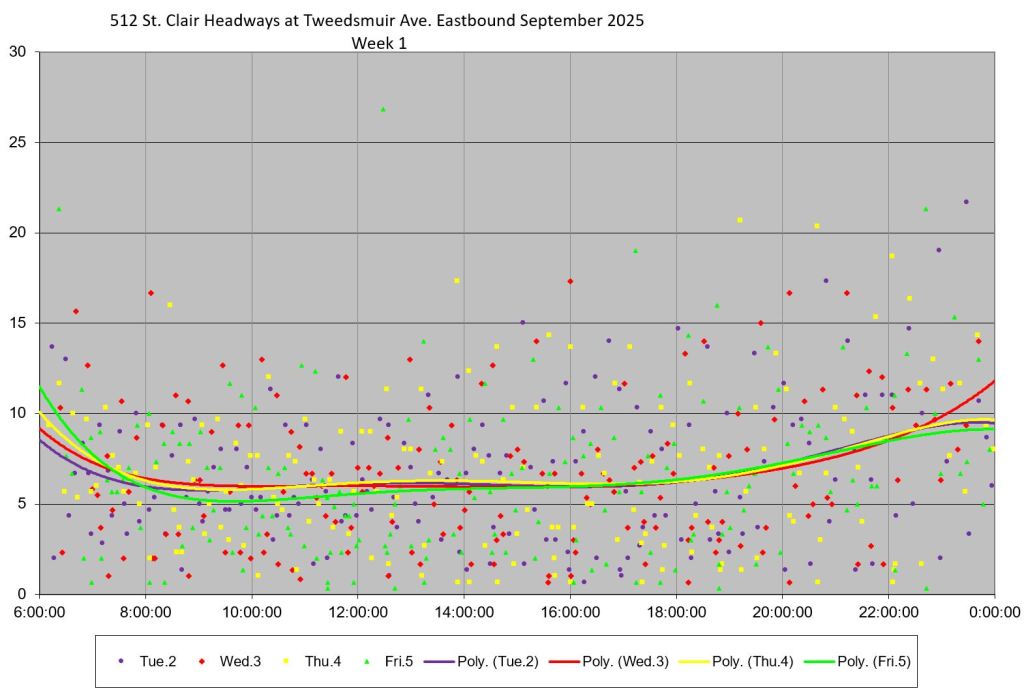
Detailed Service Charts for September 2025
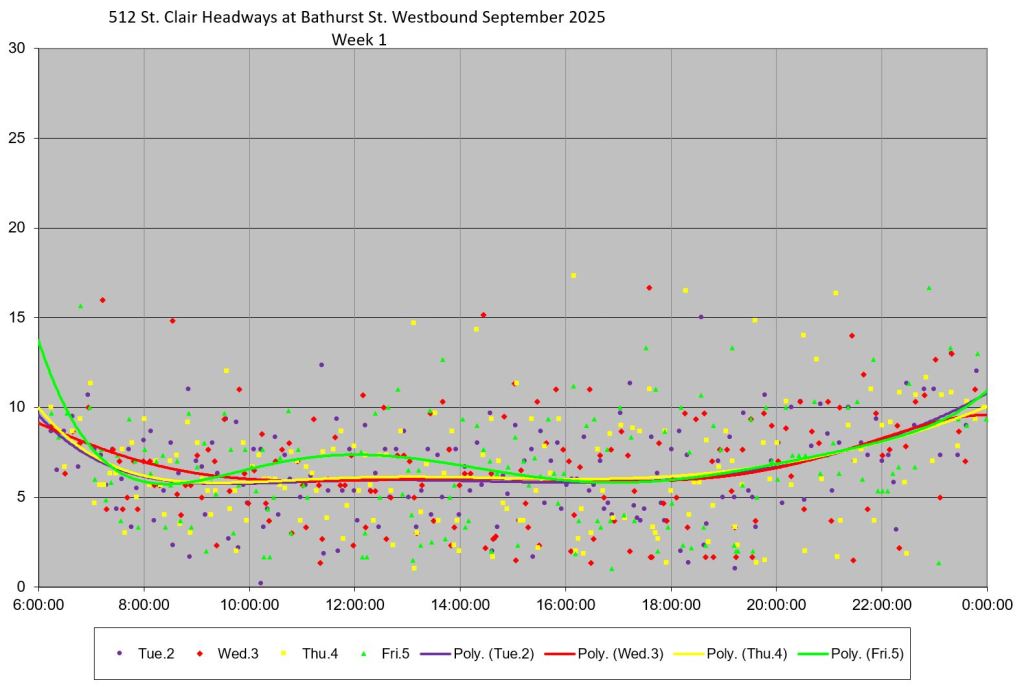
The charts in this section are intended to show the details in variation of headways on 512 St. Clair in September 2025 when better line management was supposed to be in place. Within each group:
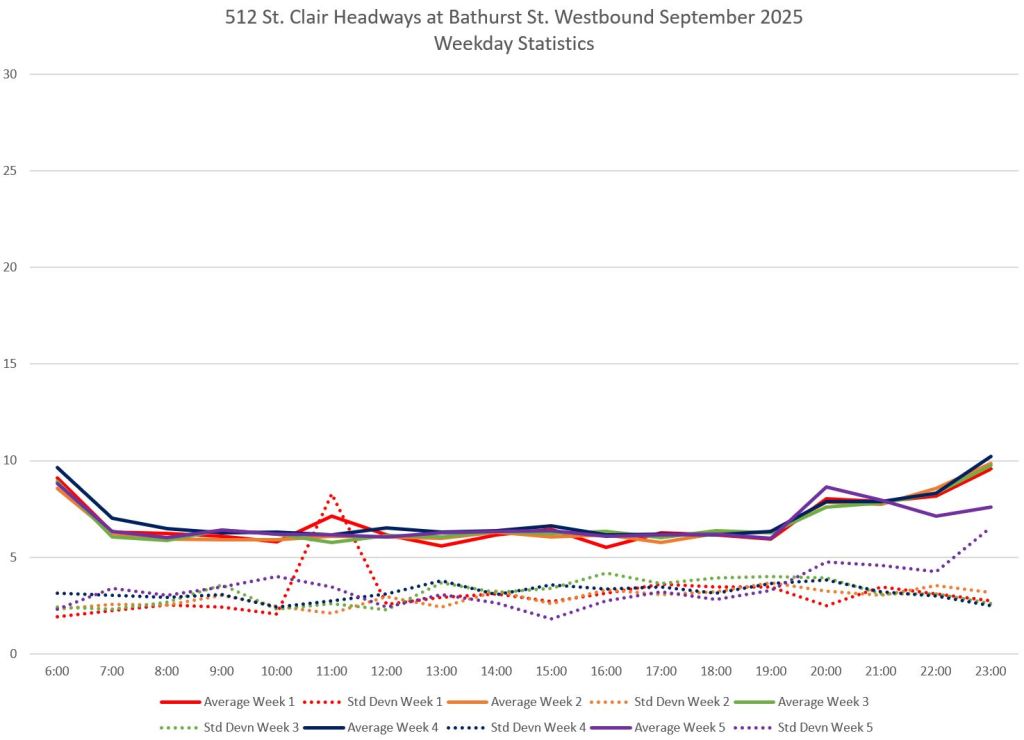
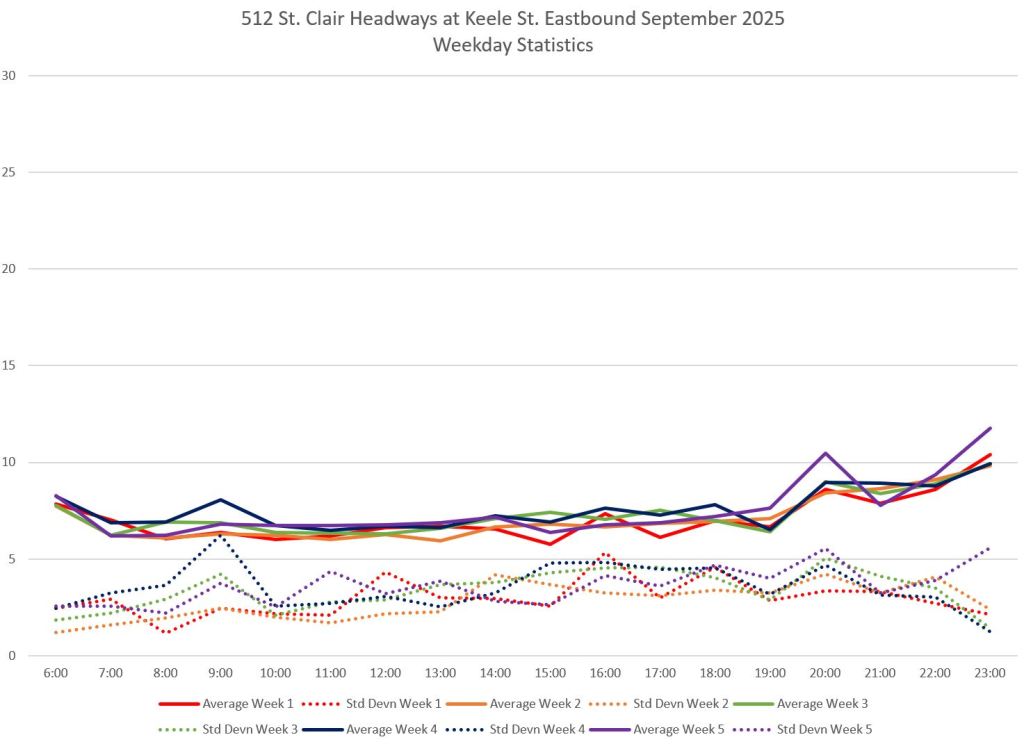
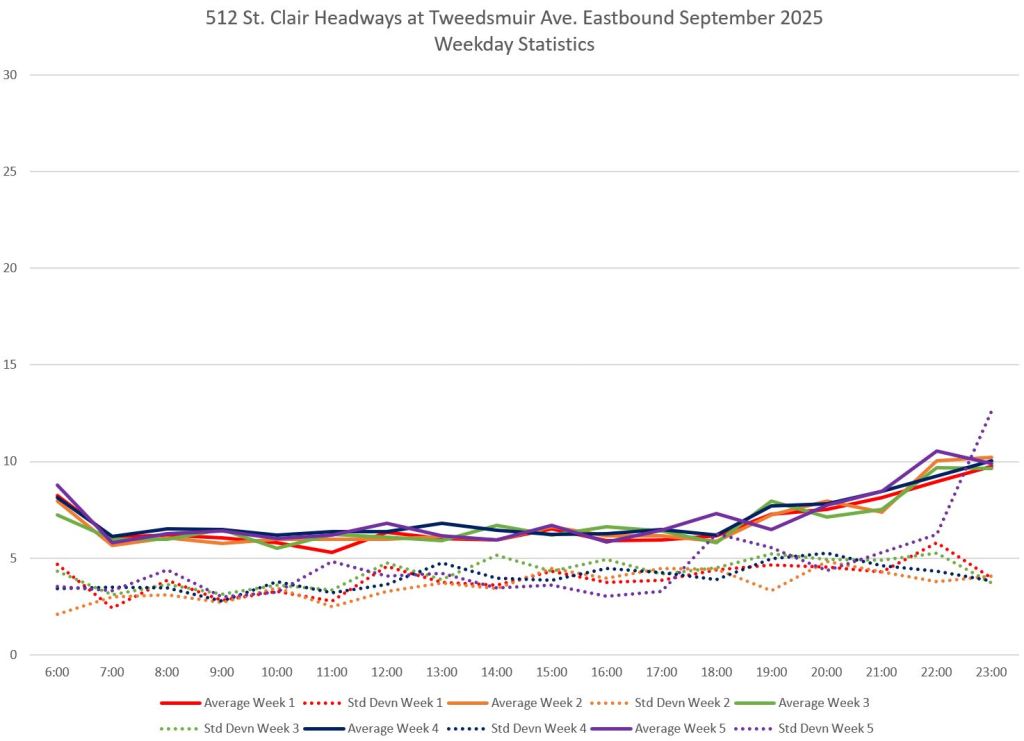
- The first chart shows statistics for average headway values and standard deviations, a measure of how closely the values stay to the average. The lower the SD value, the less scattered the individual data points, and the more reliable the service.
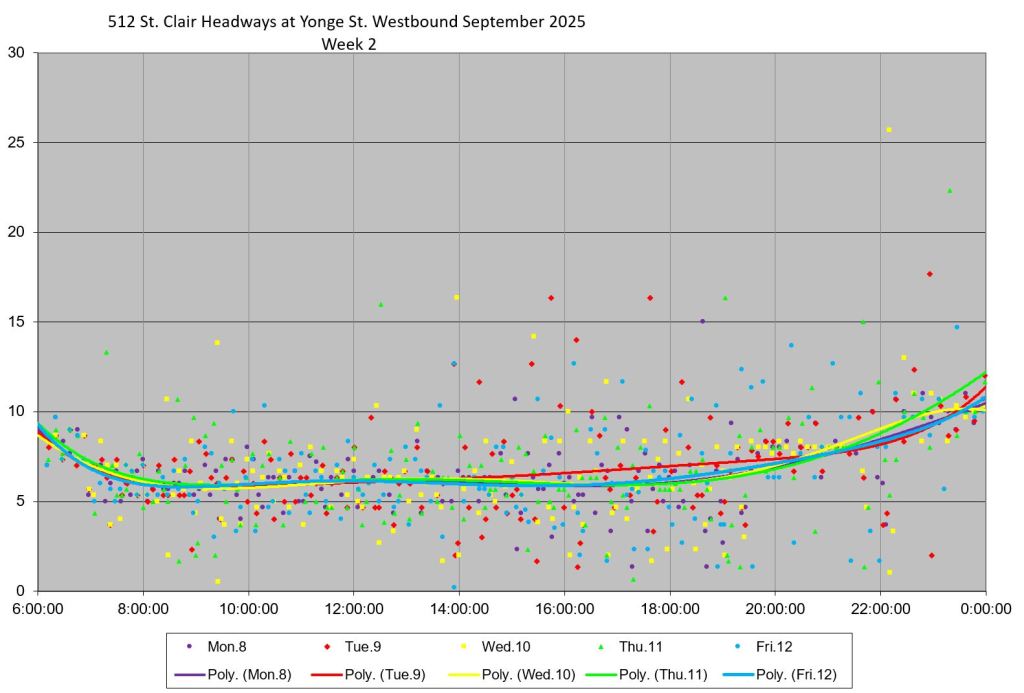
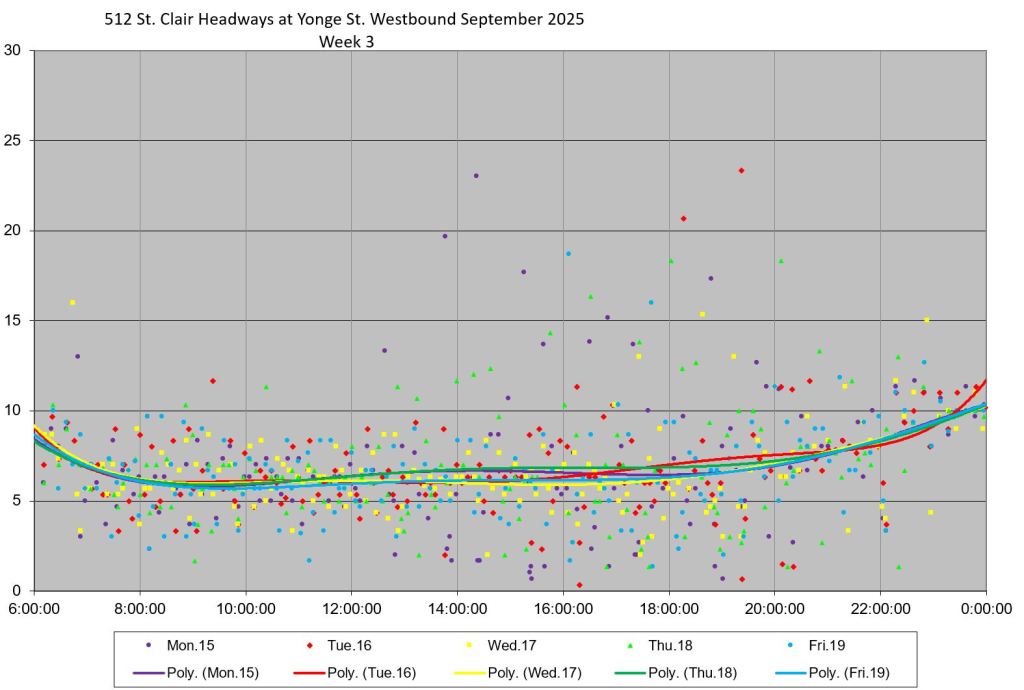
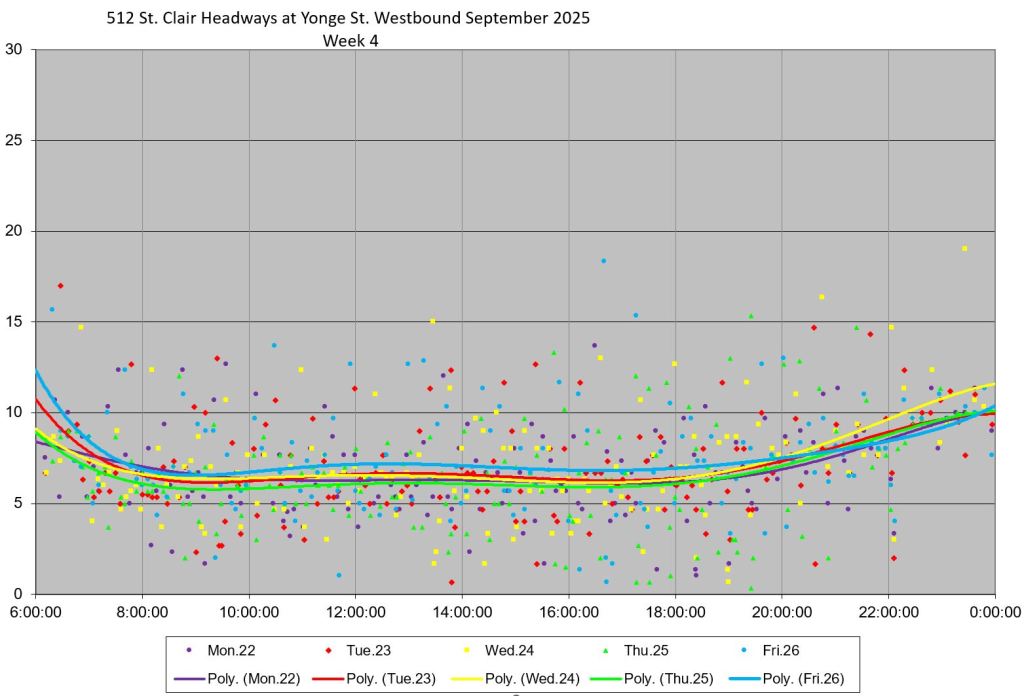
- Five charts show the individual data points by week and day. The trend lines through the charts are not averages, but are best fit interpolations through the data to show the overall behaviour.
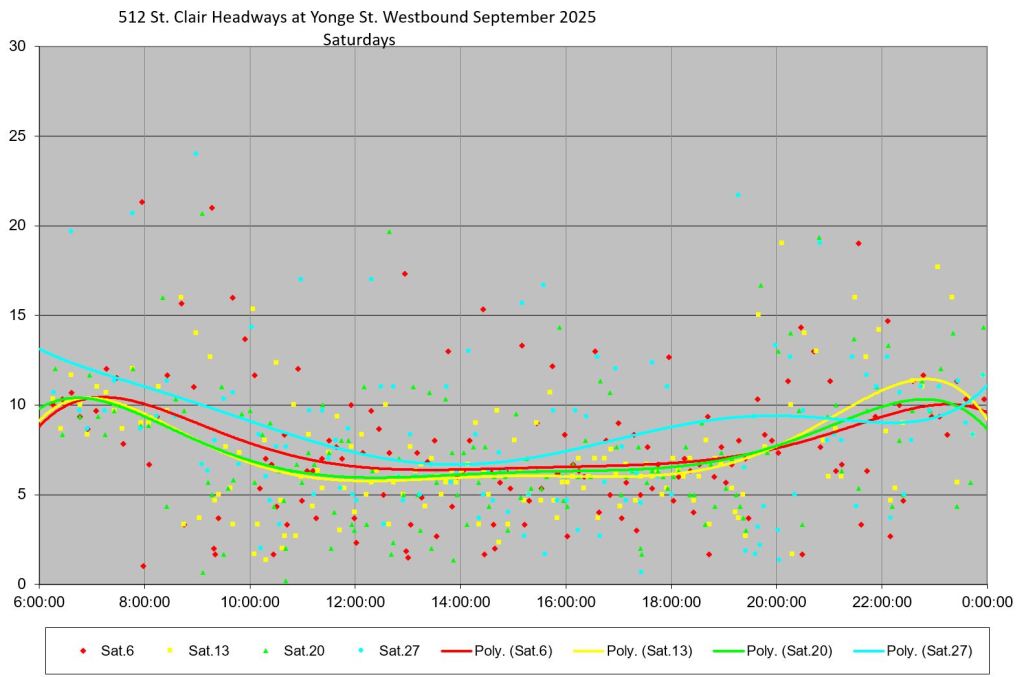
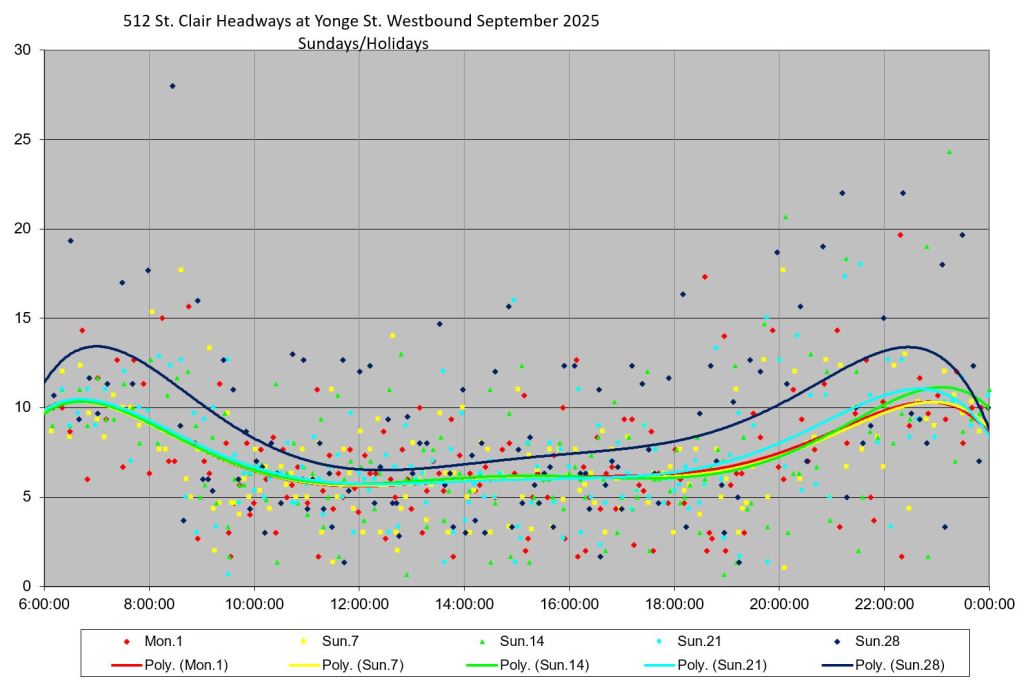
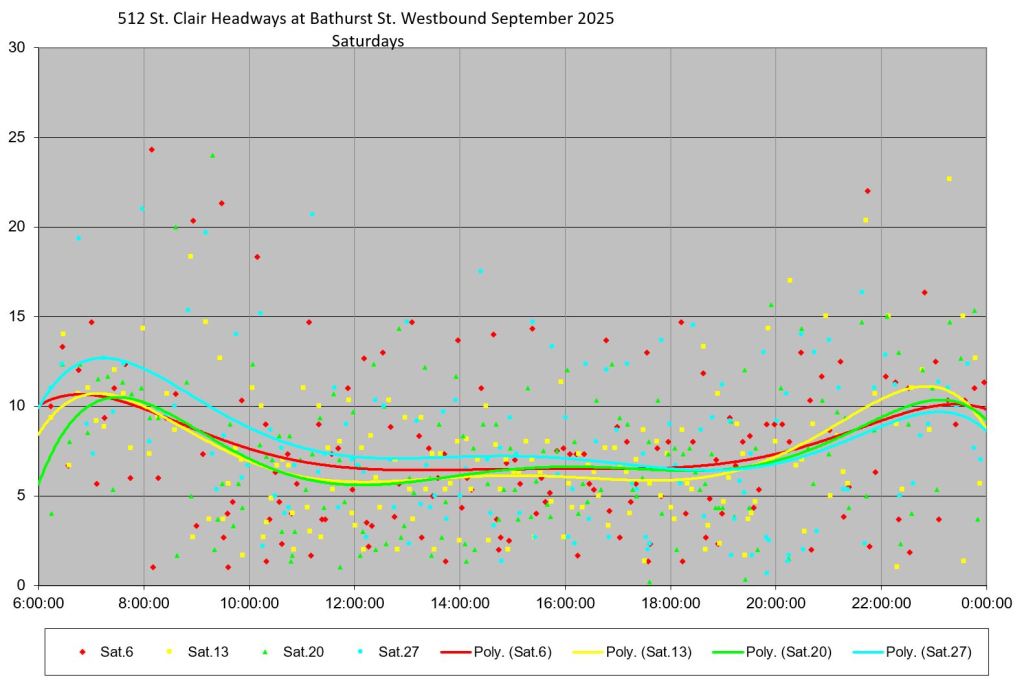
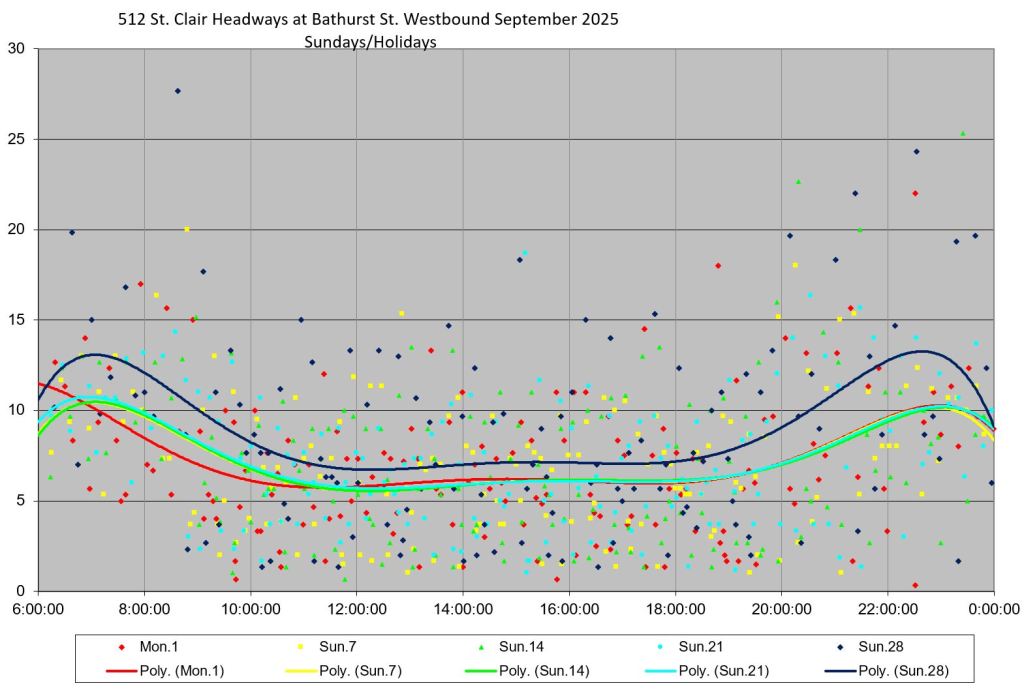
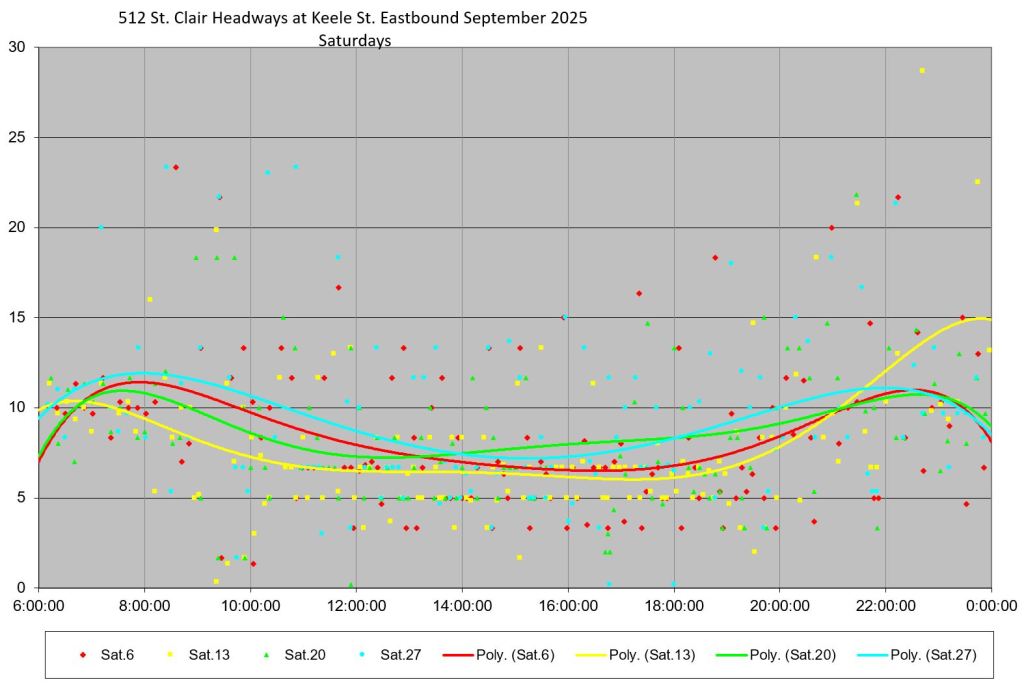
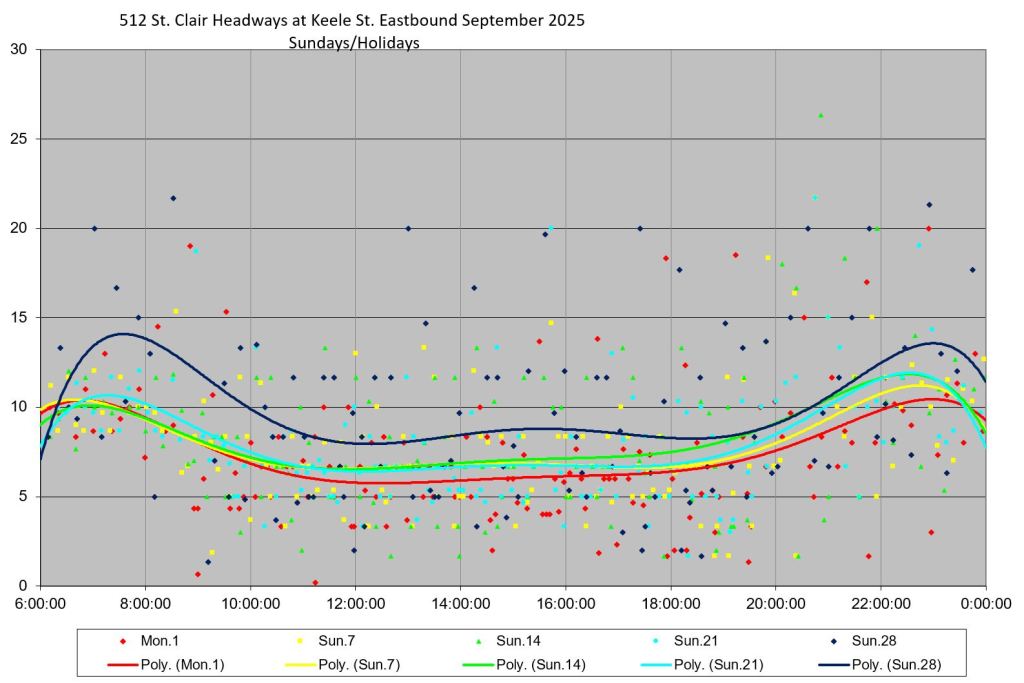
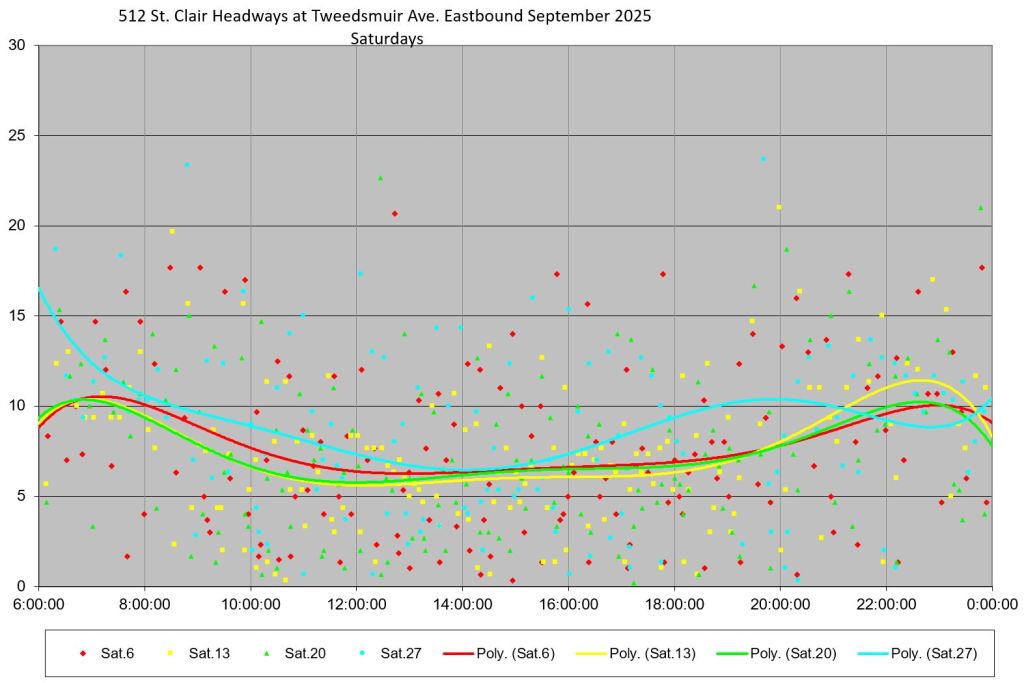
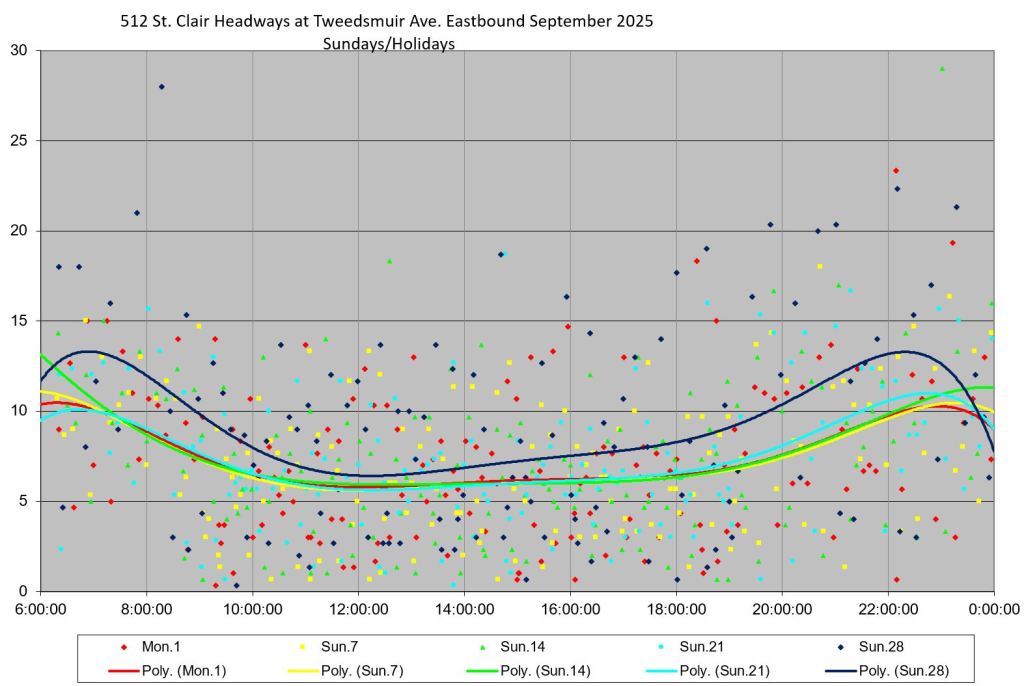
- Two charts show the data for all Saturdays and for Sunday/Holidays (Monday, September 1 was Labour Day).
Here is the Scheduled Service Summary in effect for the month:
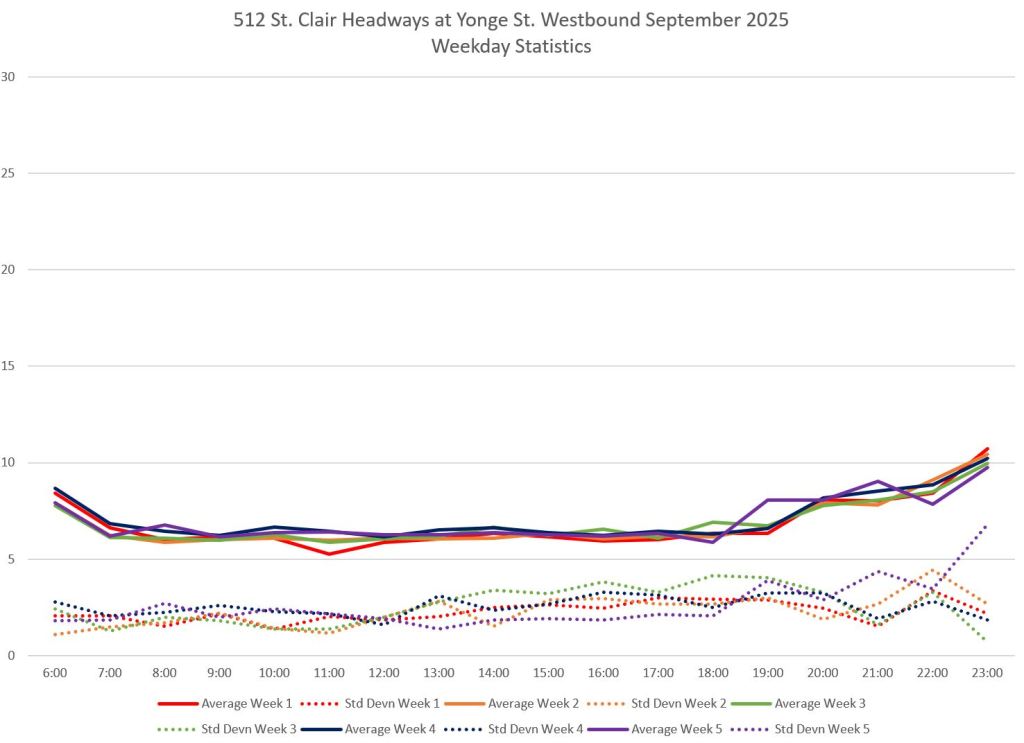
Westbound at Yonge
- The screenline for these measurements is in the middle of the Yonge/St. Clair intersection.
- The SD values start off at a few minutes, but rise through the day showing a greater range of headways. This can be seen in the weekly data charts where the points are more spread out in the afternoon and evening.
- Many of the data points lie roughly in a band about 6 minutes wide fitting the ±50% standard even though this is near a terminal where headways should be at their best.
- Weekend headways are particularly badly scattered and service is erratic all day. Clearly there is no attempt to regulate service on weekends, and this shows the line’s behaviour when nobody “minds the store”.
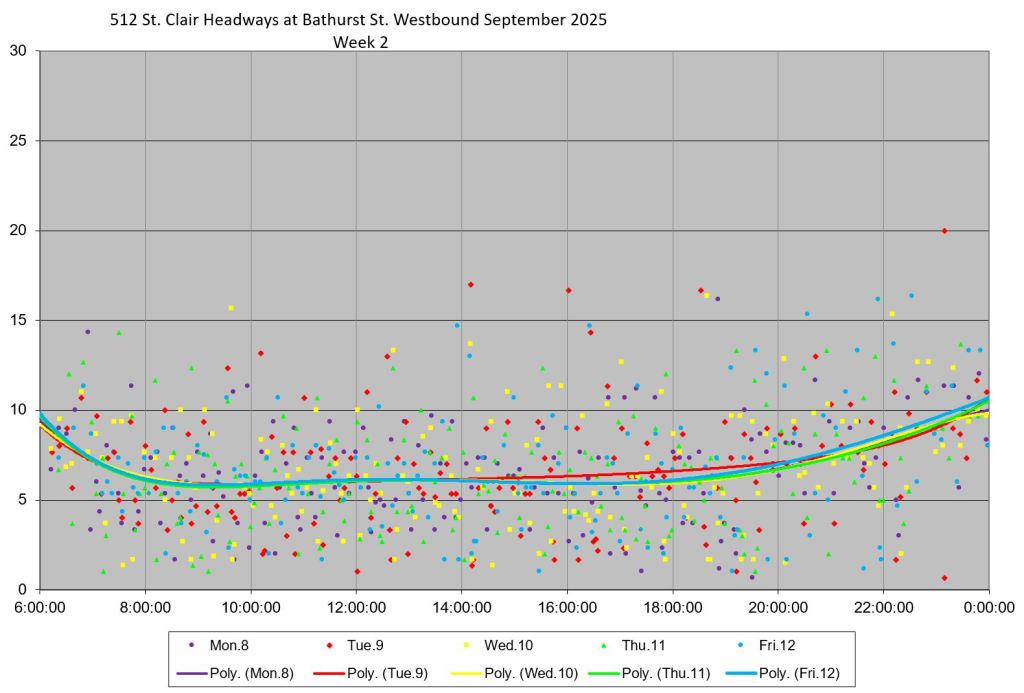
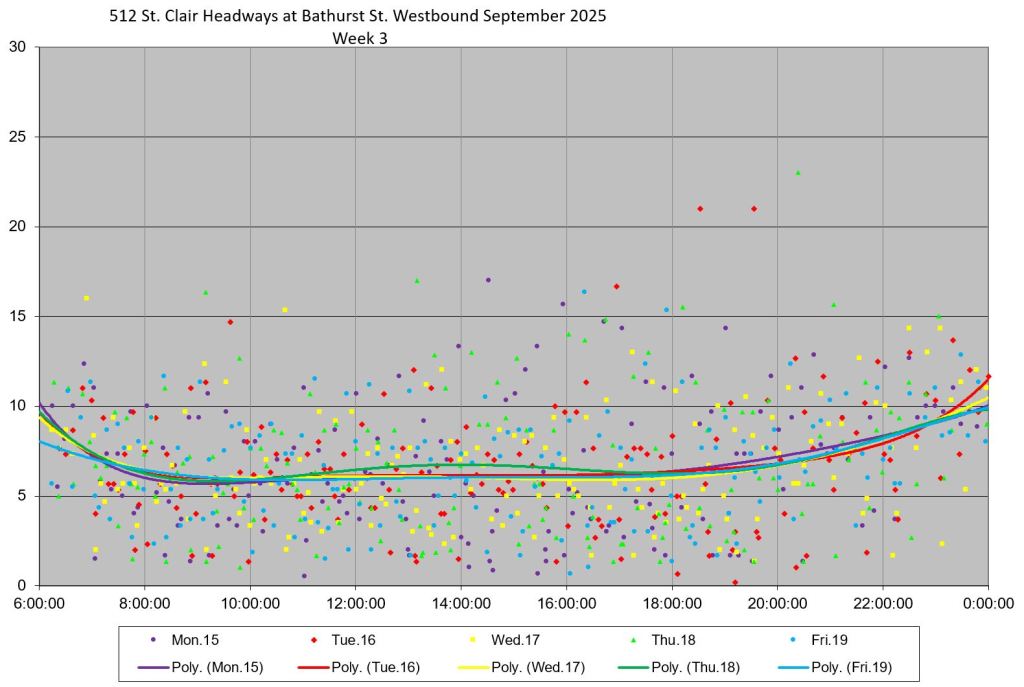
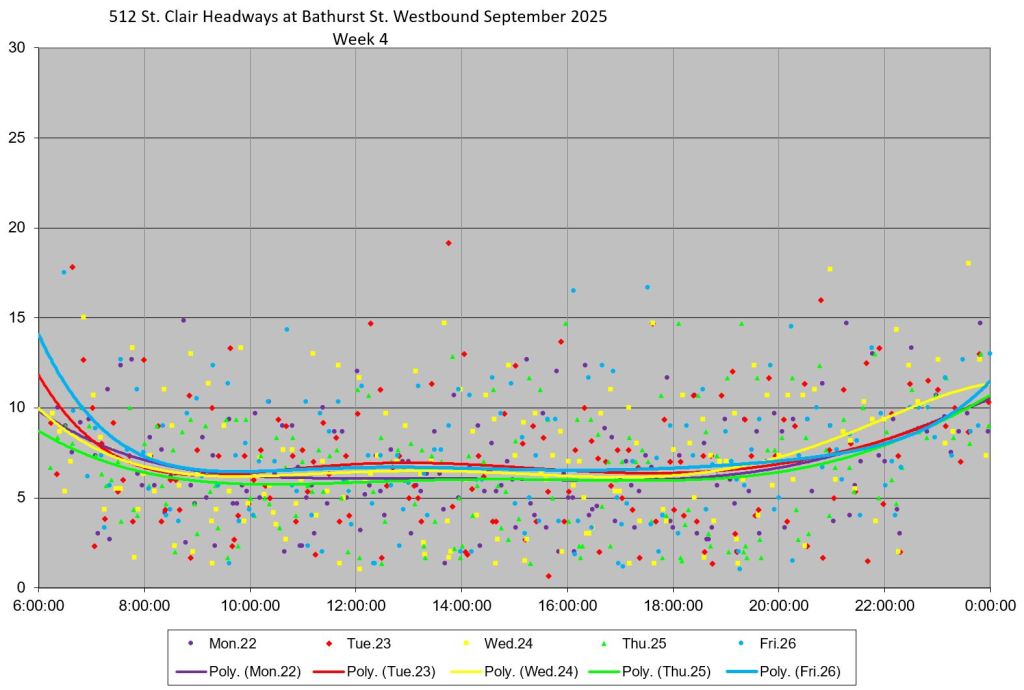
Westbound at Bathurst
- The screenline for these measurements is in the middle of the Bathurst/St. Clair intersection.
- Although the average values are flat until the scheduled headway change in late evening, the standard deviation values are higher, especially later in the day, than at Yonge Street (above). This reflects the wider scatter in headways leaving St. Clair West Station where the “cloud” of data points is considerably wider than for Yonge Street observations.
- As at Yonge Street, the weekend headways are scattered over a wide range.
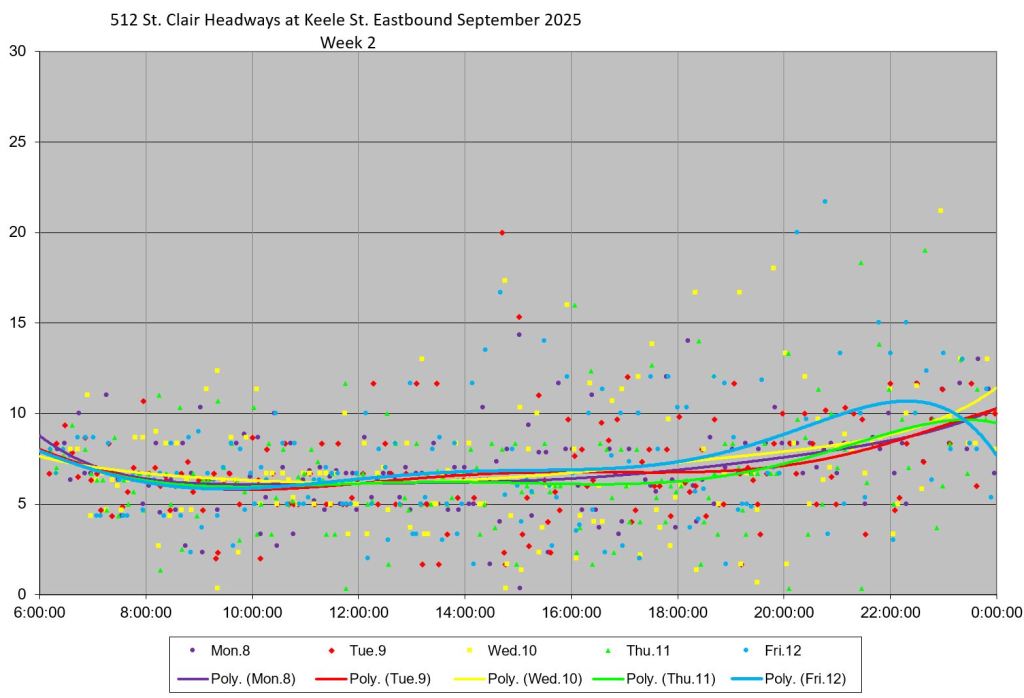
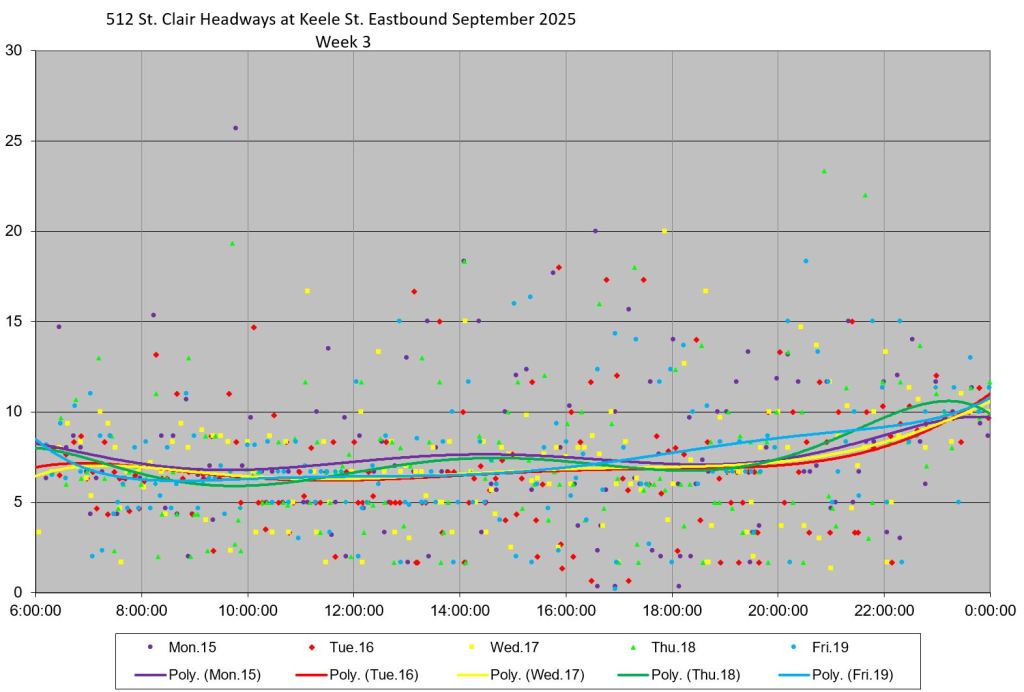
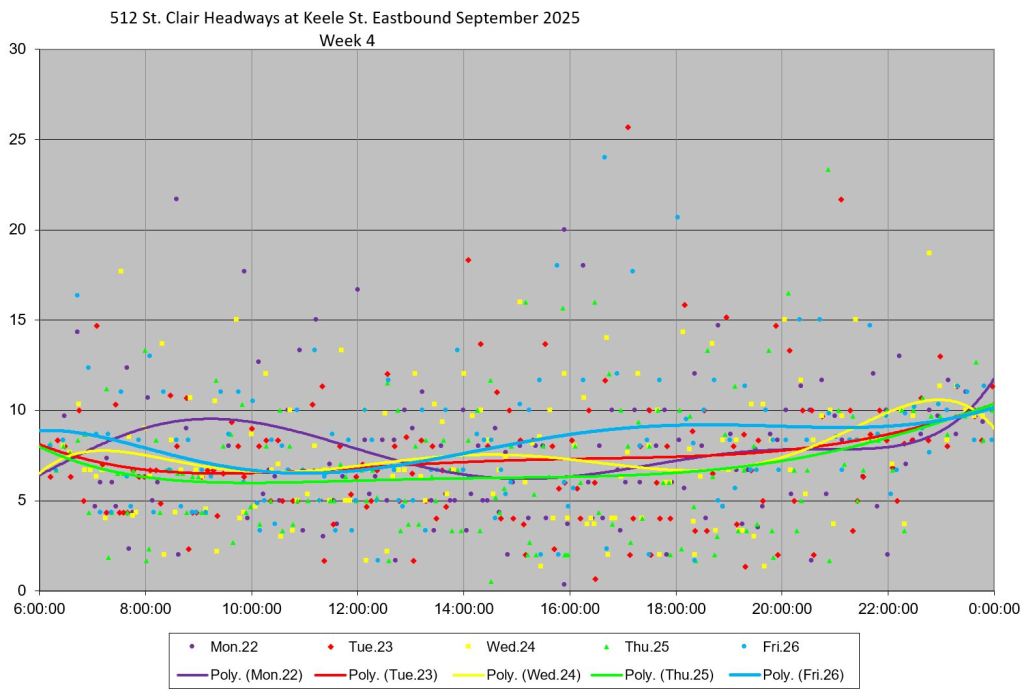
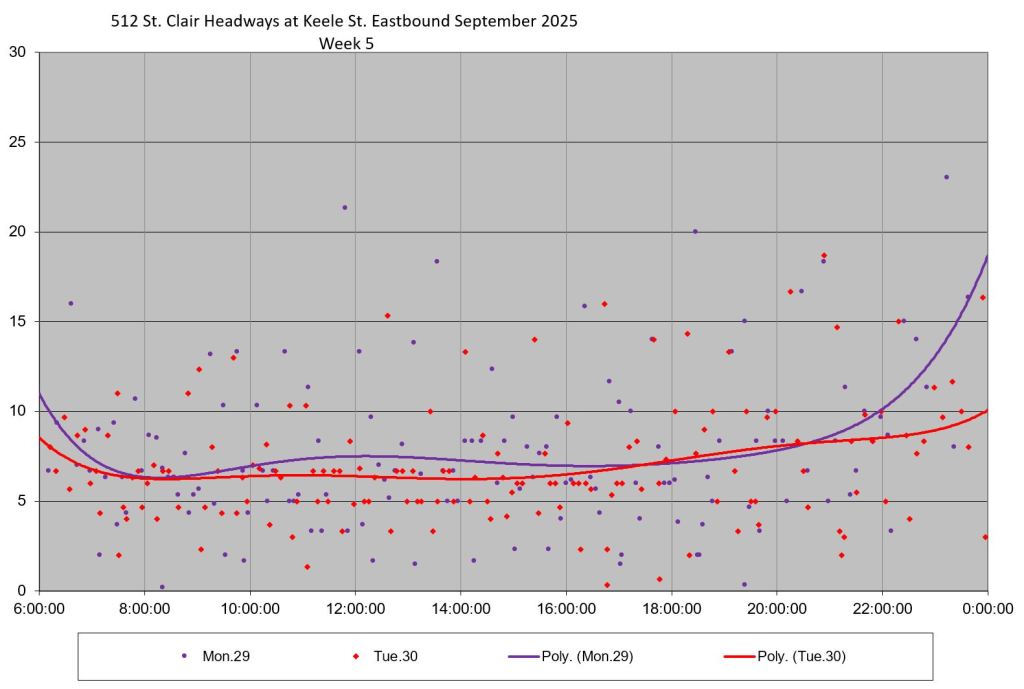
Eastbound at Keele
- The screenline for these observations is the middle of the Keele/St. Clair intersection.
- The weekly average headway values are not as tightly grouped as on the westbound charts above because cars short turned at Lansdowne are missing.
- The range of headways on the weekly and weekend charts shows both bunching and wide gaps in almost all hours of the day.
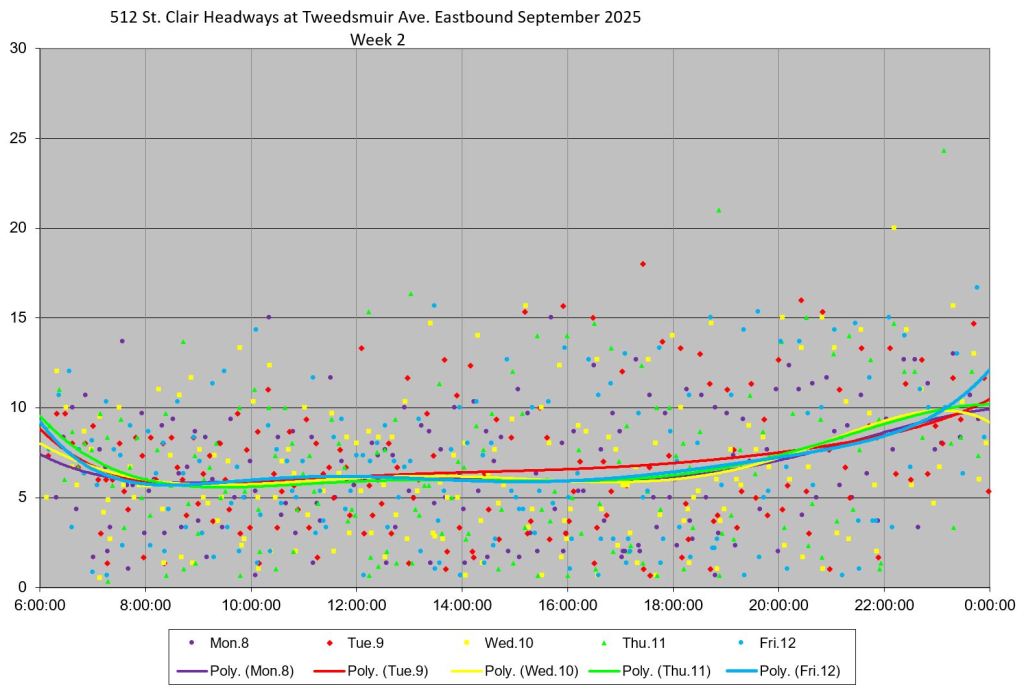
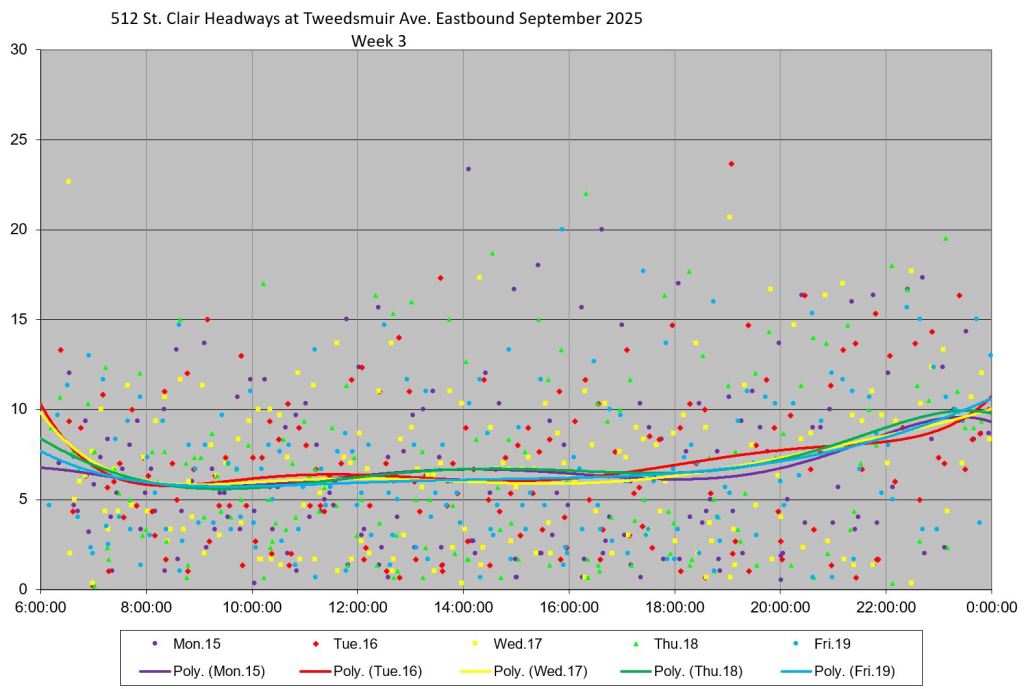
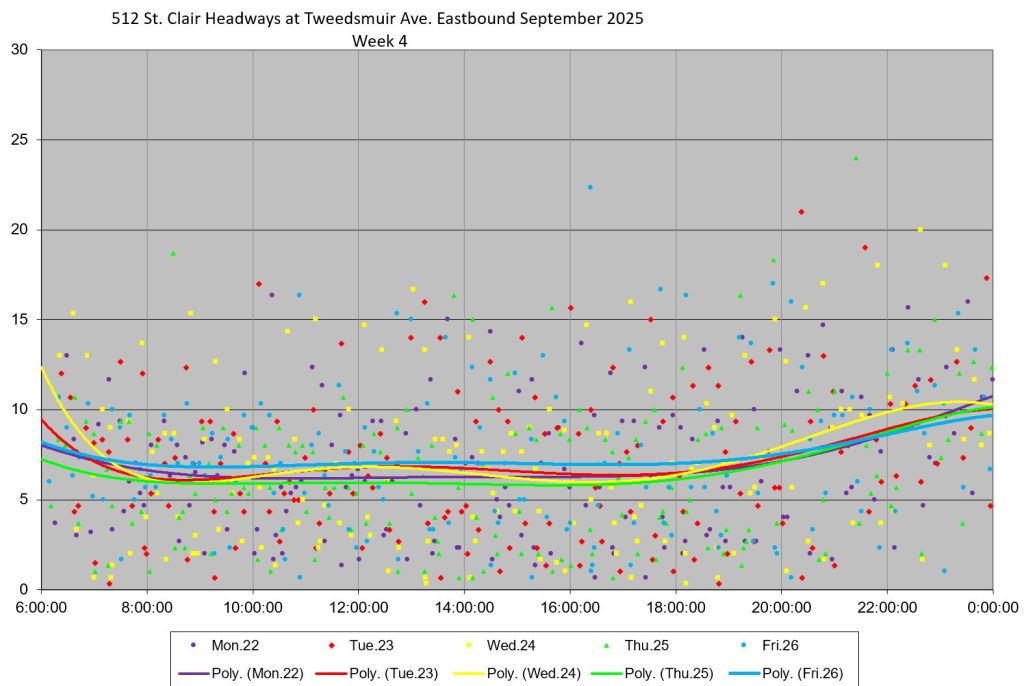
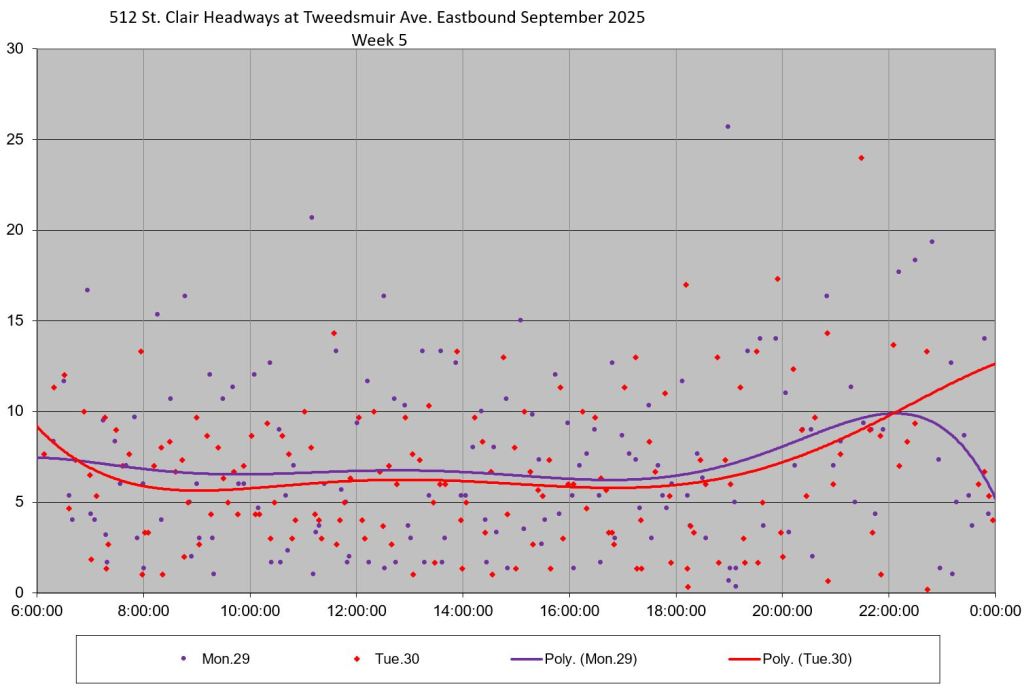
Eastbound at Tweedsmuir
- The screenline for these observations is at Tweedsmuir Avenue just east of the stop at the exit from the portal to St. Clair West Station.
- The standard deviation values are high all day, often at 4-5 minutes indicating a wide spread in headway values. This is reflected by the extent of the clouds of data points in the day-by-day charts.
- If there is any line management happening, it is only a matter of degree compared to earlier months, and service is irregular all day long.

Continues to blow my mind that they don’t just go with signal based management on the lines with separation…
As expected any improvements are short lived due to the monotony of the job, and the subjectivity and lack of monitoring the monitor.
This is basically what computers were designed to do…continuing to leave it to humans is goofy and embarrassing.
LikeLike
Would like to see the information on which vehicle at which intersection gets priority along St. Clair Avenue West? Left turning single-occupant SUVs or the 200+ onboard the streetcars?
Steve: The left turns always go first.
LikeLike
Not to distract from the scheduling issue, but is there a metric for “passenger comfort”? Does anyone care (aside from the passengers)? It is related in my mind because of the speed factor (see below).
As a passenger, I don’t understand how any given TTC vehicle is ever late. My physical experience is that the operators of both busses and streetcars accelerate as soon as possible and as quickly as possible to the maximum speed consistent with being able to stop at the next stop/traffic light (although not with maximum passenger comfort). No one is just coasting along or lollygagging or stopping for lunch. I live on a 40 kph stretch of Lansdowne and I can see one of those “Your speed” monitoring signs. The busses consistently are doing more than 40 kph. So how does lateness happen?
The St. Clair streetcar and the Lansdowne bus (47) are “my” lines.
The jackrabbit starts, and the sudden jerky stops are constants on both lines, even though the technologies are so very different. On both lines my first priority is to as quickly as possible hold on or sit down. Sometimes I don’t have time to do that before the operator is up to maximum speed with the rapid acceleration this requires. I’ve been thrown to the floor on the 512, and an ambulance had to be called for a woman who was thrown to the floor by a rapid start on the 47 I was on.
My general feeling about the TTC is that there is no awareness on the part of the operator that they are transporting people, not goods. And that they have not been trained to consider this factor.
Steve: The only metric is a very coarse reporting of crowding. The CEO’s report includes stats claiming that only a small number of trips are “full” or “overcrowded”, but the underlying data on which these claims are based is not publicly available. In route analyses published here, I have only the “empty, moderately loaded, crowded” ranges, not raw numbers, and “full” or “overfull” are not reported separately. From a rider’s point of view, even the “crowded” condition brings problems including the need to stand, difficulty moving through the vehicle, and major problems for both the disabled and for people with large objects like baby carriages.
There is no measurement of speeding, nor of acceleration or braking which are big problems for those who are unsteady on their feet.
LikeLiked by 1 person
Steve, do you think the construction of more LRTs (Eglinton, Finch, Hurontario etc.) will help dampen opposition to proper signal priority for streetcars? Especially in regards to left-turning cars.
Steve: That’s hard to say. The problem is that if “LRT” is perceived as something slow that always waits for other traffic, the cars will always win especially in areas that don’t have a strong existing riding public and their political support. After all, we have been chasing better priority for Toronto lines for years without success, and there is even good support here.
LikeLike