
The list of surface route operating statistics for 2024 recently appeared on the TTC’s Planning webpage. This article consolidates data for the years 2019 (the last pre-pandemic year) to 2024.
Values included in the TTC files are:
- Weekday passenger count
- Weekday vehicle hours
- Weekday vehicle klometres
- AM peak vehicles
- PM peak vehicles
Derived values included in this article:
- Passengers (boardings) per vehicle hour
- Vehicle kilometres per hour
- Recovery rates relative to 2019
Pages for each set of stats are included in the detailed part of the article, and a PDF containing all tables is linked at the end.
In a future article, I will refresh a previously published table comparing service levels on routes in September 2025, when this information is available, with prepandemic conditions.
A basic message of both articles is that the TTC trumpets a return to former service levels, but the metric they use, vehicle hours, misrepresents the level of service provided. Buses and streetcars travel more slowly now than they did in 2019, and they have more generous recovery times at terminals. These combine to make a vehicle hour less productive in the amount of service it provides than in past years, and so 100% of former hours does not produce the same service. That is separate from other factors such as a decline in reliability, bunching and gaps which compound the less frequent scheduled service.
The problem is particularly bad on streetcar routes where a combination of factors including understaffing, budget constraints, and operating practices that slow service, lead to considerably less “recovery” to former service levels. In turn, this hurts service quality and blunts ridership recovery.
Crowding conditions are not addressed by these stats, and this is difficult to extract from TTC tracking data due to the coarse-grained nature of reported loads. TTC does not publish numeric vehicle loads, only broad light-medium-heavy loading indications. Although they report all-day ridership on each route, this is not broken down by time of day, location and direction, at least not for external consumption. TTC has crowding standards, but we do not know how well they meet them.
The number of peak vehicles is lower in 2024 than in 2019. This partly reflects limits on service growth, and partly the shift of demand into off-peak periods.
In the attempt to woo riders back onto the TTC, let alone to boost transit’s mode share for travel in line with City goals, the question of service level and quality is key. In theory, if demand actually sits below the historic level, then less service is needed to handle it. However, those who remember the condition of transit before 2020 will know that crowding was a pervasive problem and calls for better service were common. Only the March 2020 drop in demand saved the TTC from a capacity crisis.
Toronto must understand and commit the resources needed to achieve its transit goals. Just getting back to 2019 is no goal to aim at.
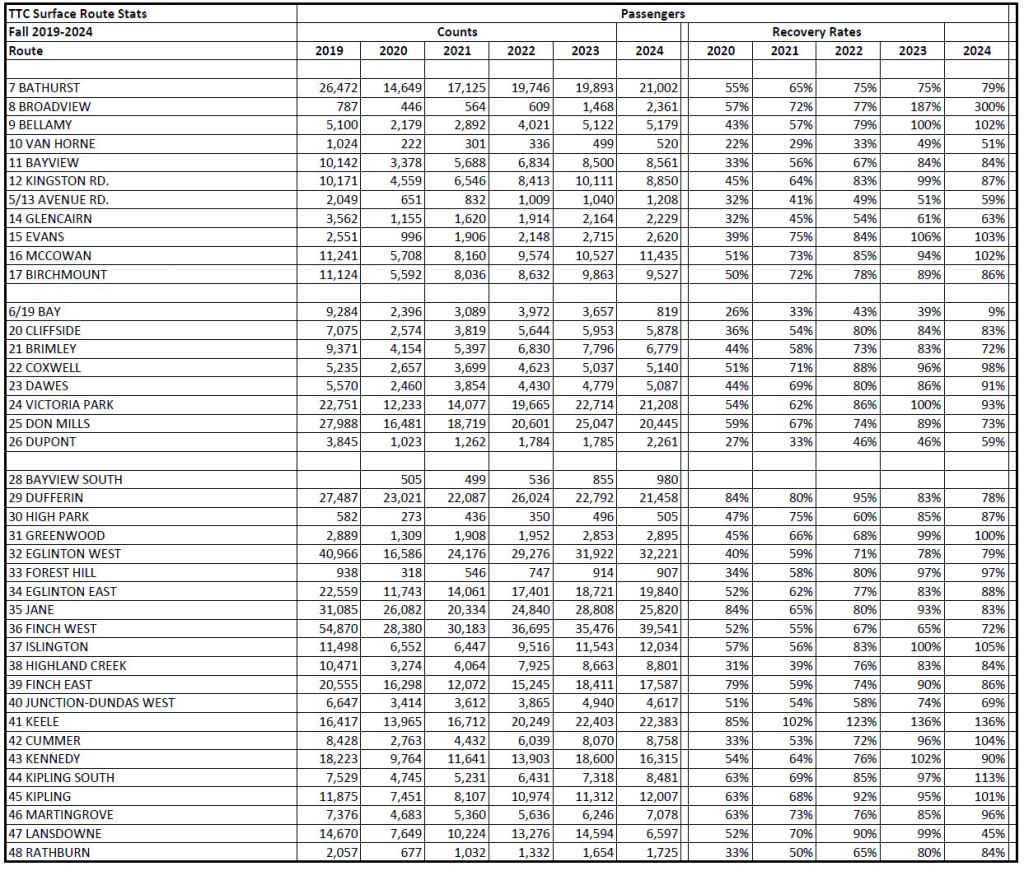
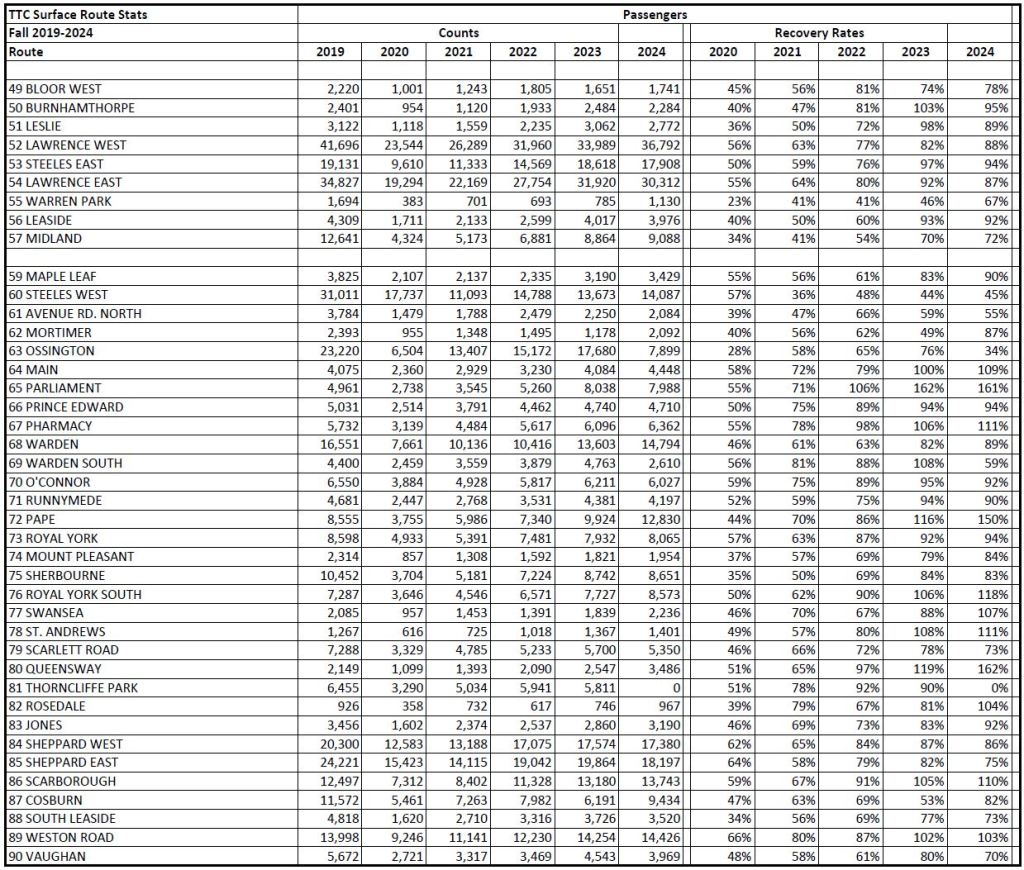
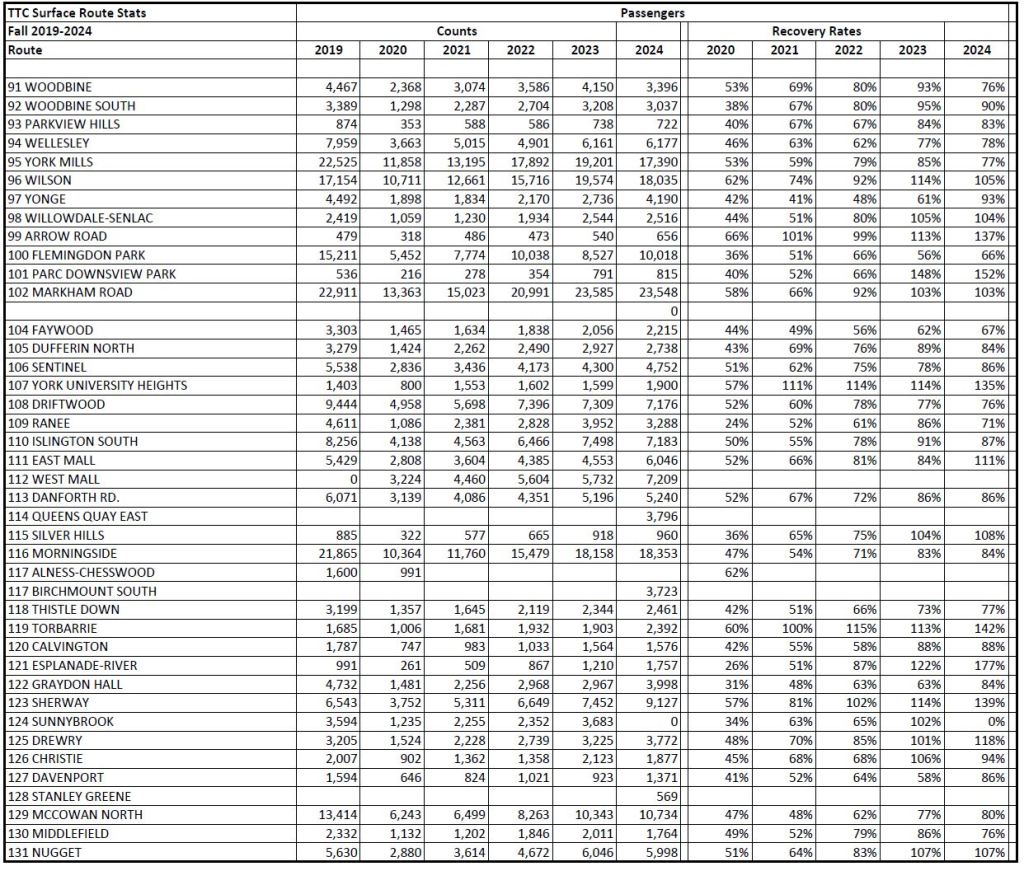
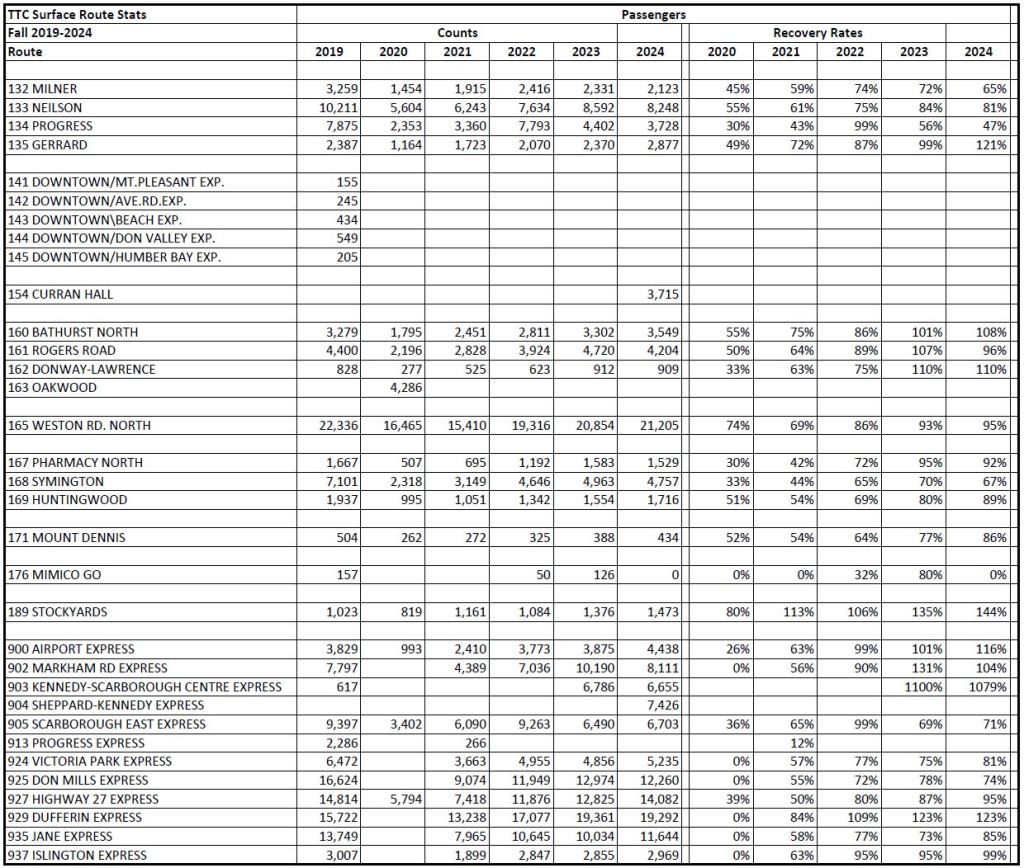
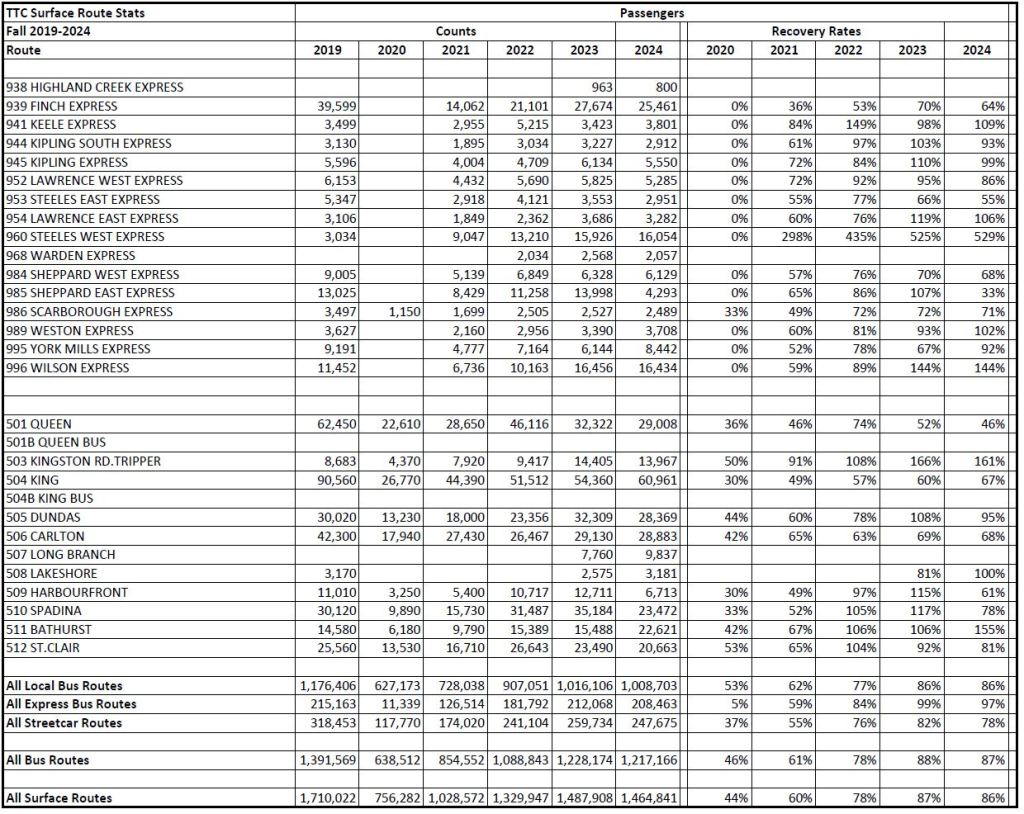
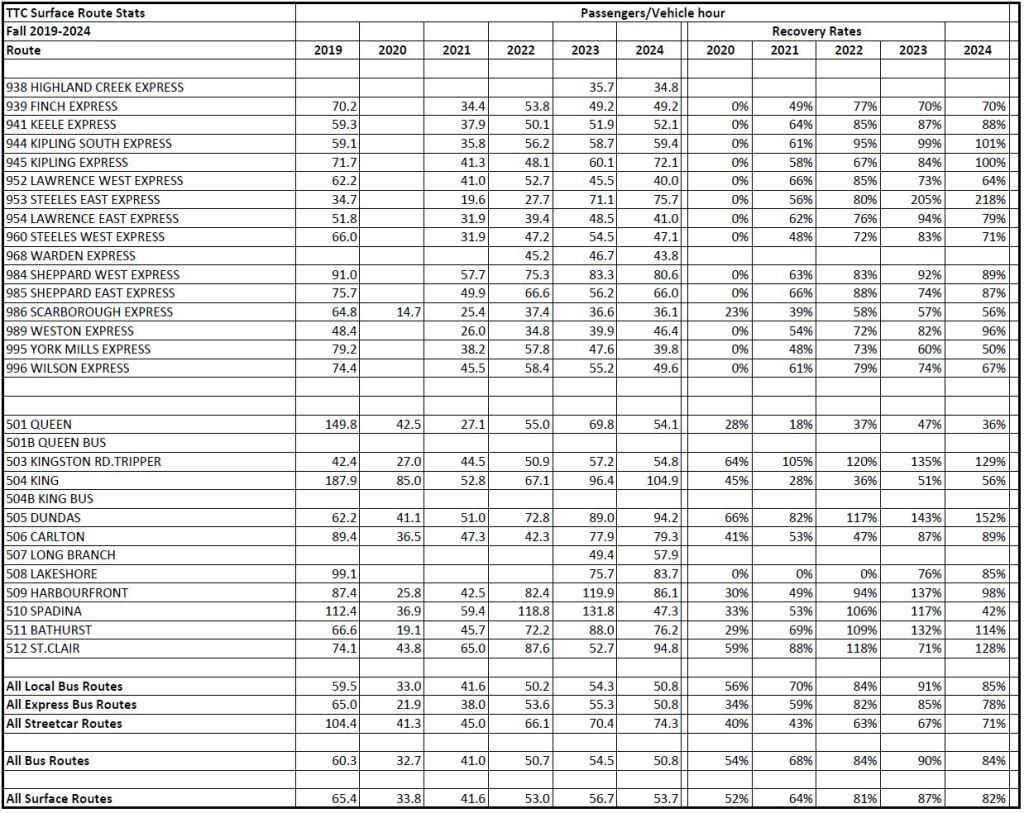
Weekday Passenger Counts
The passenger counts in this table are taken from the Fall in each year. 2019 shows the historic level of riding on each route (where it existed in 2019). The counts for 2020-2024 show the initial drop and then recovery in following years. Percentages of recovered ridership are shown for 2020-2024 where data exist both for 2019 as a base and for the respective year.
At the bottom of the table, the stats for all local buses, all express buses and all streetcars are combined.
Grouping routes by type, the recovery levels to 2024 are:
- Local bus routes: 86%
- Express bus routes: 97%
- All bus routes: 87%
- Streetcar routes: 78%
The express buses fare generally better than the local services likely because these operate only on busy routes with strong demand.
One issue with the streetcar routes is that they serve the core area where return to in-office work is slow, but two other factors also affect them. Major construction projects have made streetcar service unreliable driving choice riders away. Moreover, the level of service operated on streetcar routes is considerably less frequent in most cases through the combined effect of pandemic-era cuts, the change from shorter CLRVs to longer Flexitys, and an artificial constraint on streetcar service thanks to a difficulty in recruiting staff (according to the TTC). The fleet is substantially larger than required for day-to-day service, and the TTC could run more service if only they would send out more streetcars.
As a general note, the TTC does not publish vehicle crowding data and passenger counts at a granular level and so it is impossible to know the distribution of heavily loaded buses versus near-empty ones. Available data show only a nearly-empty, moderately full and full status, and in particular do not show whether a bus has passed the line between seated and light standing load which is a metric in the Service Standards for off-peak service. Riders encounter standees at all hours, but the TTC does not report on the degree to which its service exceeds crowding standards.
In some cases, route changes affect the 2024 recovery level percentage because this is not an apples:apples comparison including:
- 8 Broadview is extended south to Gerrard & Broadview and east to Warden Station
- 65 Parliament is extended south to Corus Quay
- 72 Pape is extended north replacing 81 Thorncliffe Park, and is restructured in the waterfront area partly replaced by 114 Queens Quay East
- 80 Queensway is restructured
- 960 Steeles West Express is restructured to provide through trips and avoid transfers from 60 Steeles West which has an offsetting low recovery rate
- 996 Wilson Express is extended east to Scarborough Centre
- 503 Kingston Road becomes an all-day route
- In 2023 only, data are shown for the King and Queen bus services separately from the streetcars. Ridership numbers are consolidated in the table below, but other metrics are shown separately in later tables. That is how the TTC reported them.
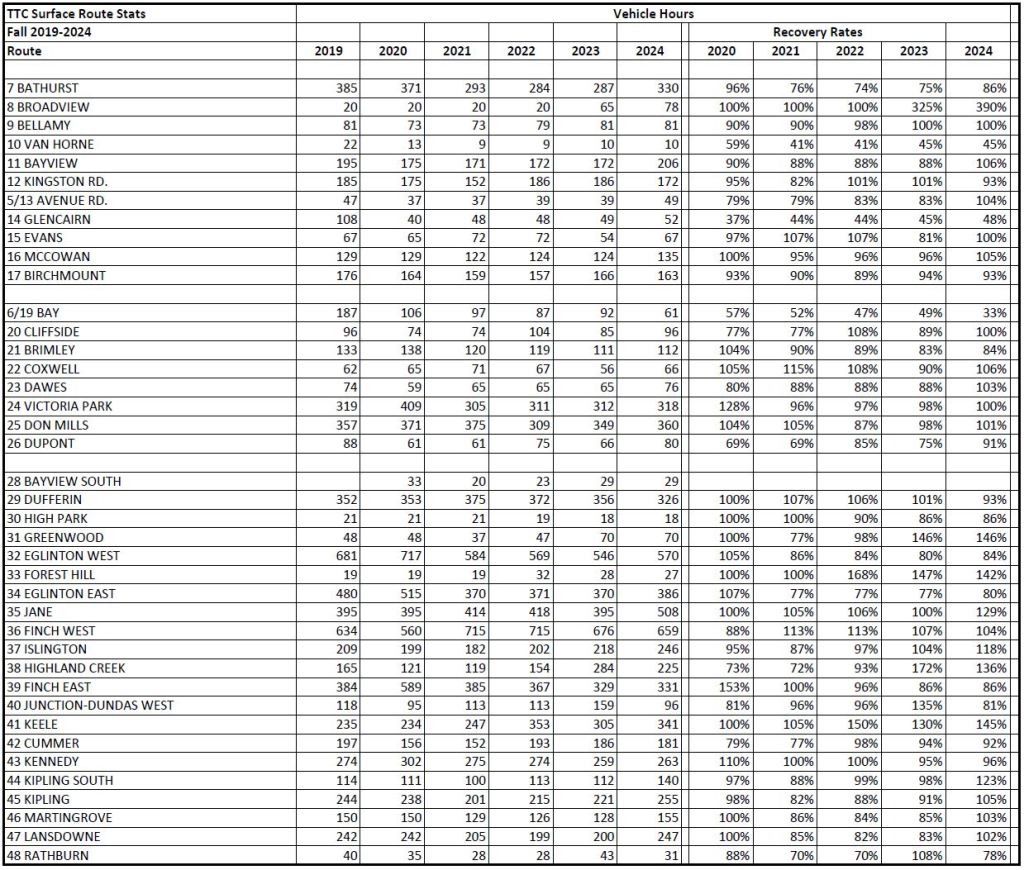
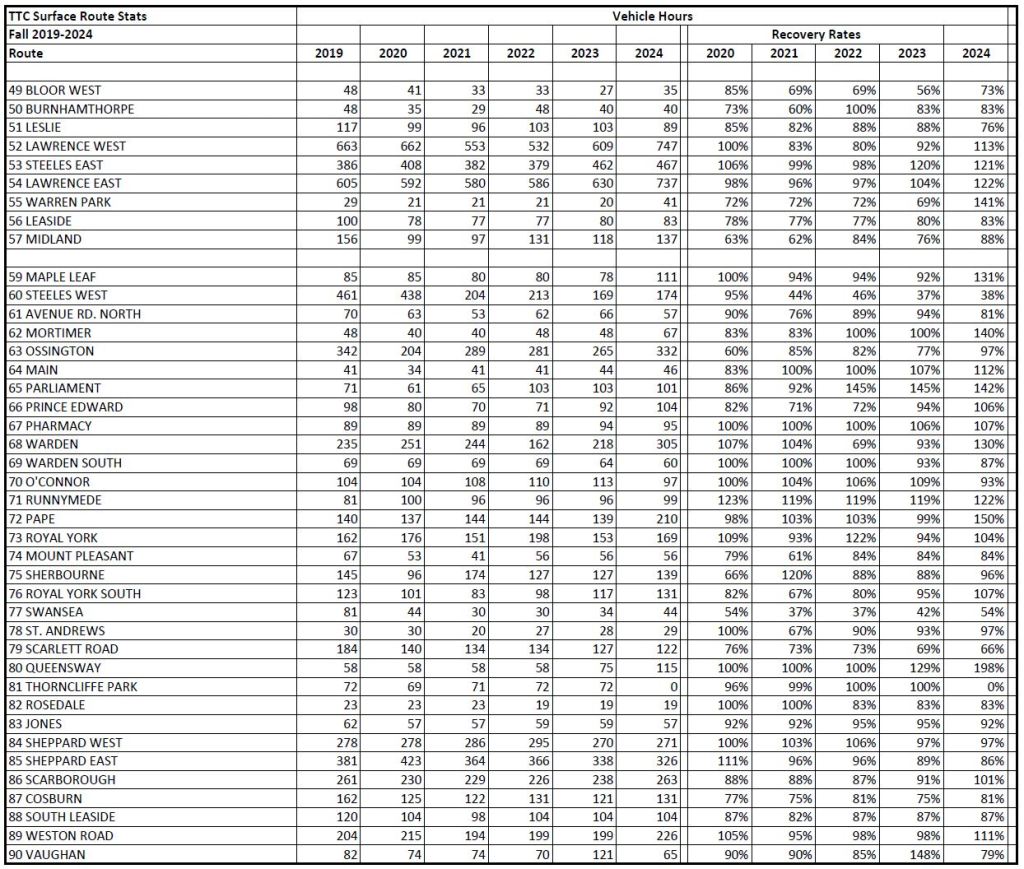
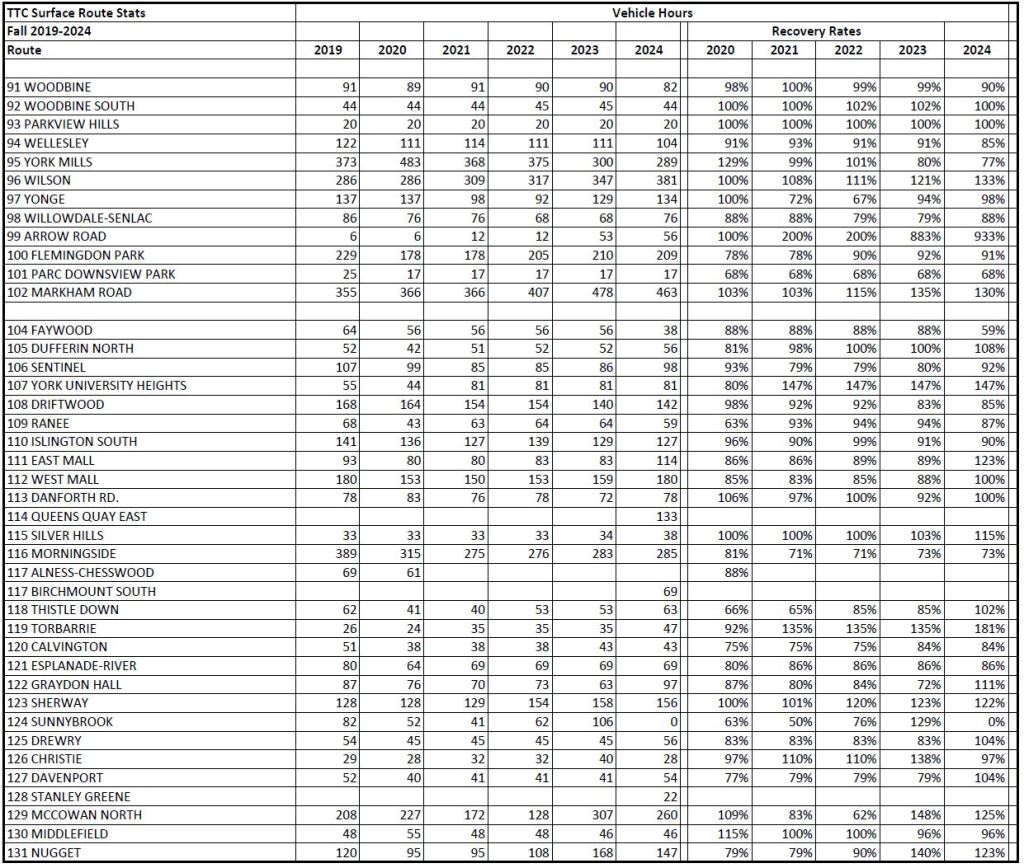
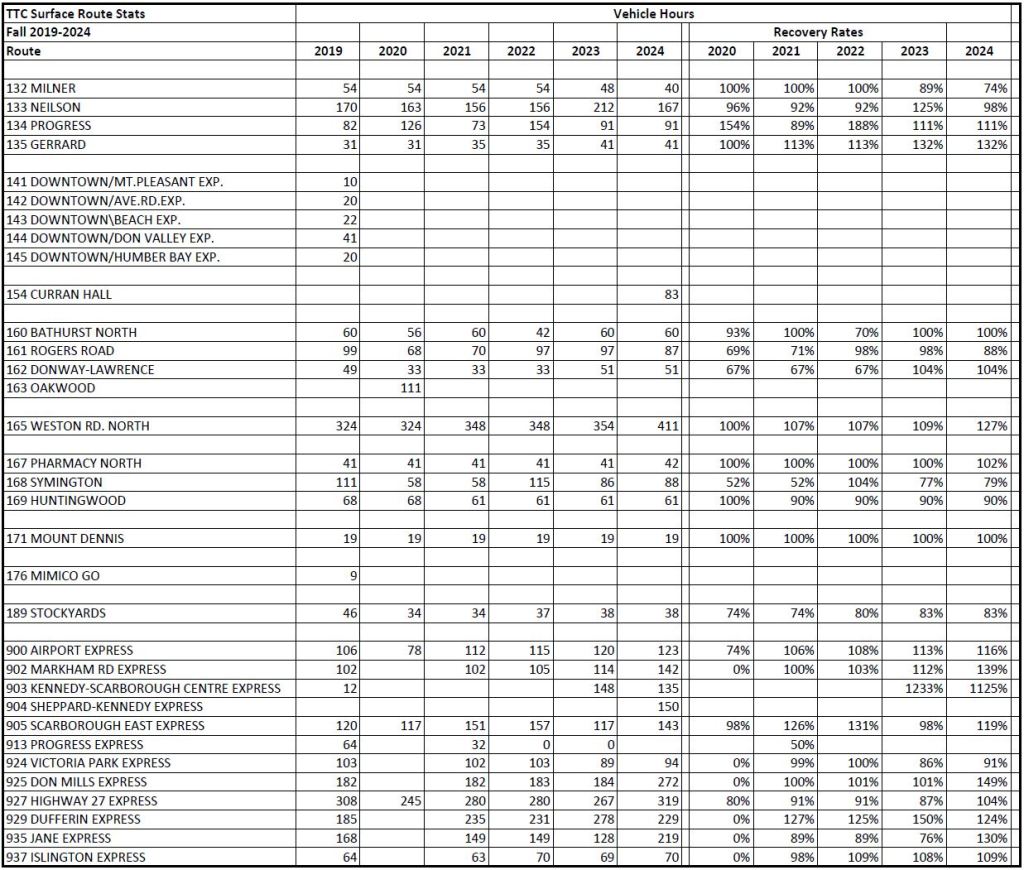
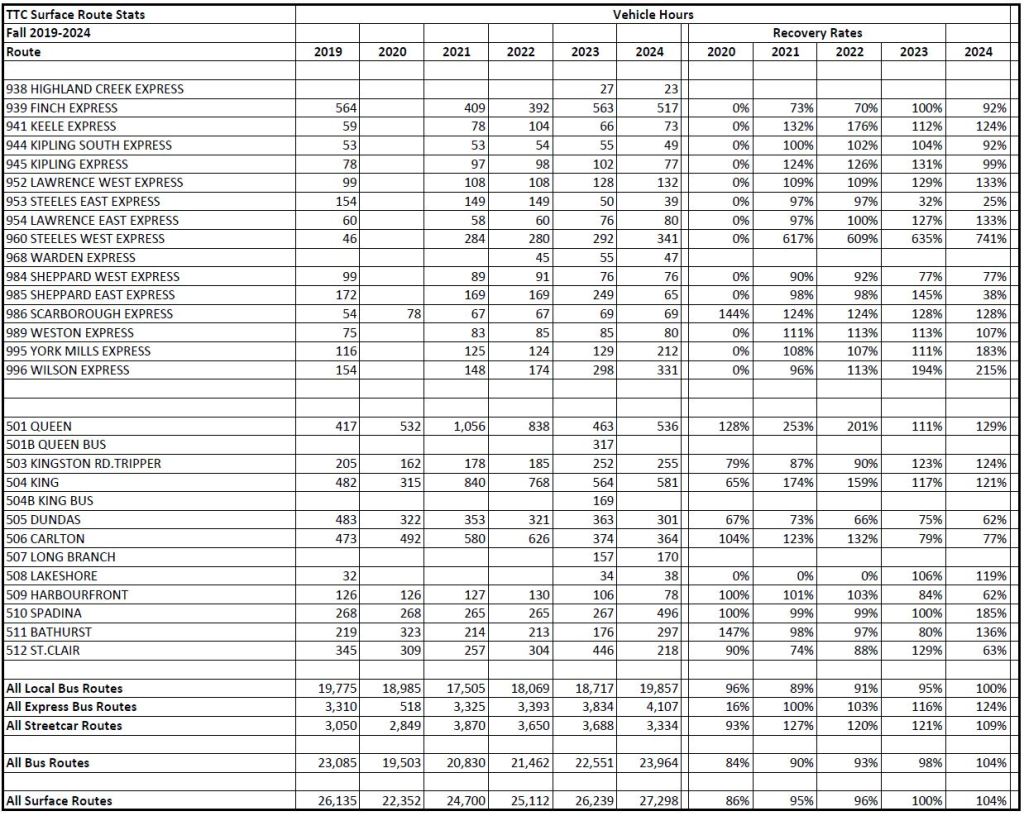
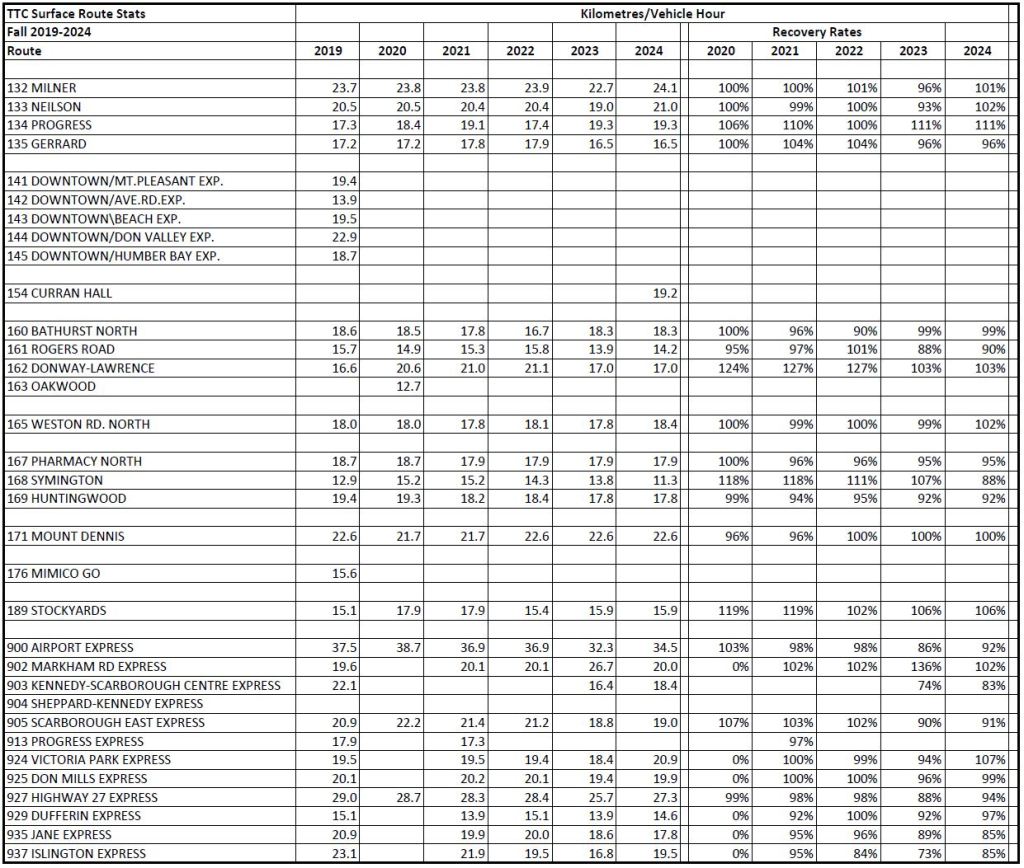
Weekday Vehicle Hours
When the TTC reports that service has return to pre-pandemic levels, the metric they cite is vehicle hours. However, streetcars and buses travel more slowly in 2024 than in 2019, and they have longer provisions for recovery time at terminals. One hour of vehicle time does not provide the same amount of service in 2024 as it did five years earlier.
Based on this metric, the recovery rates are:
- Local bus routes: 100%
- Express bus routes: 124%
- All bus routes: 104%
- Streetcar routes: 109%
The streetcar hours in 2024 dropped considerably from the levels in 2021-2023 in part due to service cuts. Some of these will be restored in fall 2025, but this shows how service levels are artificially constrained by staffing levels and budgets.
Overnight service is not included in this table. TTC argues that some staff who might be used for daytime service are consumed driving extra night car service to offset the lack of storage at carhouses. The Russell Carhouse rebuild is still underway, and the Hillcrest modifications have not yet progressed beyond design. The TTC is in a box of its own making, but streetcar route riders suffer.
Moreover, it is not clear what future night service levels might look like, and the improved overnight service could continue even when carhouse storage is available.
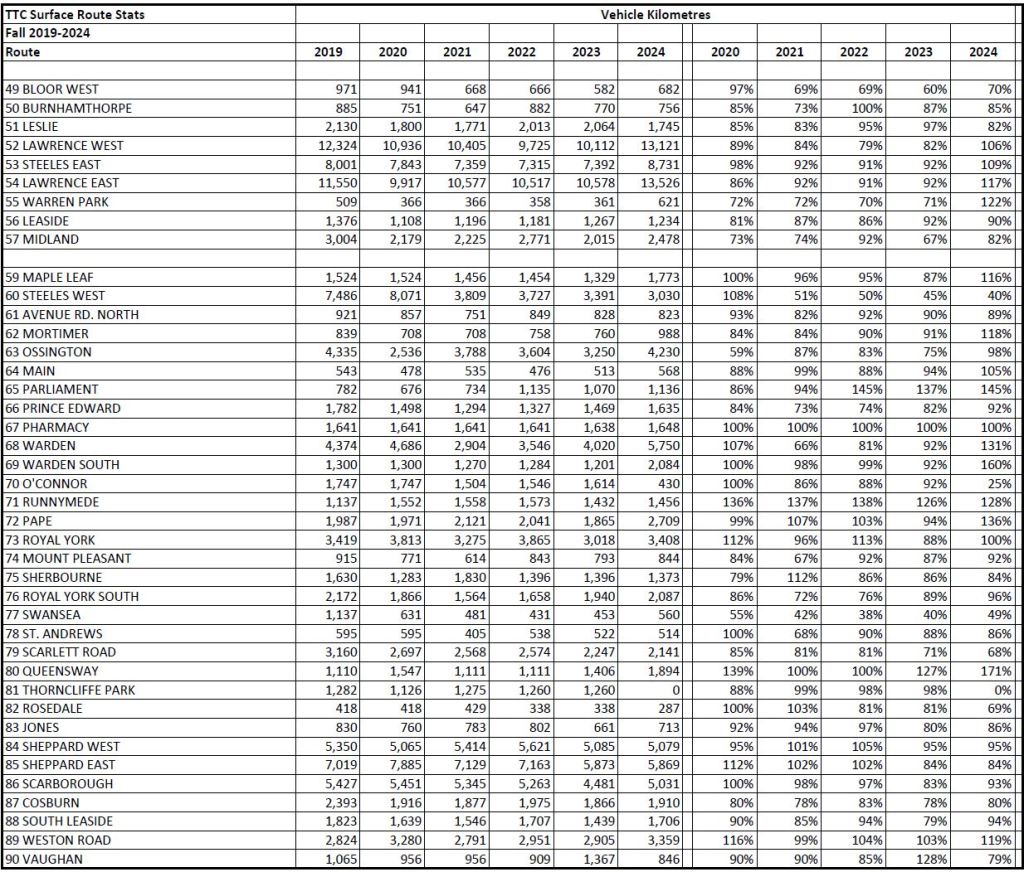
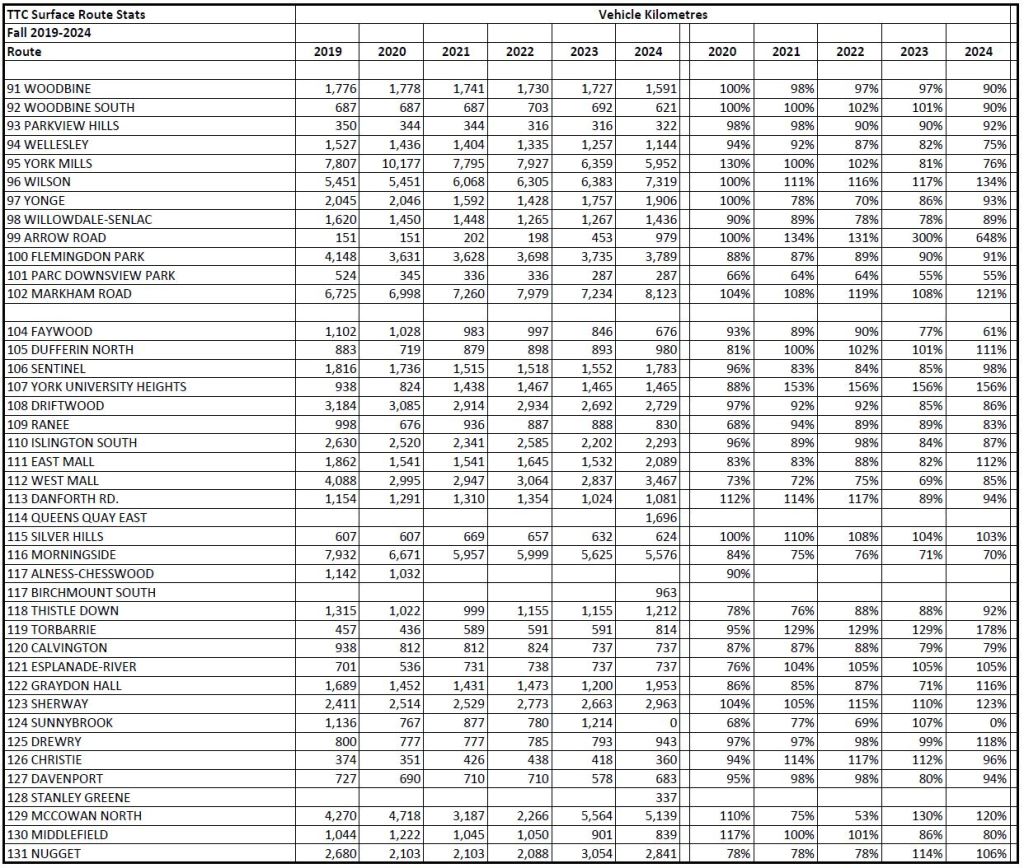
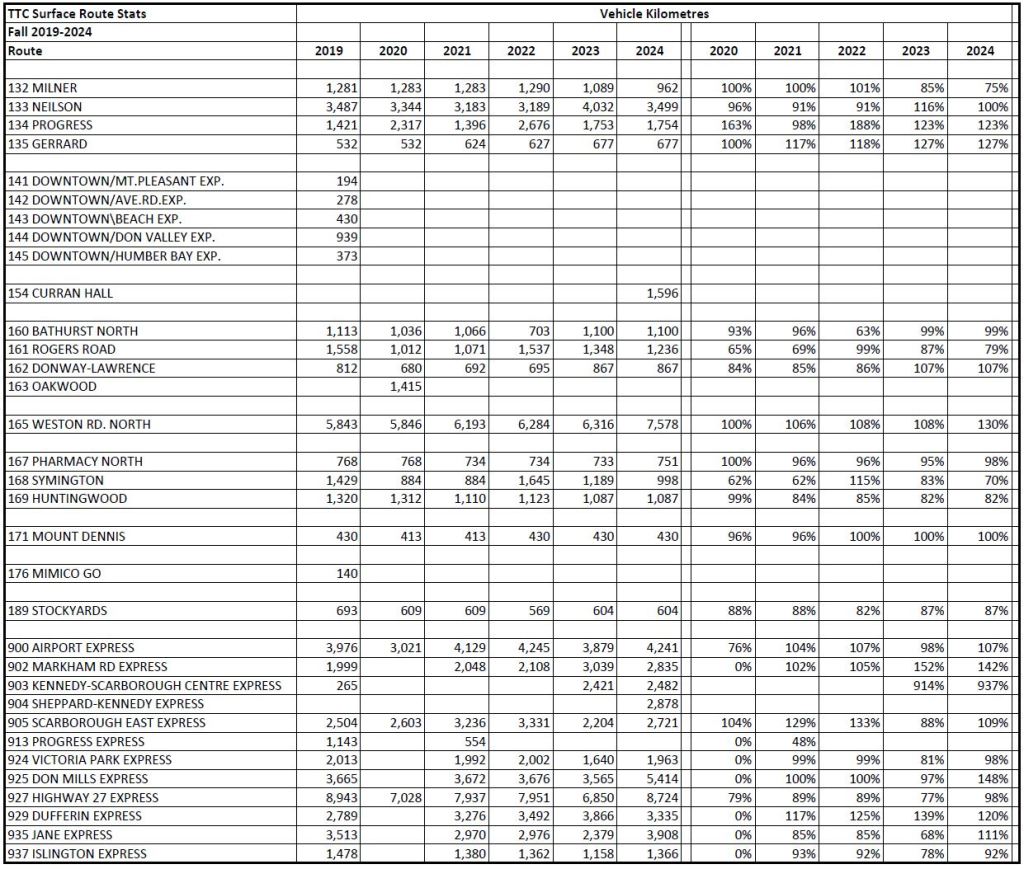
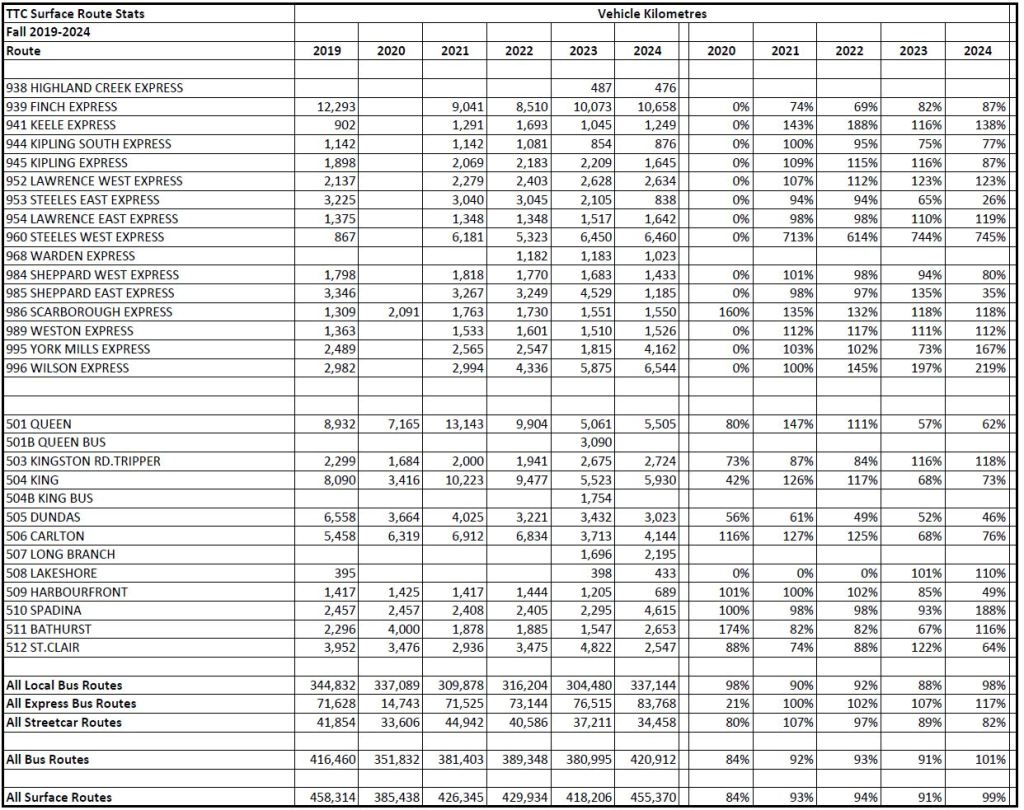
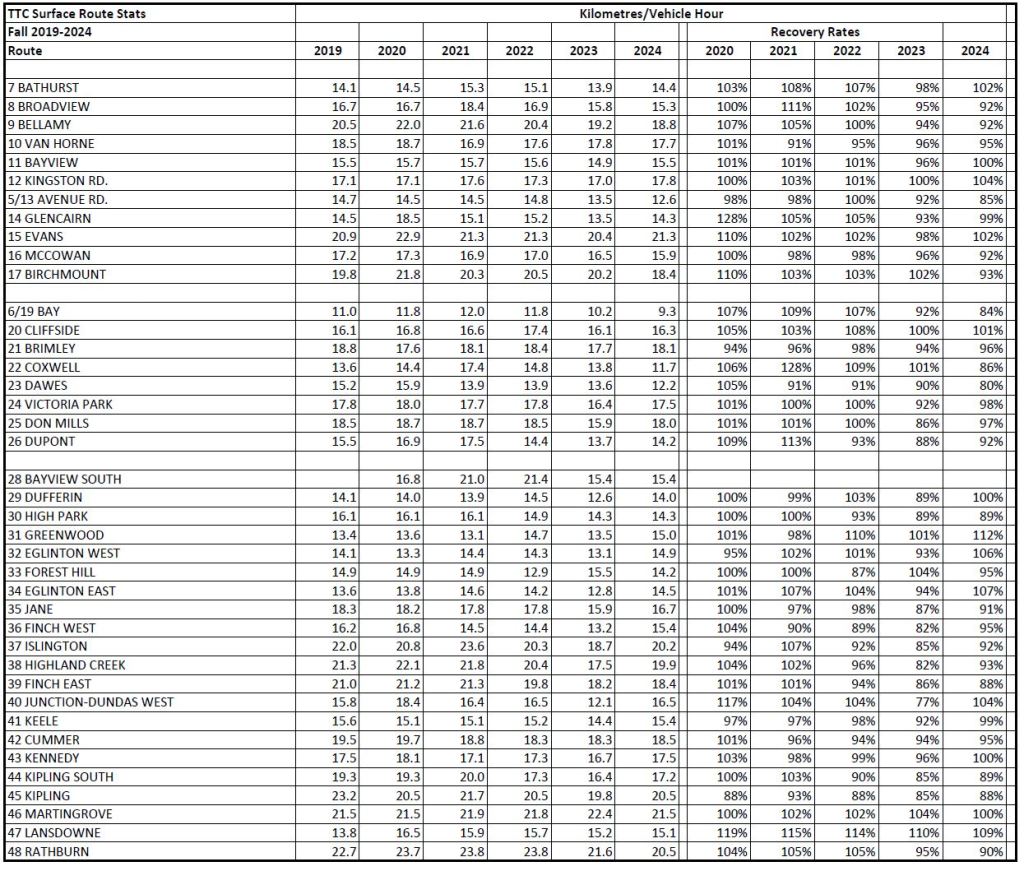
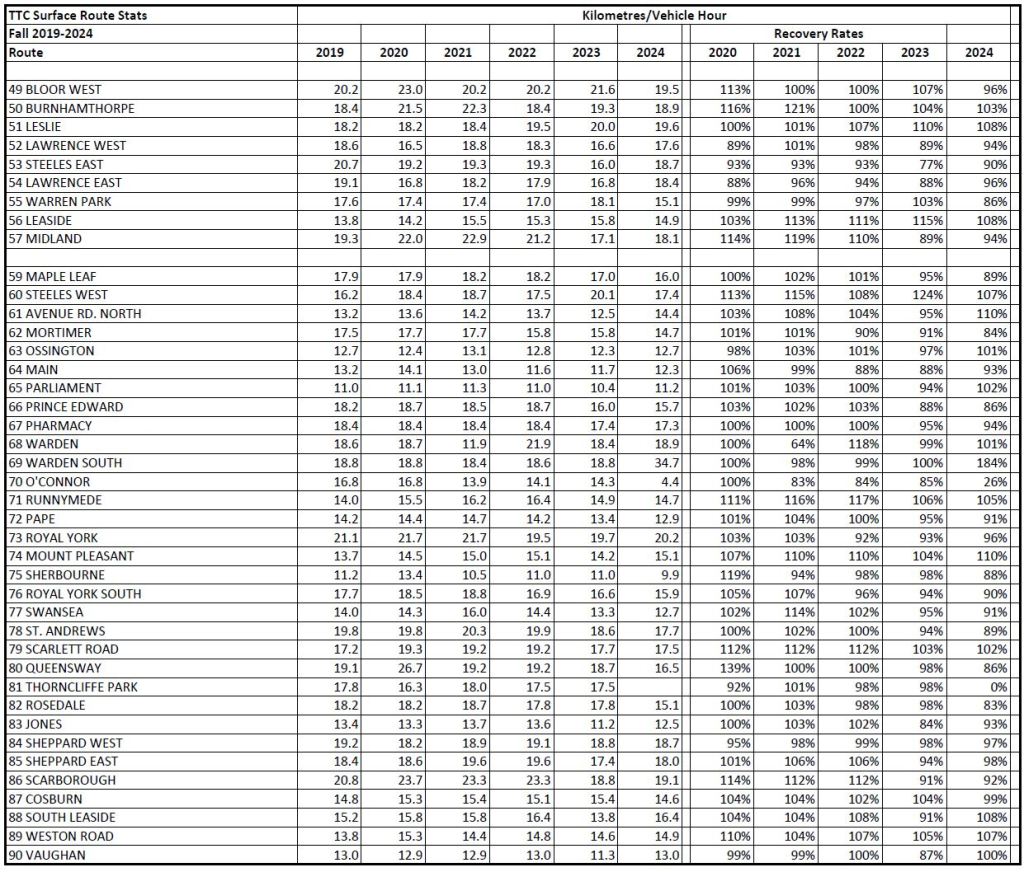
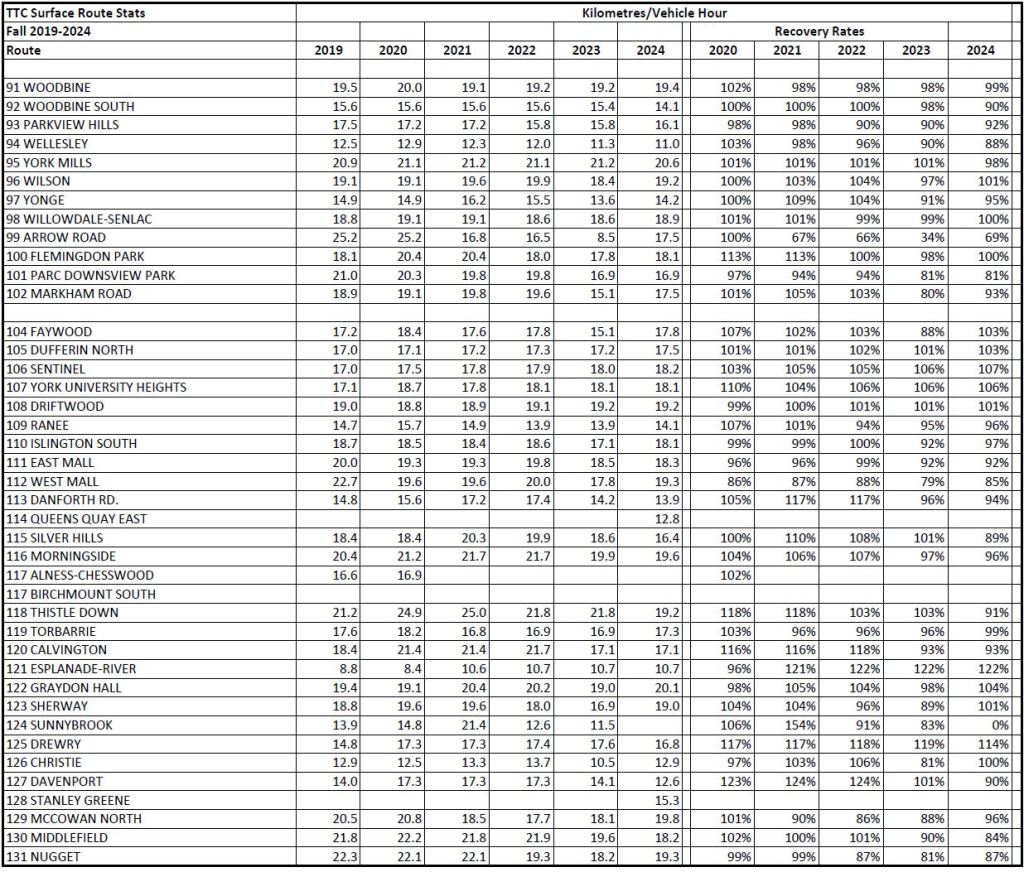
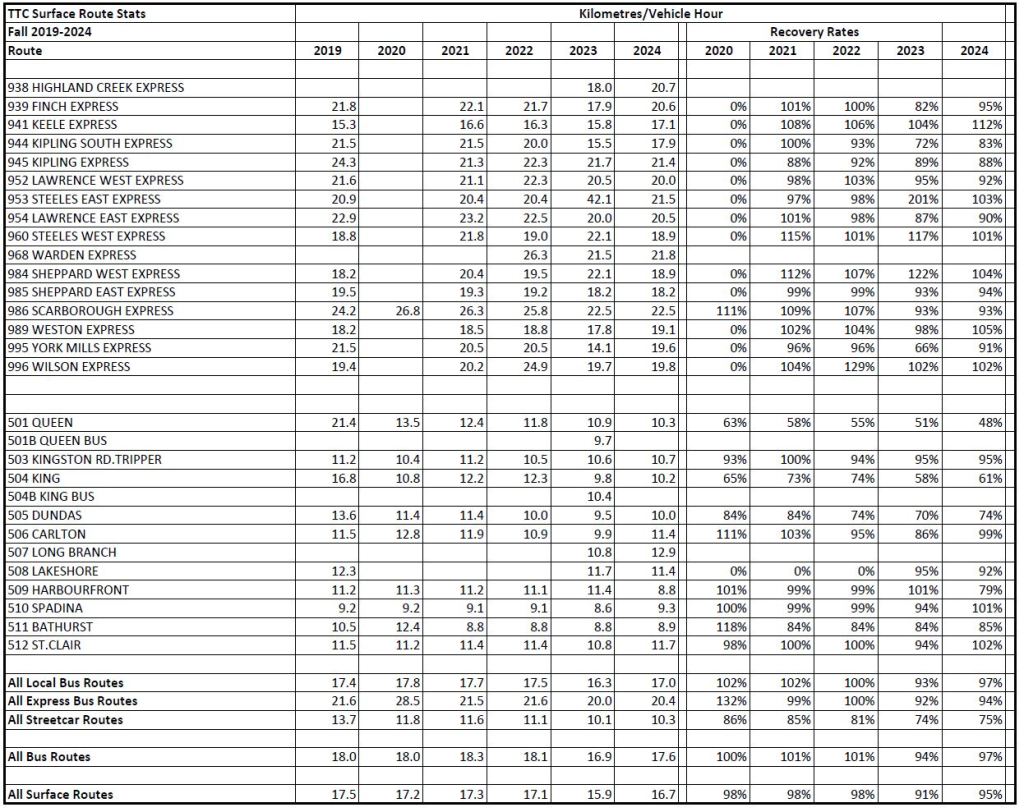
Weekday Vehicle Kilometres
The vehicle kilometres travelled tell a very different story from the vehicle hours table above.
- Local bus routes: 98%
- Express bus routes: 117%
- All bus routes: 101%
- Streetcars: 82%
The difference in percentages, especially for streetcars, reflects the change in average speed. Note that the values here are calculated from scheduled hours and mileage, and they are different from values shown on the TTC’s Scheduled Service Summaries (available on their Planning page, and under the Reference tab on this site). The vehicle hours reported above include terminal recovery/layover times. When these are increased in the name of “reliability”, the effective scheduled speed goes down even though the actual driving speed might be unchanged.

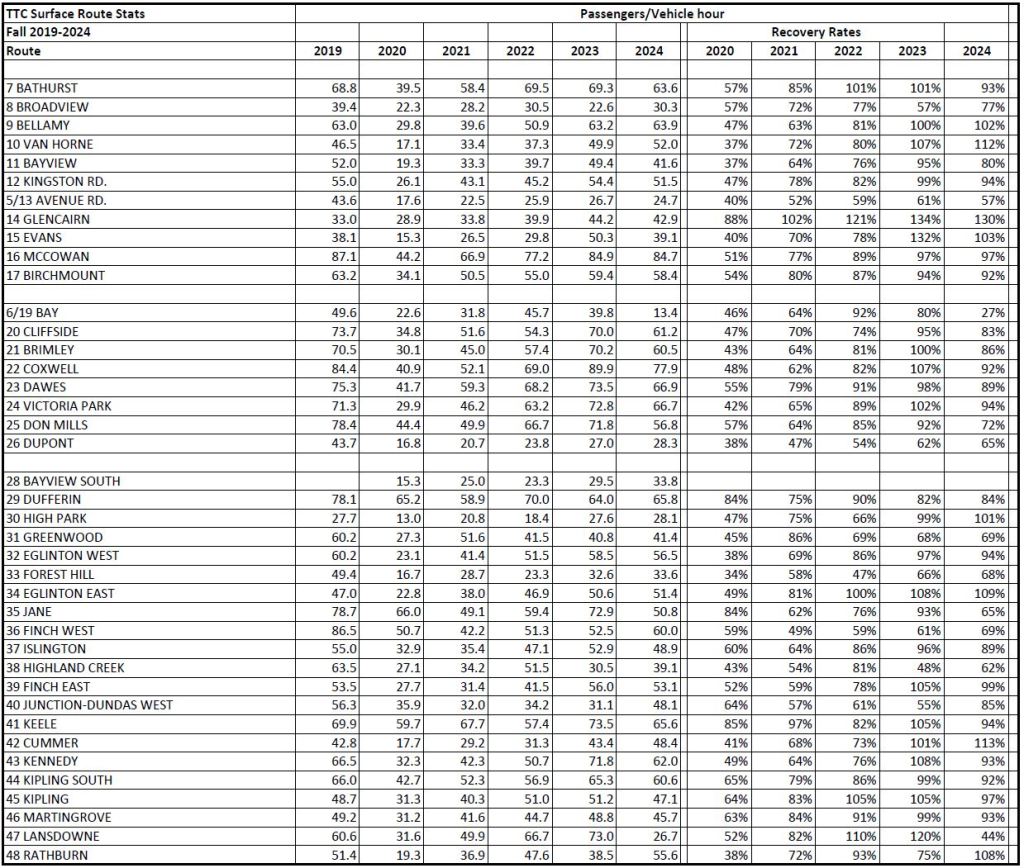
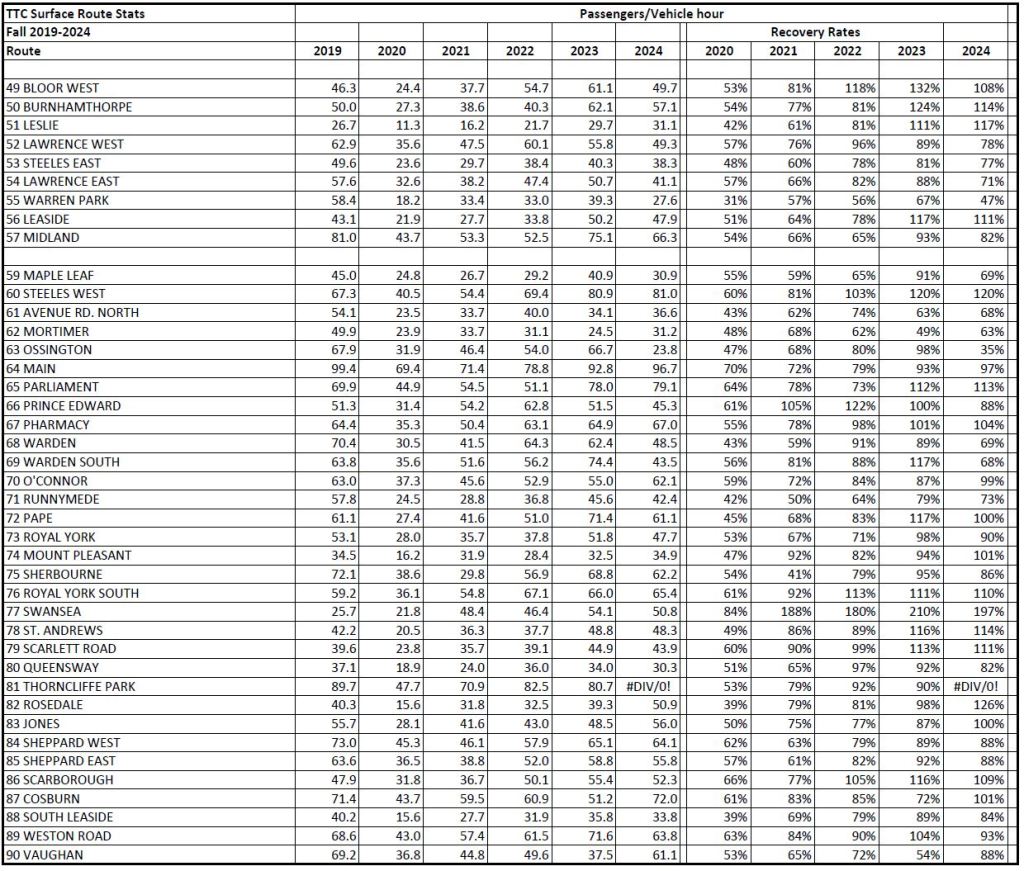
Passengers (Boardings) Per Vehicle Hour
In these tables, riders are counted on an “unlinked” basis where they show up on each route used in their journey. In 2024, there were fewer boardings per vehicle hour across the system than in 2019.
- Local bus routes: 85%
- Express bus routes: 78%
- All bus routes: 84%
- Streetcars: 71%
These numbers show the combined effect of the post-pandemic recovery and the fact that more vehicle hours are operated (slower vehicles) to provide comparable service. Put another way, a “boarding” passenger consumes more vehicle hours to get from “A” to “B” because the vehicle drives more slowly and/or has more padding in its schedule.


Vehicle Kilometres per Hour
Vehicles, particularly streetcars, travel more slowly in 2024 than they did in 2019. The speeds shown here include terminal recovery/layover time.
- Local bus routes: 97%
- Express bus routes: 94%
- All bus routes: 97%
- Streetcars: 75%
Note that the scheduled speed of streetcars has declined steadily, including recovery time provisions, from 2020 onward. Some of this is due to slower operation thanks to stop service times, and some is due to the standing slow order on all intersections where streetcars tip toe across junctions whether this is justified by track conditions or not. The Queen car is spectacularly slower in 2024 with a scheduled speed less than half that of its 2019 counterpart.
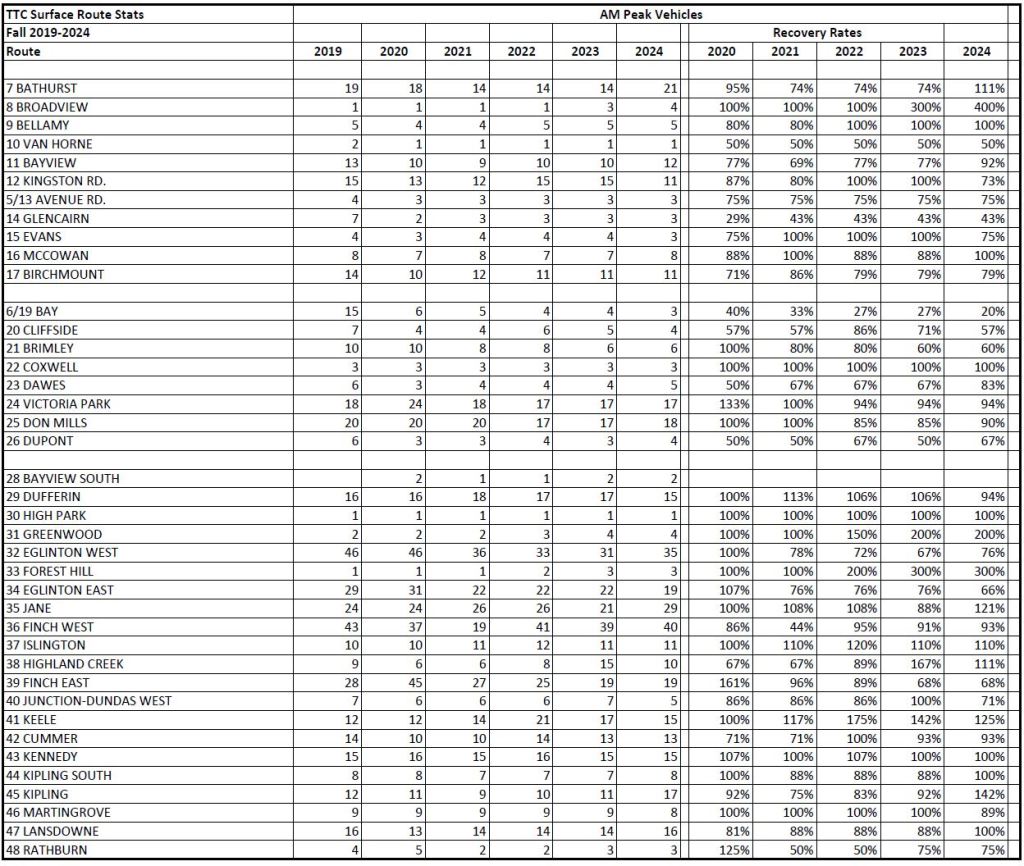
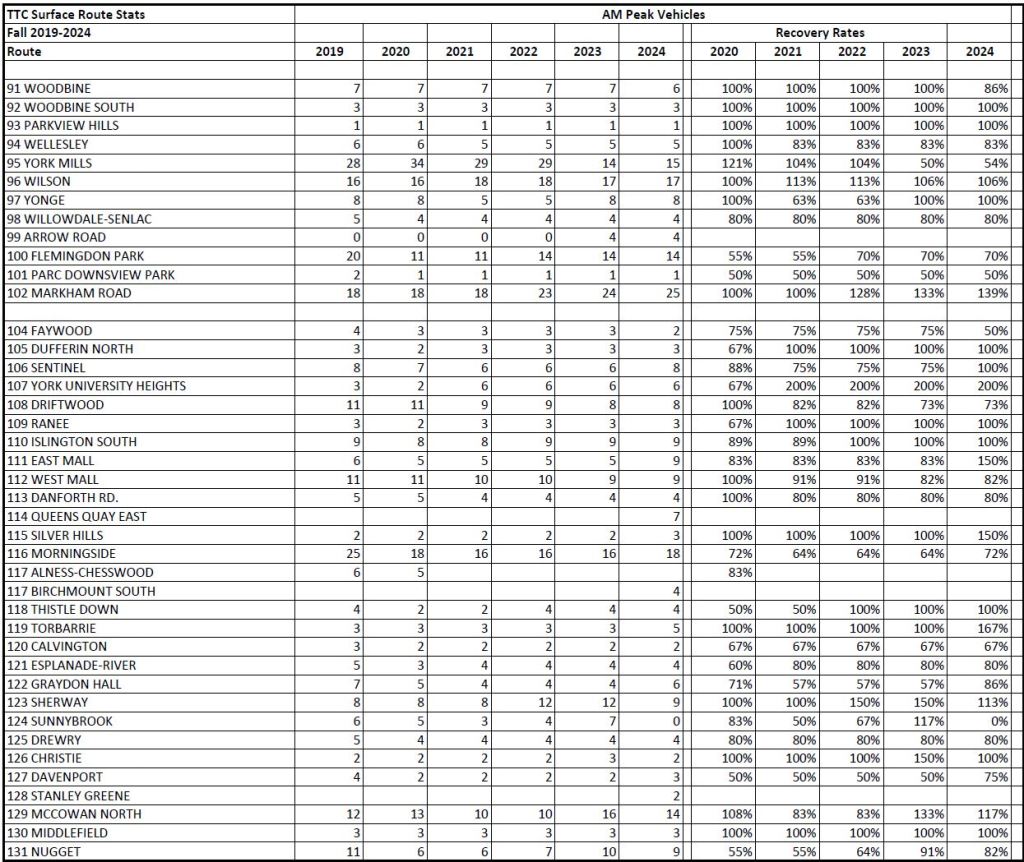
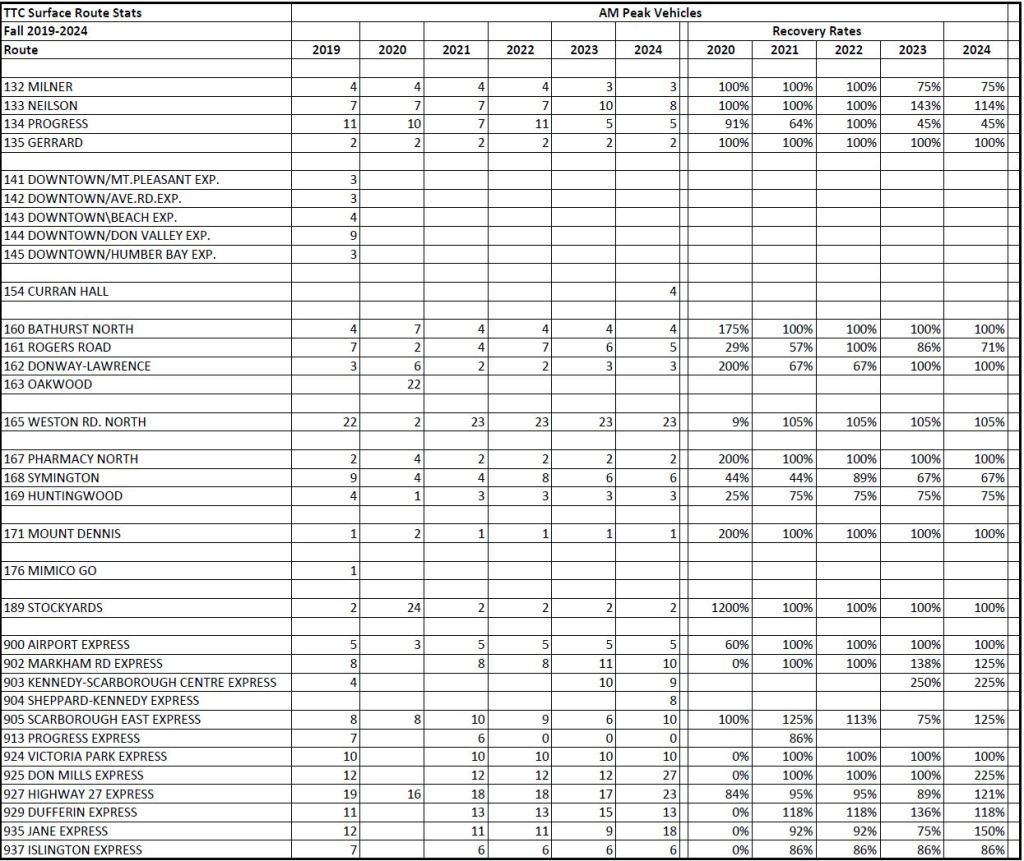
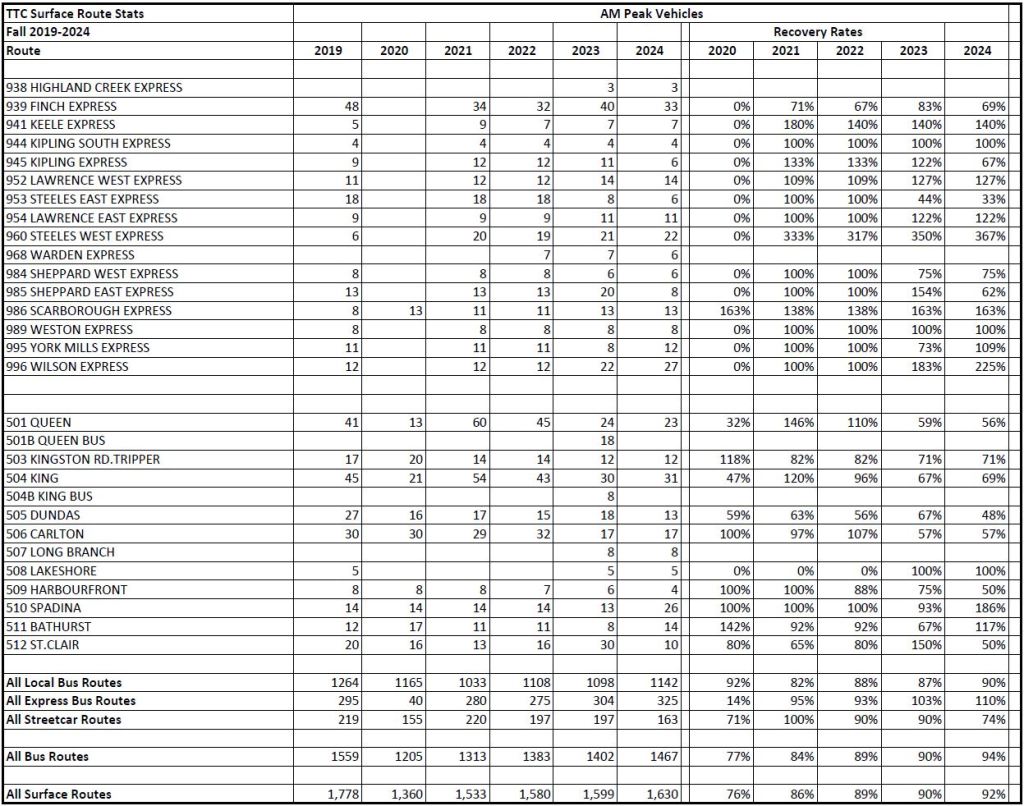
AM Peak Vehicles
Vehicle allocations are affected by service levels (the number of buses or streetcars needed for the scheduled headway), route speed (which extends or reduces travel time) and availability (both of vehicles and staff to operate them).
The ratio of buses or streetcars operated in 2024 to 2019 does not fully reflect the service level changes because the same number of vehicles provide less service if they run more slowly.
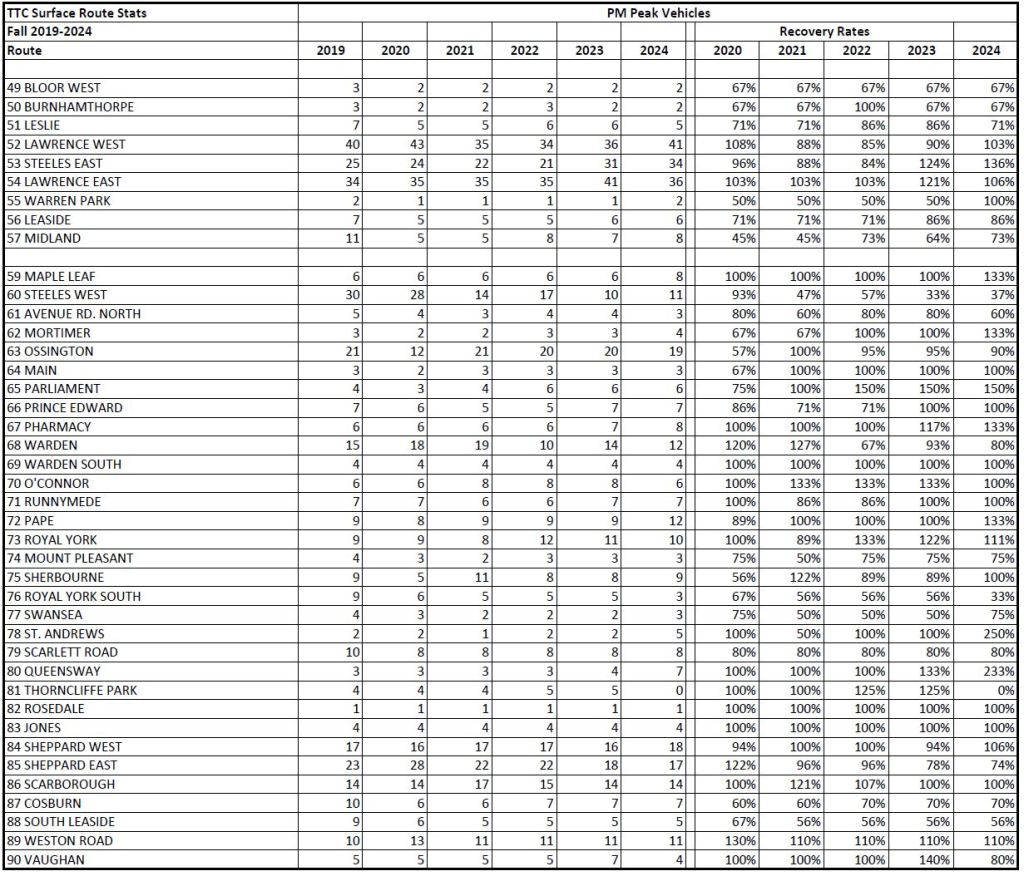
The total number of buses on bus routes is 6% lower in the AM peak in 2024 than it was in 2019. The streetcar service is down 26% although this is partly due to the retirement of the CLRVs and their replacement with larger vehicles. The PM peak reductions are 3% for buses and 16% for streetcars. The TTC might be expanding its fleet, but fewer vehicles are in active use.
This shows a classic conflict between capital and operating budgets. Money to buy new vehicles is comparatively easy to come by, but actually operating them is another matter. There is also the question of overall fleet reliability and whether more vehicles are needed to support service today than in 2019.

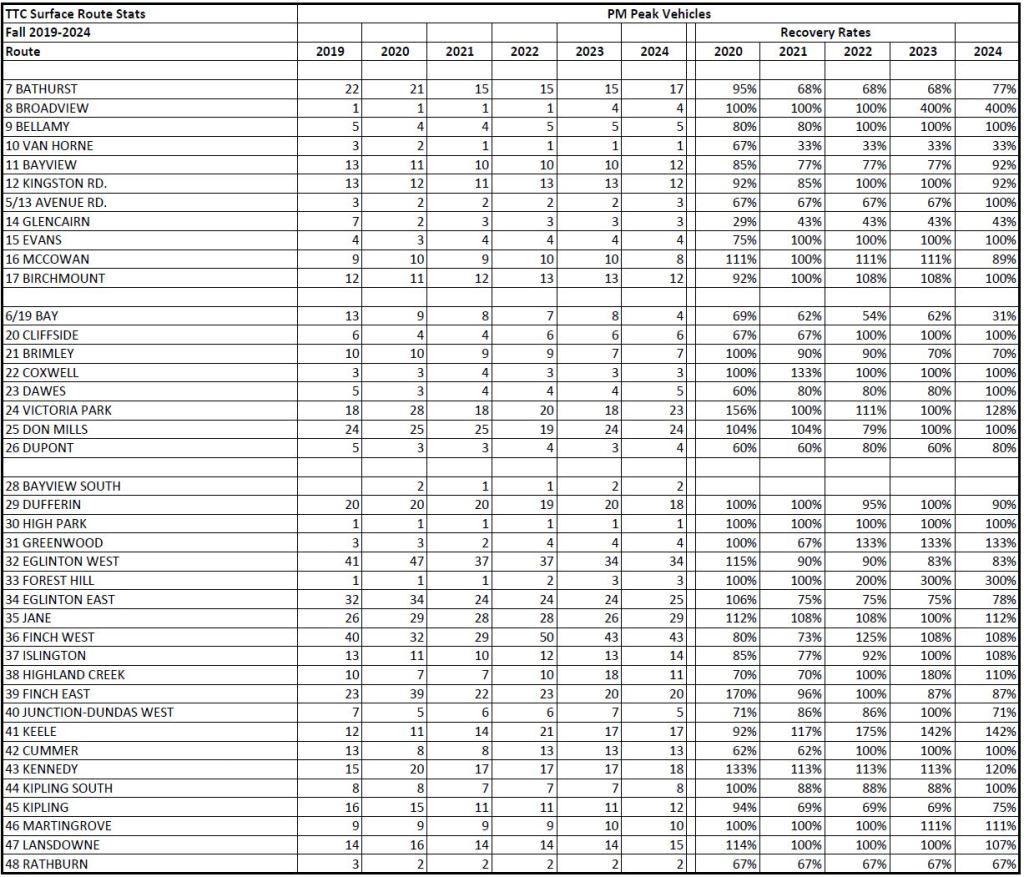
PM Peak Vehicles
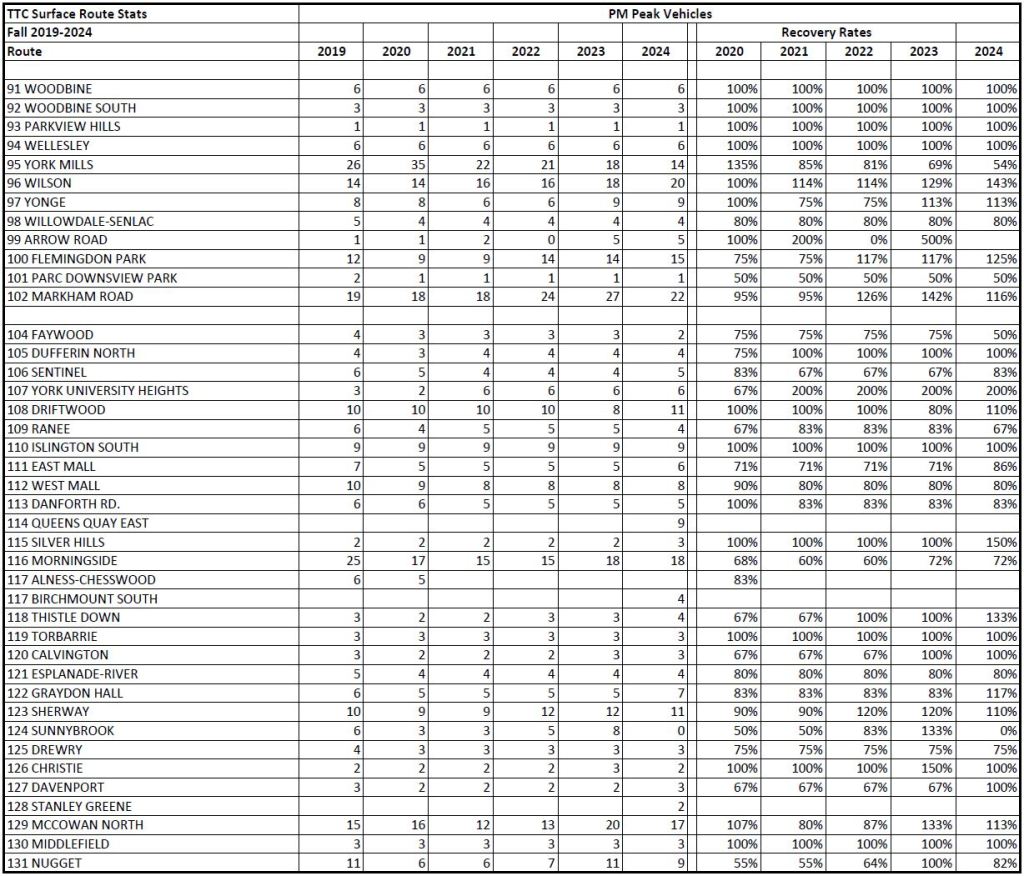
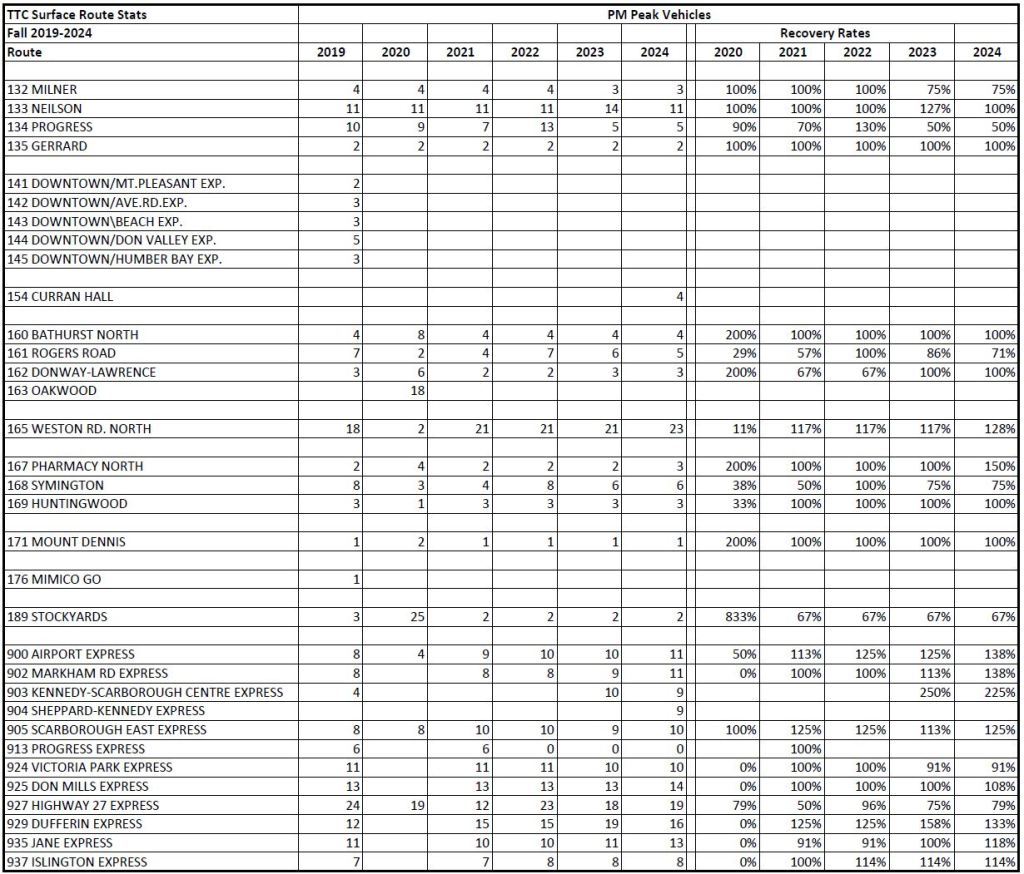

Full Chart Set
All of the charts from this article are contained in a single PDF linked below.

Wow. The 19 Bay has had its frequency slashed, and no longer goes to George Brown, completely killing ridership. It obviously provides a service, but 9% recovery even when accounting the above changes is wild. I would like to use this route more, but the frequency is such a barrier.
Good to see the 121 far above the 1000 riders a day threshold. Look how far we’ve come!
LikeLike
There was a route change to remove the 95C as part of the 996 expansion as well, though I was surprised to see that many buses removed (not sure if it’s entirely due to the consolidation, 46% on the am peak is a big drop).
Does anyone remember why they were combined as the combined route has noticeably worse headways (from 5 to 10 min, but I have seen up to 15 with some frequency). The buses seem to be full enough to justify some additional service.
Steve: The change happened in January 2023, and you can read about the details in my article. The change was described in the TTC’s memo as being for “reliability” of the 95 York Mills service, and that “With this adjustment, capacity along the York Mills Road corridor between York Mills Station and Ellesmere Station will be maintained.”. In fact the combined service in the AM peak was cut, but it was improved in the PM.
LikeLike
Thanks Steve! I guess the changes are mainly felt on the local route (which I take), but the majority of the ridership is on the express stops for sure. The change is probably somewhat self reinforcing as it becomes better to walk to an express stop, the local ridership erodes but we will see…
LikeLike
I remember decades ago, seeing route costs for the subway, streetcar, and buses. This was before the TTC went on-line and on the internet. We would be able to see which routes had to be subsidized and which actually made money to pay for the under-performing routes. Hint, most of the streetcar routes made money.
Would like to see a listing of the money making and money losing routes today.
Steve: A major problem over the years has been to calculate the revenue allocated to passengers on routes to offset costs and produce a notional profit and loss ranking. Before passes (ie before May 1980), a rider paid a fare for each trip, and a typical trip consisted of two boardings. The problem even then was that one-seat rides underallocated revenue, and trips with two or more transfers overallocated revenue based on an assumed half-a-fare per boarding revenue allocation. This actually understated “revenue” for routes with a lot of one-seat rides like the subway and streetcars, and overstated revenue for feeder bus routes. TTC tried to fix this with an adjustment to allow for one-seat rides, but problems remained. The situation was also complicated by the fact that serving a trip on a short route like 22 Coxwell was cheap, but on a long one like 54 Lawrence East was not. The short routes were always ridiculously “profitable”.
With the introduction of passes, the link between paying a fare and making a trip was broken, and the revenue allocation depended on assuming a standard value for a pass-based fare. Even that is subject to the same problems described above. For example a downtown resident taking 100 trips a month would “pay” much less per trip or boarding than someone riding at the break-even rate of 52 trips/month, but pass revenue would be allocated on the basis of an average of roughly 74 trips/month. With Presto and the two-hour transfer (a limited time pass), not to mention cofare arrangements with other operators, it becomes impossible to allocate specific revenue to a specific link in a journey.
If one is more concerned with how well a transit service is used, metrics such as crowding and density (boardings per vehicle hour or kilometre) make more sense than trying to calculate a dollar figure.
Another issue is that capital costs are not included in the “profit and loss” cost base, and if they were, transit would look a lot worse. However, we are not trying to recoup capital costs from the farebox.
LikeLike
With all of those return to office mandate revolutions from companies, employers, and big banks across Toronto, do you believe that would help push up TTC’s ridership numbers closer to pre pandemic levels?
Steve: It will help, but without an increase in service in some areas, the TTC will hardly be encouraging a return to transit.
LikeLike
The 121 should be extended to Broadview station (+1 bus) when additional bus platform space becomes available. Regent Park needs a direct connection to line 2 and it would supplement the erratic streetcar service between Broadview and Chinatown.
LikeLike
I admit to not scouring *every* chart (maybe even fewer than that) but could what you say about “former service levels” be boiled down to ‘the commission is spending as much as it was before but much less efficiently’?
Steve: It’s a tad more complex because inflation makes the cost of service, however you measure it, higher than in 2019. However, the extra cost associated with slower operation and longer recovery times pushes this further because even more hours are needed to achieve the same level of service.
LikeLike