TTC Surface Route Stats 2019-2024

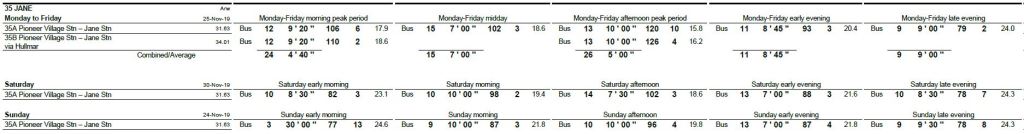
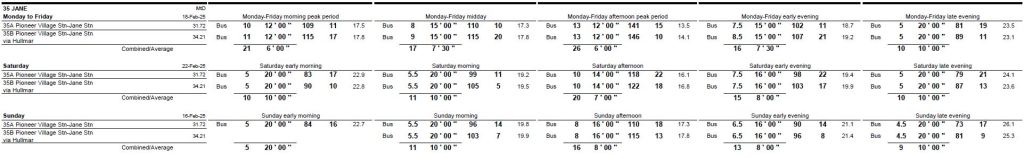
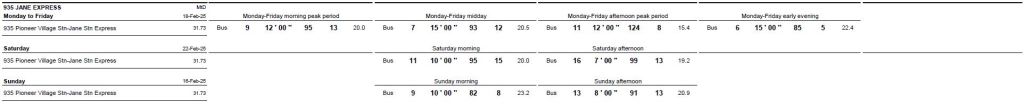
The list of surface route operating statistics for 2024 recently appeared on the TTC’s Planning webpage. This article consolidates data for the years 2019 (the last pre-pandemic year) to 2024.

Values included in the TTC files are:

  • Weekday passenger count
  • Weekday vehicle hours
  • Weekday vehicle klometres
  • AM peak vehicles
  • PM peak vehicles

Derived values included in this article:

  • Passengers (boardings) per vehicle hour
  • Vehicle kilometres per hour
  • Recovery rates relative to 2019

Pages for each set of stats are included in the detailed part of the article, and a PDF containing all tables is linked at the end.

In a future article, I will refresh a previously published table comparing service levels on routes in September 2025, when this information is available, with prepandemic conditions.

A basic message of both articles is that the TTC trumpets a return to former service levels, but the metric they use, vehicle hours, misrepresents the level of service provided. Buses and streetcars travel more slowly now than they did in 2019, and they have more generous recovery times at terminals. These combine to make a vehicle hour less productive in the amount of service it provides than in past years, and so 100% of former hours does not produce the same service. That is separate from other factors such as a decline in reliability, bunching and gaps which compound the less frequent scheduled service.

The problem is particularly bad on streetcar routes where a combination of factors including understaffing, budget constraints, and operating practices that slow service, lead to considerably less “recovery” to former service levels. In turn, this hurts service quality and blunts ridership recovery.

Crowding conditions are not addressed by these stats, and this is difficult to extract from TTC tracking data due to the coarse-grained nature of reported loads. TTC does not publish numeric vehicle loads, only broad light-medium-heavy loading indications. Although they report all-day ridership on each route, this is not broken down by time of day, location and direction, at least not for external consumption. TTC has crowding standards, but we do not know how well they meet them.

The number of peak vehicles is lower in 2024 than in 2019. This partly reflects limits on service growth, and partly the shift of demand into off-peak periods.

In the attempt to woo riders back onto the TTC, let alone to boost transit’s mode share for travel in line with City goals, the question of service level and quality is key. In theory, if demand actually sits below the historic level, then less service is needed to handle it. However, those who remember the condition of transit before 2020 will know that crowding was a pervasive problem and calls for better service were common. Only the March 2020 drop in demand saved the TTC from a capacity crisis.

Toronto must understand and commit the resources needed to achieve its transit goals. Just getting back to 2019 is no goal to aim at.

Continue reading

35/935 Jane: Service Levels and Travel Times 2019-2025

This article is an update from a previous review of travel times on the Jane corridor which is currently under study in the RapidTO program. Red lanes are proposed between Eglinton and Steeles both ways. The southern limit is defined both by the change in roadway cross section in the older part of the city, and by the future split in bus service at Eglinton to feed into Line 5 Crosstown.

Scheduled Service and Ridership

A common claim by the TTC and City is that service on the bus network is restored to or better than pre-pandemic levels. This is not true.

The measurement used is bus hours, but actual frequency of service is the metric riders experience. Total bus hours might be “back to normal”, but these are distributed differently now than in 2019 with some of the restoration going to longer travel and recovery times. These might contribute to service reliability, but with lower scheduled capacity (buses/hour).

Service in November 2019 compared to February 2025 (the schedule in effect in August 2025) was generally better than it is today.

Buses / Hour
L Local
X Express
2019.11
M-F
2025.08
M-F
2019.11
Sat
2025.08
Sat
2019.11
Sun
2025.08
Sun
AM Pk M-F12.9L 8.0X10.0L 5.0X
Midday MF8.6L 6.3X8.0L 4.0X
PM Pk M-F12.0L 6.2X10.0L 5.0X
Early AM
S-S
7.1L 6.0X6.0L2.0L3.0L
Late AM
S-S
6.0L 6.7X6.0L 6.0X6.0L 6.7X6.0L 6.0X
Afternoon
S-S
8.0L 6.7X8.6L 8.6X6.0L 7.1X7.5L 7.5X
Early Eve6.9L 6.7X8.0L 4.0X8.6L 6.7X7.5L8.6L7.5L
Late Eve6.7L6.0L7.1L6.0L6.3L6.0L

The tables below are taken from the November 2019 and July 2025 TTC Scheduled Service Summaries show the corresponding service designs. Within each group, the fields are:

  • Number of assigned vehicles
  • Frequency of service
  • Travel time
  • Terminal recovery time
  • Scheduled speed (km/h)

Changes in service levels are affected by scheduled speed, frequency and recovery time. Note that recovery times in 2025 are more generous than in 2019, and travel times have also increased with a corresponding drop in scheduled speeds. In some cases, the number of buses (and hence bus hours) goes up, but the level of service goes down because of slower operation.

RapidTO plans for Jane seek to shorten travel times between Steeles and Eglinton, but the benefit varies. Terminal departures are irregular, although much of that variation is permitted under the Service Standards. RapdTO’s supposed contribution to regularity is that buses will be able to stay more or less “on time”, but unless departures at terminals are better managed, service will still begin trips irregularly. On the current 6′ peak headway, the standards allow a 50% fluctuation from 3-to-9 minutes, and this can make a huge difference in wait times and vehicle crowding.

All-day ridership reported in past years is summarized below. As of Fall 2024, ridership was still well below the 2019 level.

All-day Riders201920202021202220232024
35 Jane31,08526,08220,33424,84028,80825,820
935 Jane Express13,7497,96510,64510,03411,644
Total44,83426,08228,29935,48538,84237,464
Source: TTC Planning Web Page

We do not know how much ridership growth might be constrained by service capacity and reliability, as opposed to changes in actual demand. The TTC projects large growth from improvements in travel time and reliability with RapidTO, but with no commitment to increased capacity. This claim is difficult to believe.

I asked the TTC for the methodology behind its calculation of RapidTO ridership growth on July 28, but have received no details as of August 11. (The request was for Dufferin and Bathurst corridors where the TTC makes similarly optimistic projections, but the same issue applies to Jane.)

The remainder of this article updates previously published data about travel times on Jane starting just before the pandemic in November 2019 up to July 2025.

Continue reading