In the first two parts of this series, I reviewed headway and travel time data for the 29/929 Dufferin bus during April 2025.
- Service Analysis of 29/929 Dufferin Part I: Headways in April 2025
- Service Analysis of 29/929 Dufferin Part II: Travel Times in April 2025
This article reviews archival data back to January 2024 to discover how the route’s behaviour has changed in the past 16 months. At the end, there are charts showing travel times over the full route from April 2018 to April 2025 for a long view of their evolution.
The first part of the article looks at headways (the time between vehicles) on both the 29 local and 929 express services at various points along the route. The patterns visible in the earlier articles with ragged headways leaving terminals appear throughout data back to January 2024. A major problem with these routes is that buses do not leave terminals evenly spaced, and this problem grows as they move along the line.
The second part reviews travel times over segments of the route to show areas where these change by time of day, and where they do not. These show that on some segments, travel times are mostly consistent across time periods, whereas others show rises and falls. The segment with particularly wide variations is northbound from Lawrence to Wilson showing the effect of traffic queuing for Yorkdale Mall and for Highway 401.
The original RapidTO proposal for red lanes included the full route, but the current version is only from Eglinton southbound. This will not address congestion issues north of Eglinton, nor will it deal with the operational problem of erratic terminal departures.
Headways
The charts in this section are organized in five groups by time of day:
- 8-9am: AM peak
- 1-2pm: Early afternoon
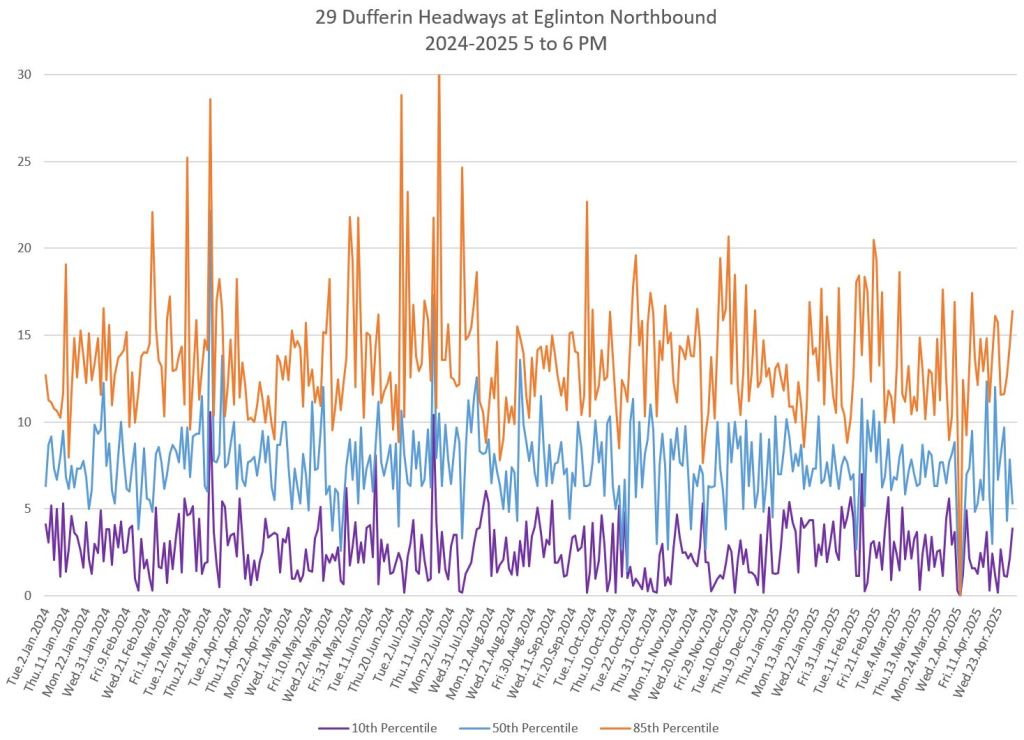
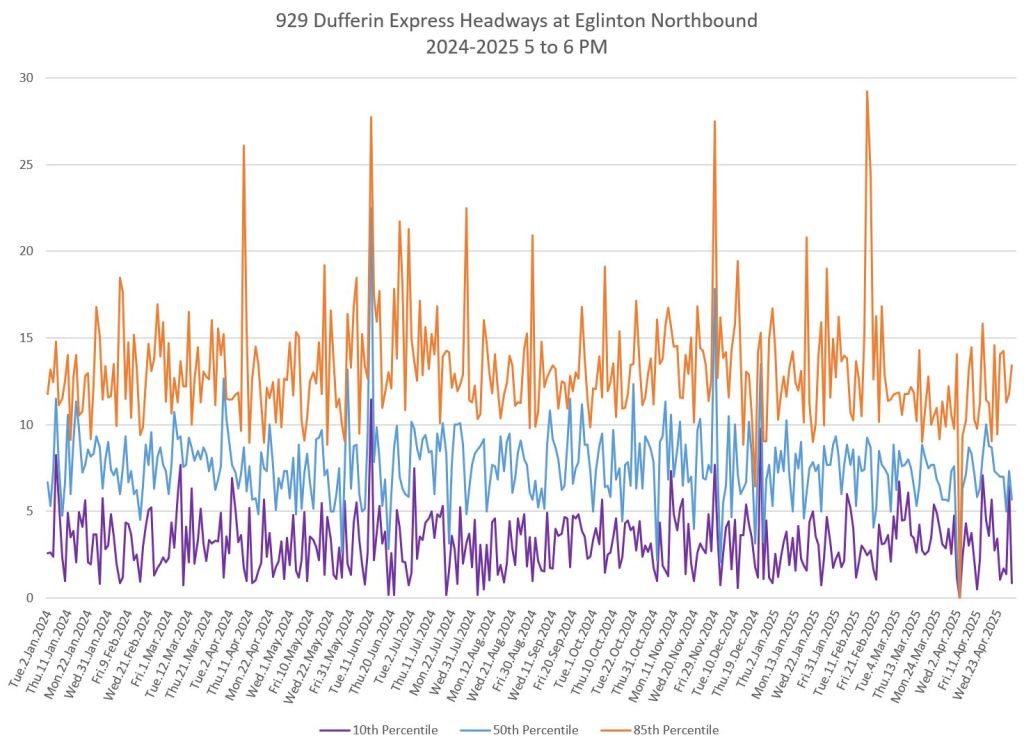
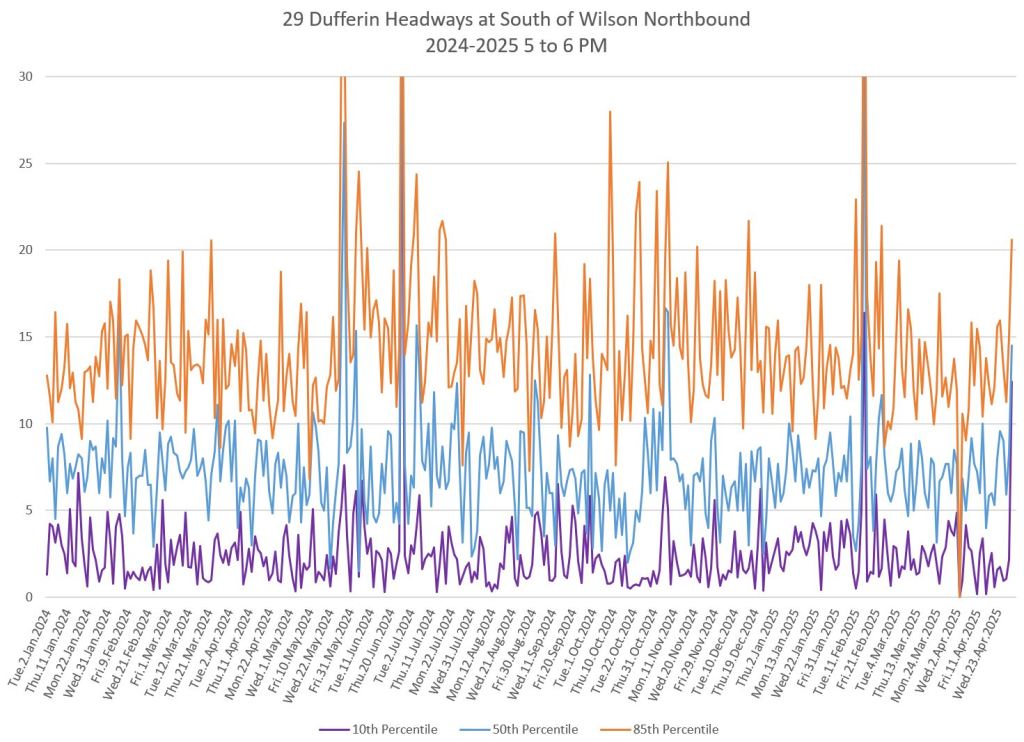
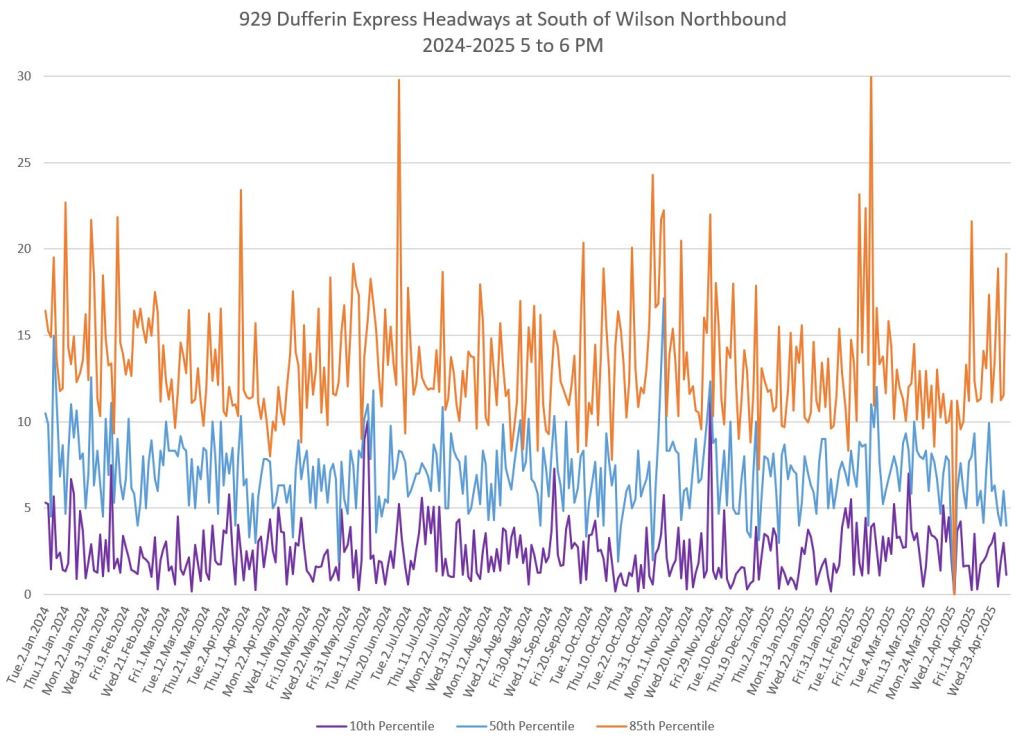
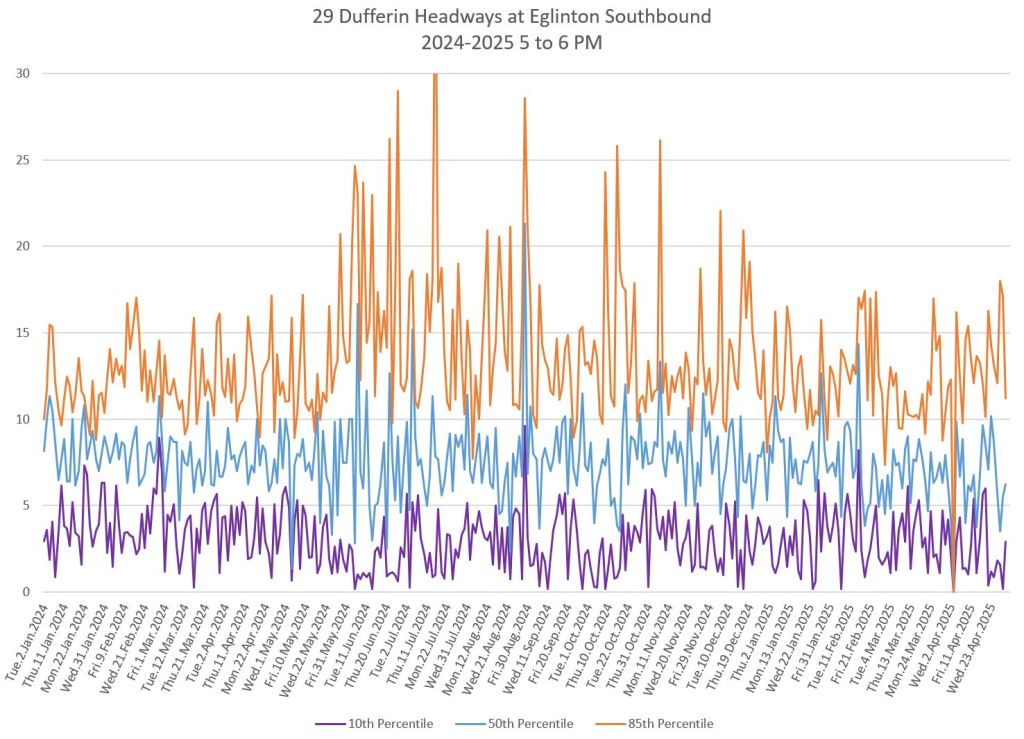
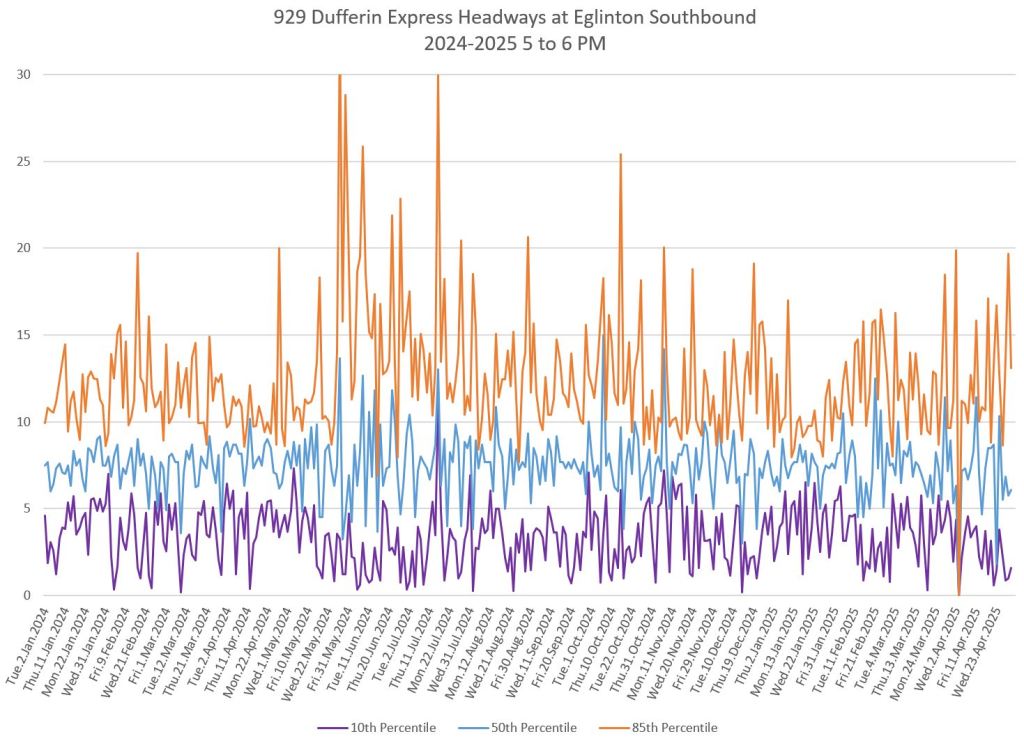
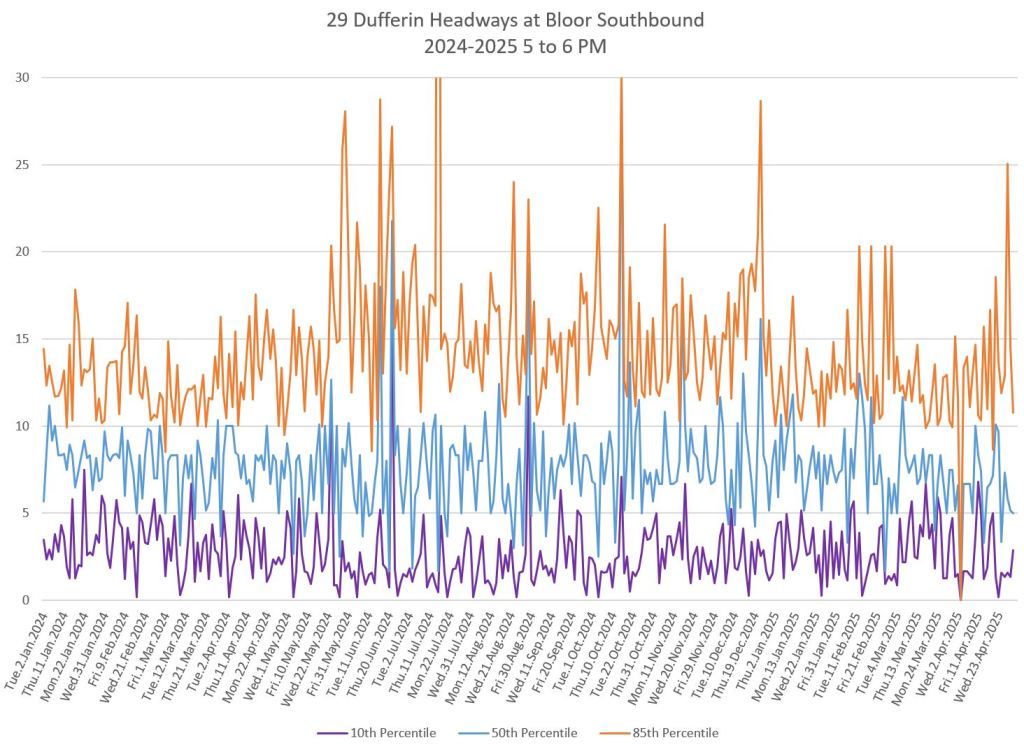
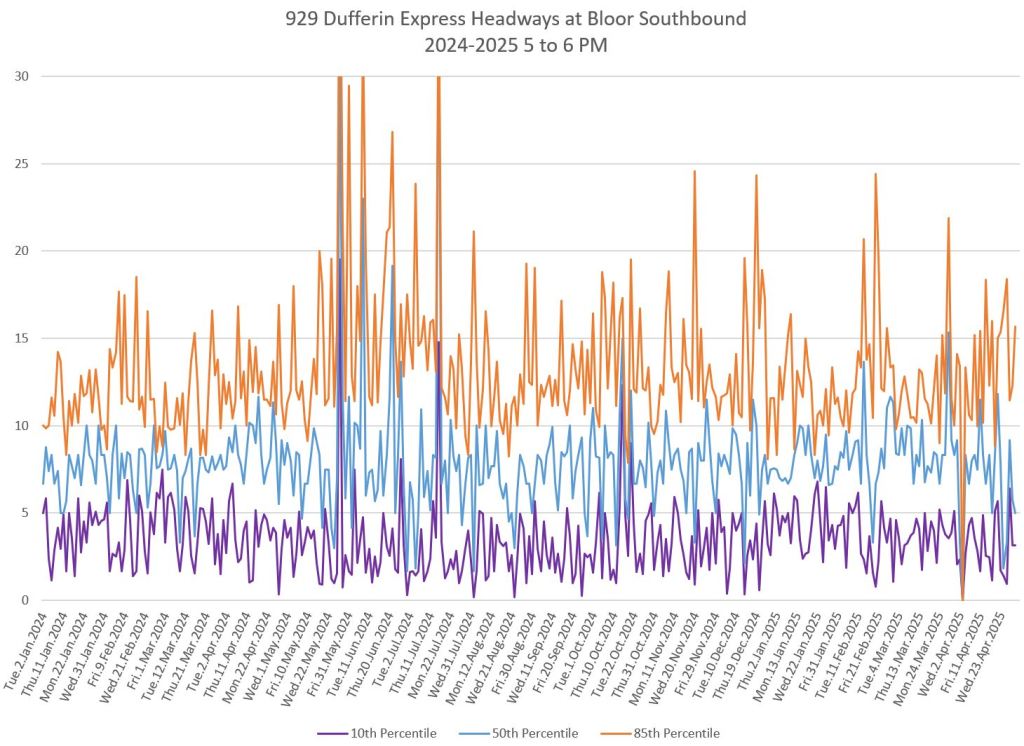
- 5-6pm: PM peak
- 8-9pm: Early evening
- 10-11pm: Late evening
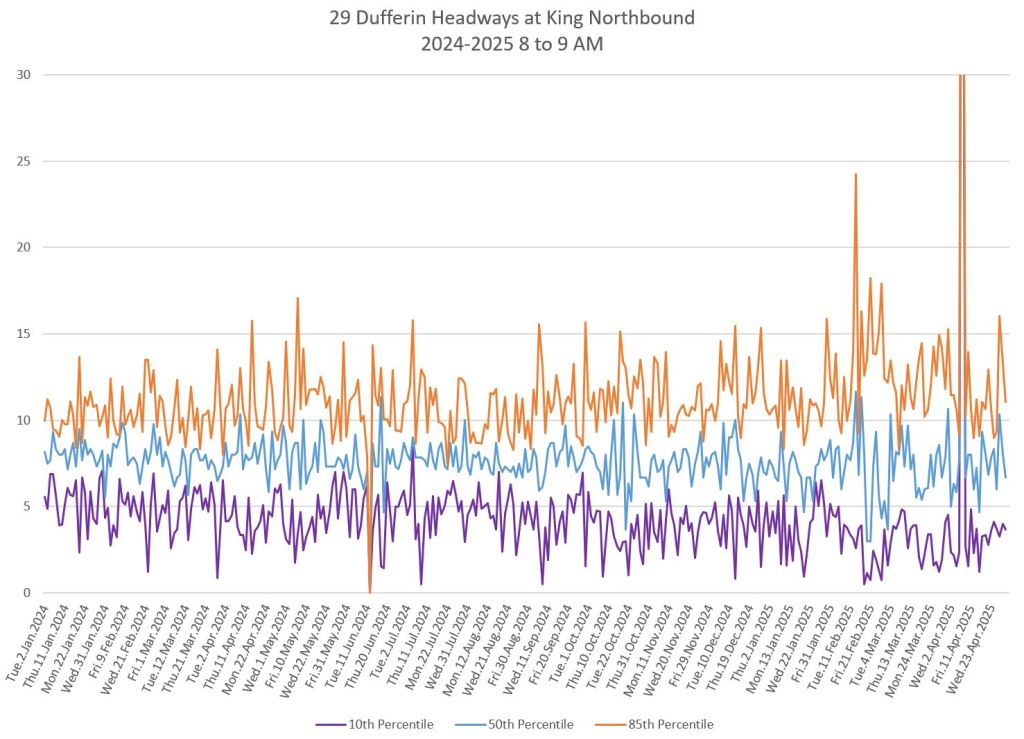
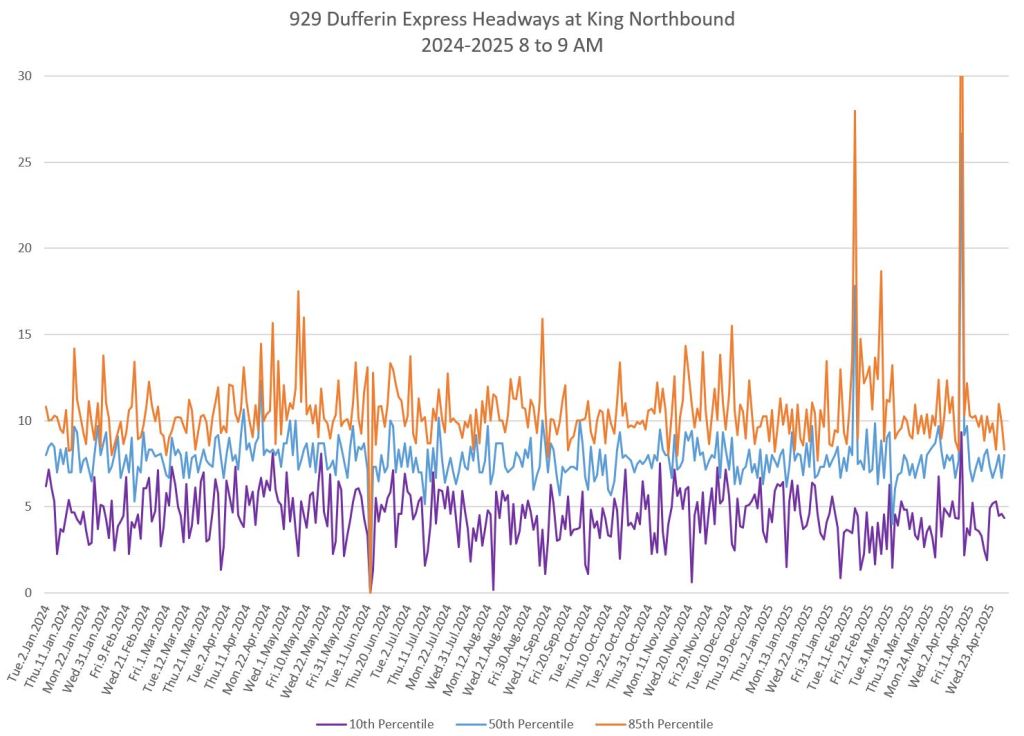
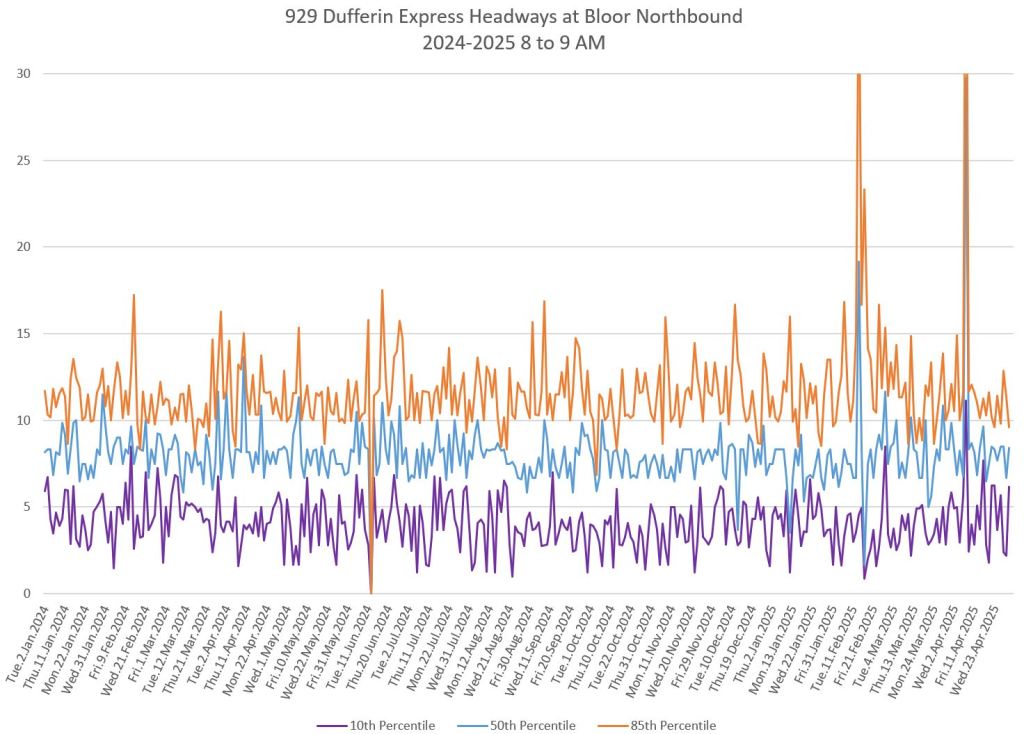
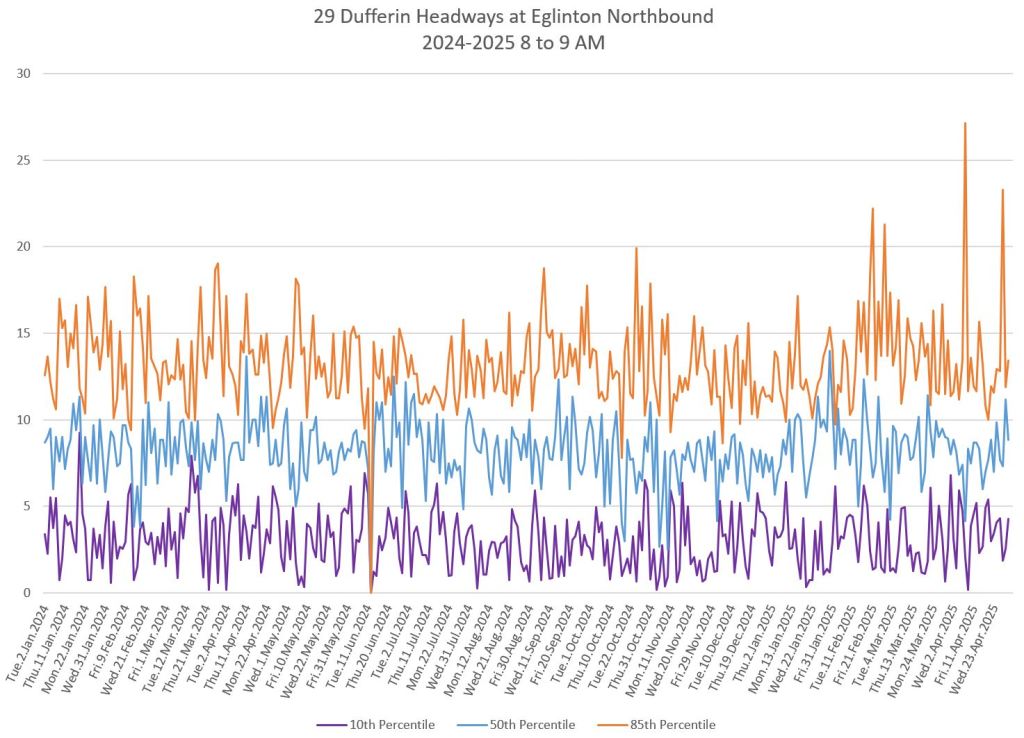
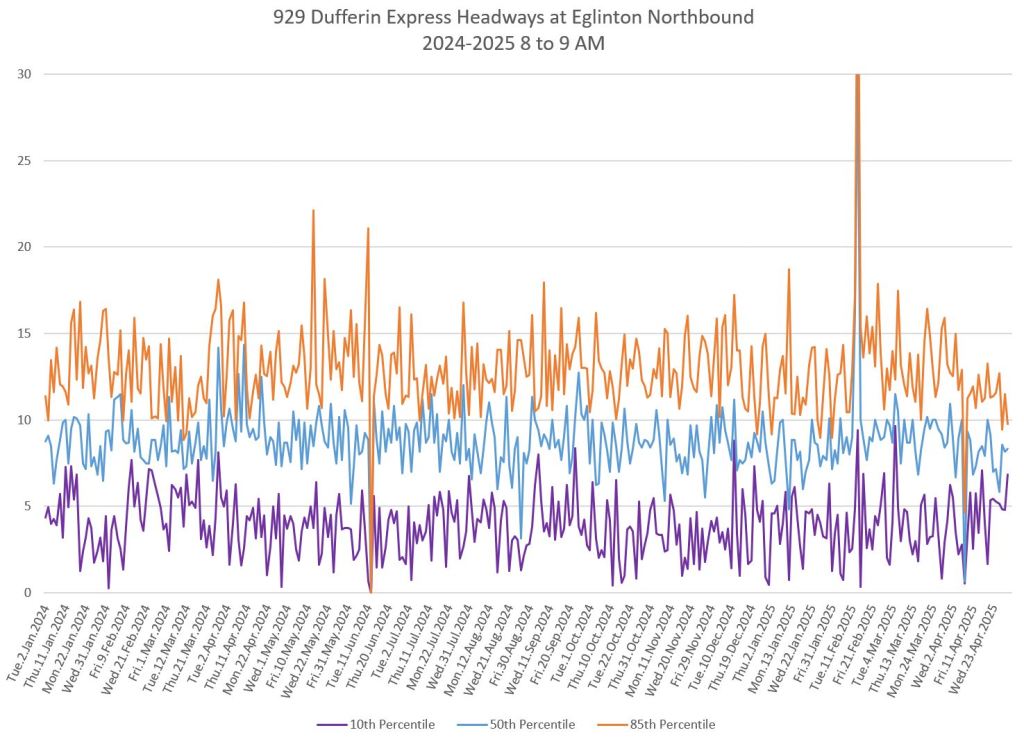
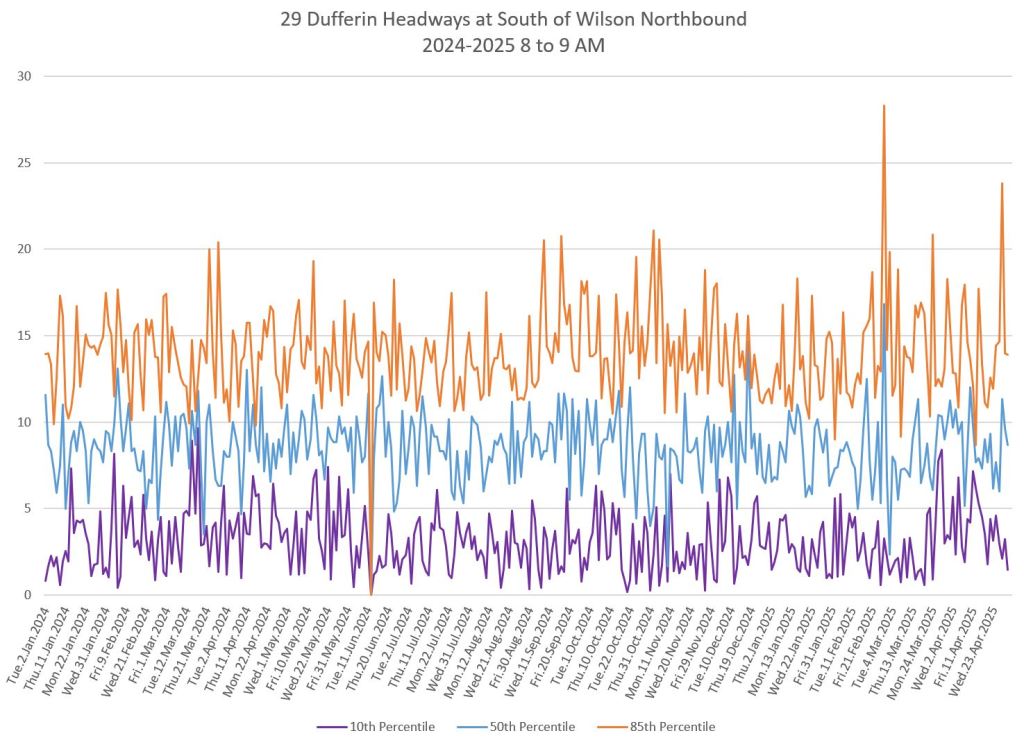
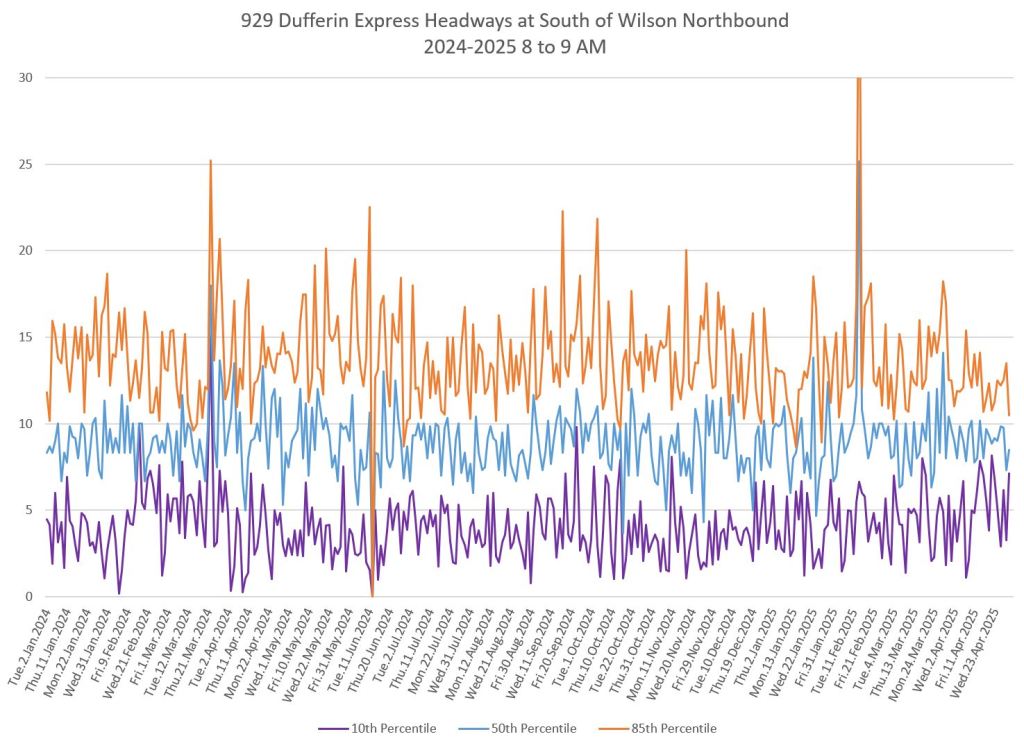
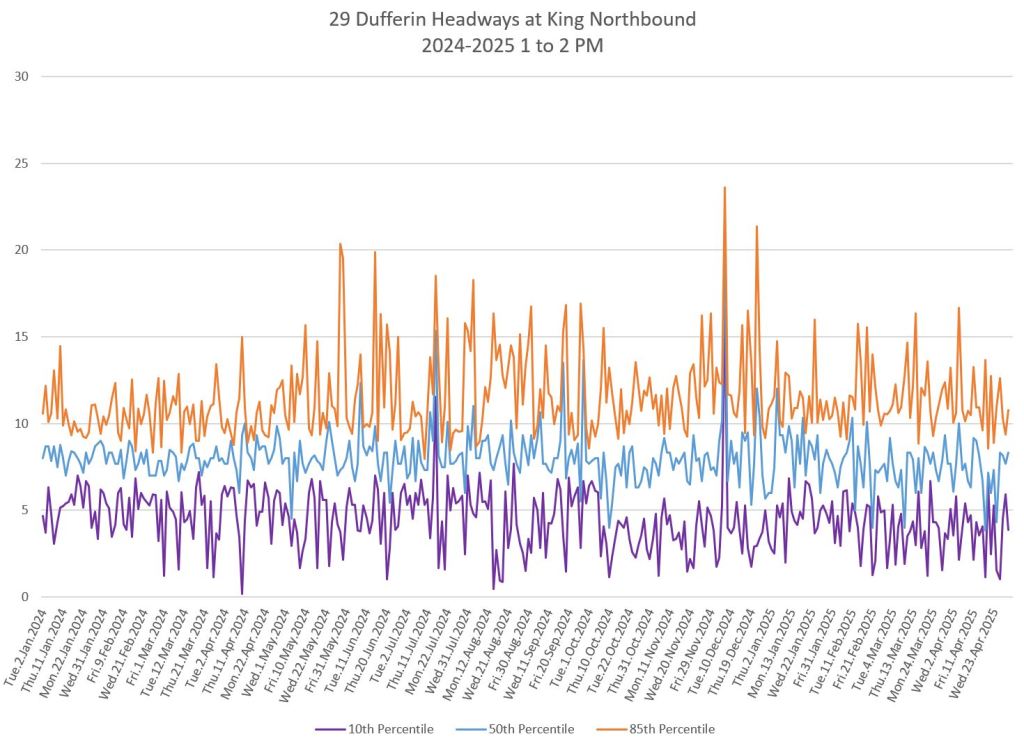
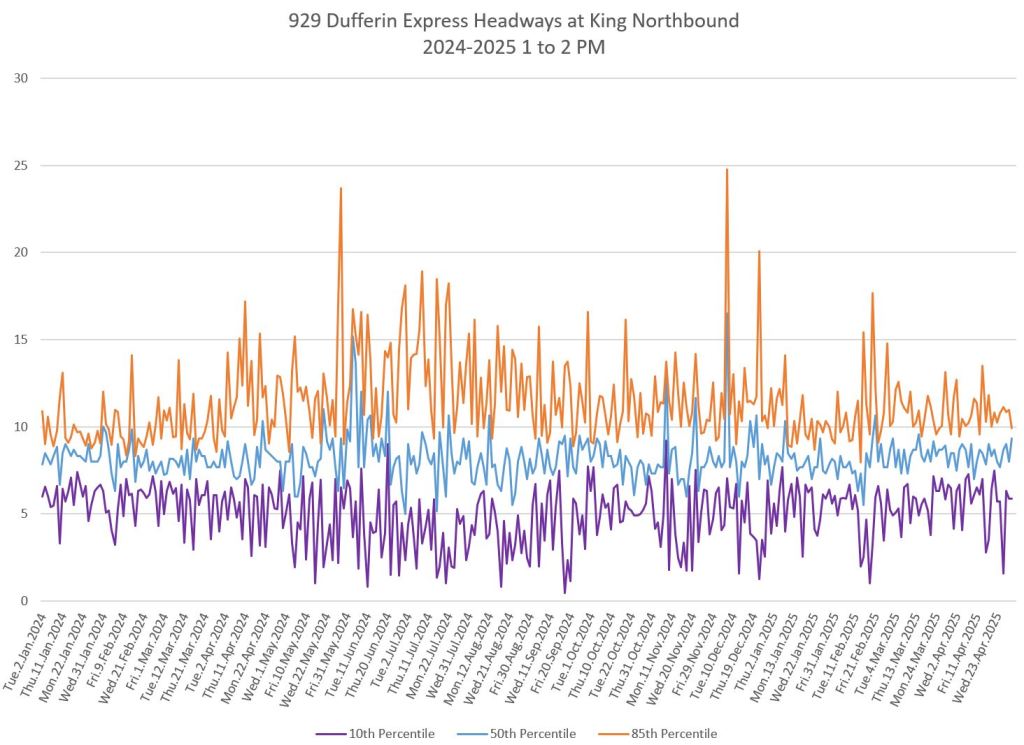
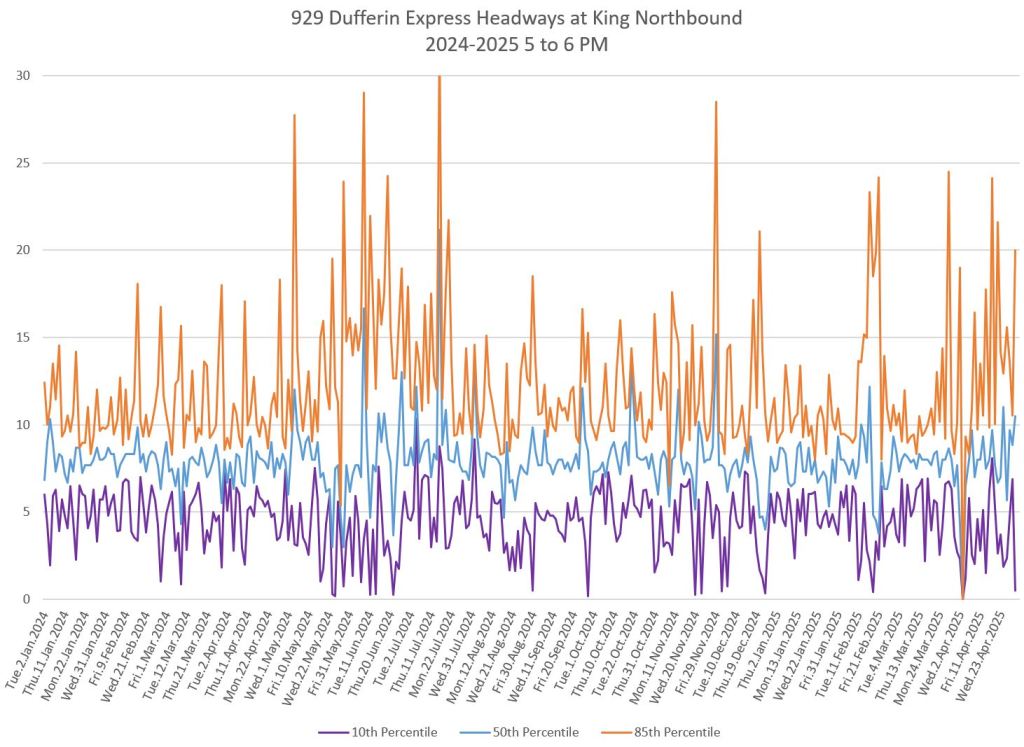
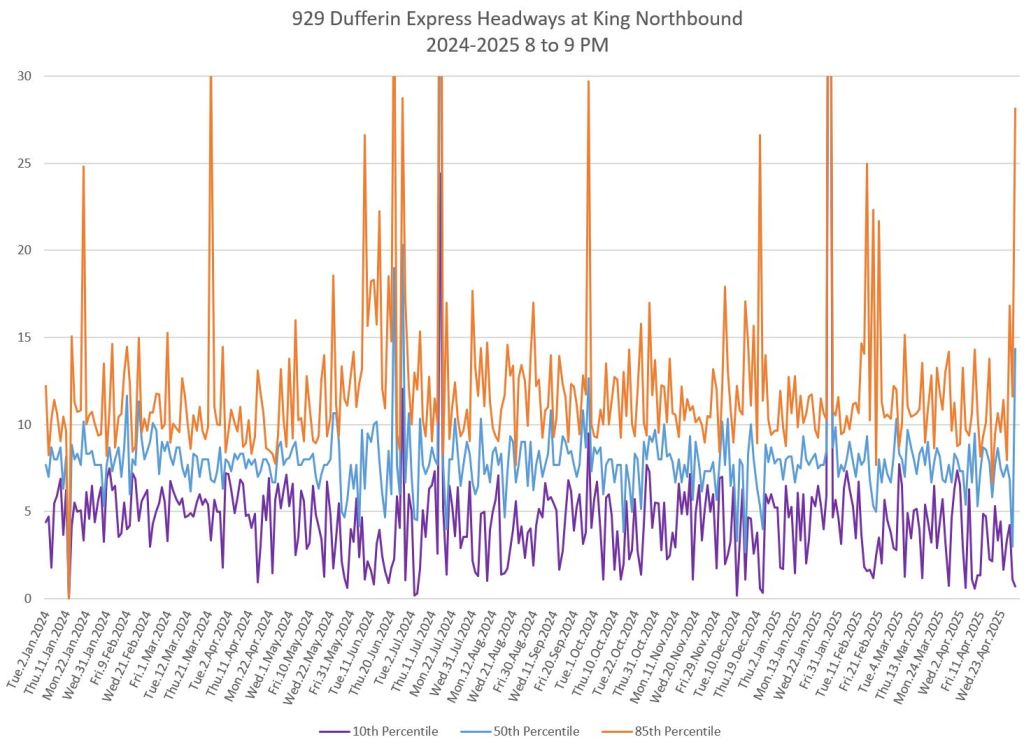
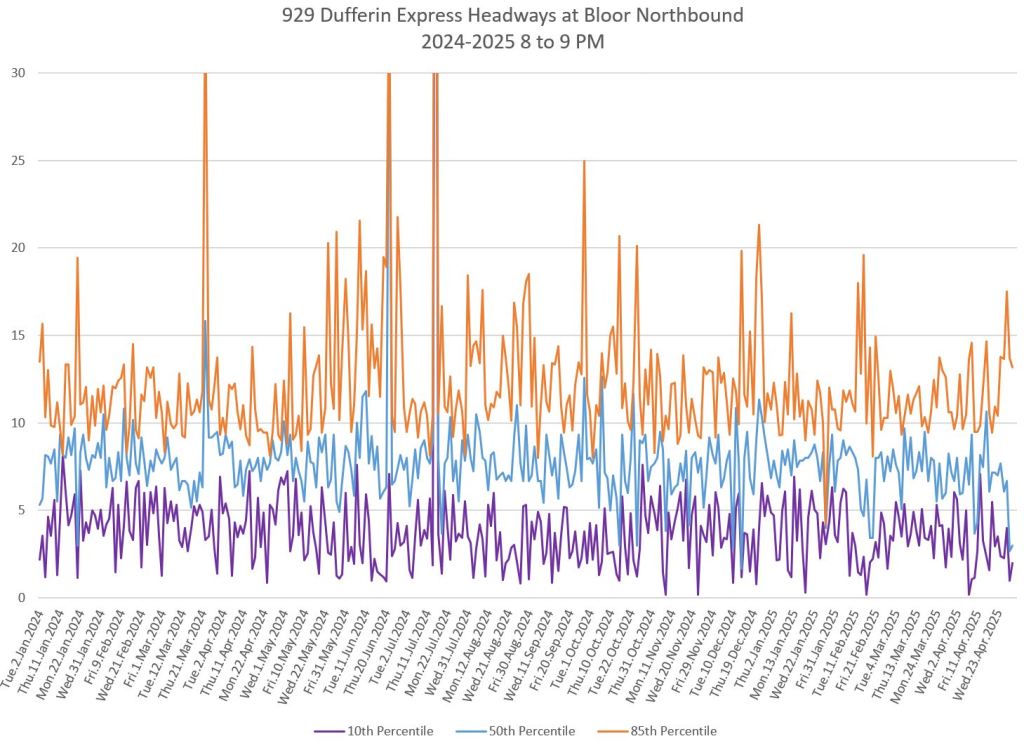
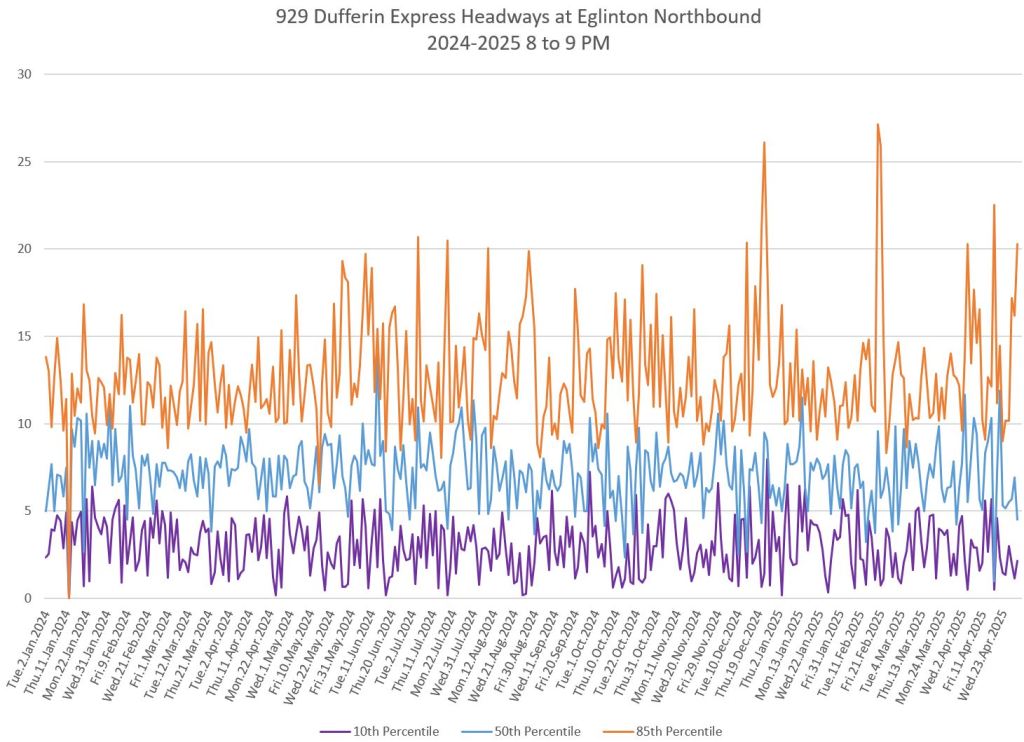
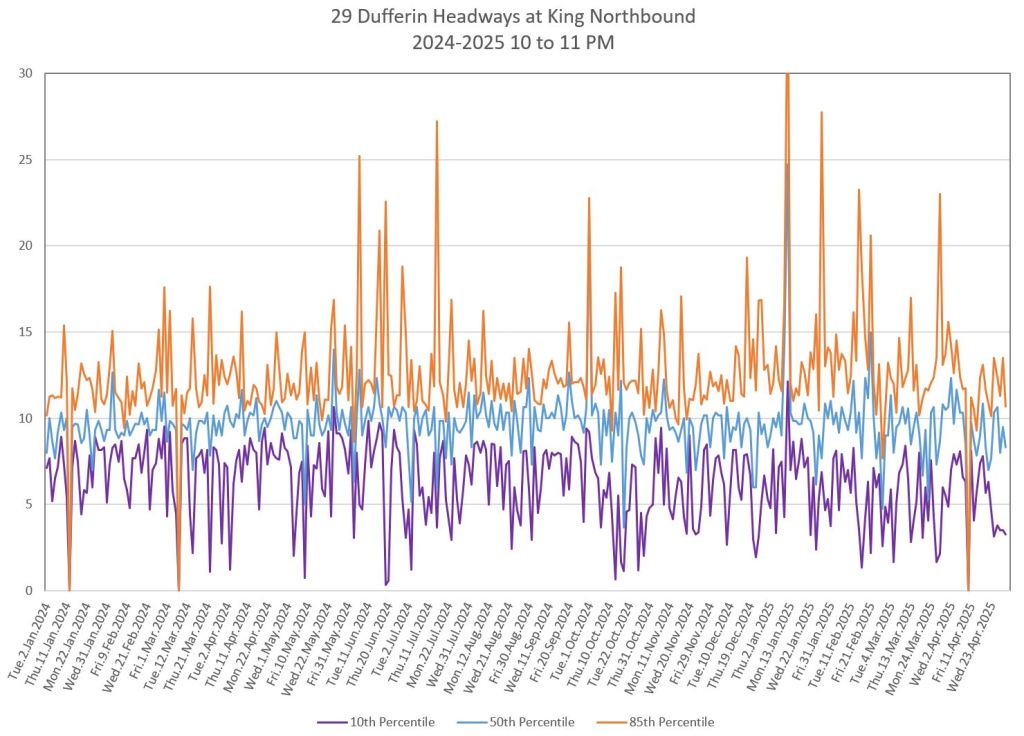
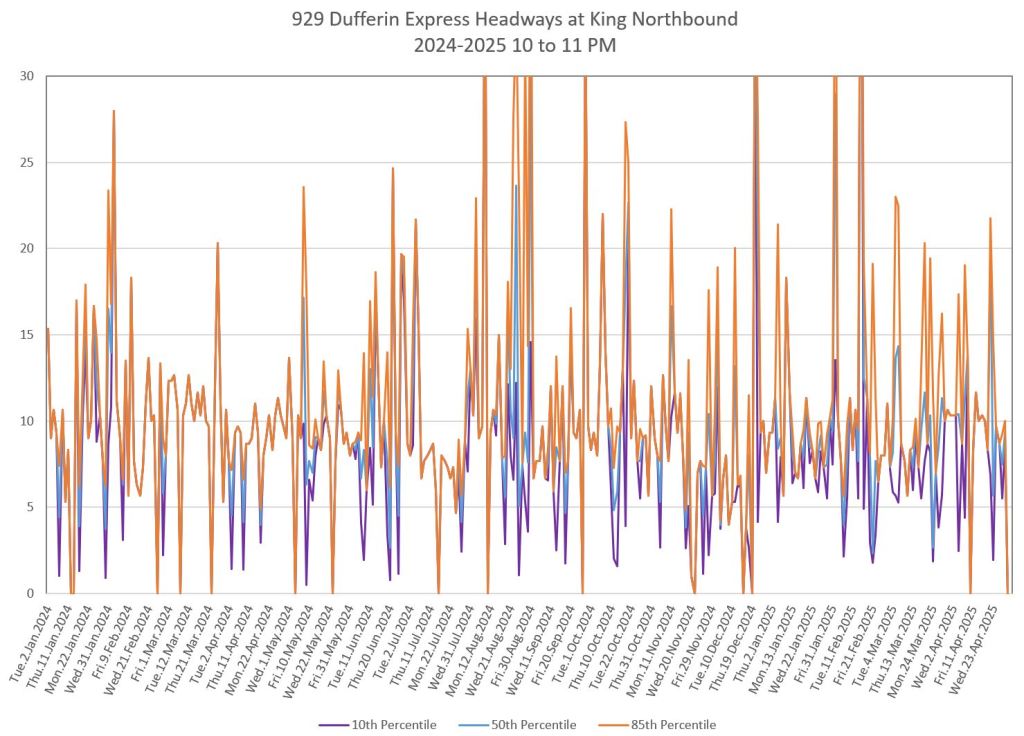
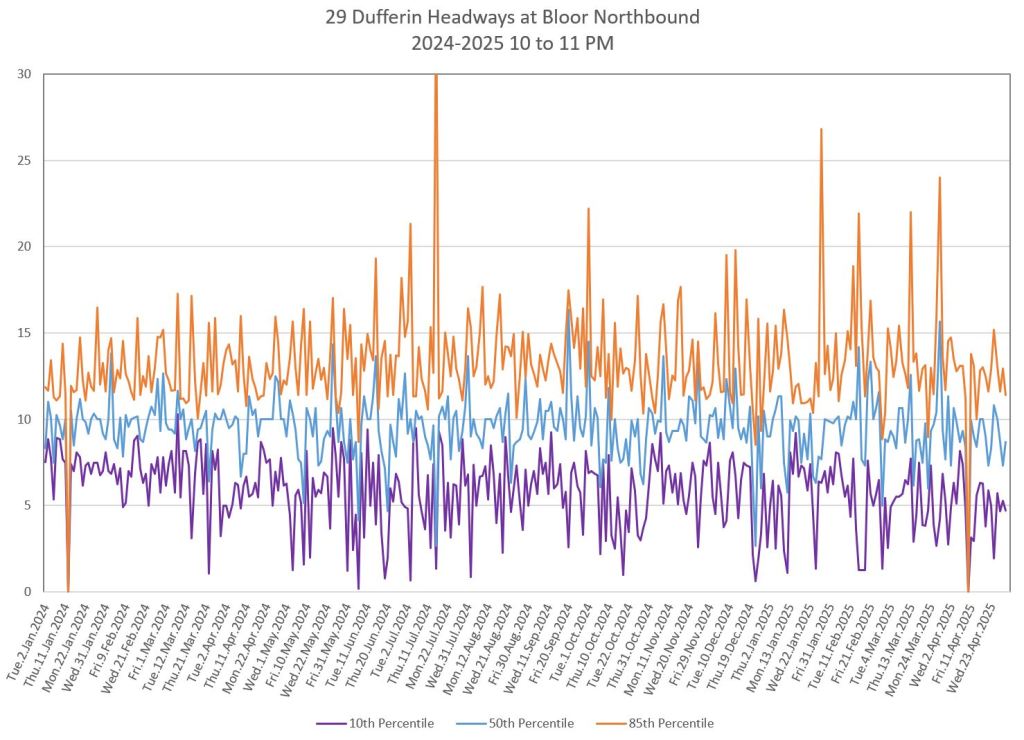
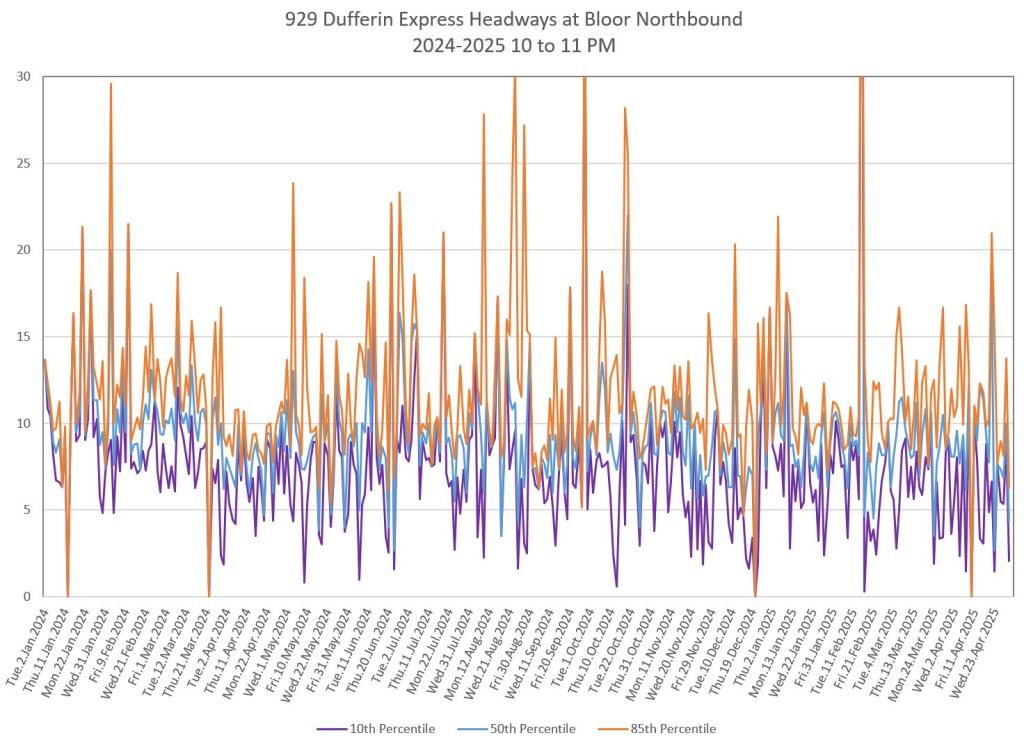
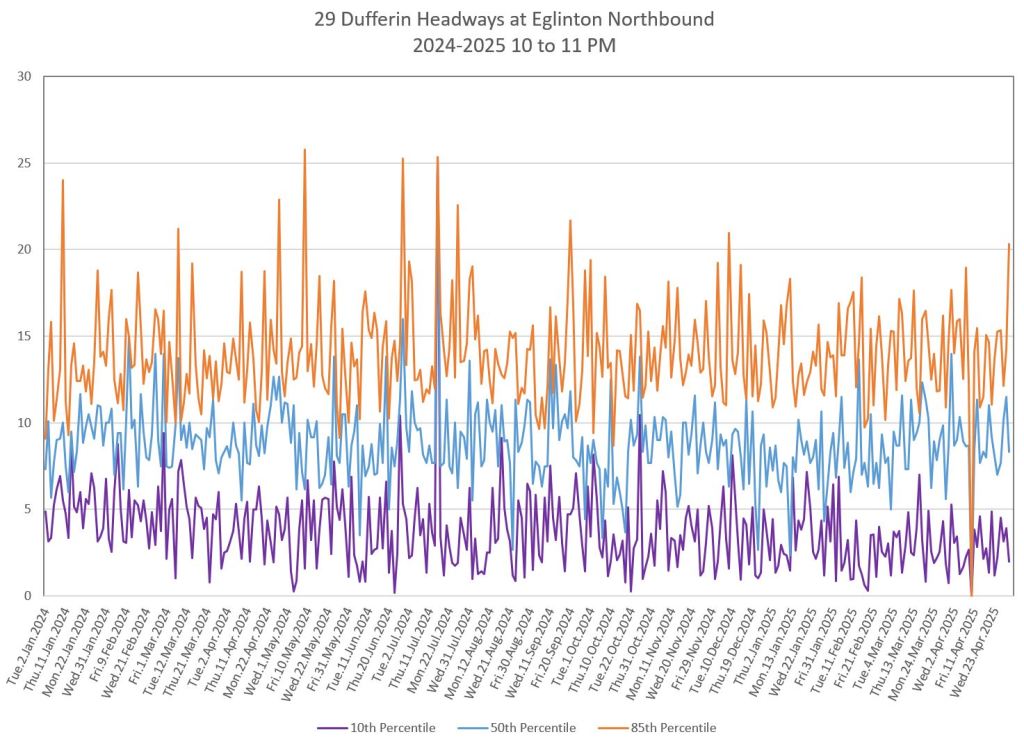
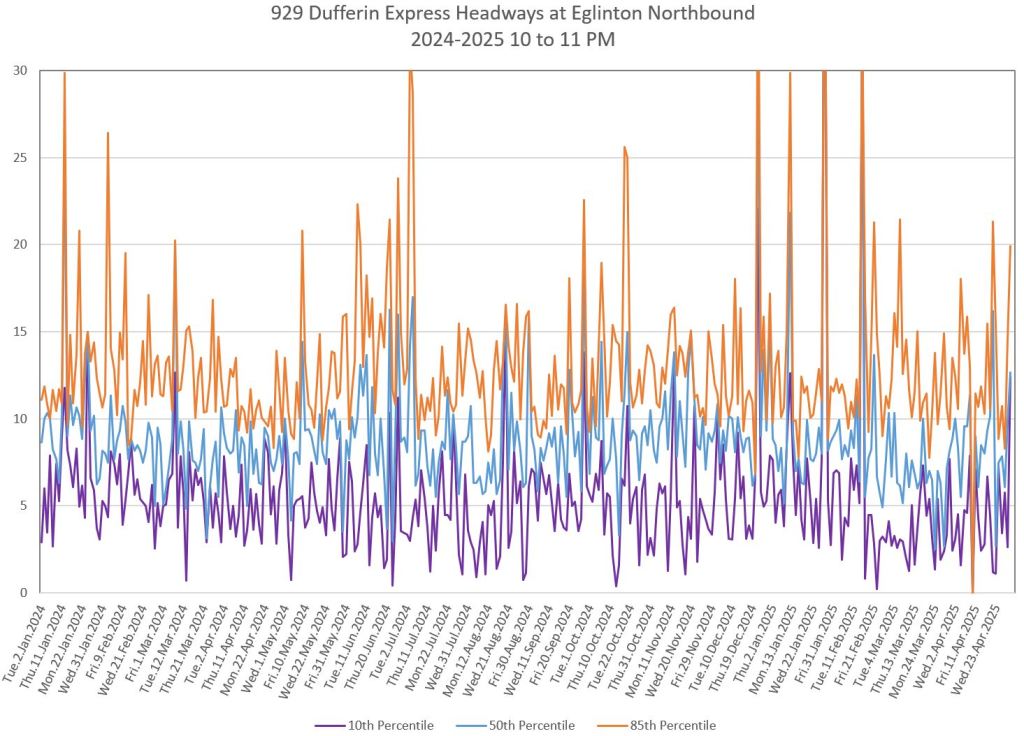
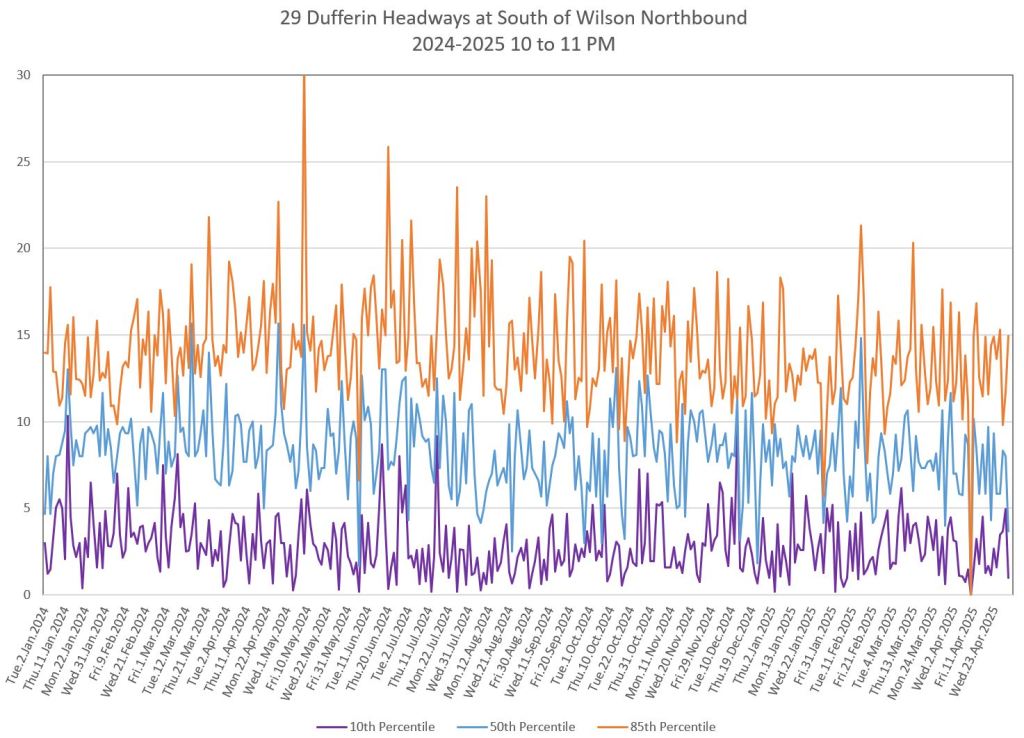
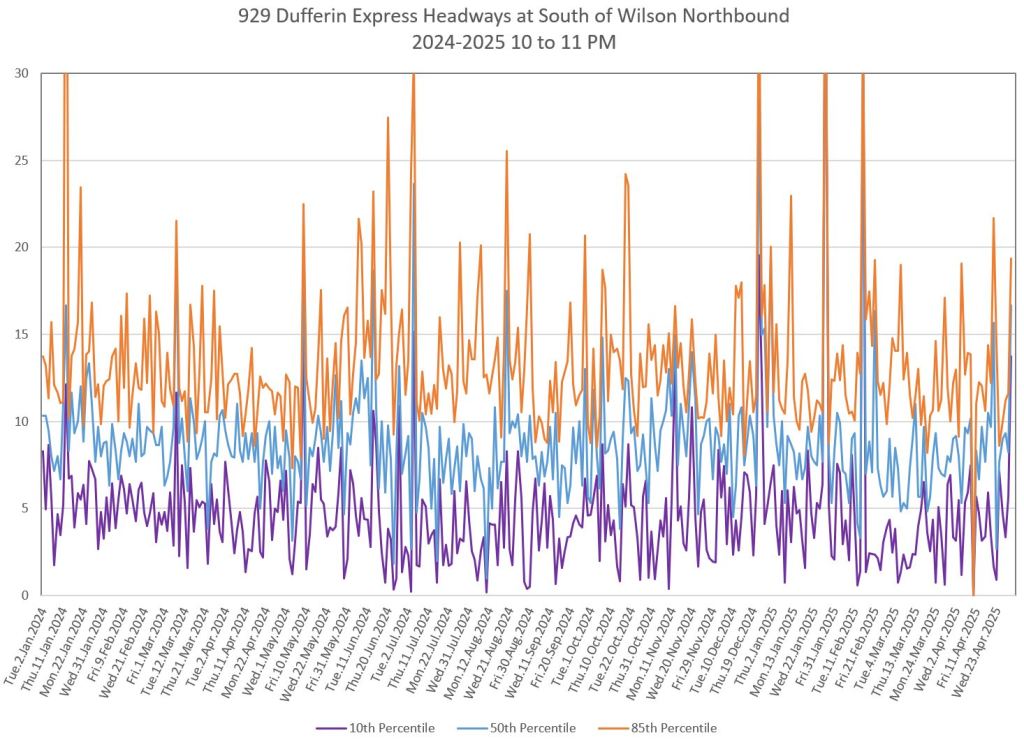
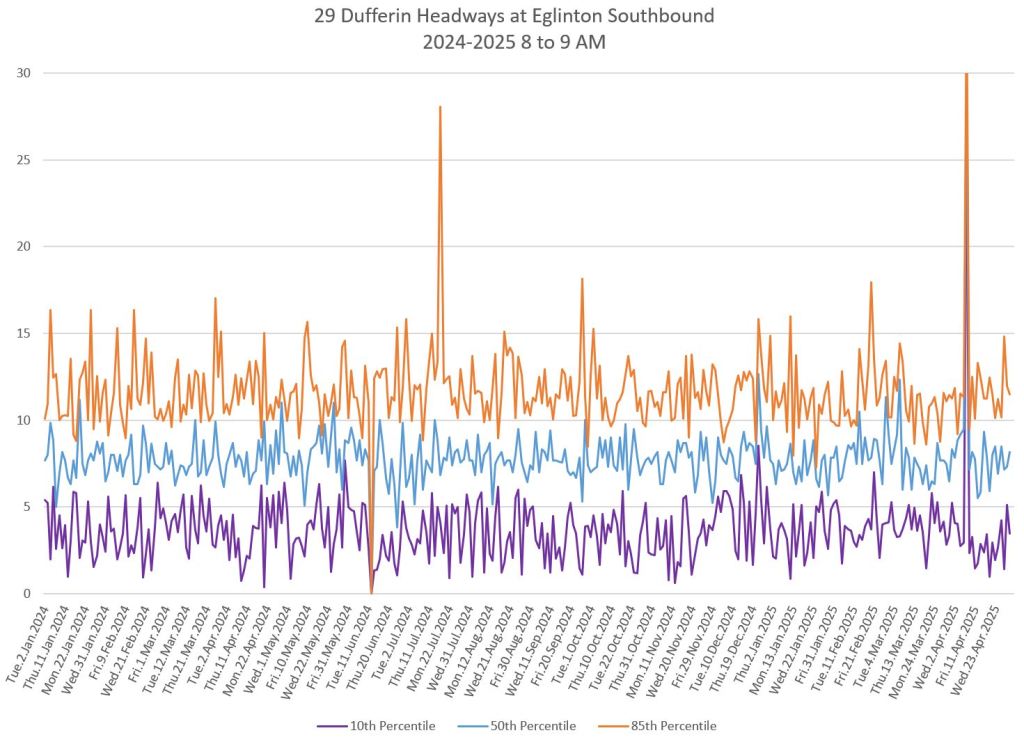
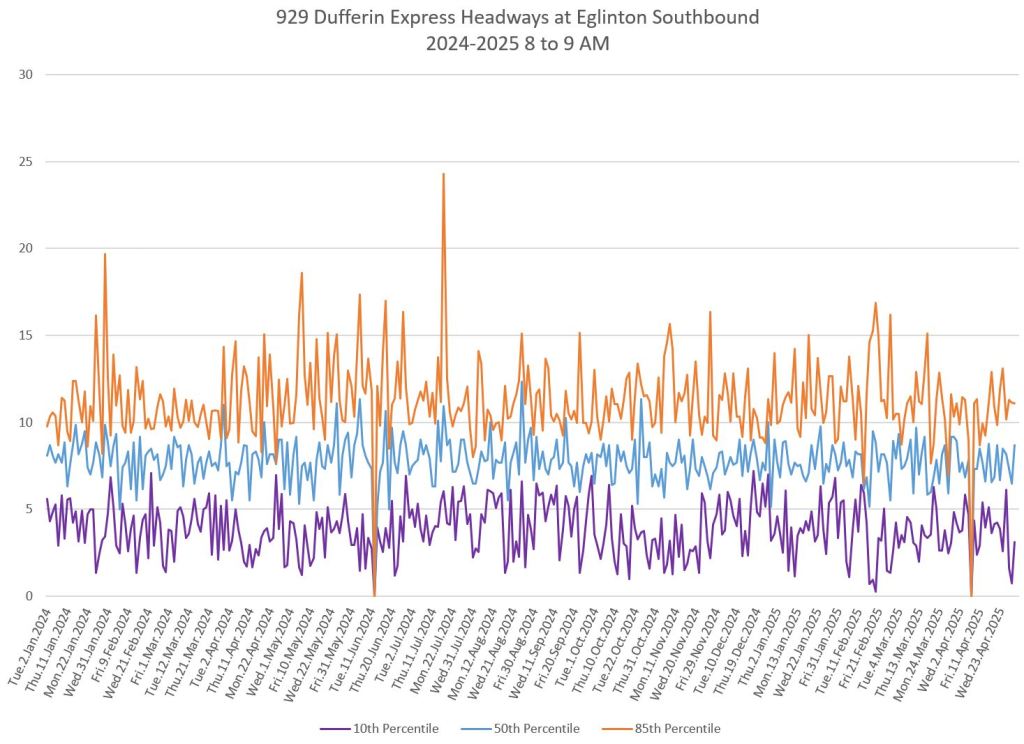
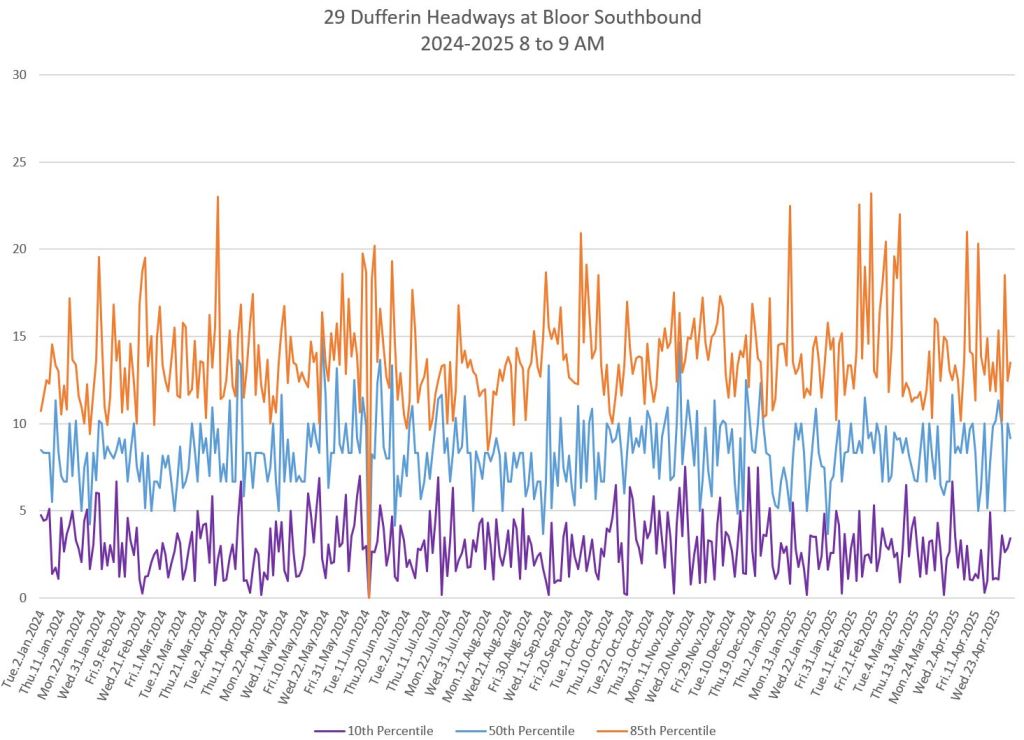
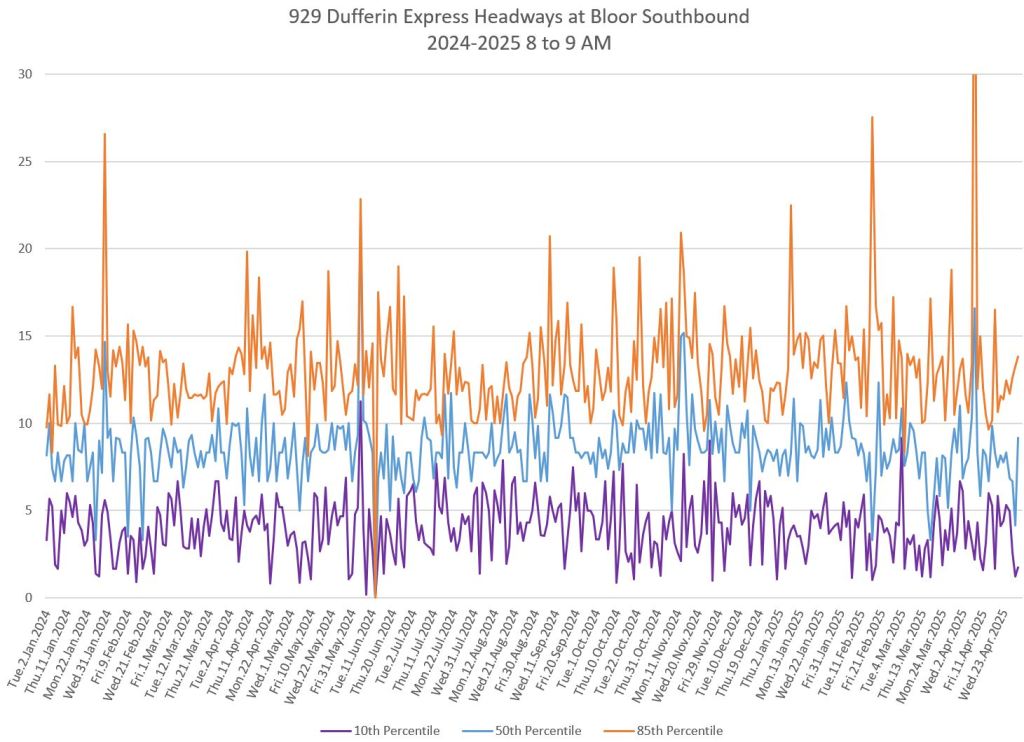
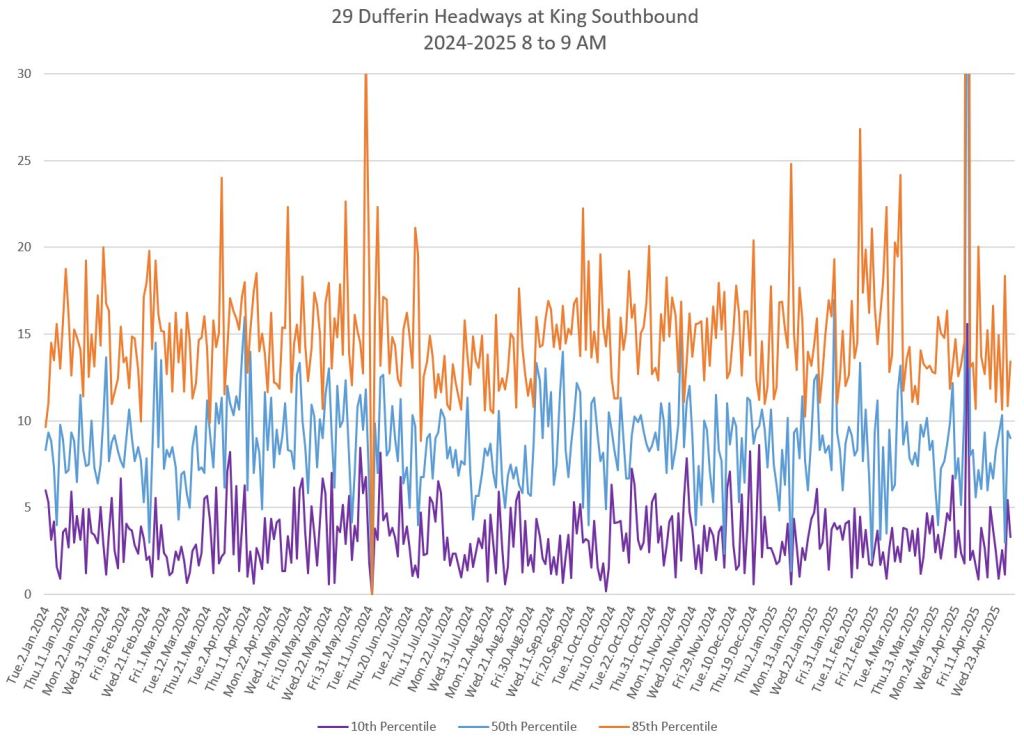
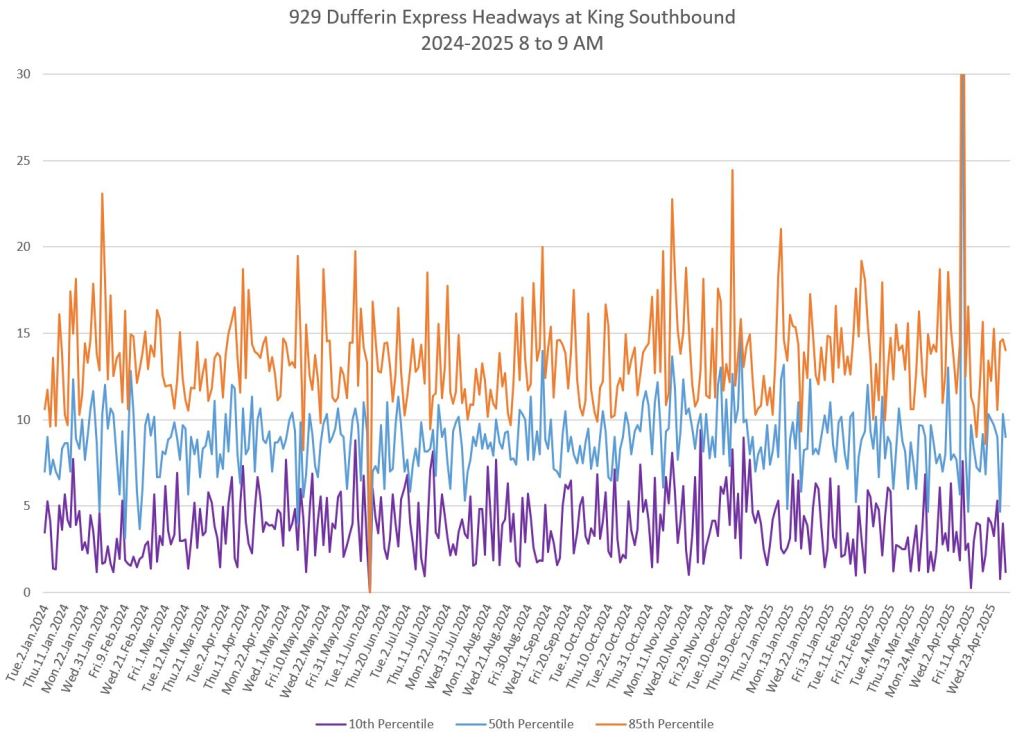
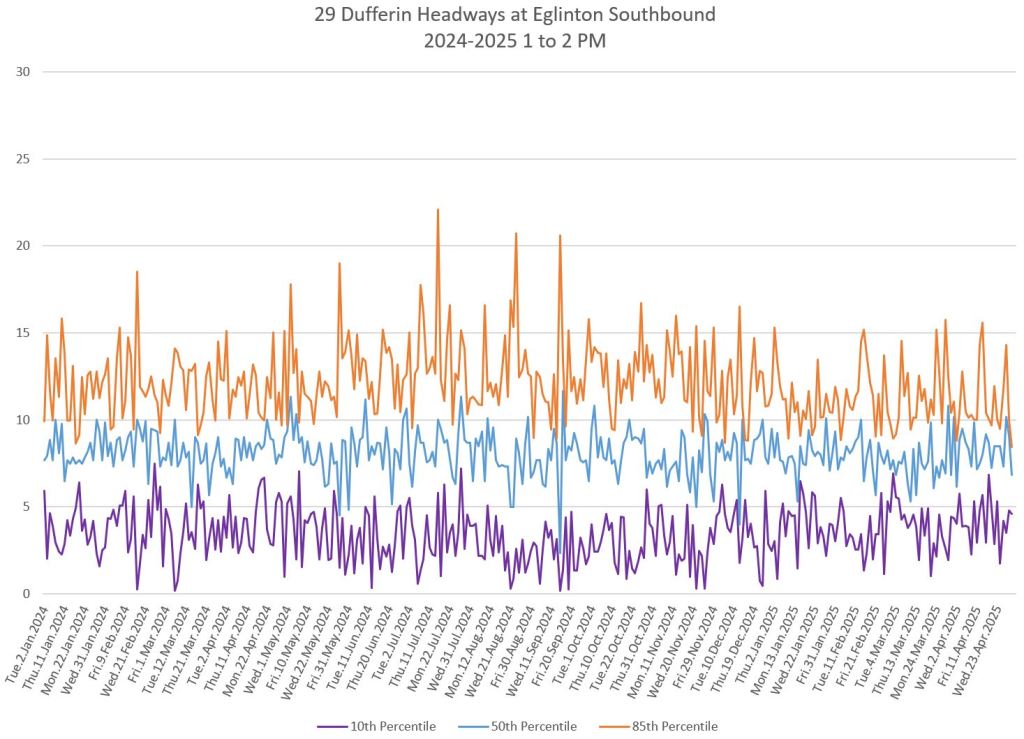
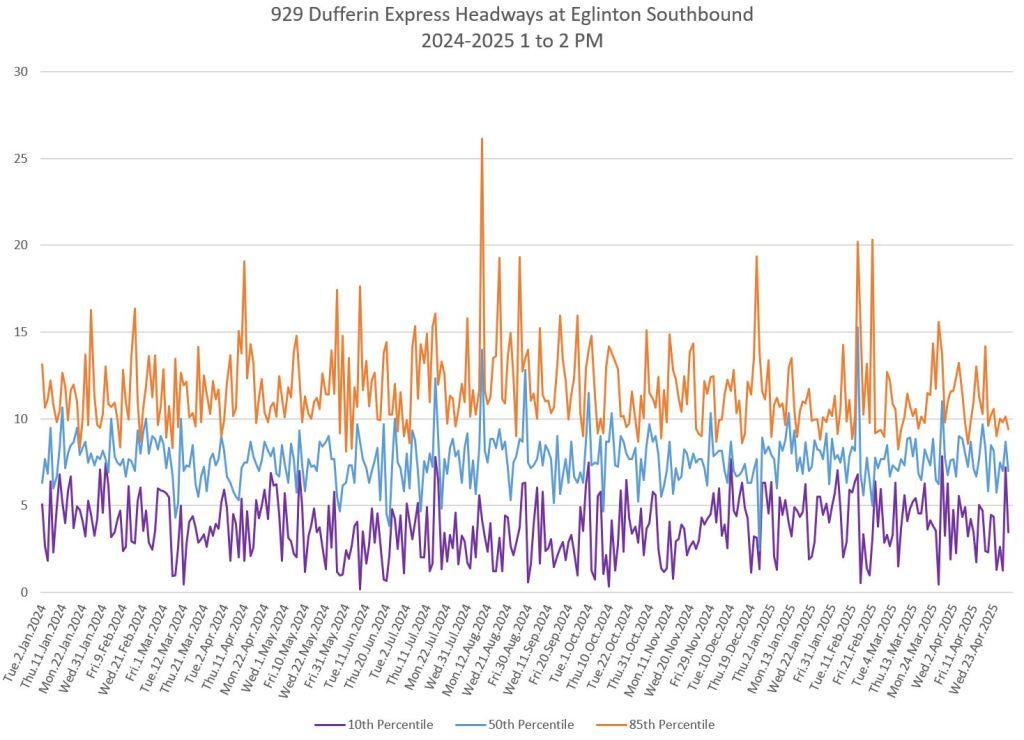
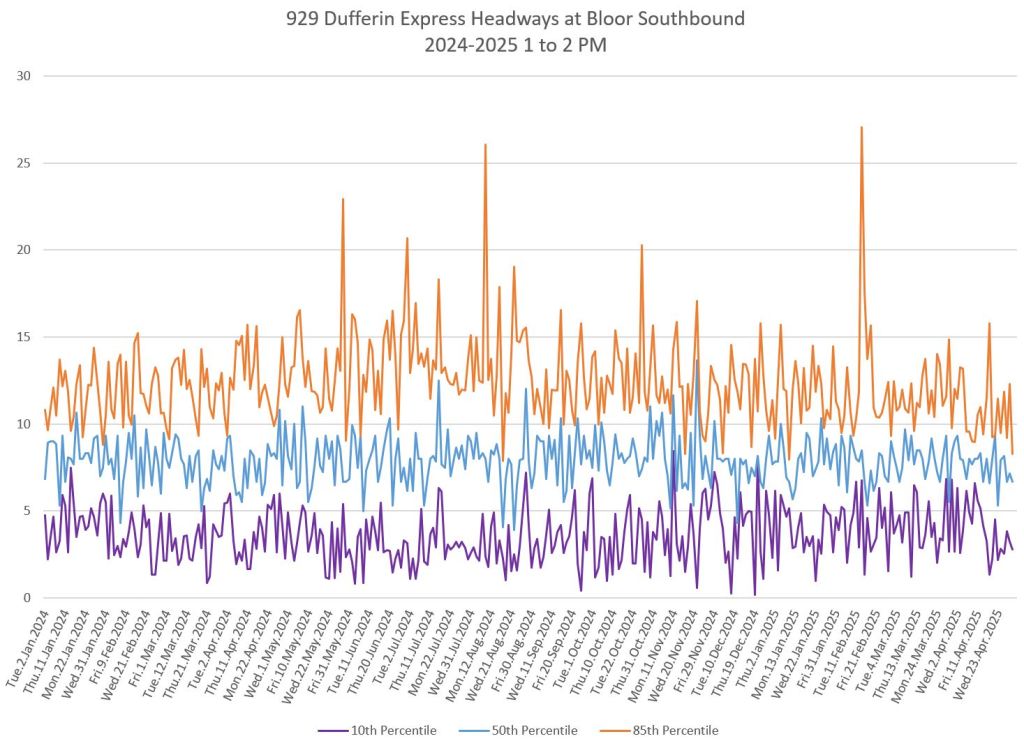
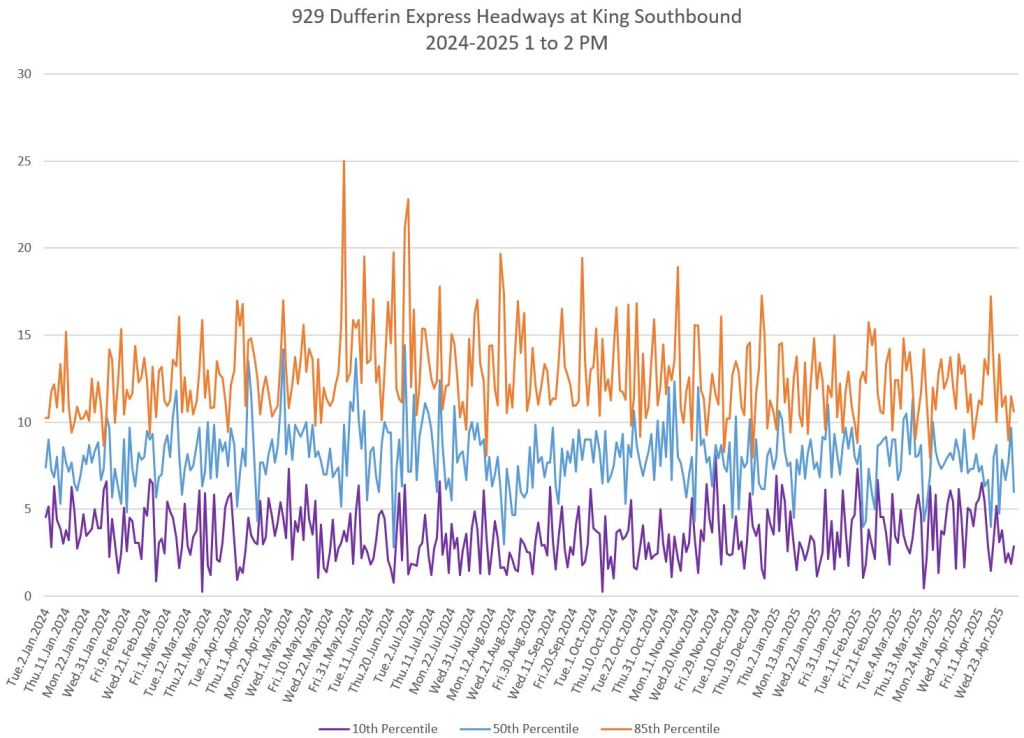
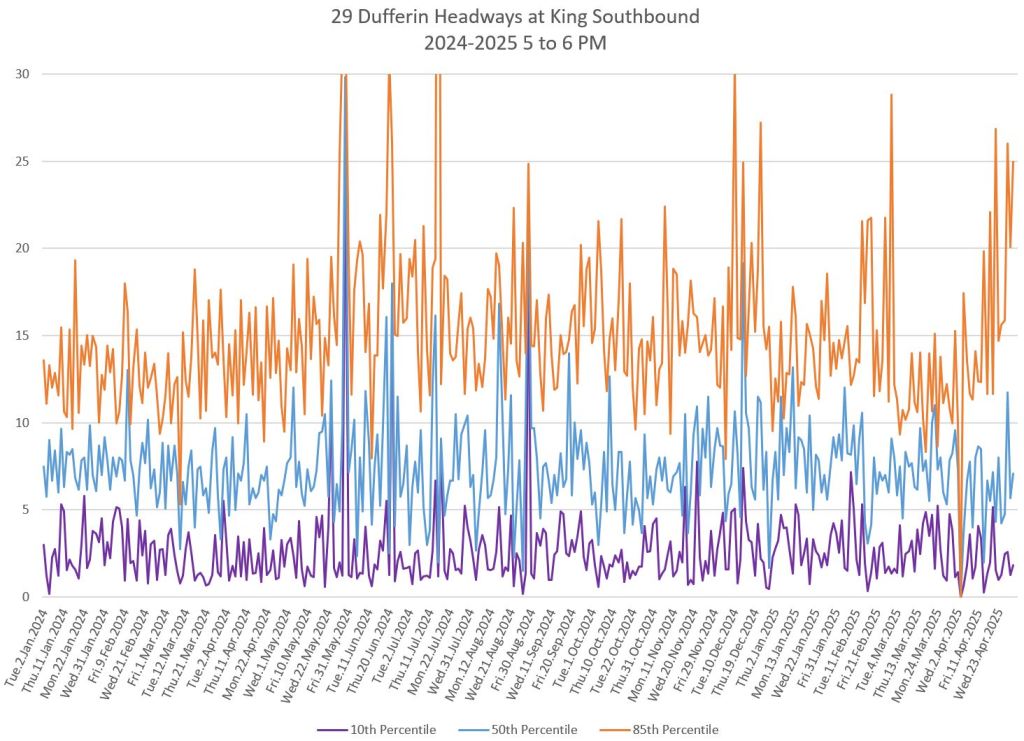
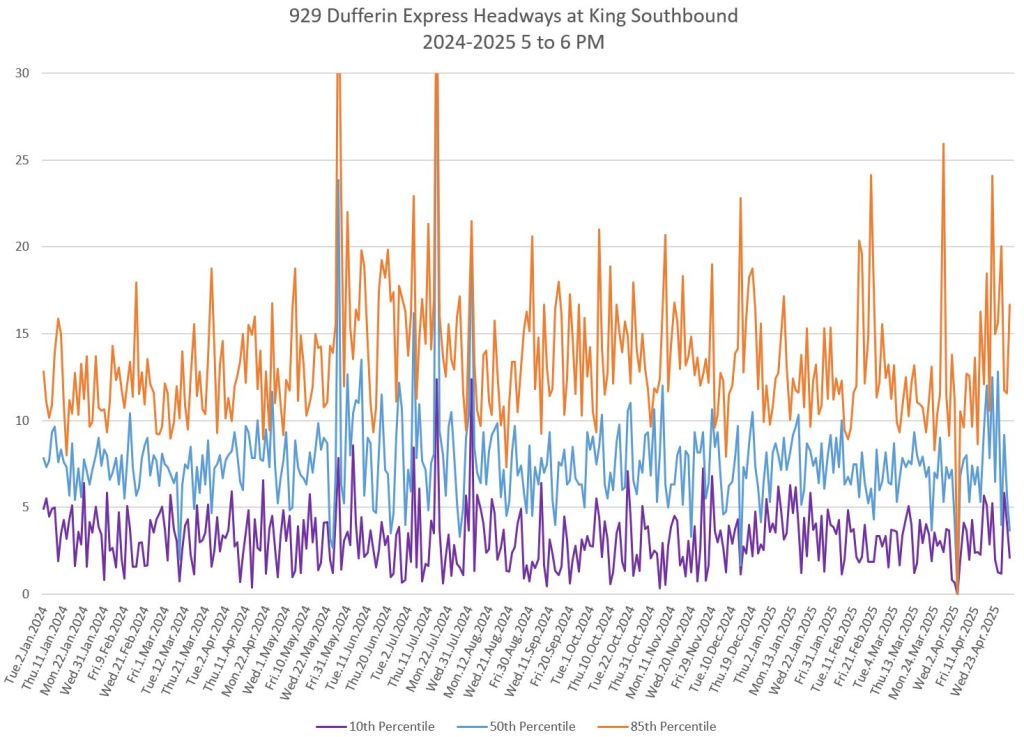
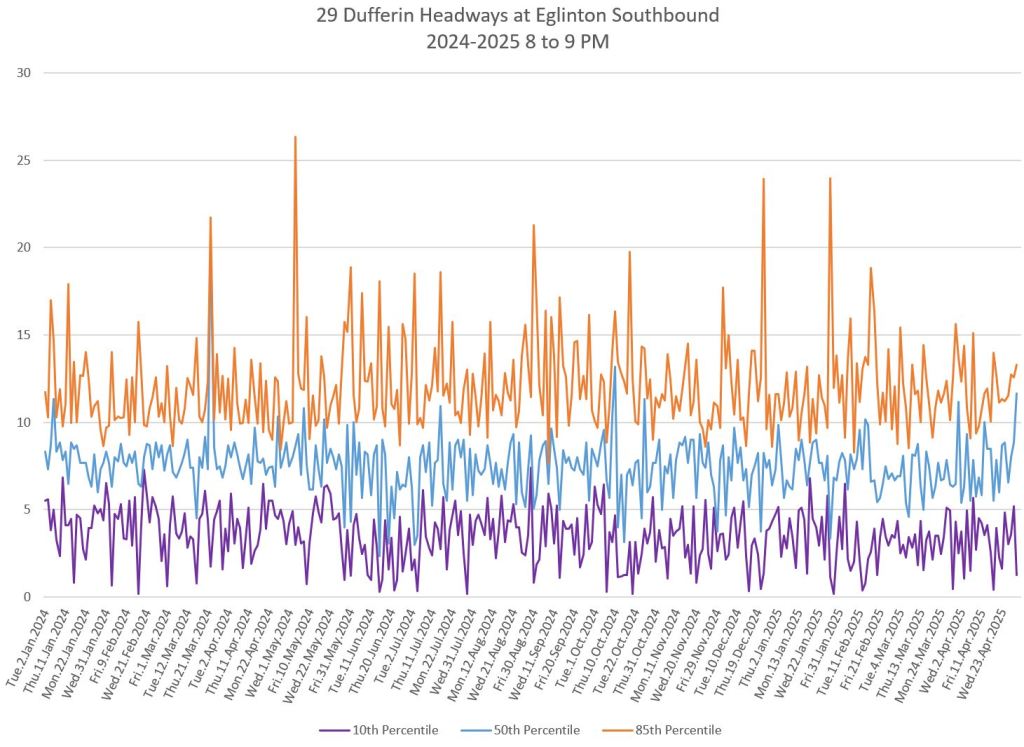
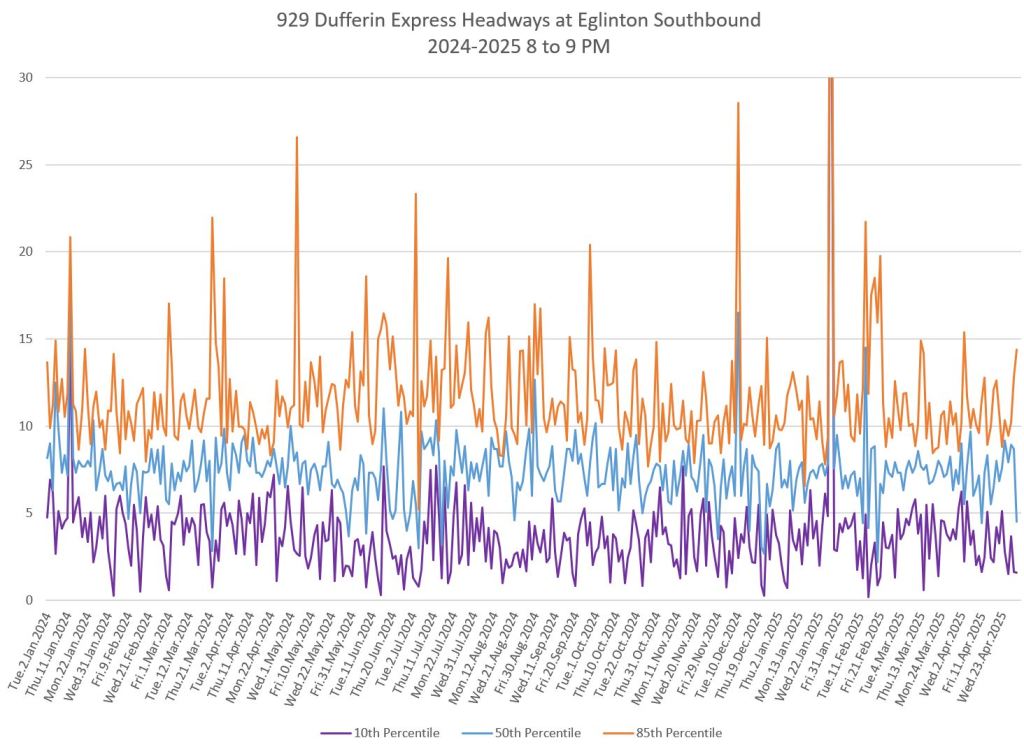
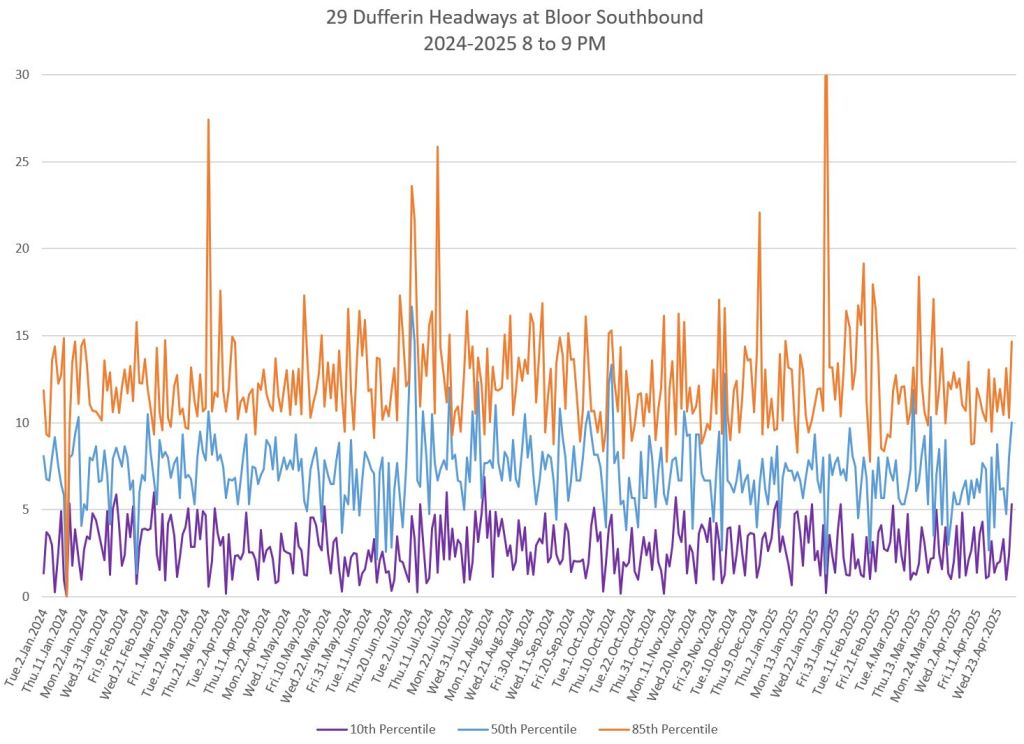
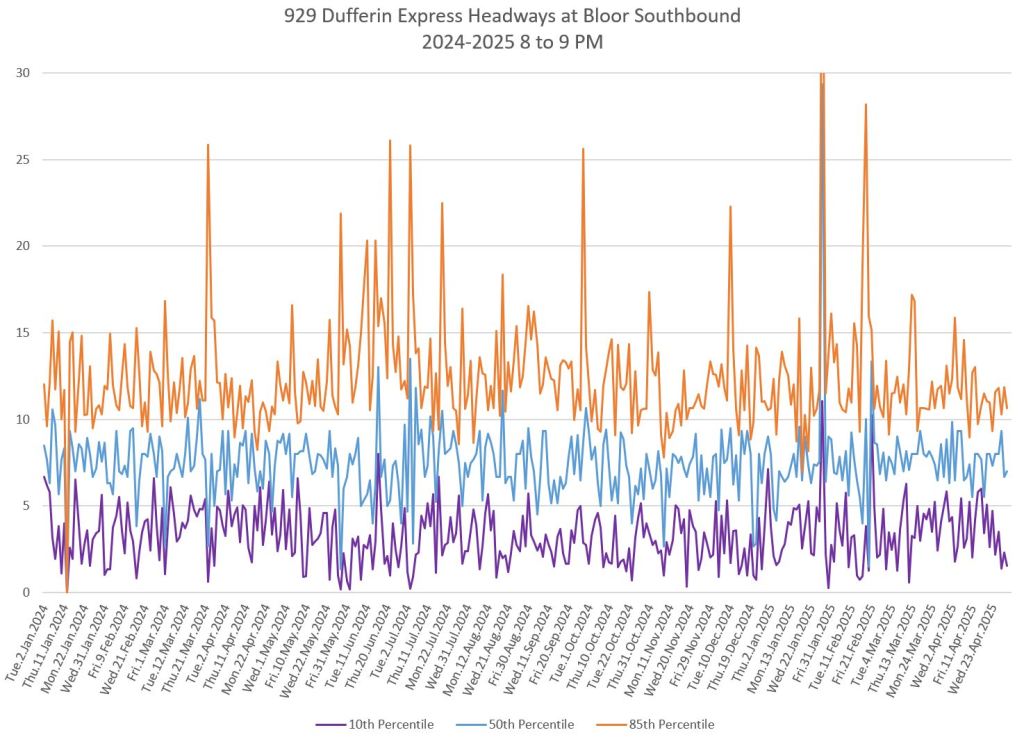
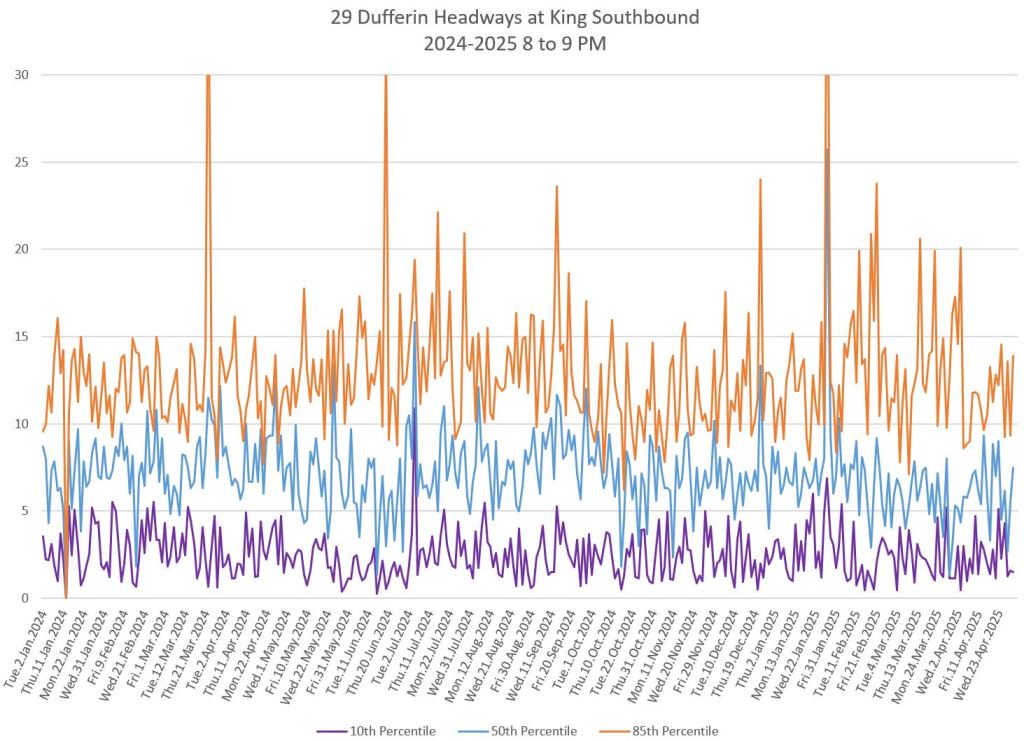
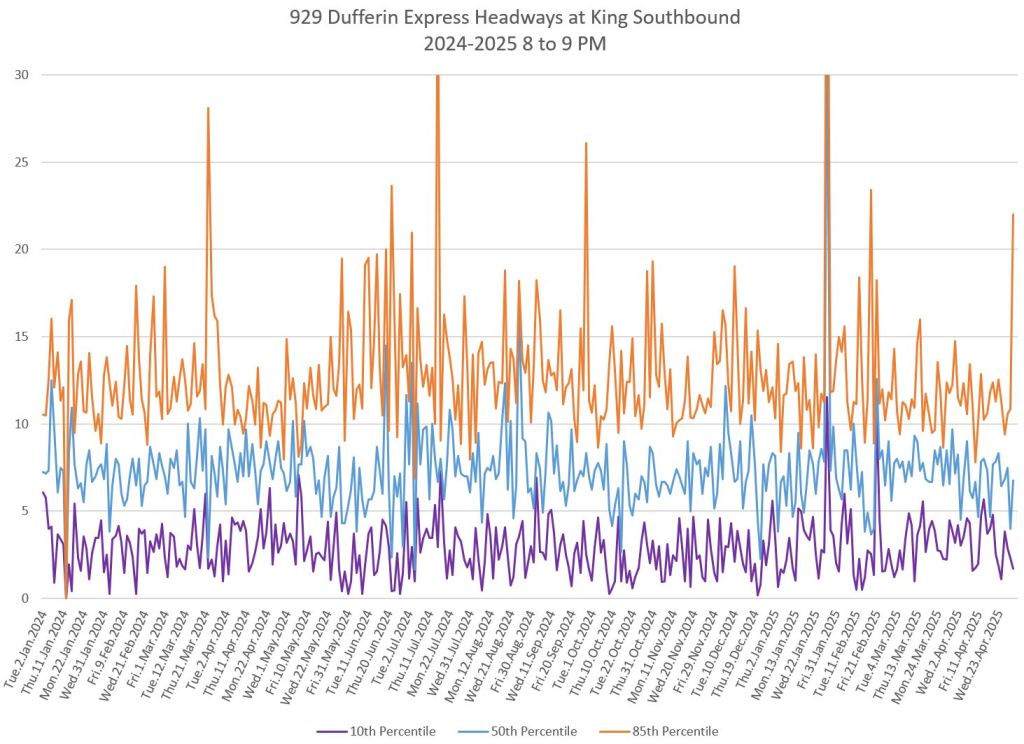
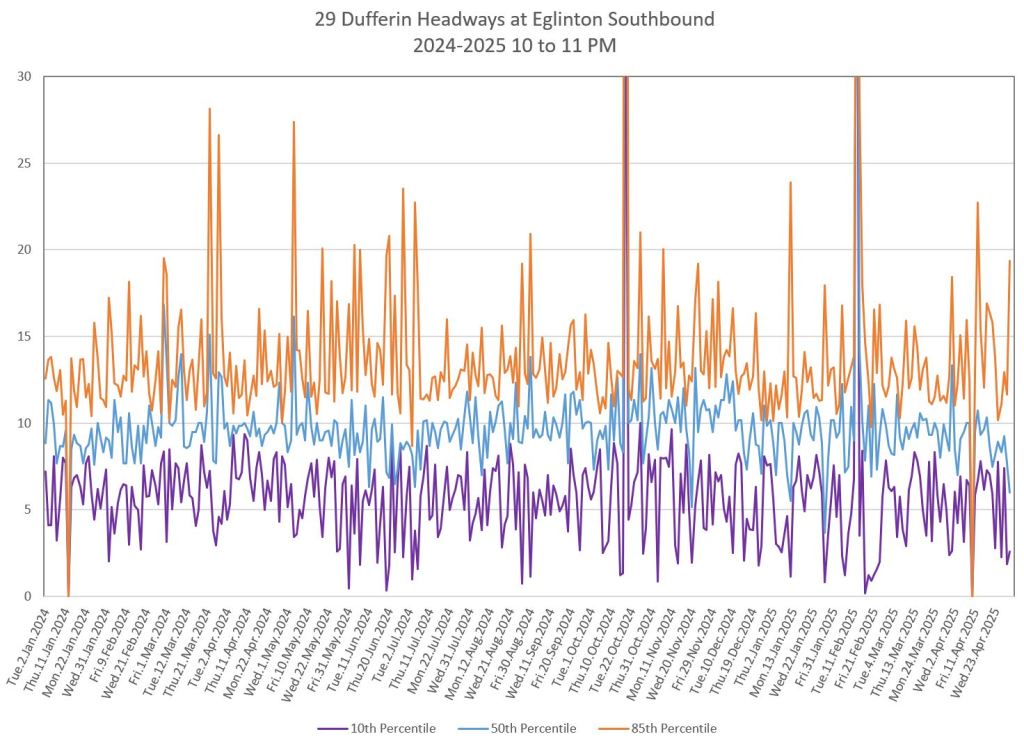
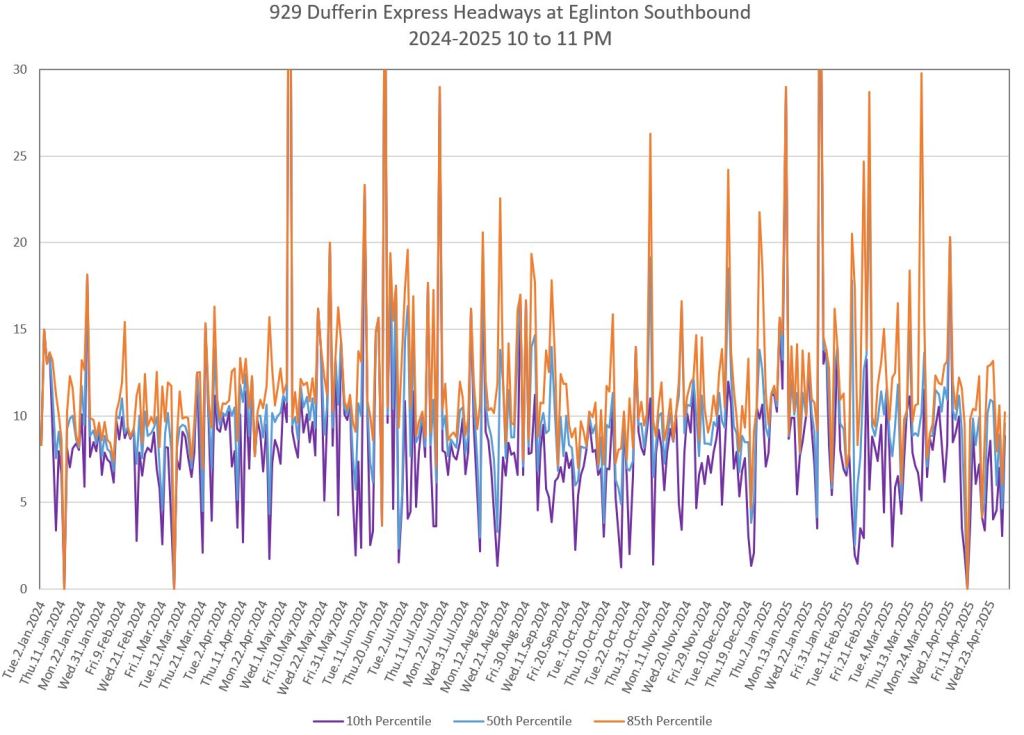
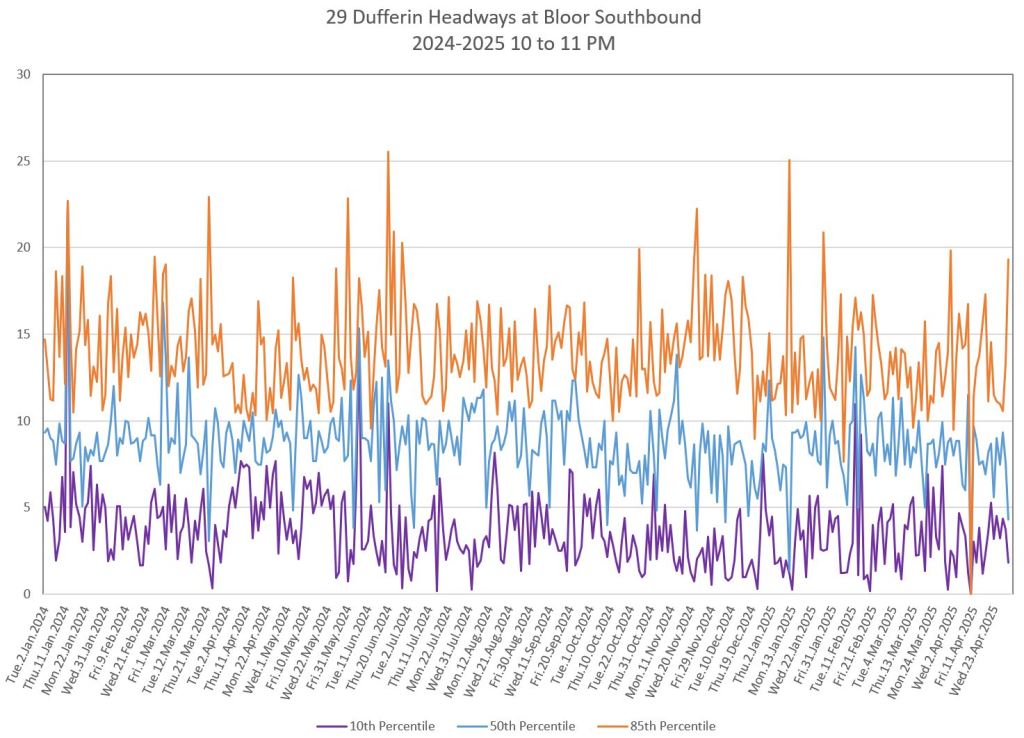
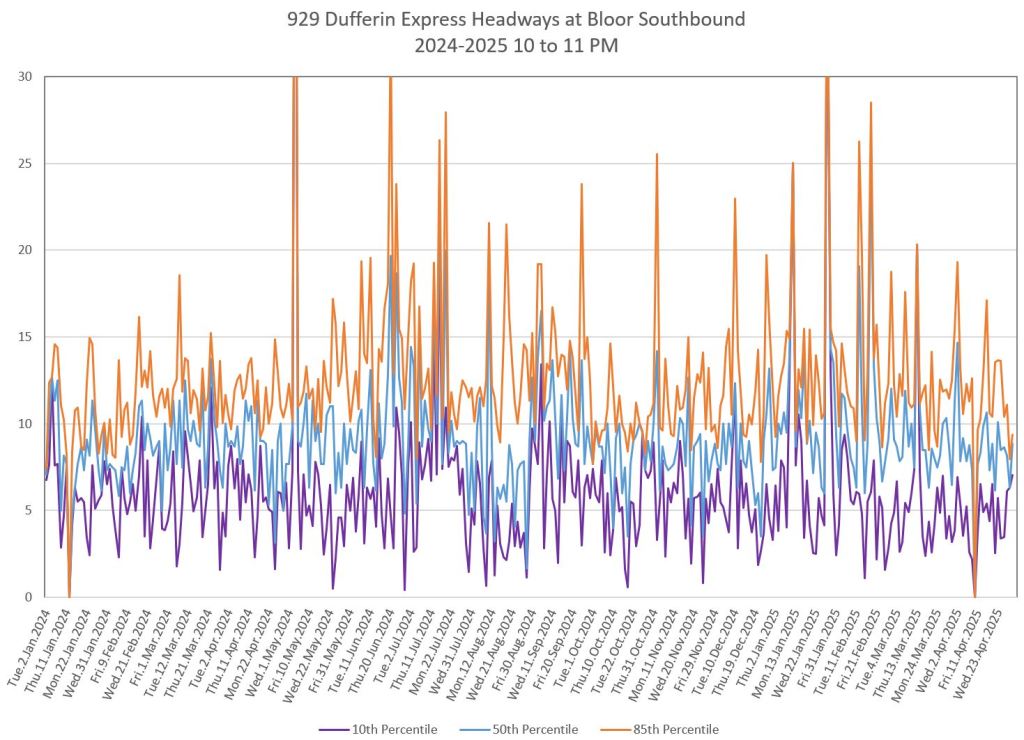
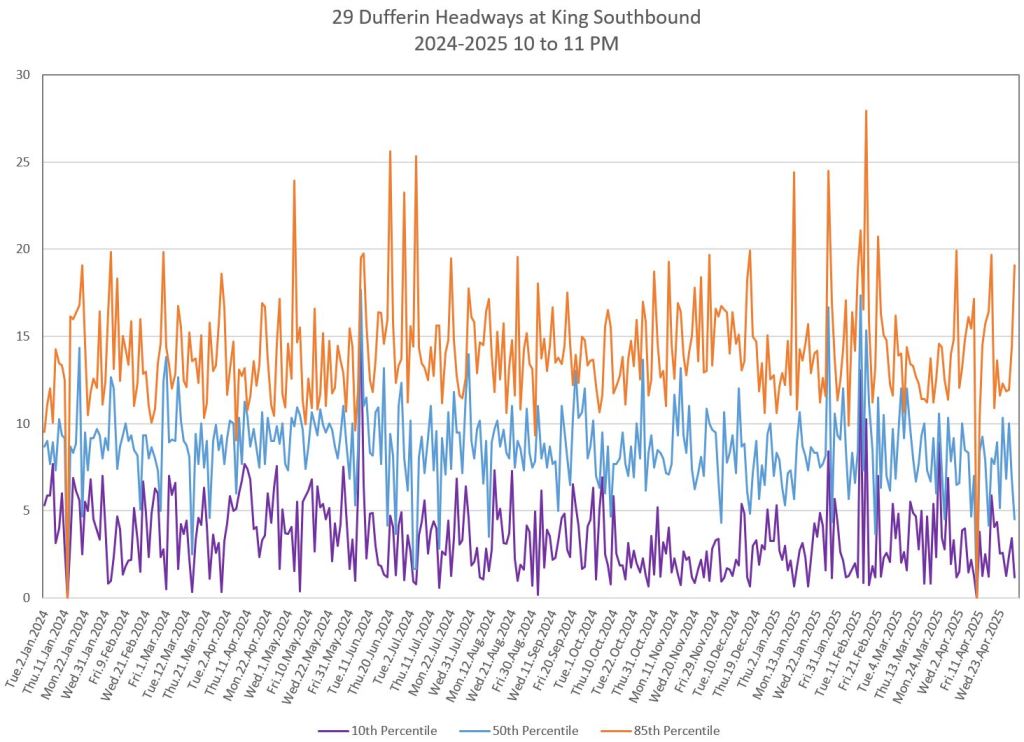
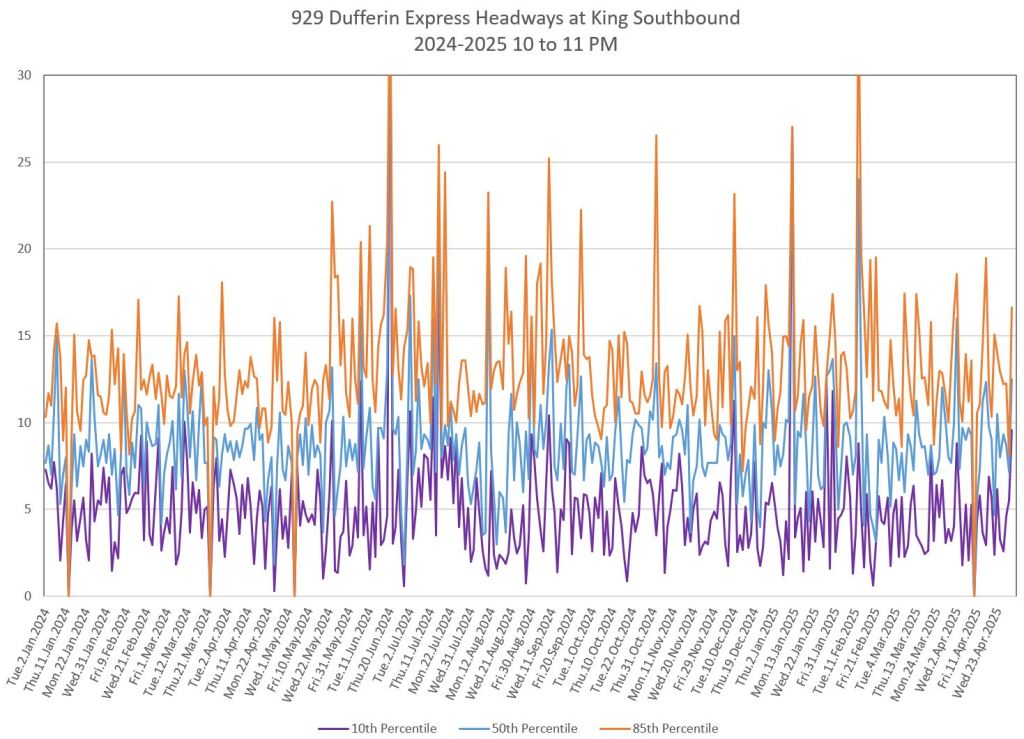
For each group, the headway history is shown for the 29 local service on the left, and for the 929 express service on the right.
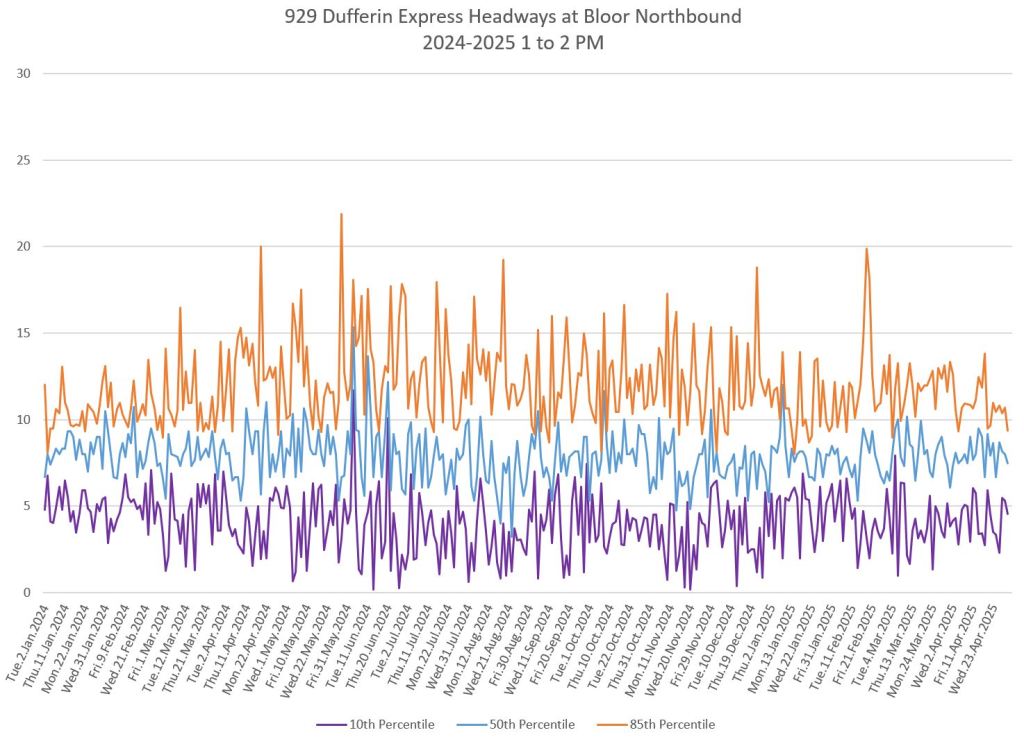
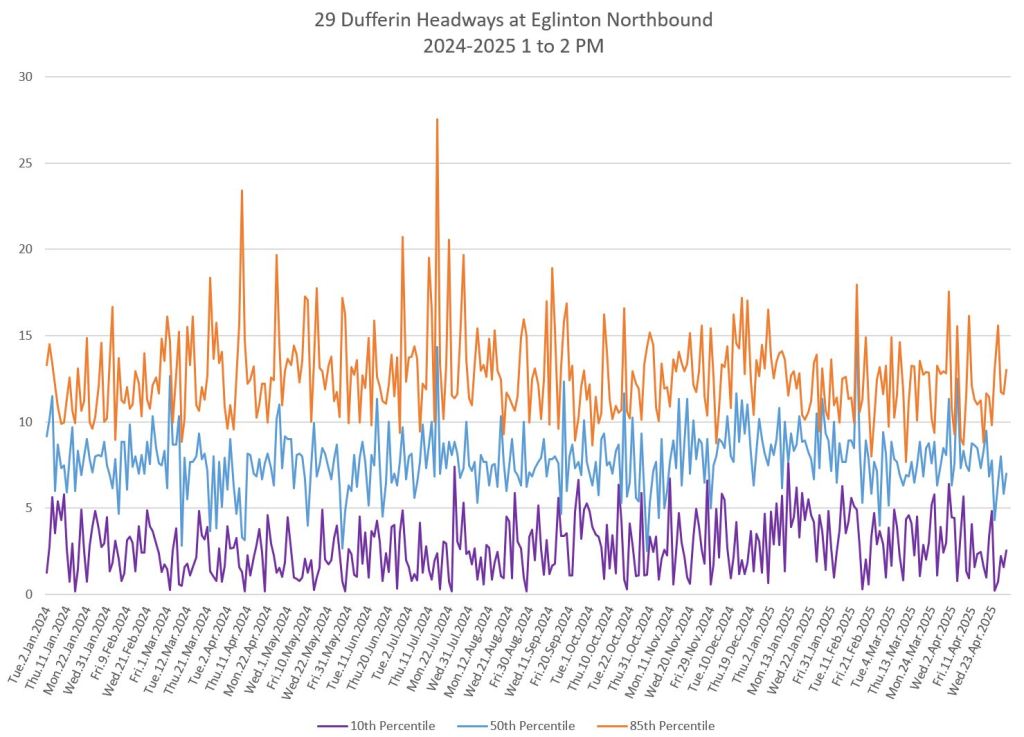
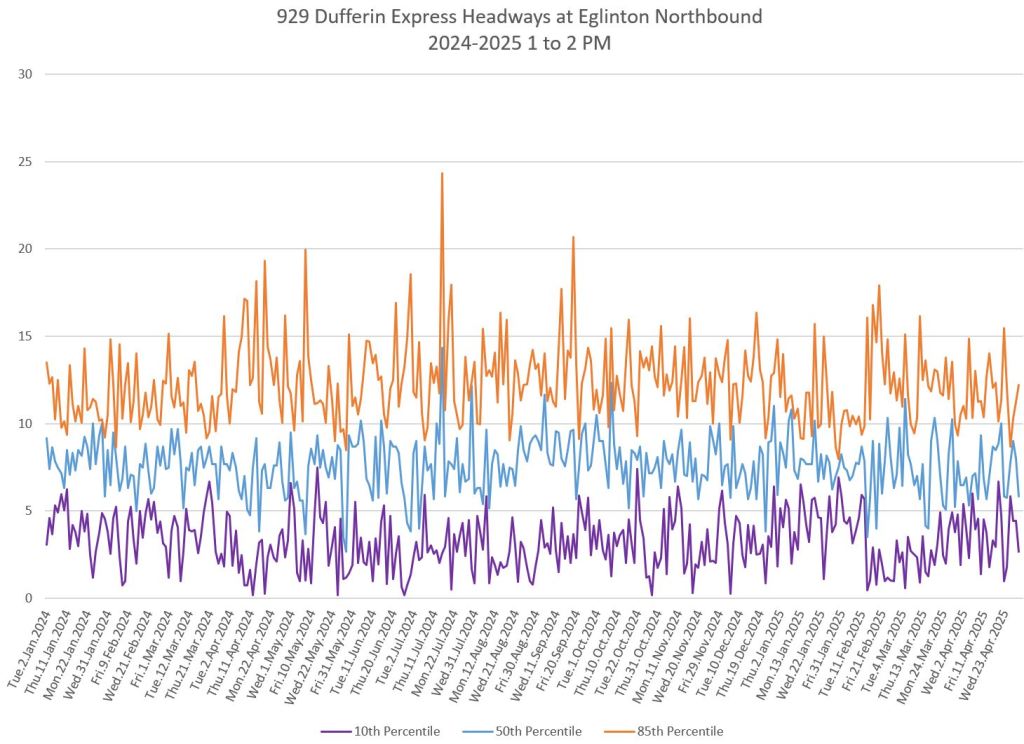
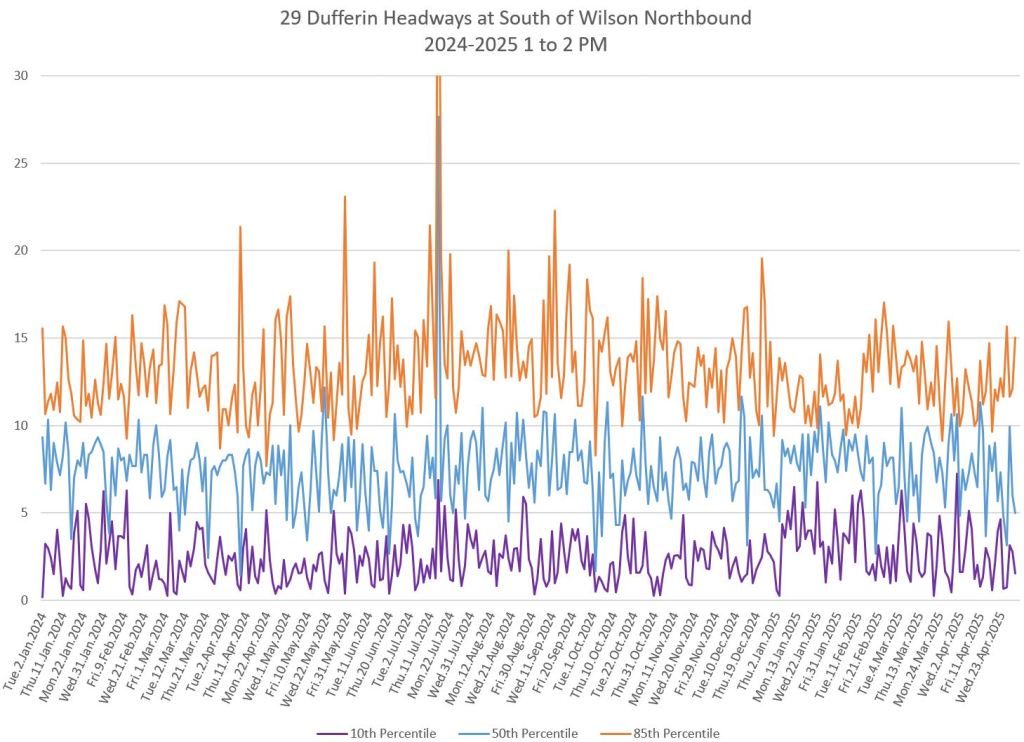
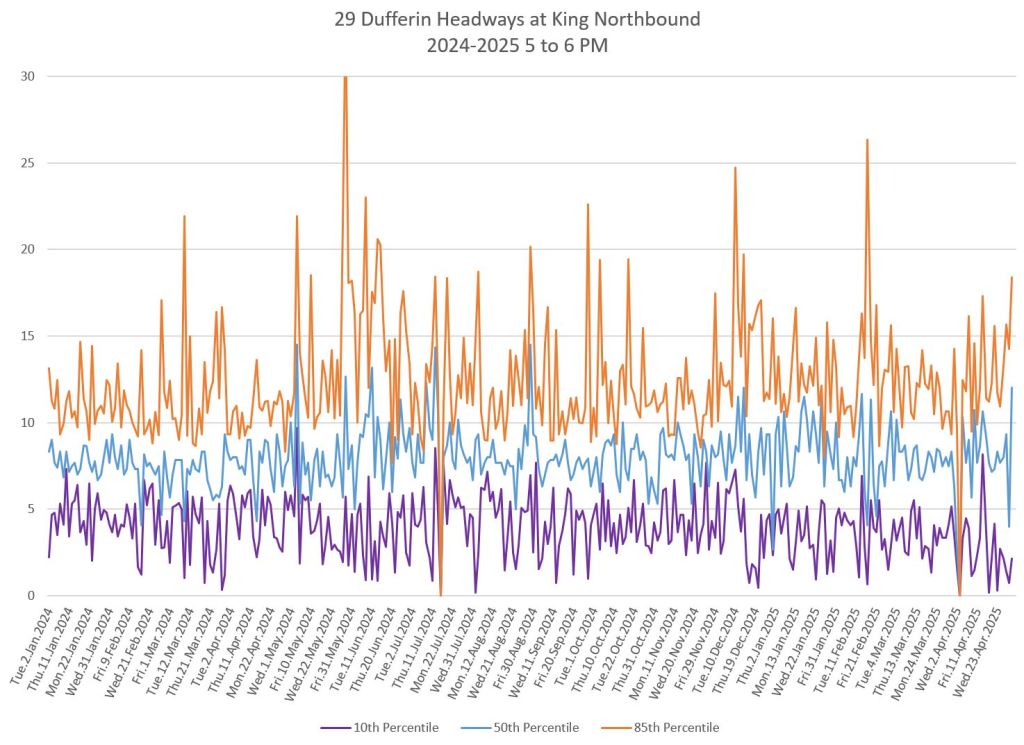
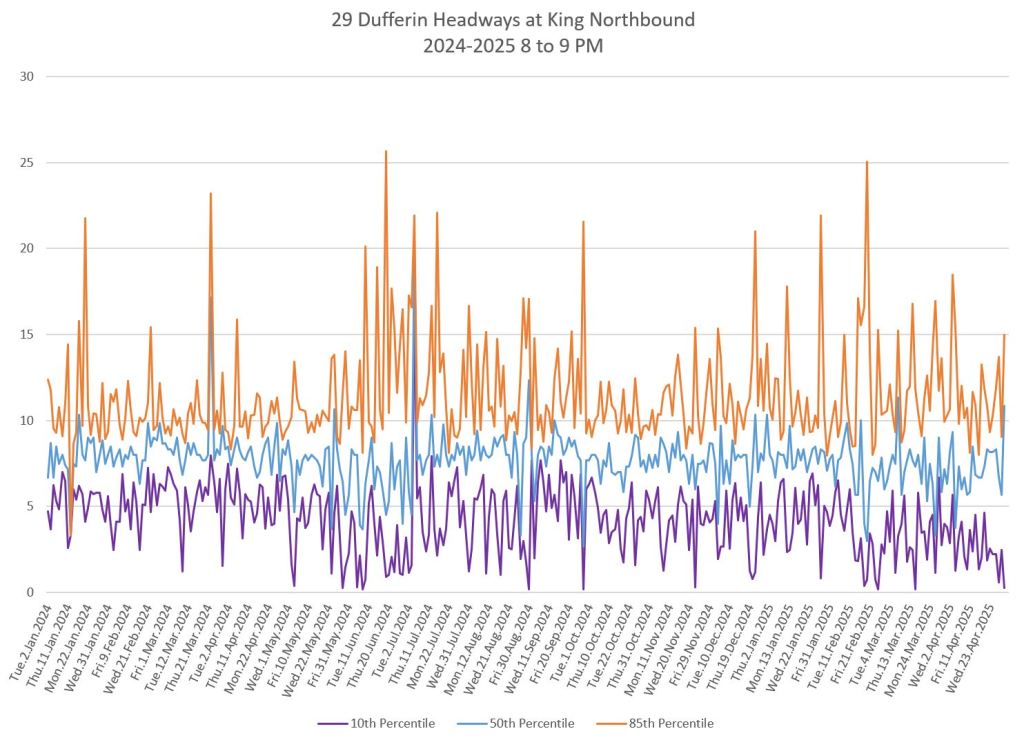
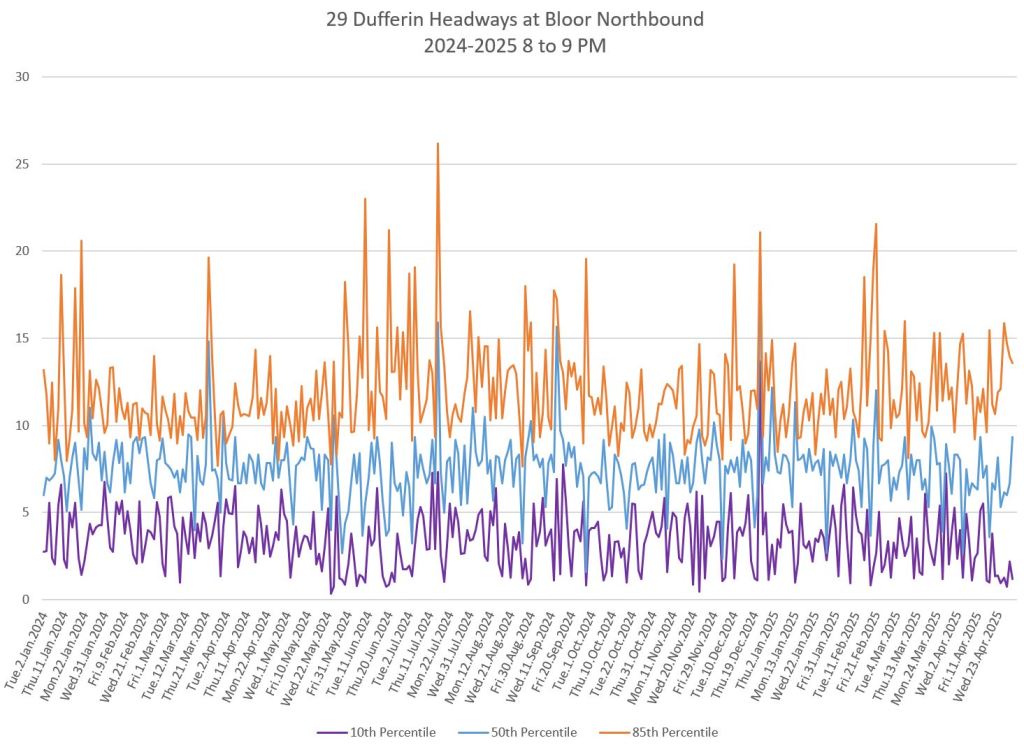
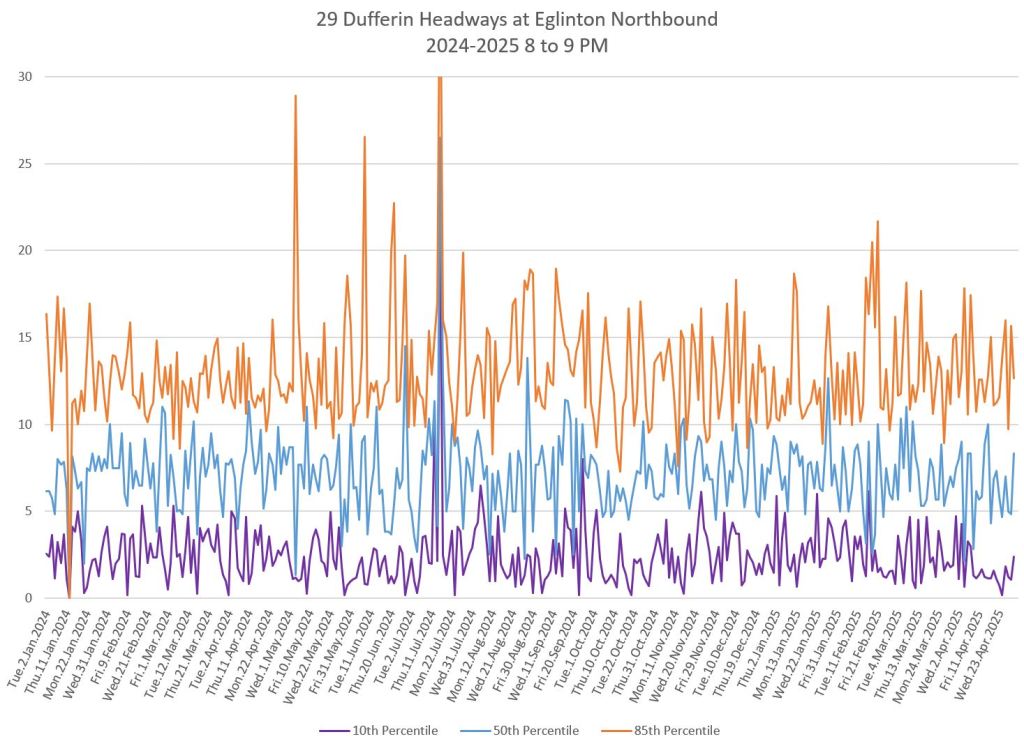
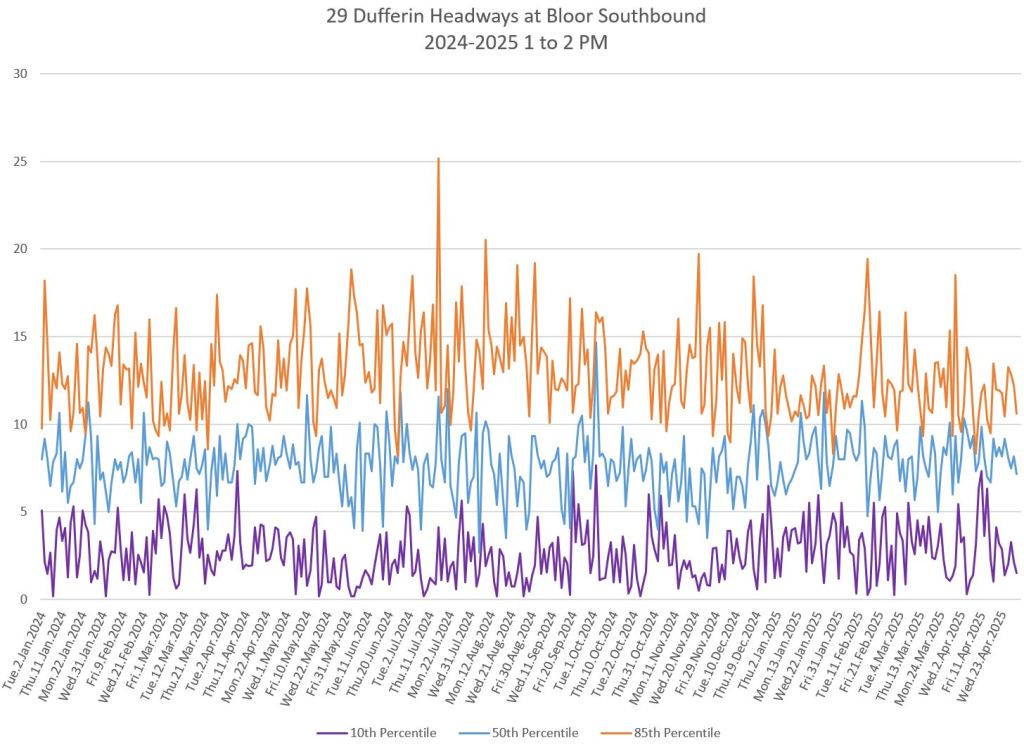
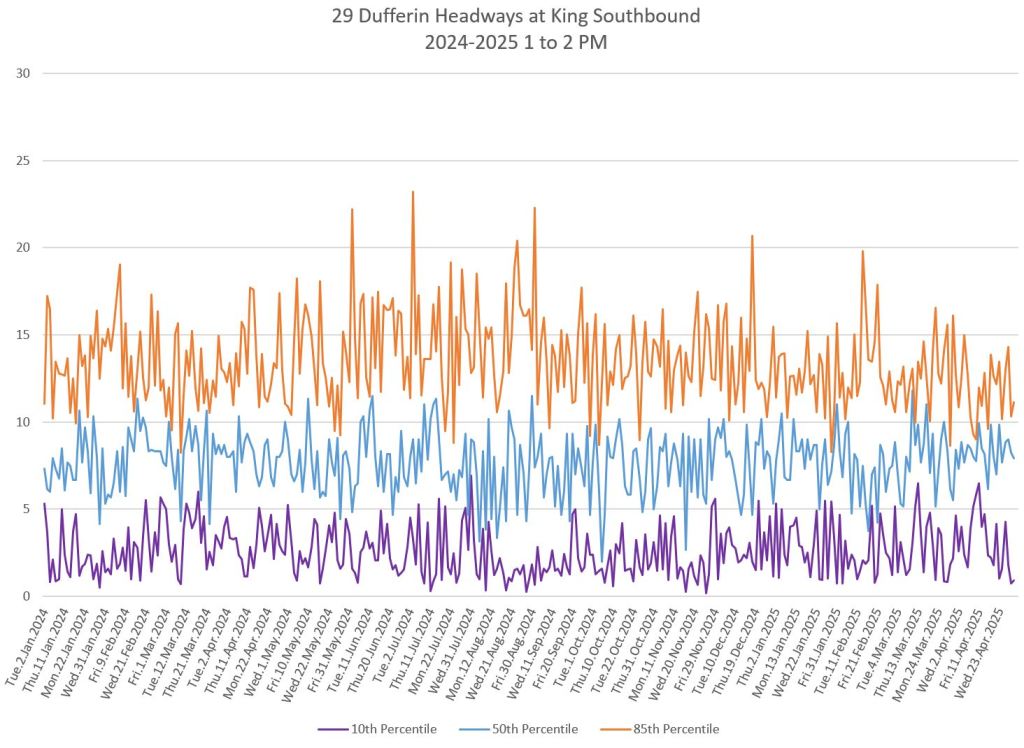
Within each chart, there are three lines:
- Median value: Blue (middle line)
- 85th percentile: Orange (upper line)
- 10th percentile: Purple (lower line)
On any given day, 75% of the headways at the point and hour lie between the upper and lower bands, with the half below and half above the median. These values bounce around a lot showing that conditions differ from day to day. There was no change in the scheduled frequency during the 16 months covered here.
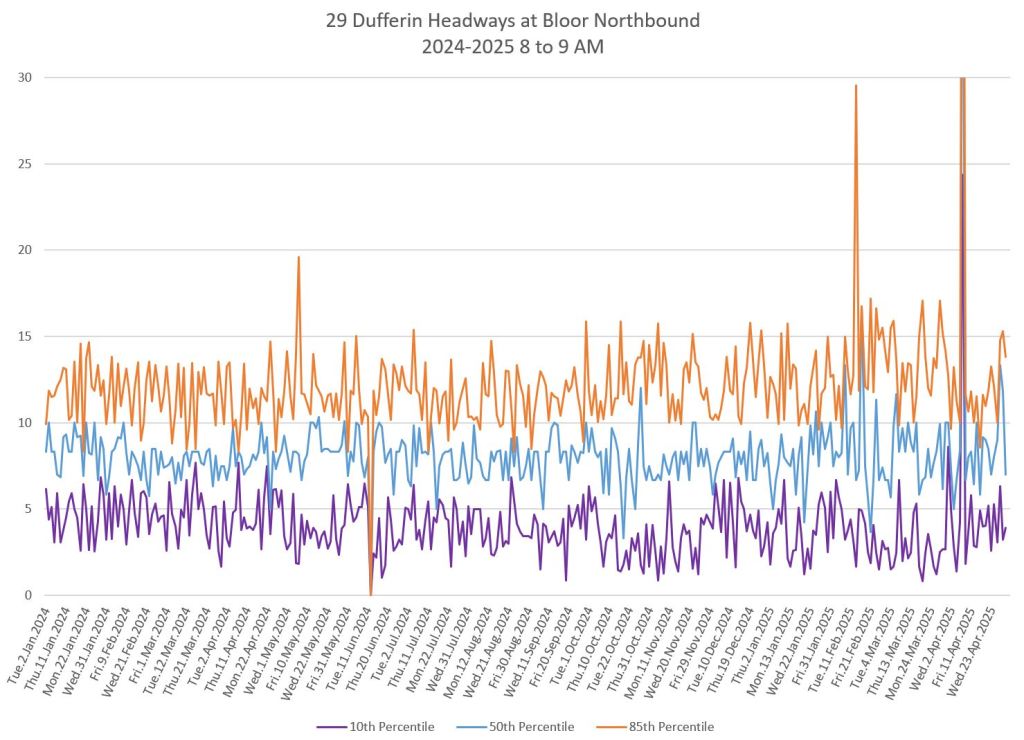
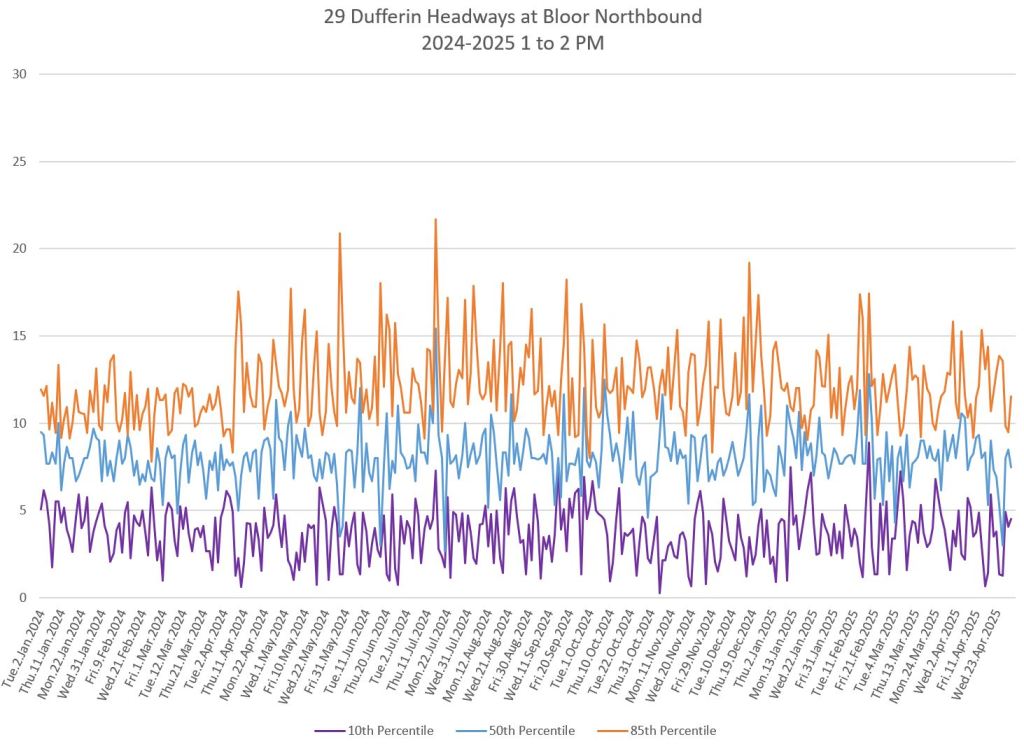
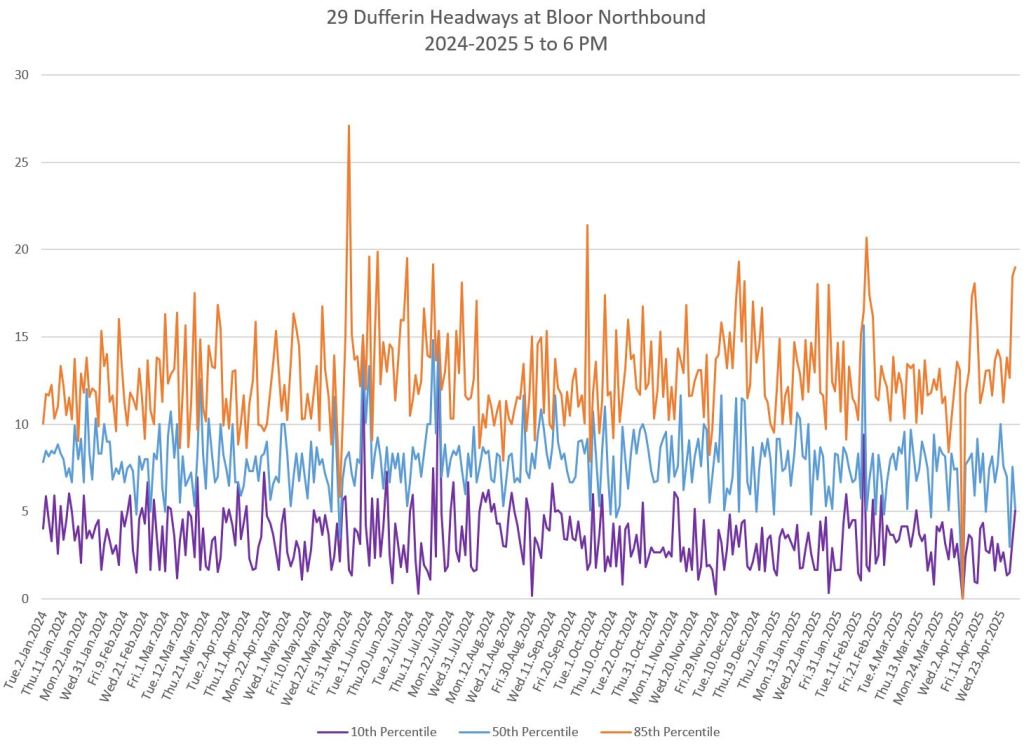
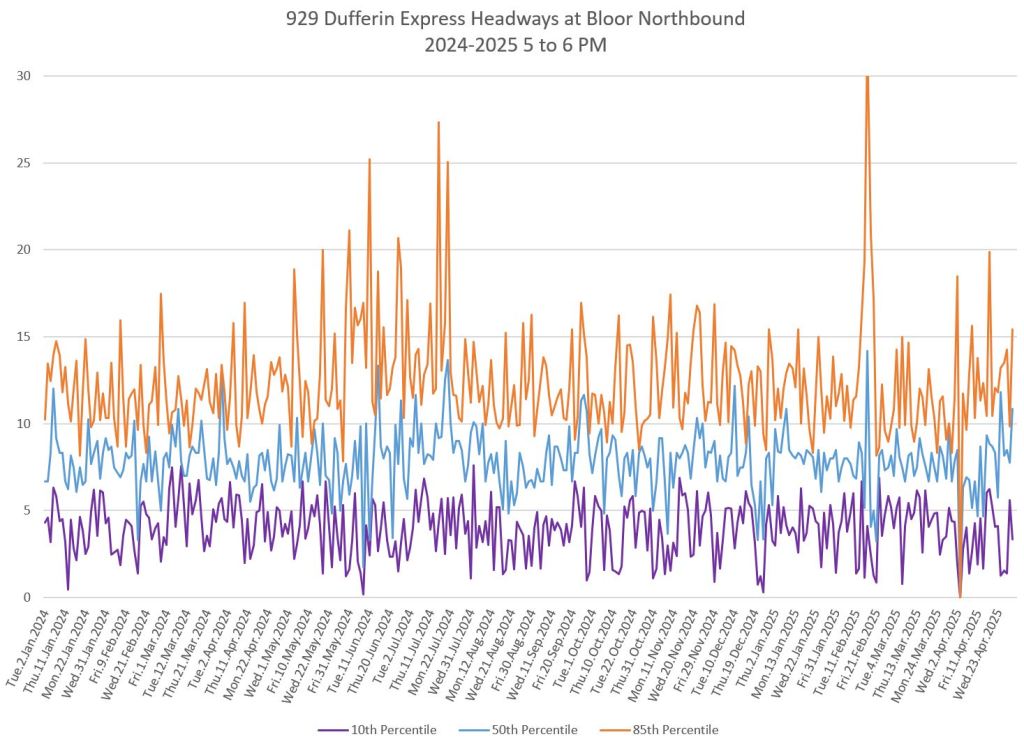
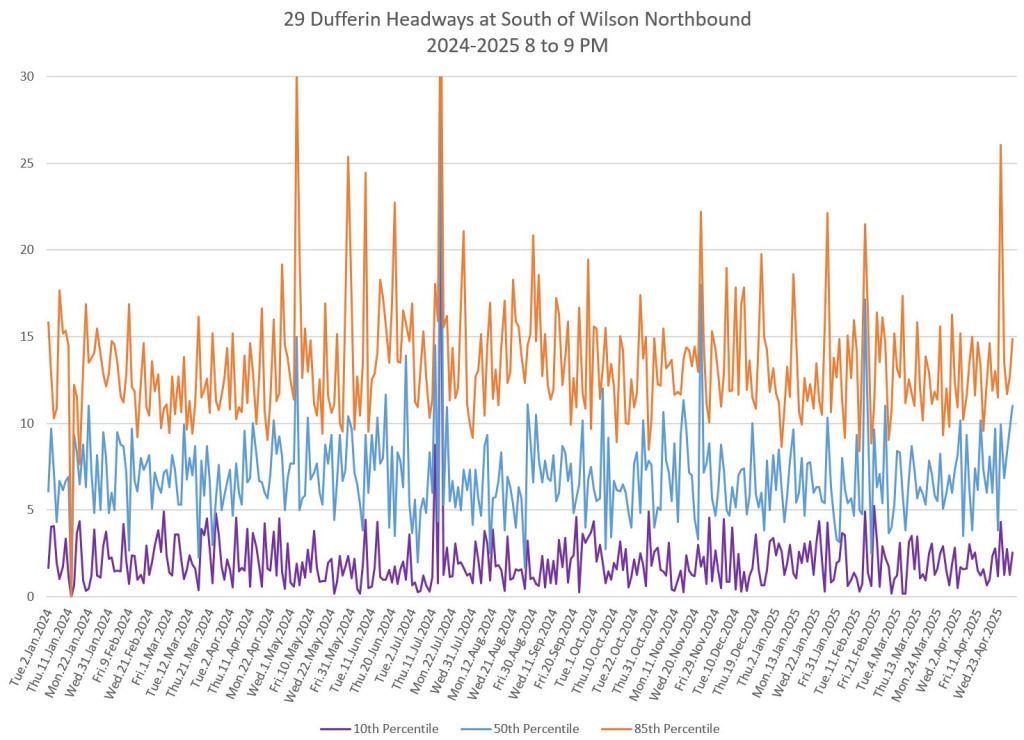
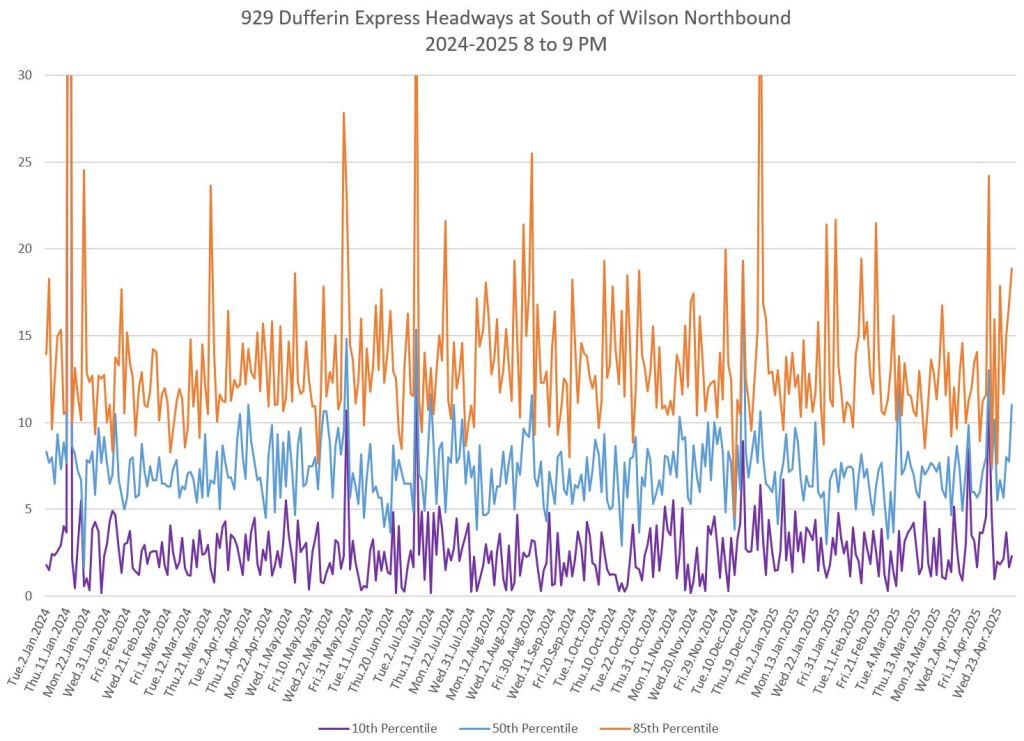
For each time group, there are four pairs of charts showing the headways at key points from King to Wilson northbound, and from Transit Road to King southbound. The erratic headways exist from both ends of the line rather than developing enroute, but as one moves along the route they worsen as the upper and lower bounds spread apart. Bunches get tighter and gaps widen.
Note how the 10th percentile line moves closer to zero the further along the route buses travel while the orange 85th percentile line rises. The median 50th percentile also becomes more erratic. The problem becomes worse through the day.
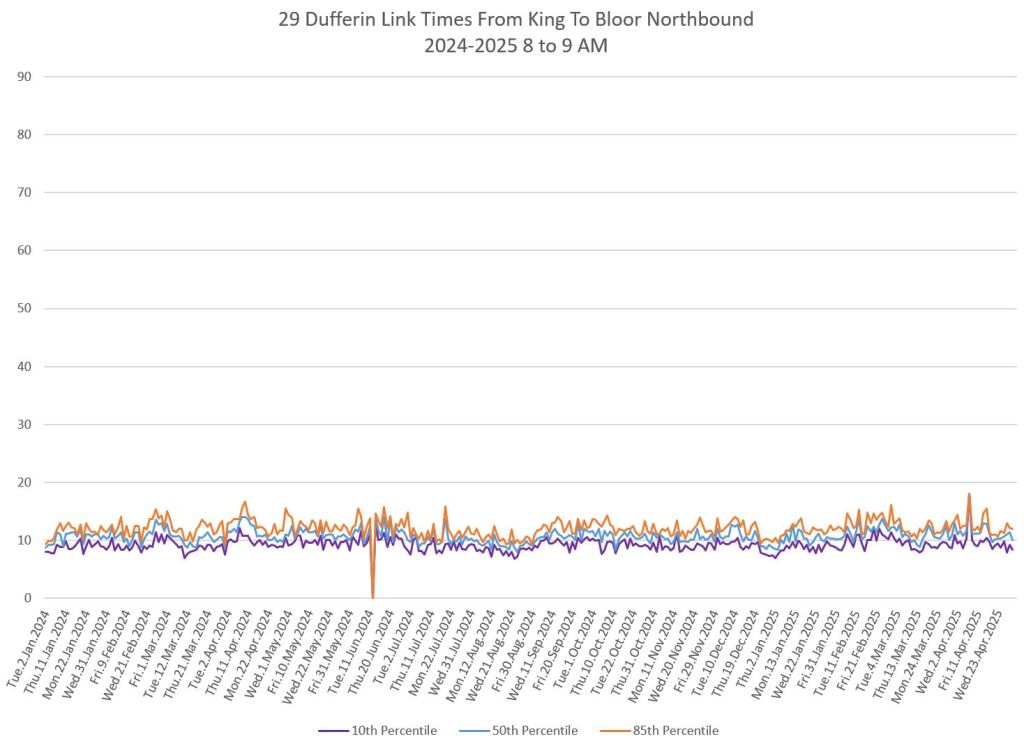
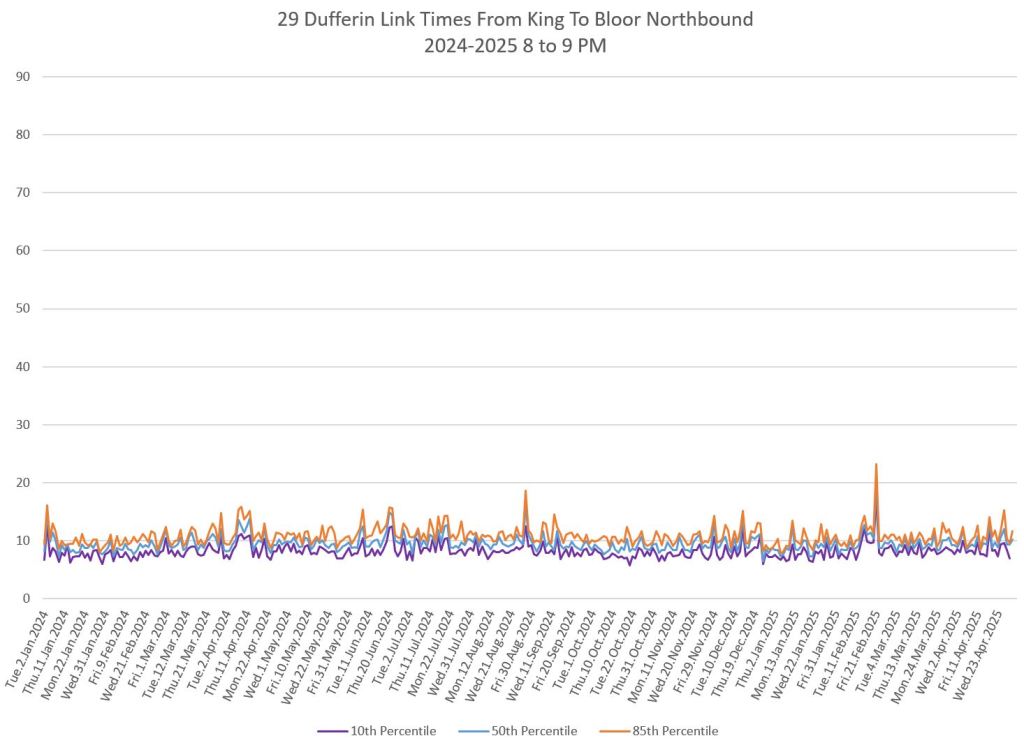
Northbound 8am
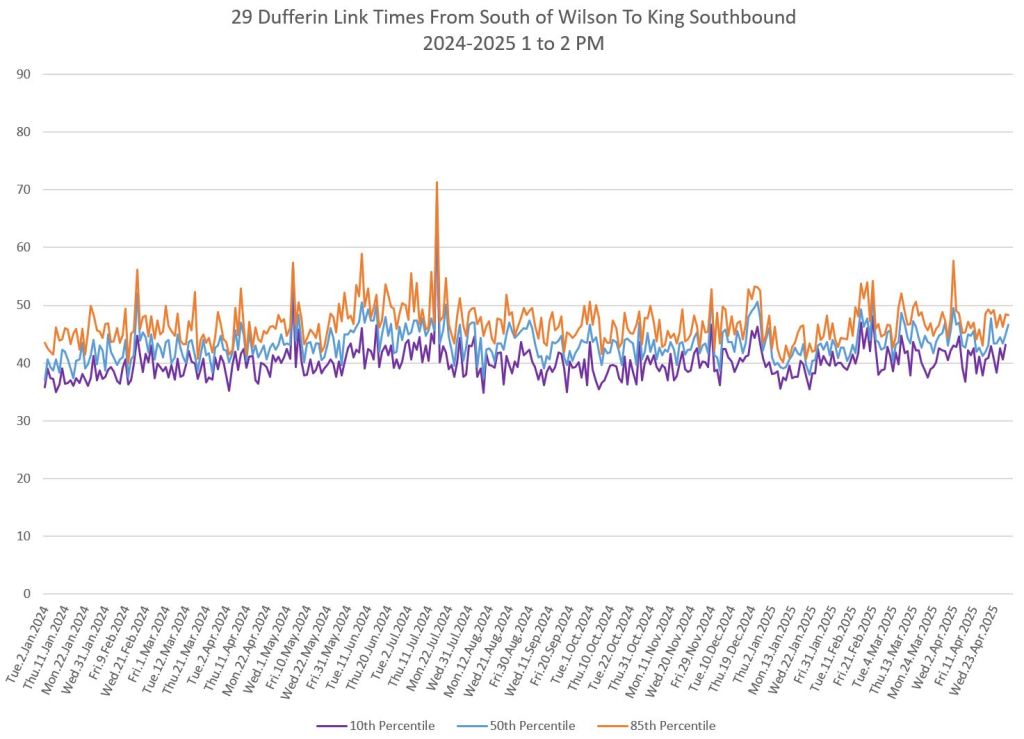
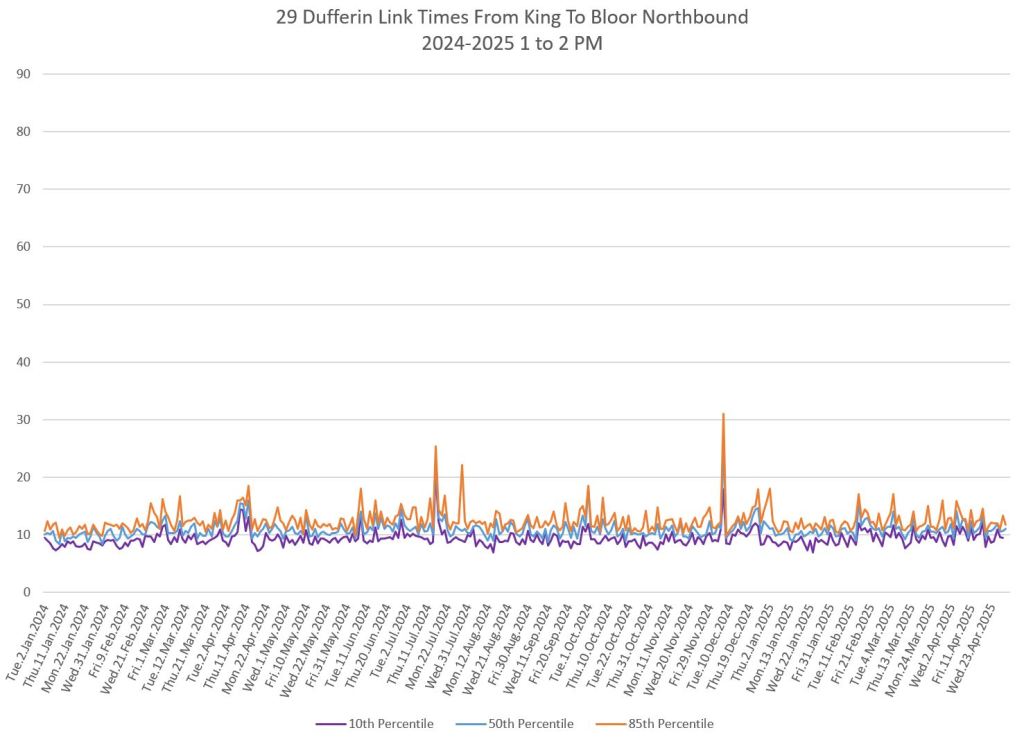
Northbound 1pm

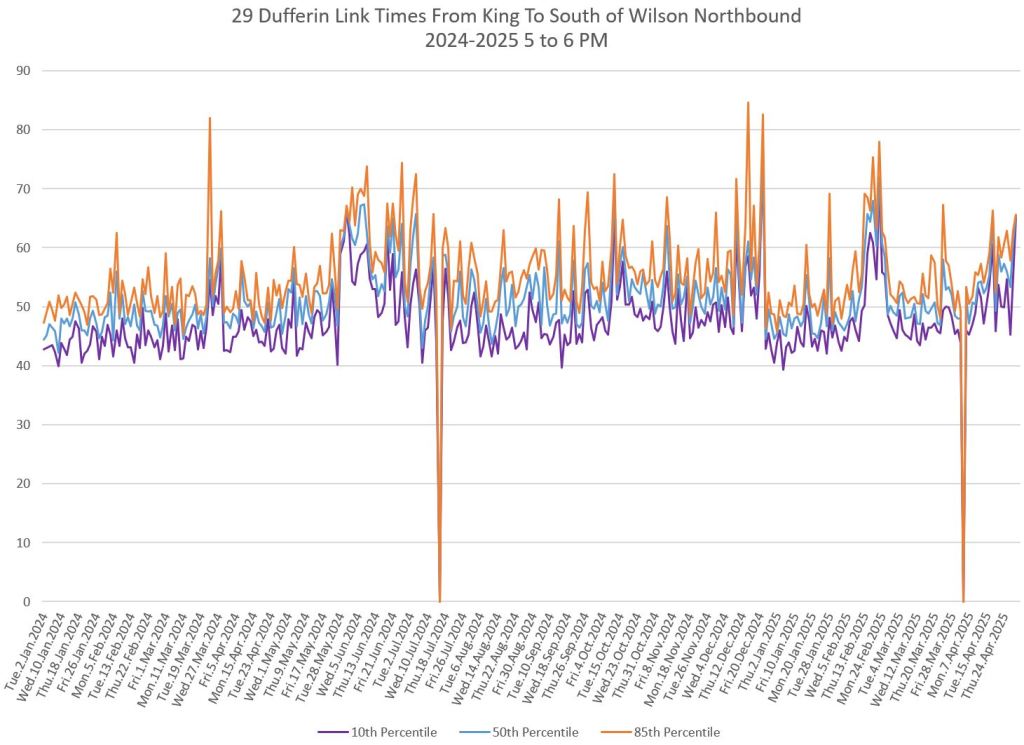
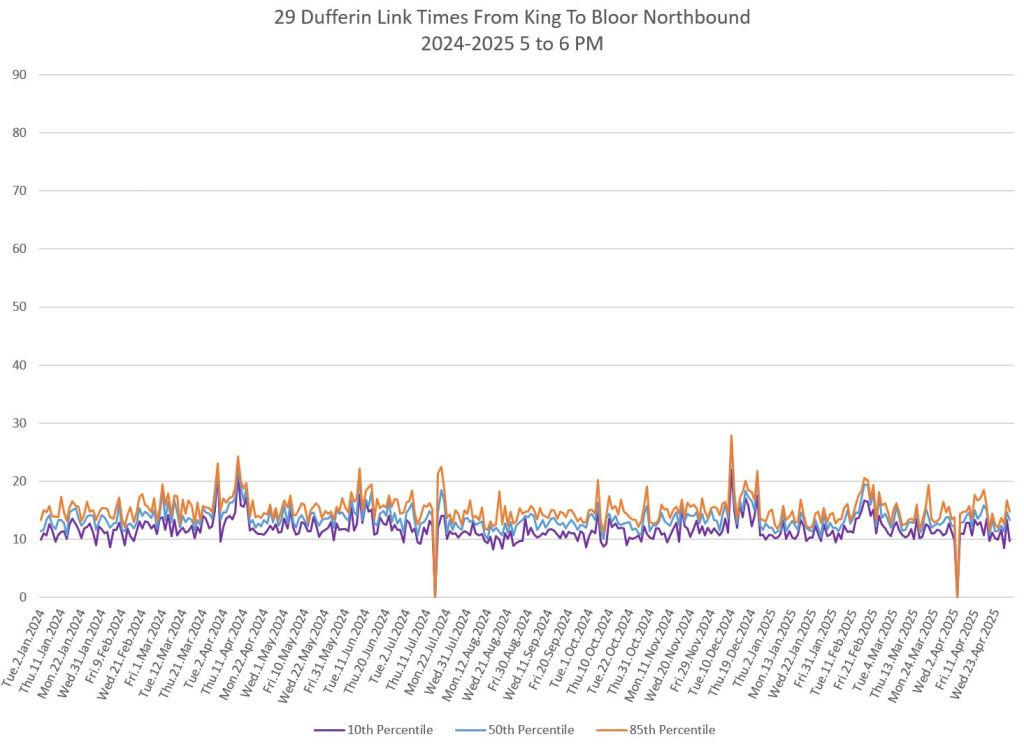
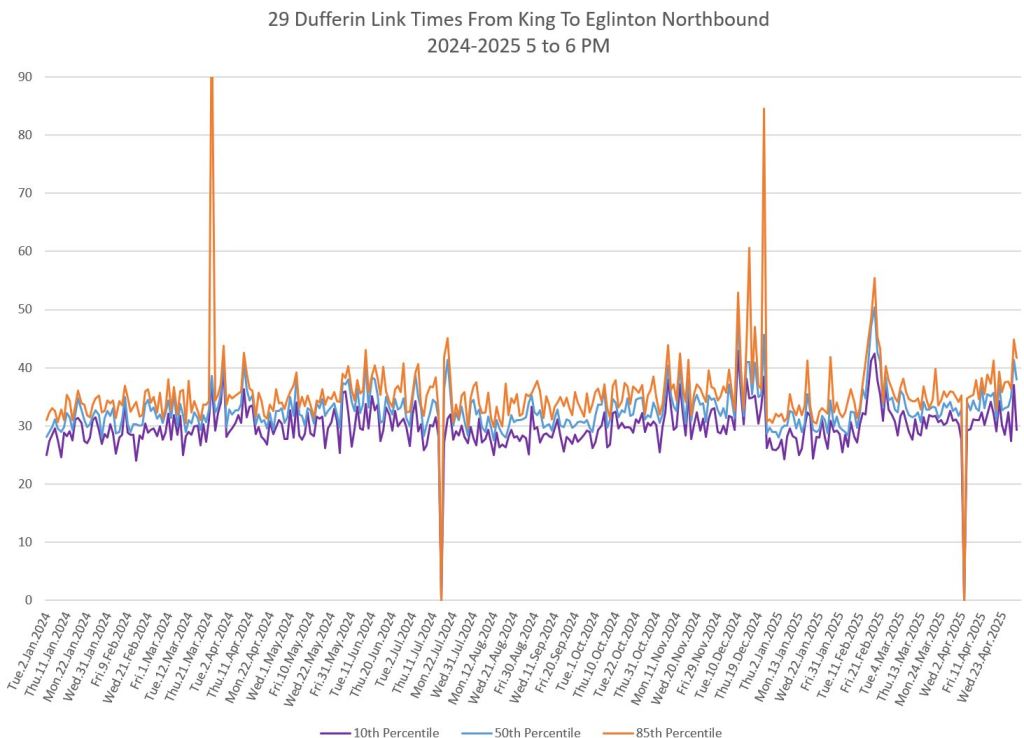
Northbound 5pm
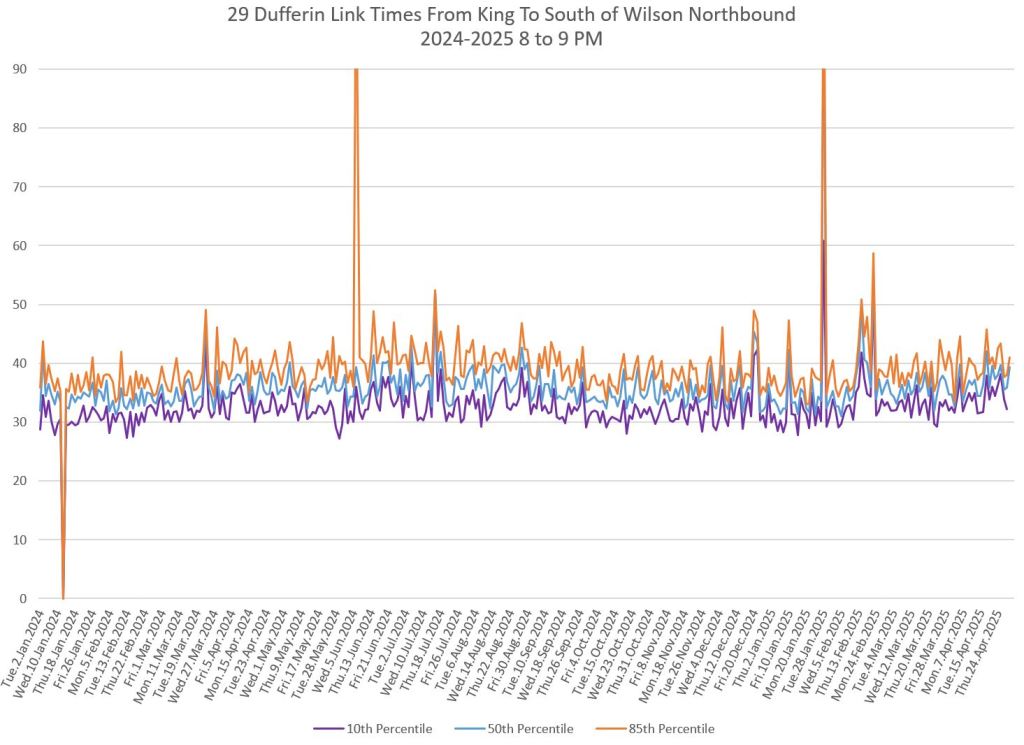
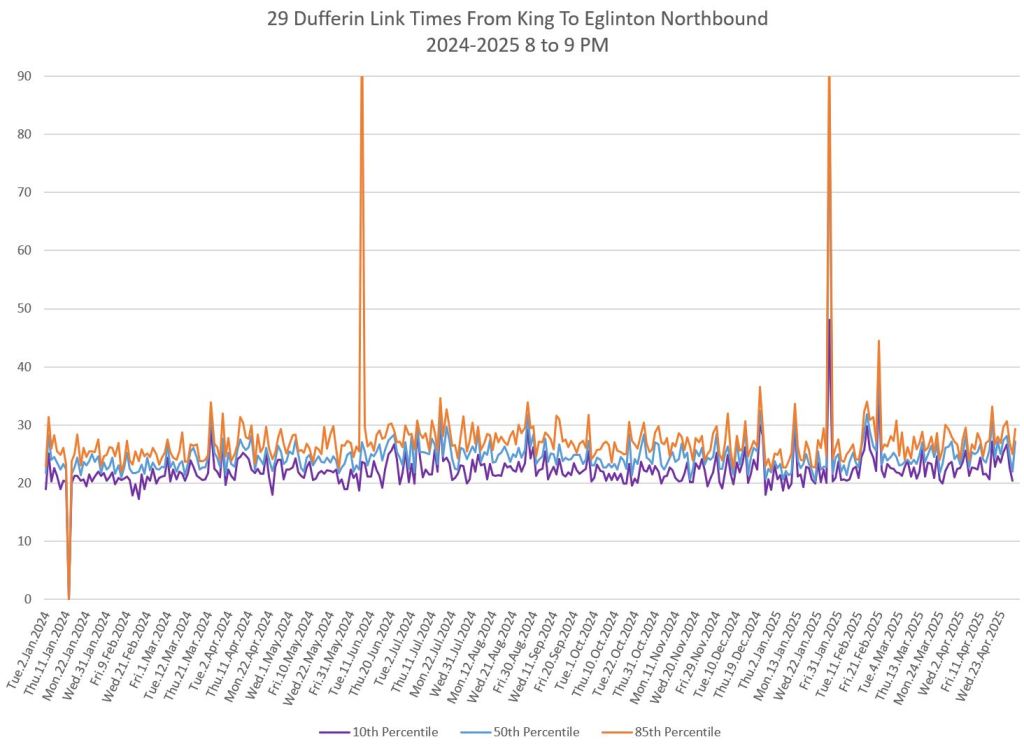
Northbound 8pm
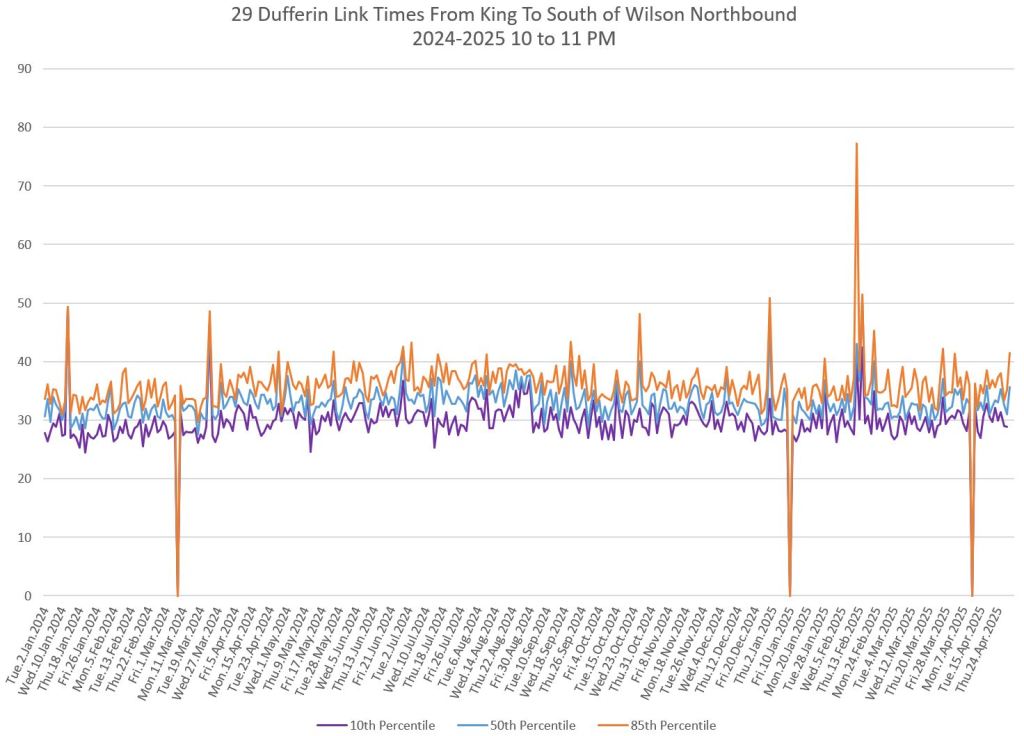
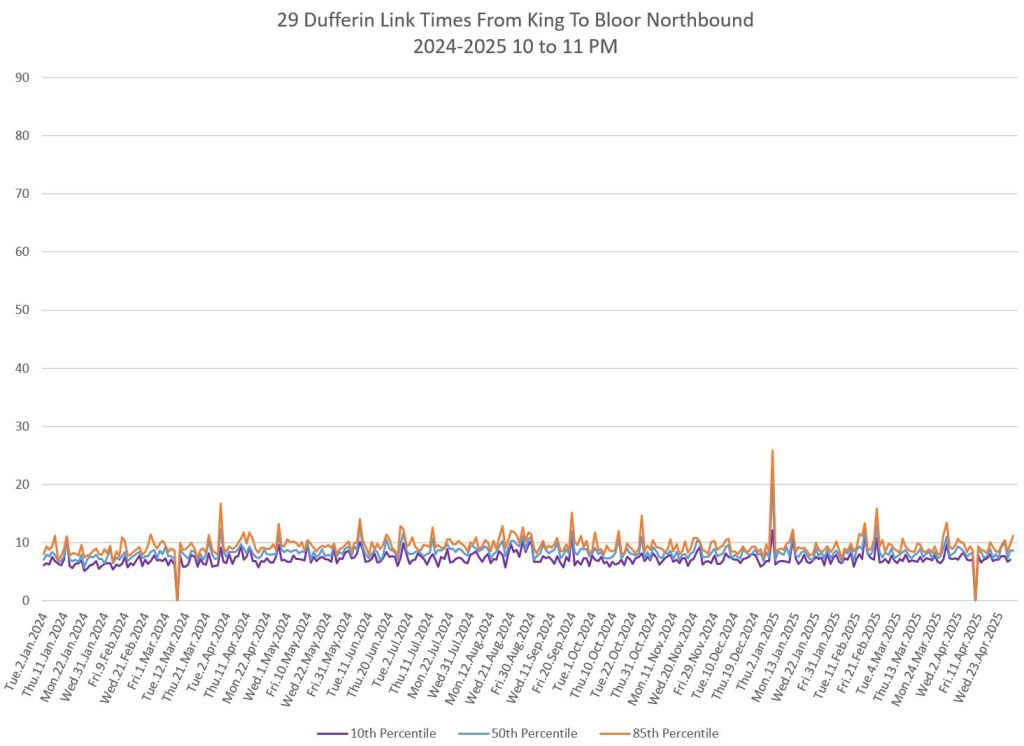
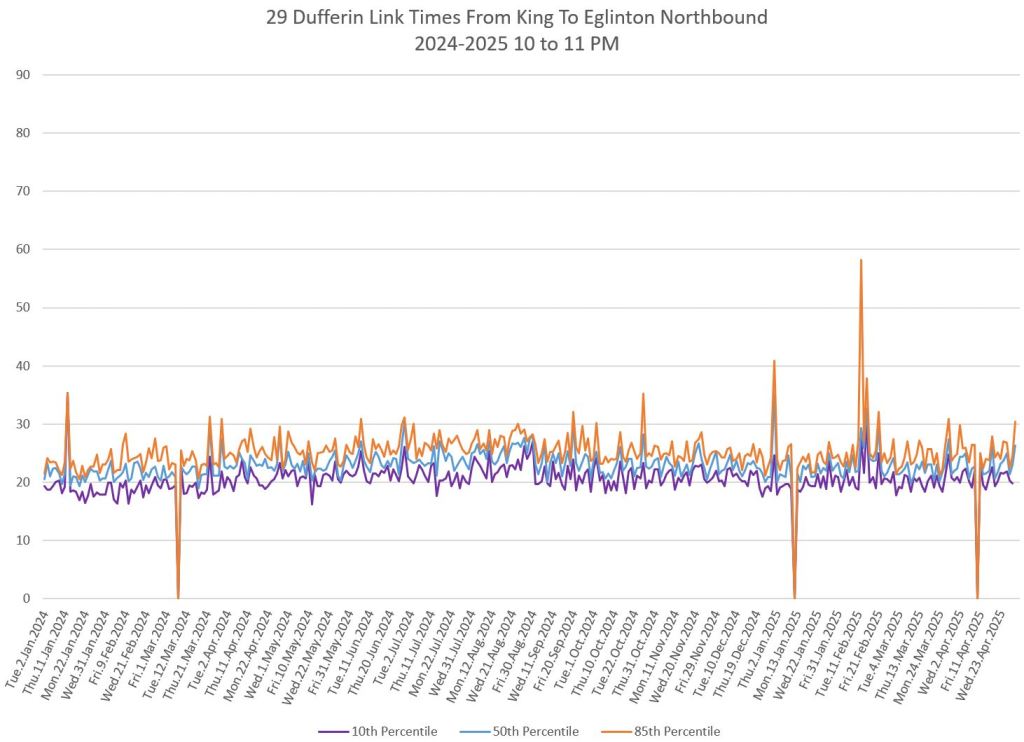
Northbound 10pm
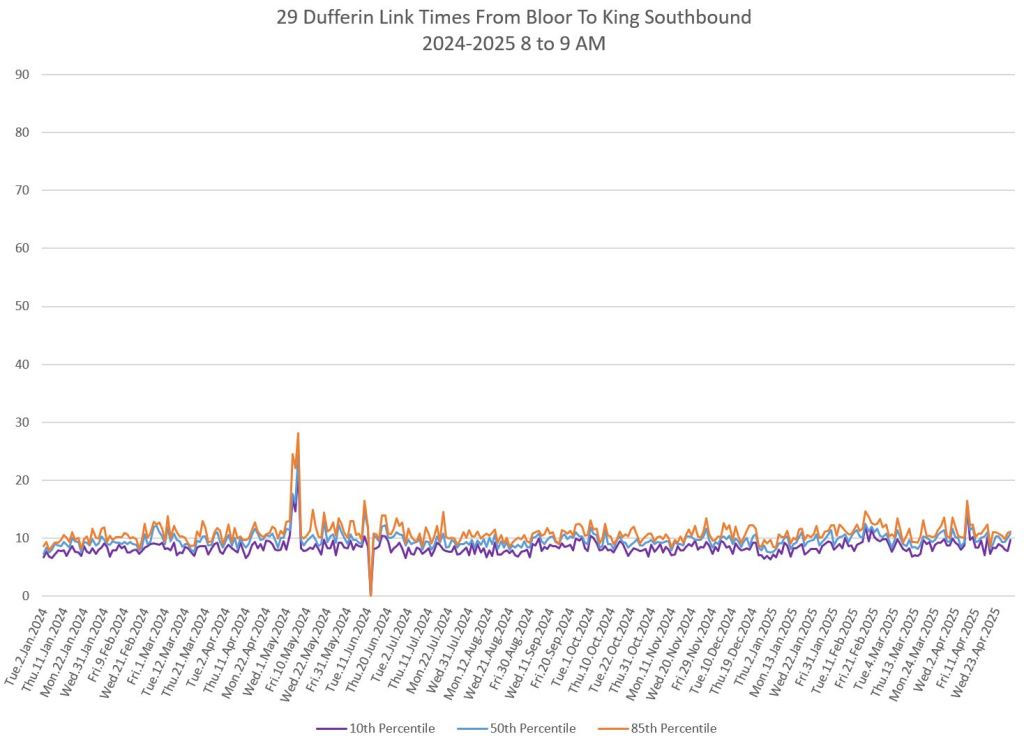
Southbound 8am
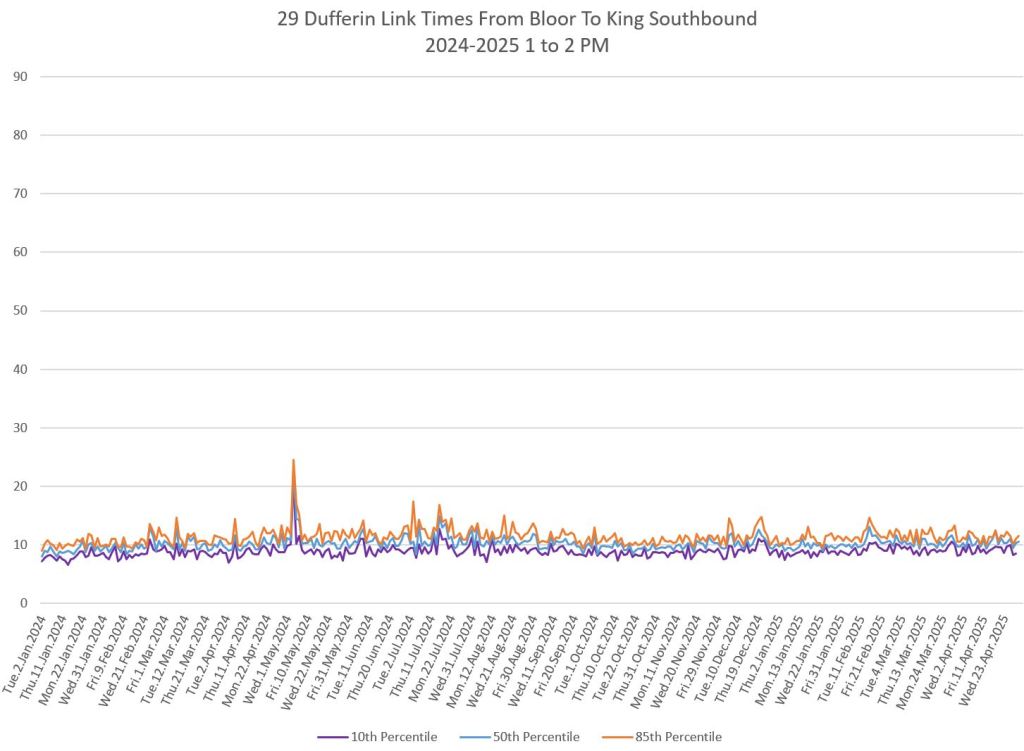
Southbound 1pm
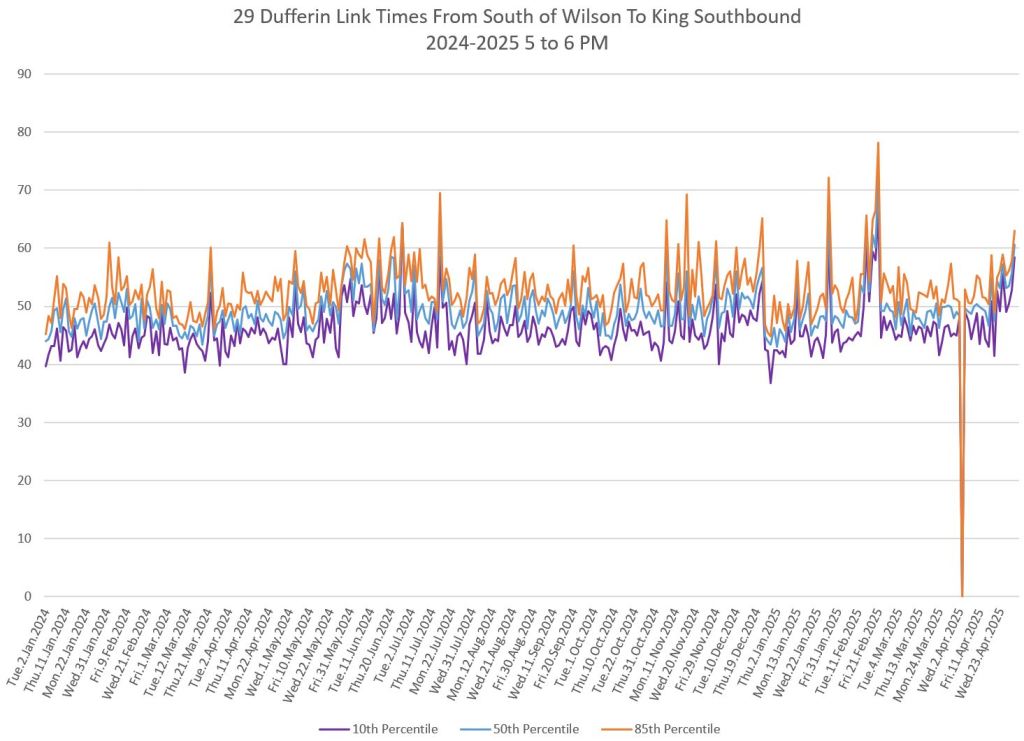
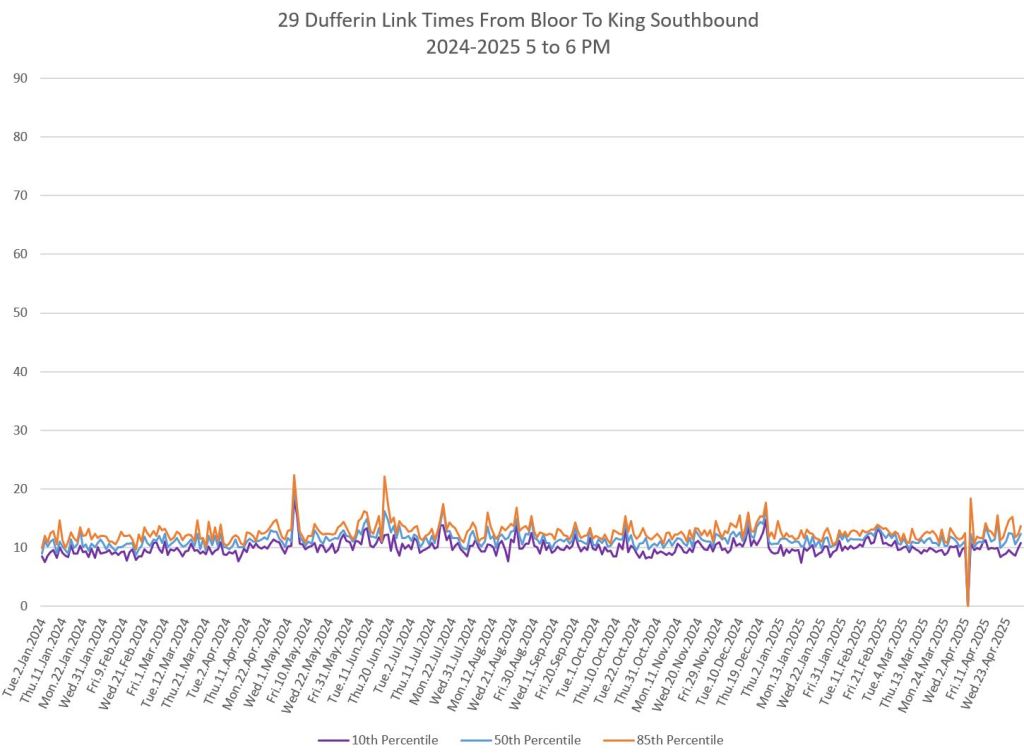
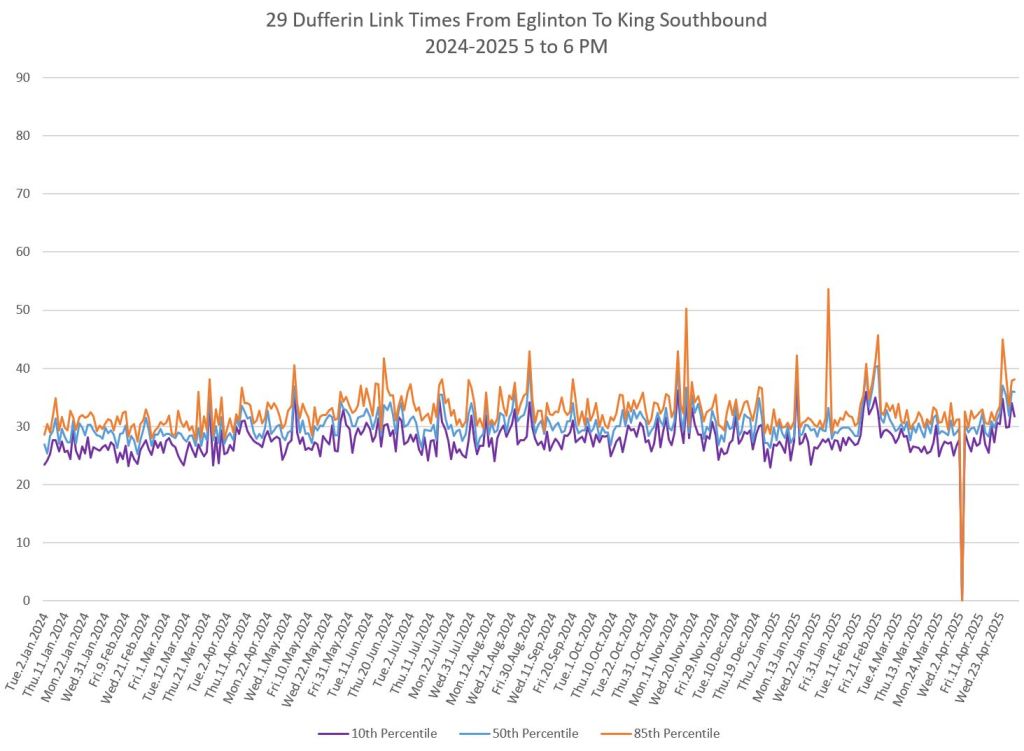
Southbound 5pm
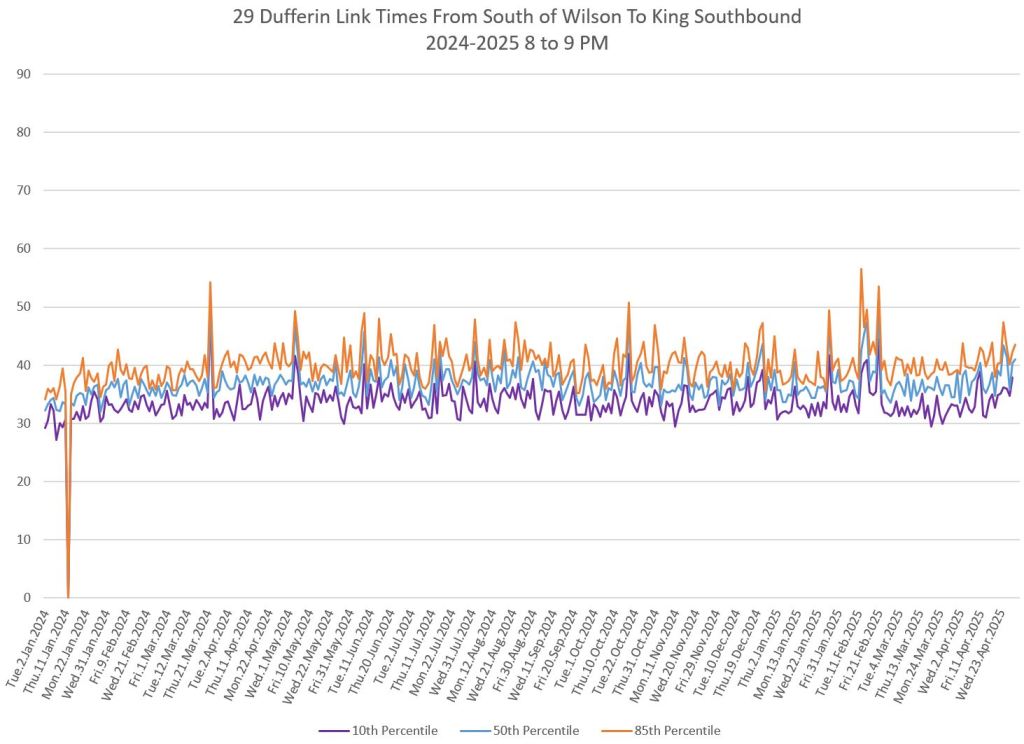
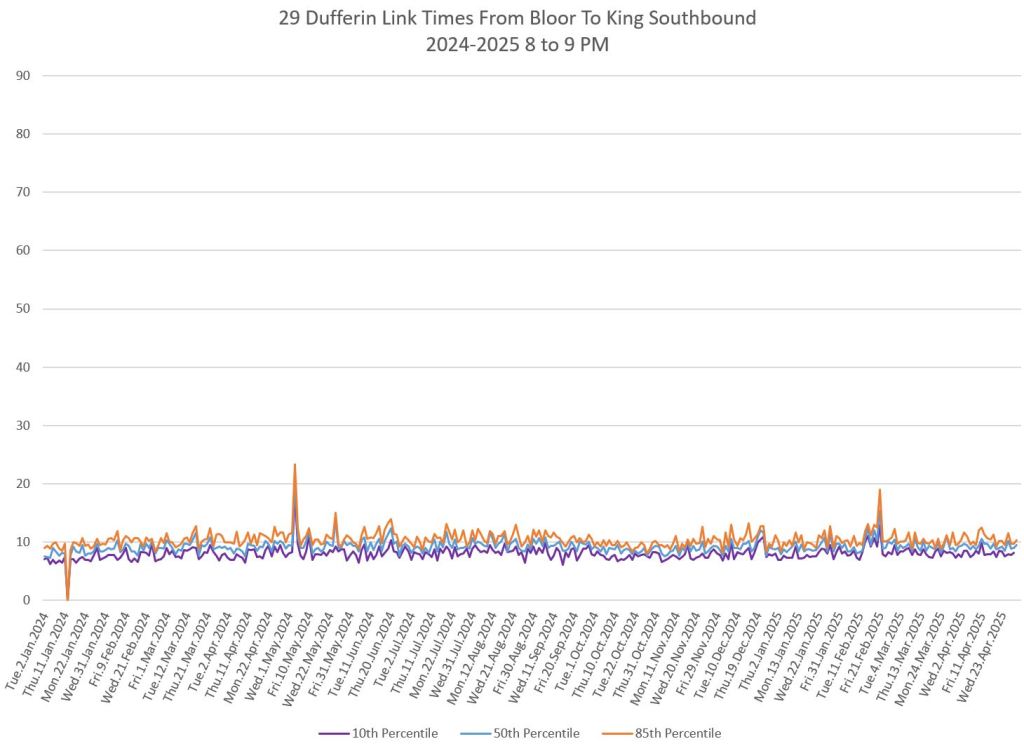
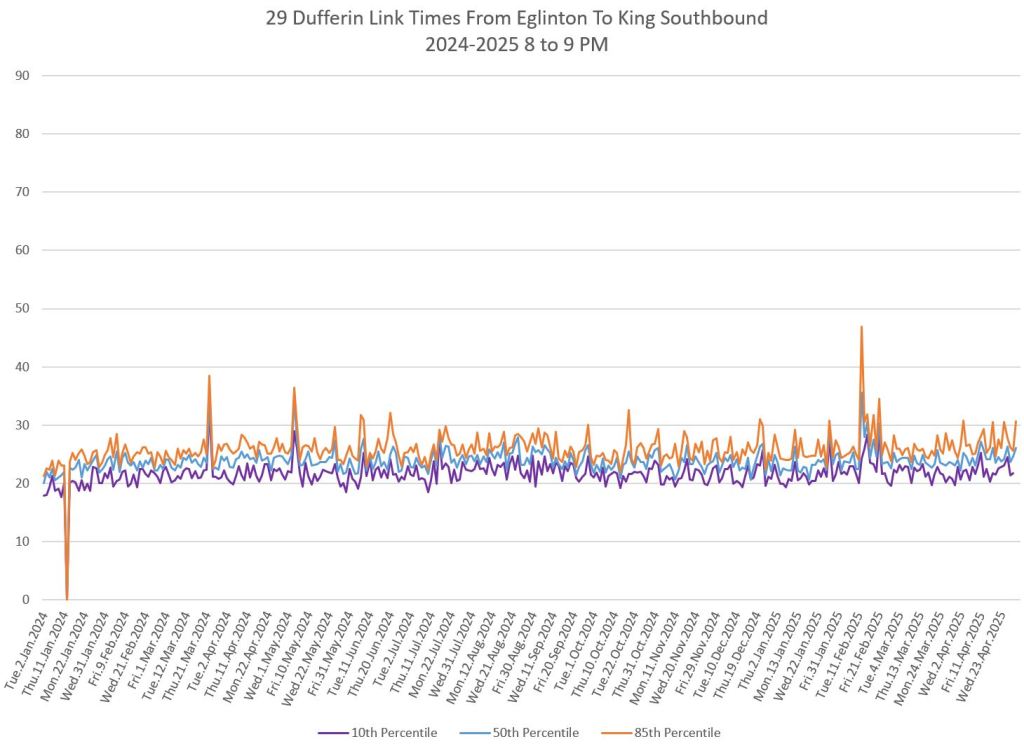
Southbound 8pm
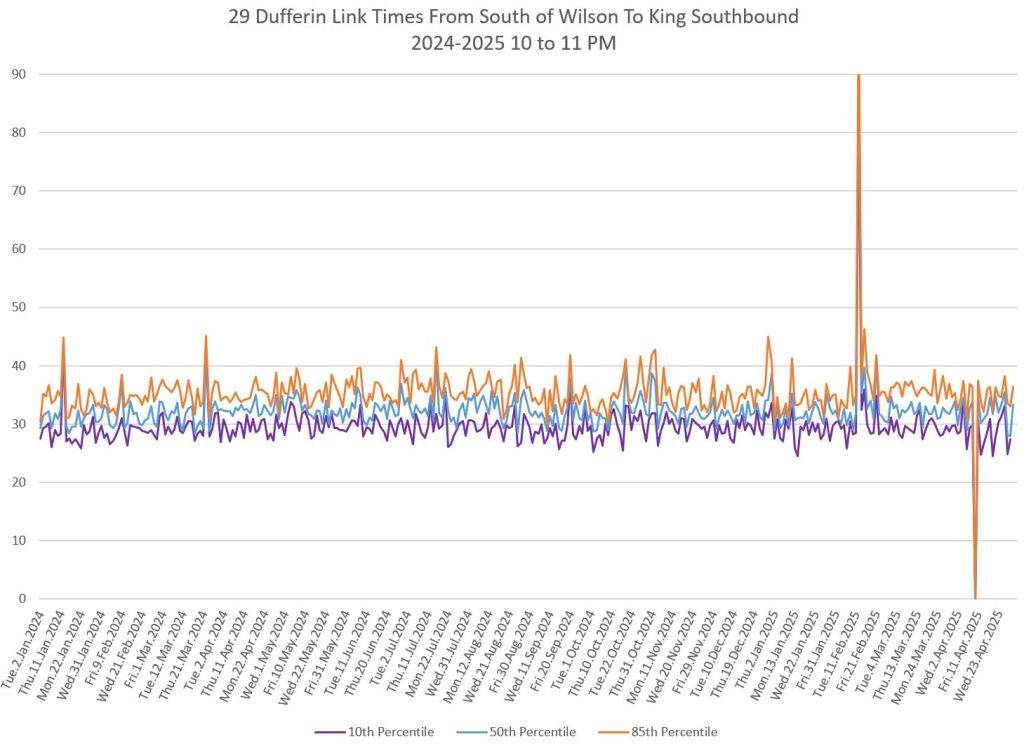
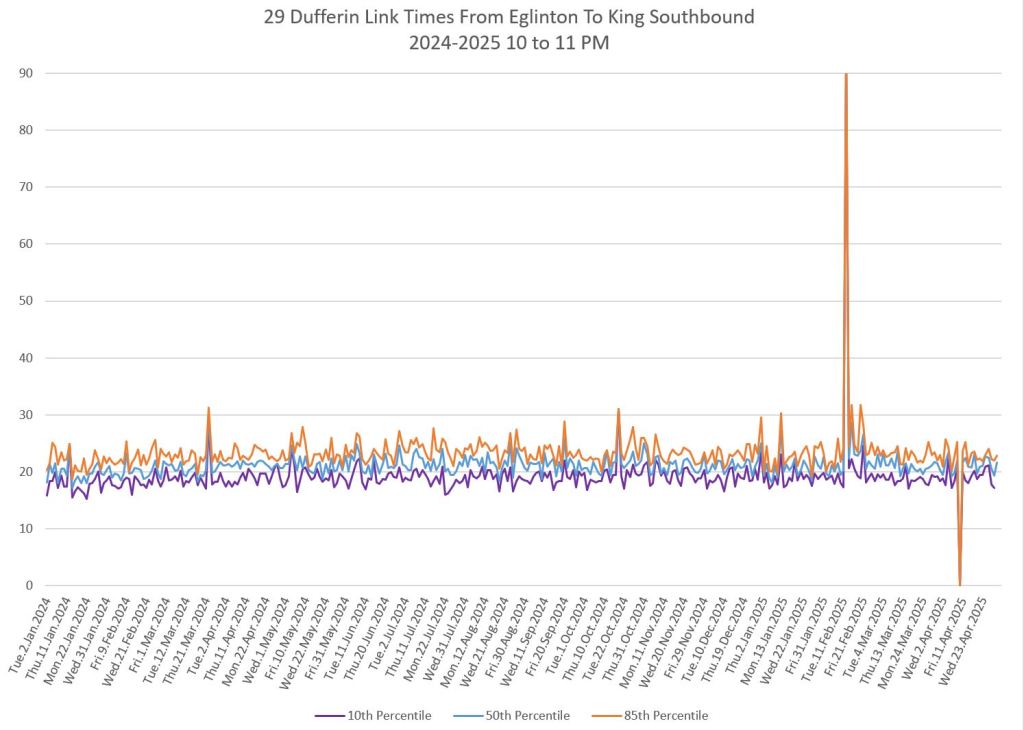
Southbound 10pm
Travel Times
The charts in this section show only the data for the 29 local service. The 929 express data are similar, but I have omitted them as the charts in the headway section show how alike the local and express services are.
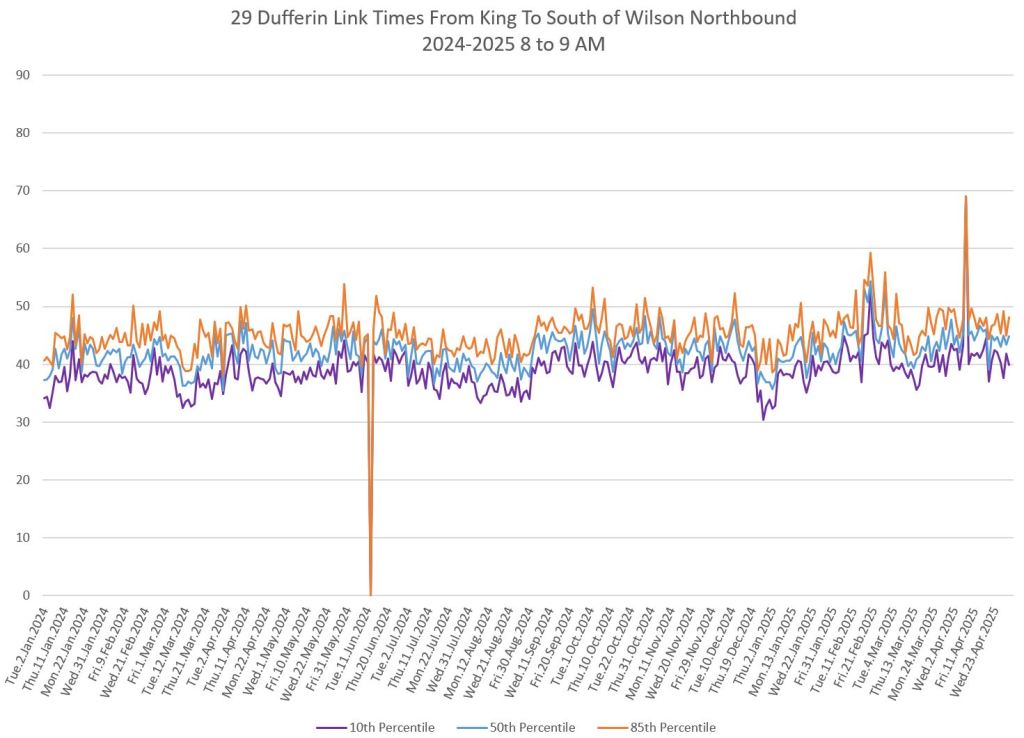
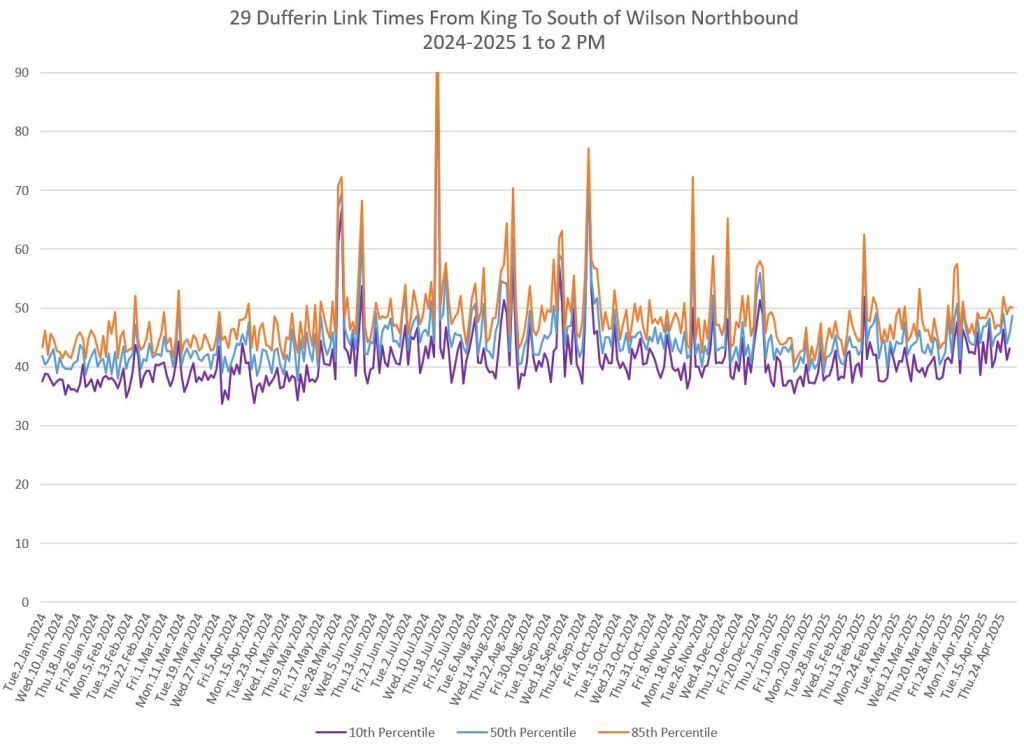
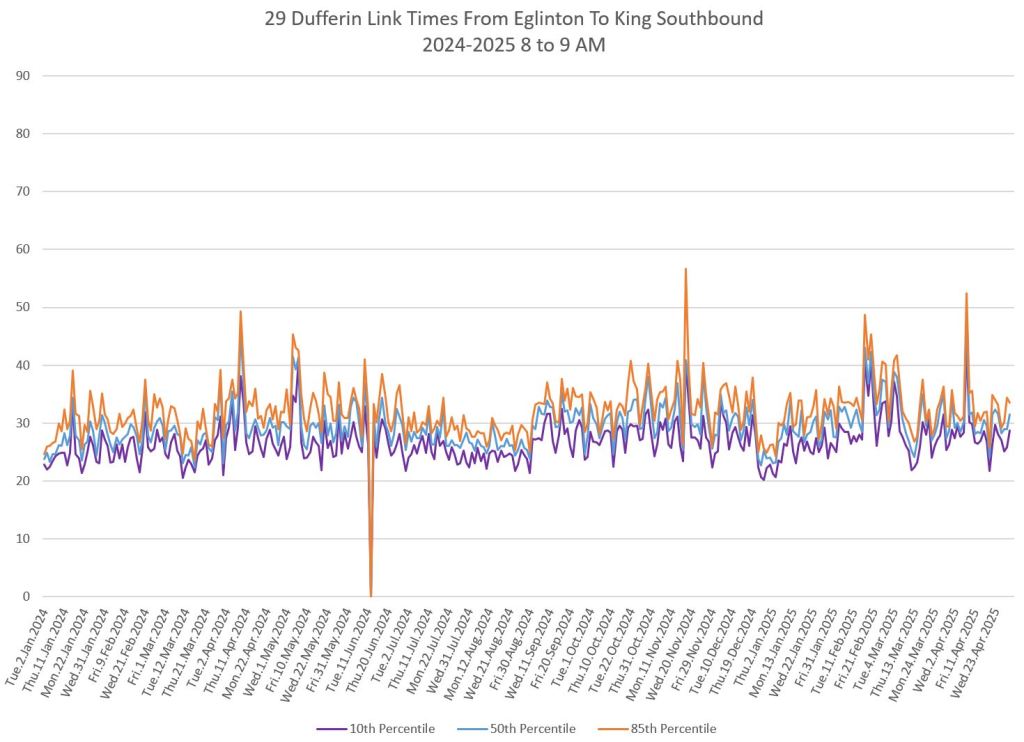
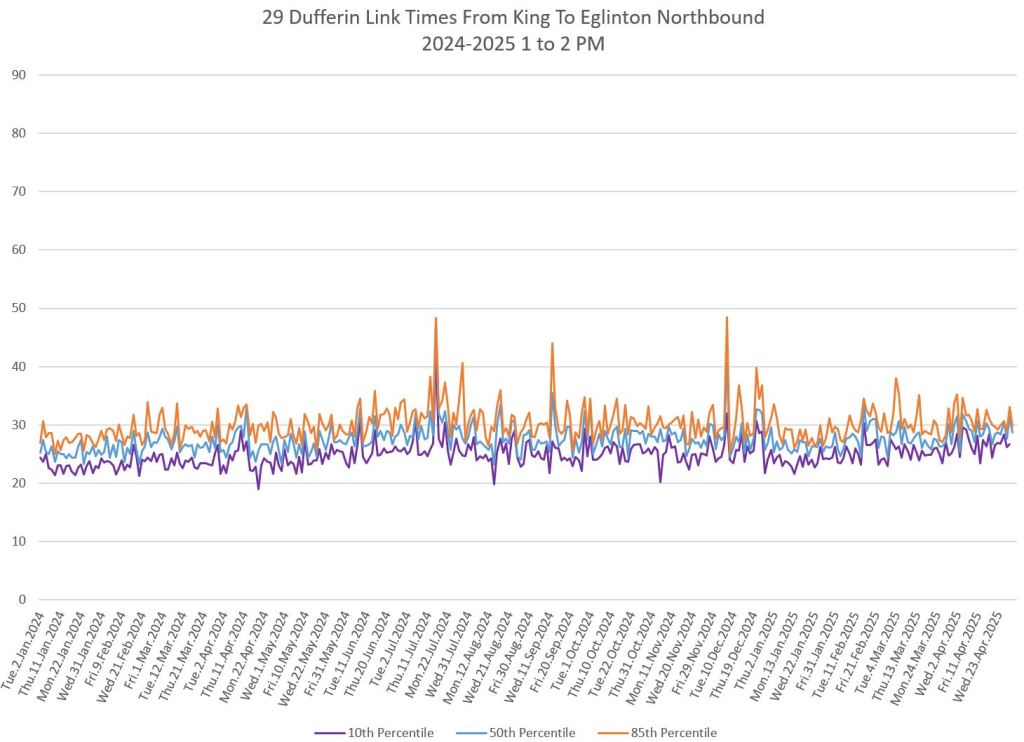
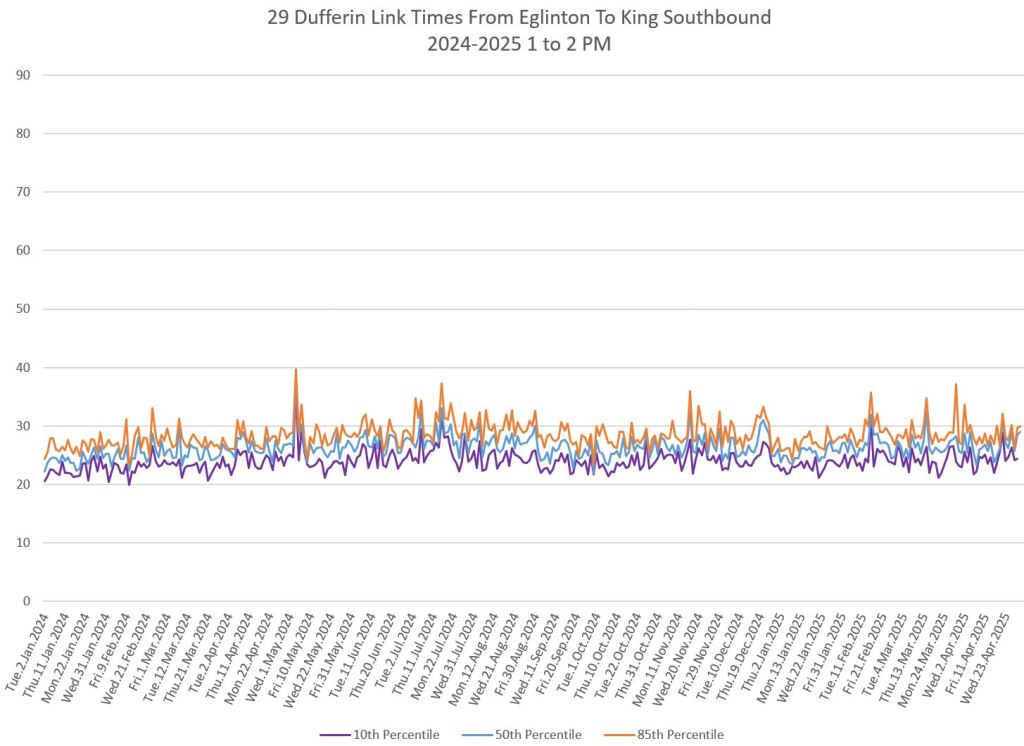
Data for individual segments are presented with northbound service on the left and southbound service on the right. Each row contains data for one time period moving from 8am to 10pm top to bottom.
A few peaks and dips are seasonal such as snow storms (and the extended period following them before roads were fully cleared of snowbanks) and some lull in traffic during summer and Christmas holidays.
Where lines on the charts dip to zero, there was no data.
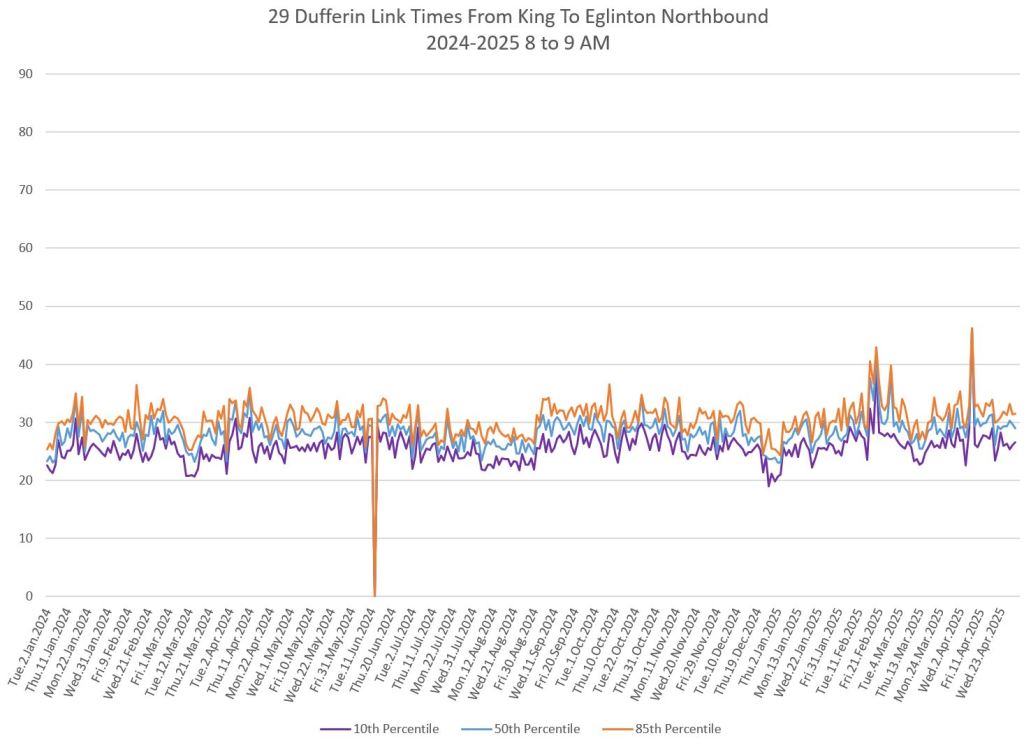
King to Wilson
The times shown here are for the full trip over the main portion of the route.

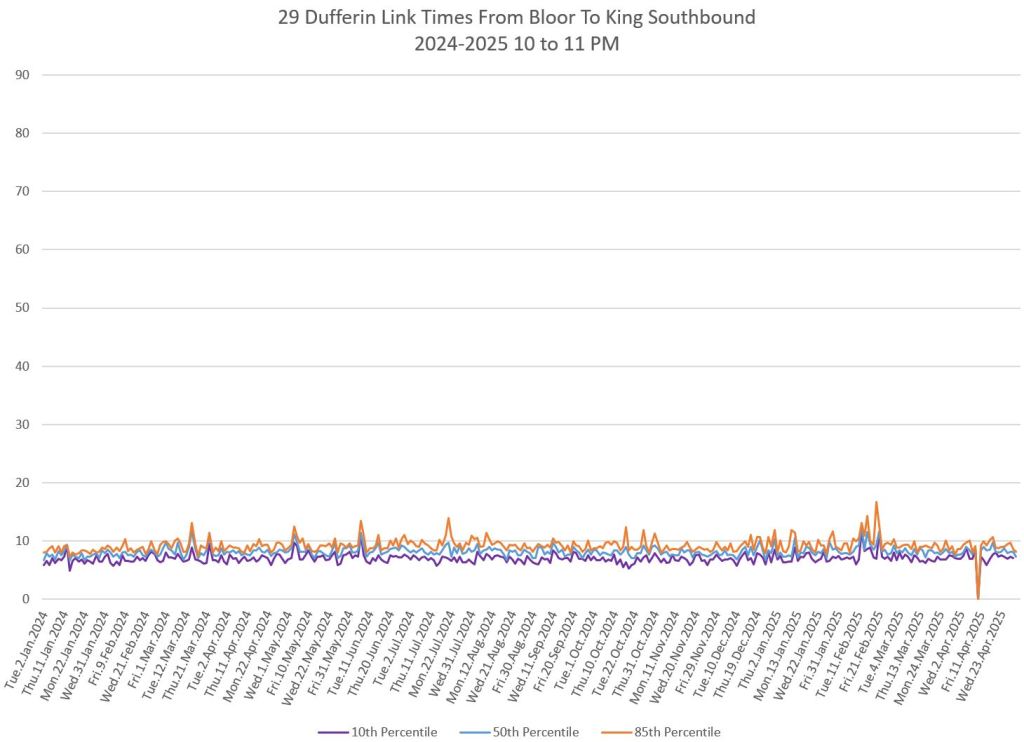
King to Bloor
Travel times between King and Bloor are consistent over the 16 months. Values sit at around 10 minutes except they are higher northbound in the PM peak, and lower in the late evening.
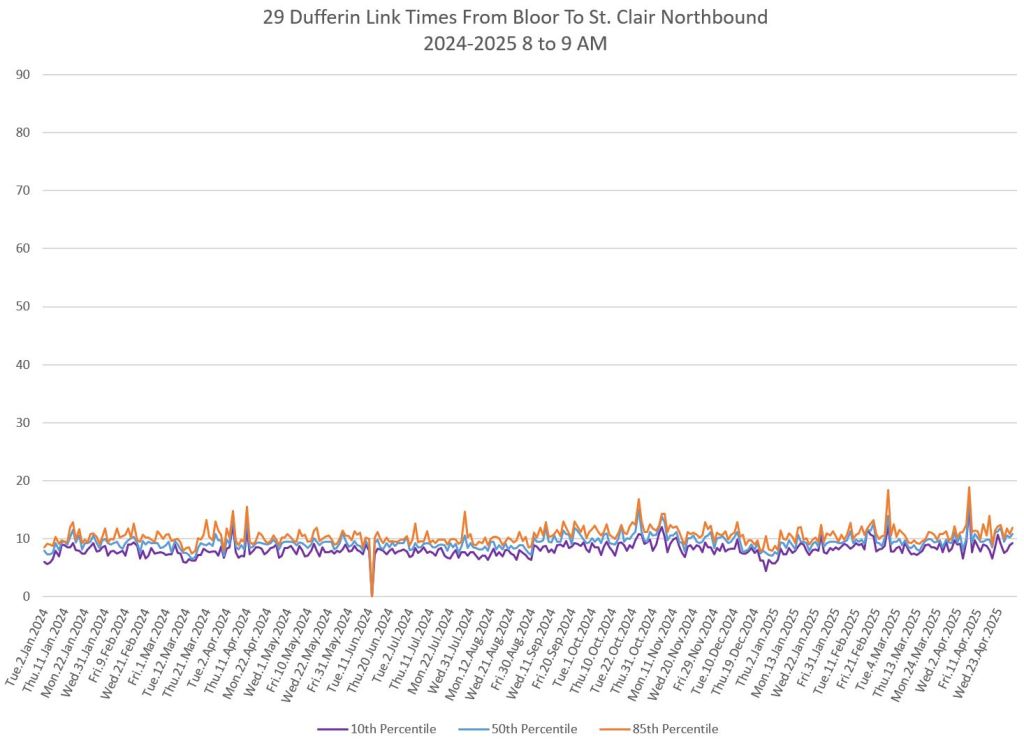
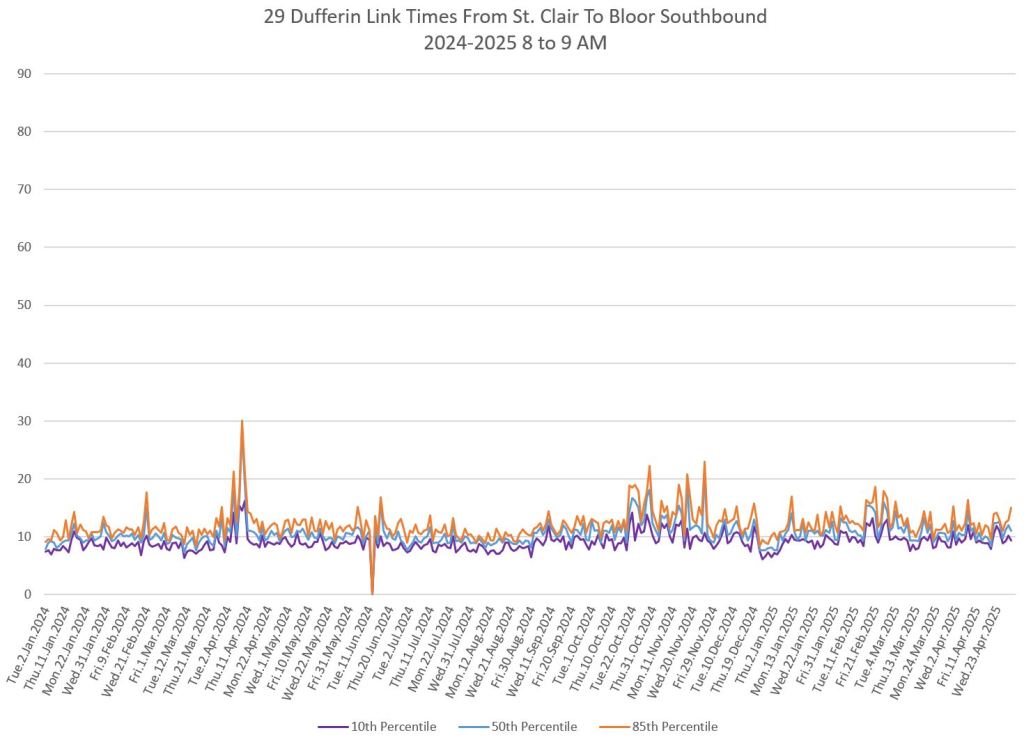
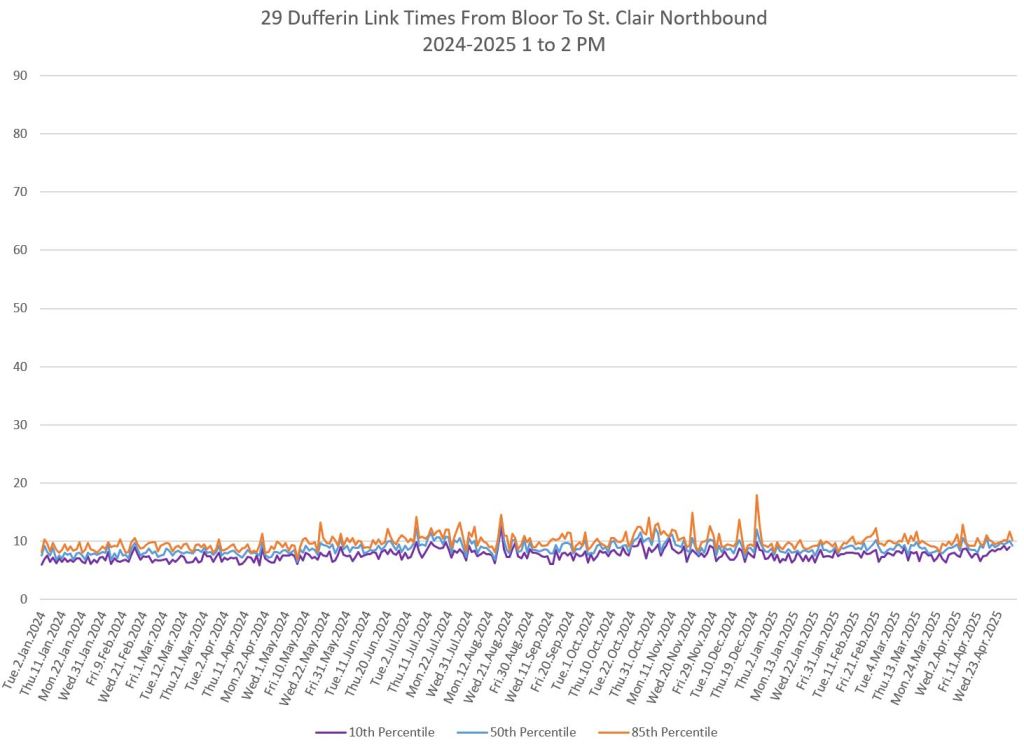
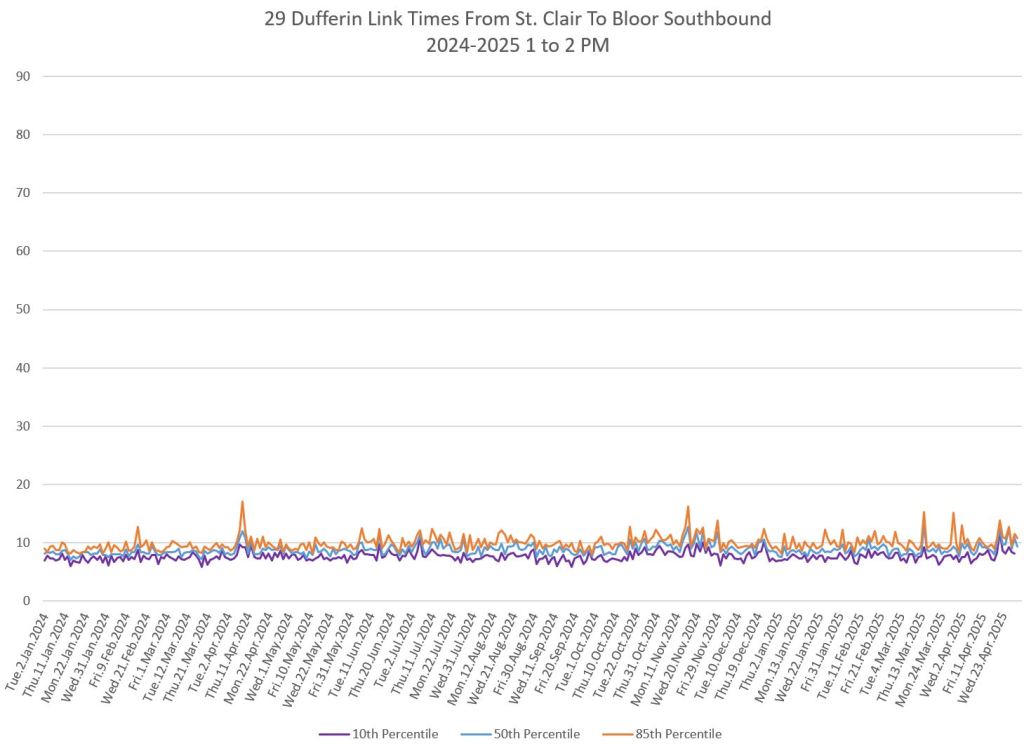
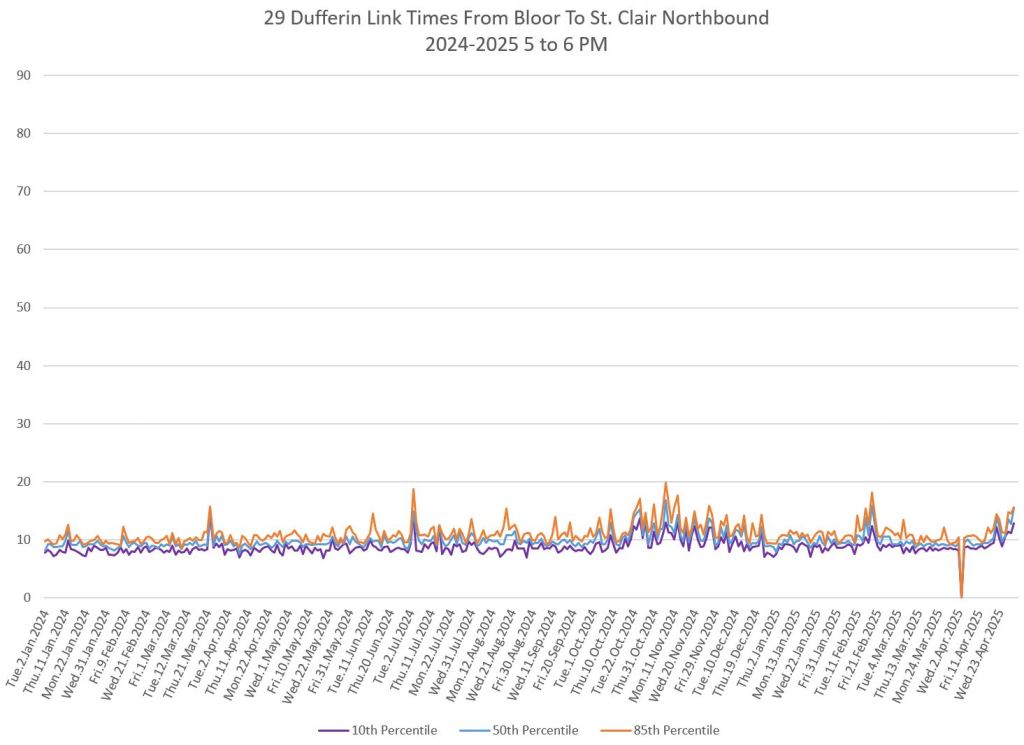
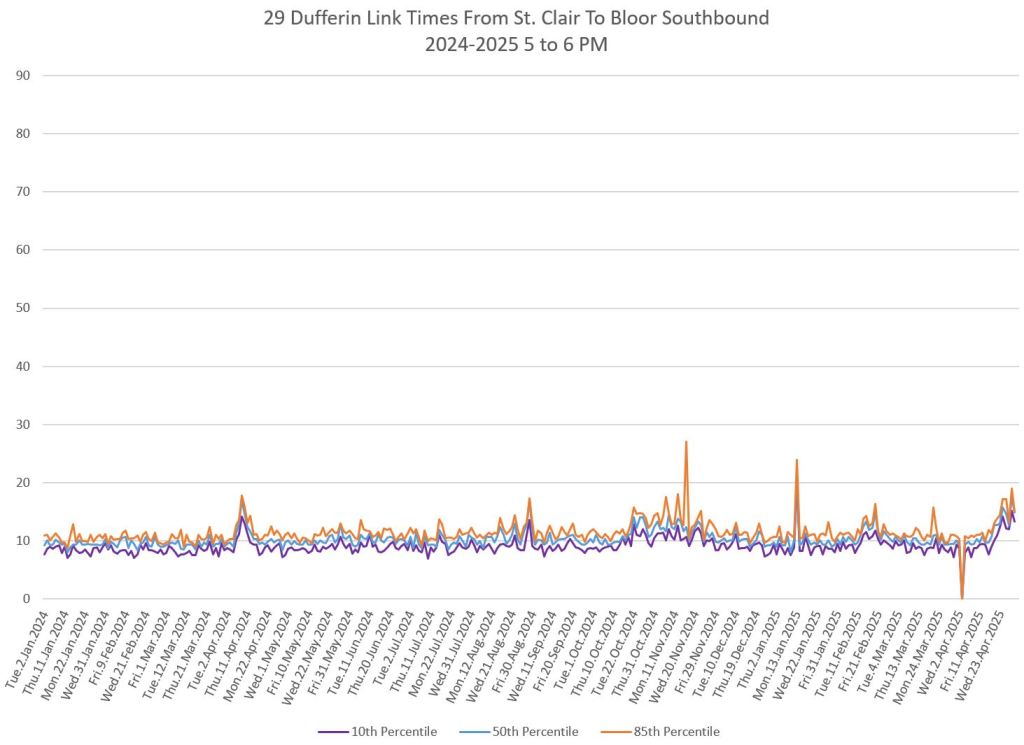
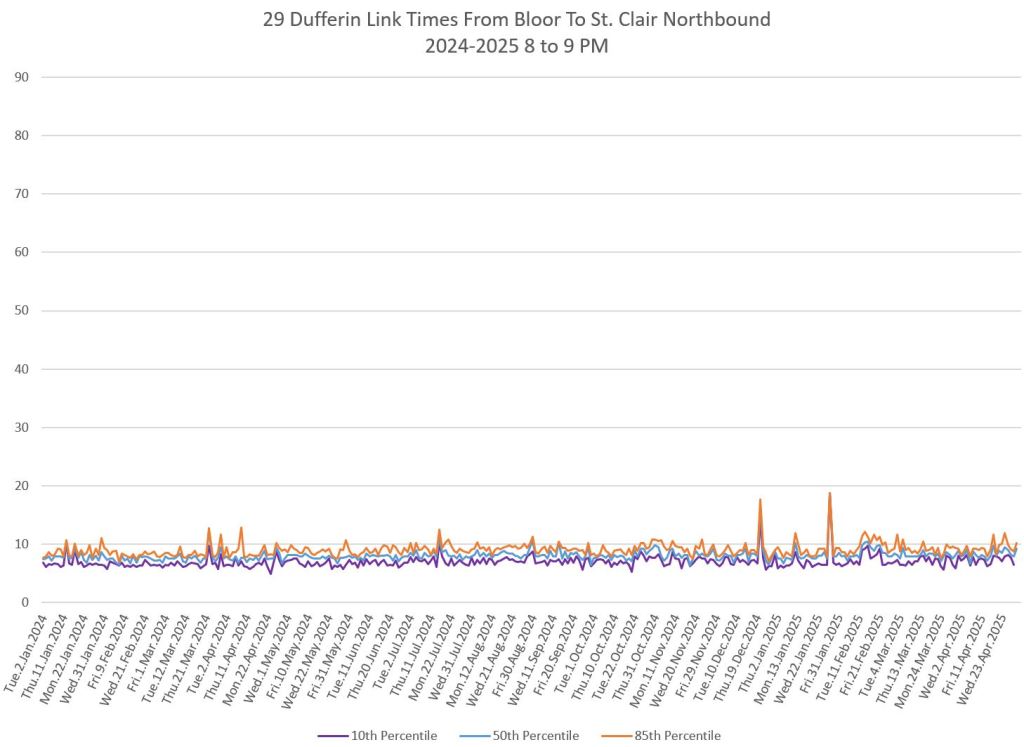
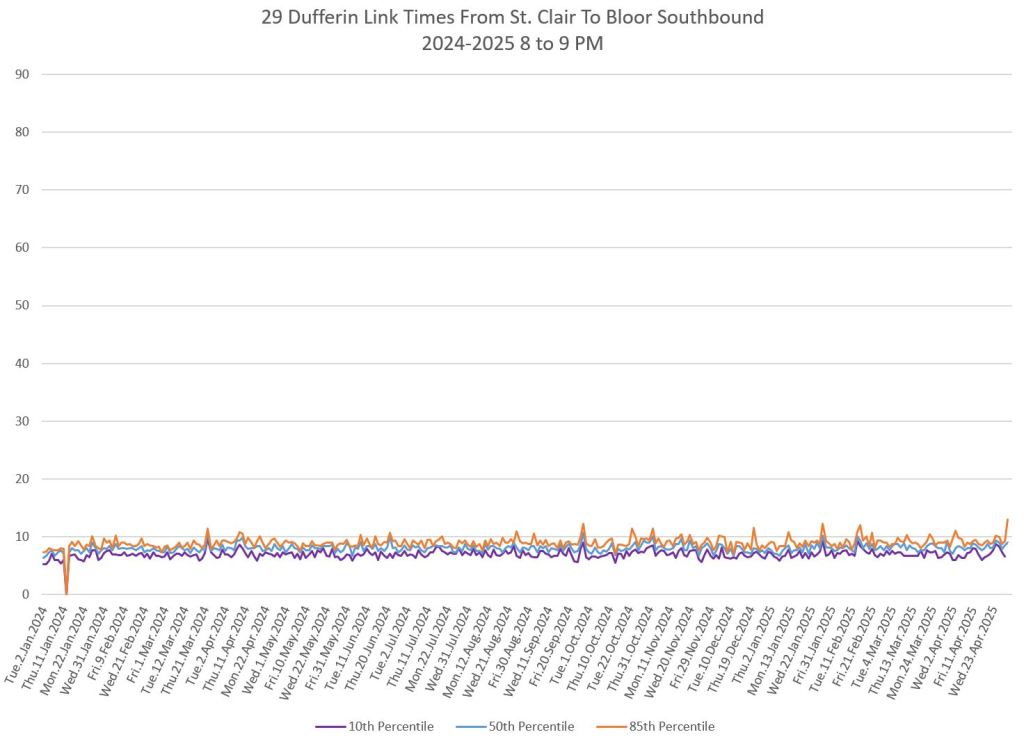
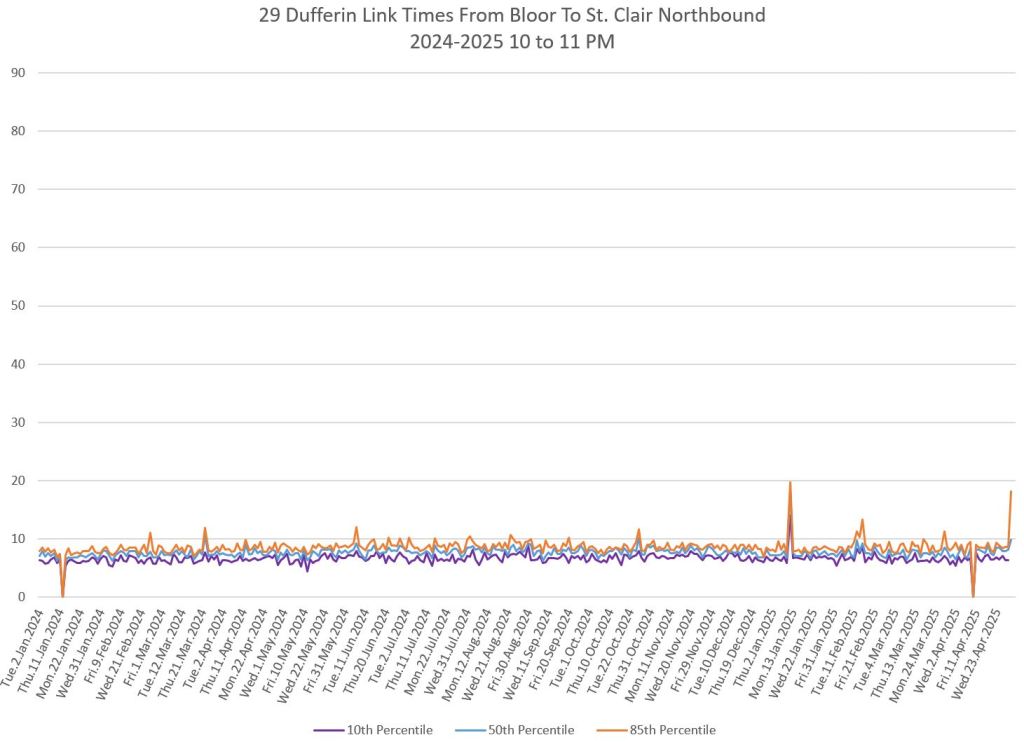
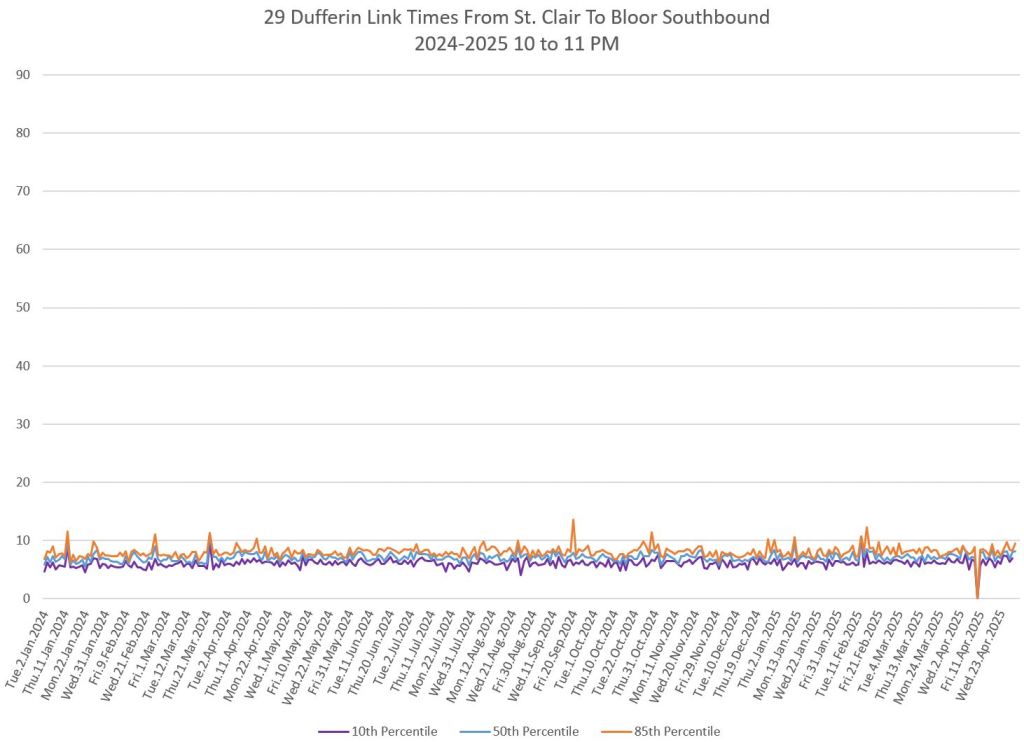
Bloor to St. Clair
The segment from Bloor to St. Clair shows some variation in travel times during peak periods. Some effect is visible from snow accumulation in 2025. Note, however, that if service is completely blocked, there are no travel times to report.
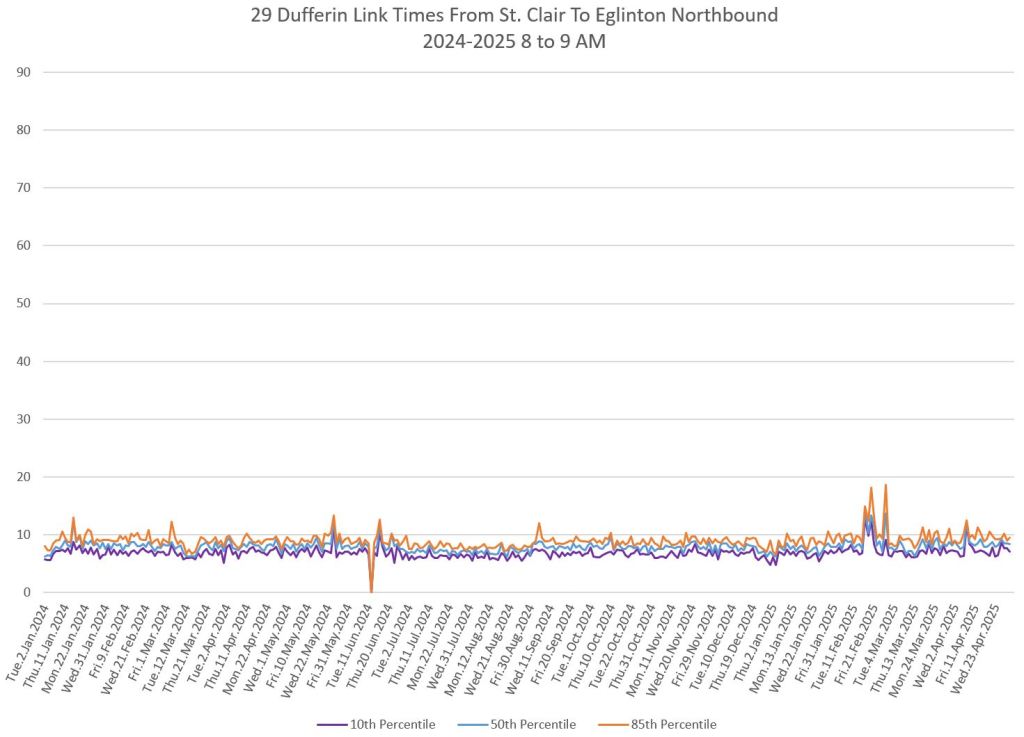
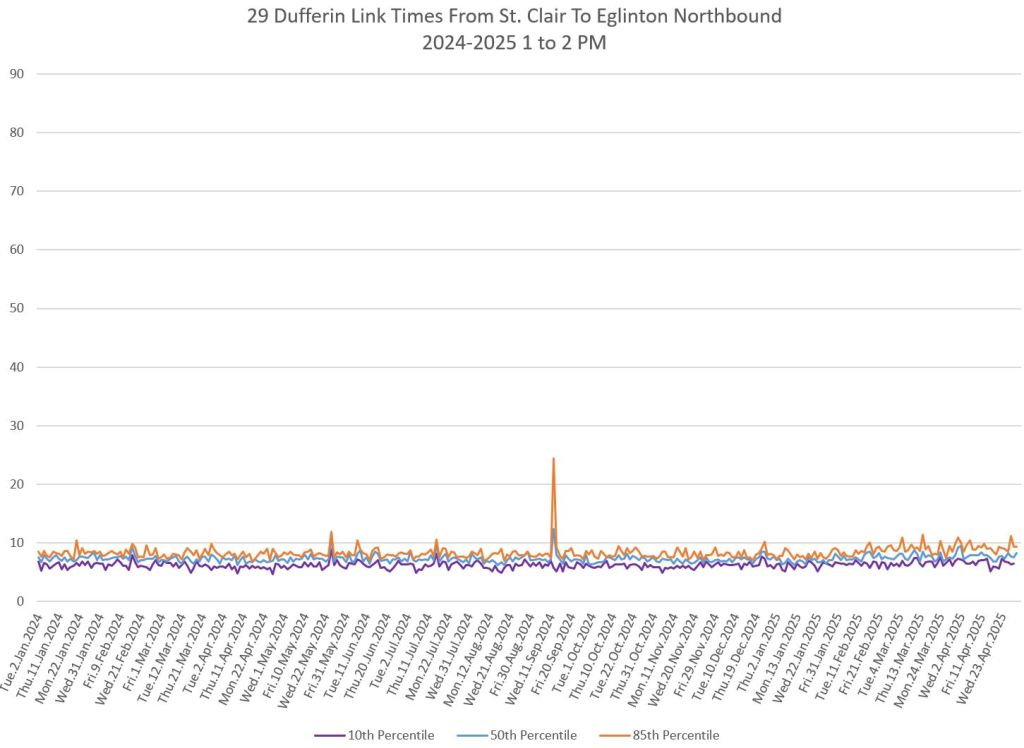
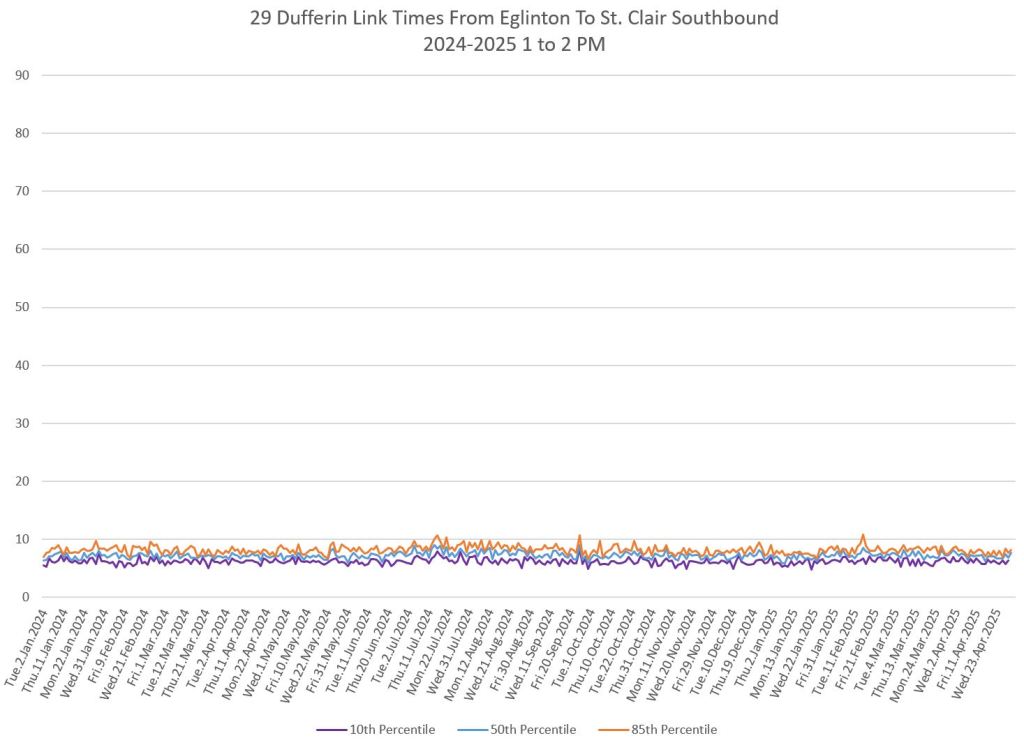
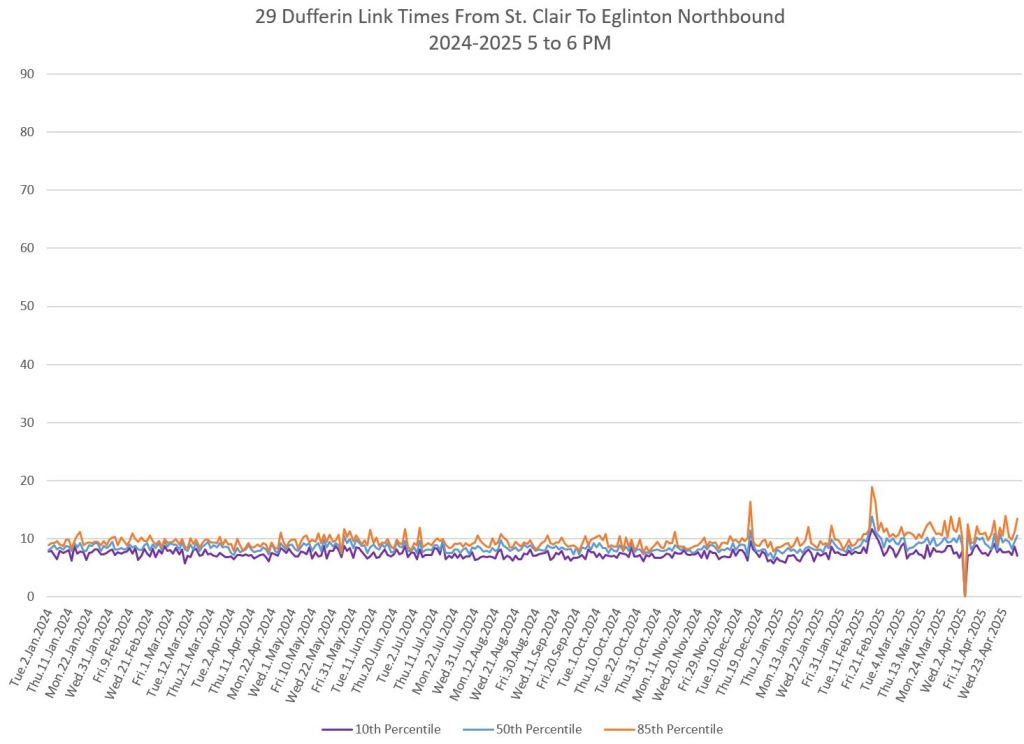
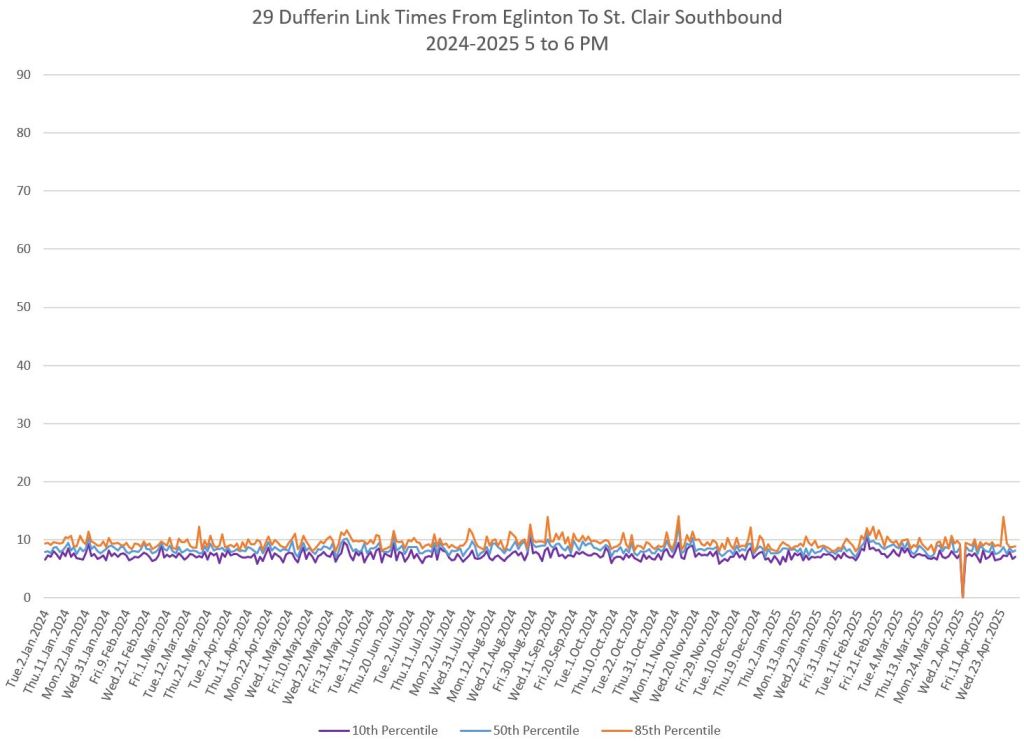
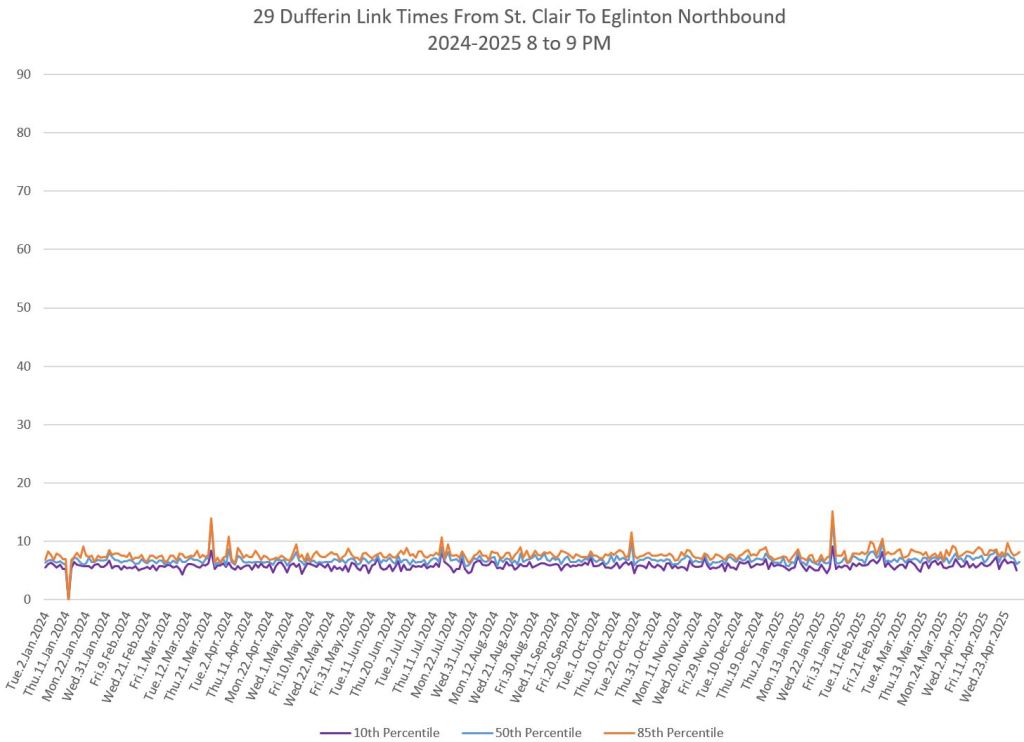
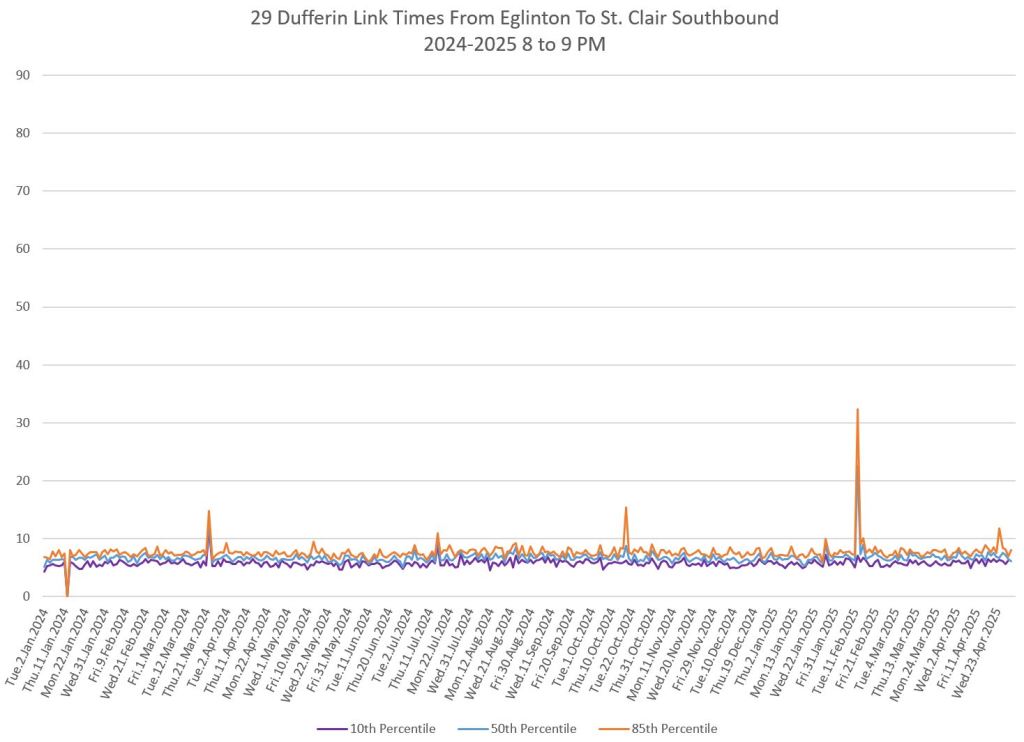
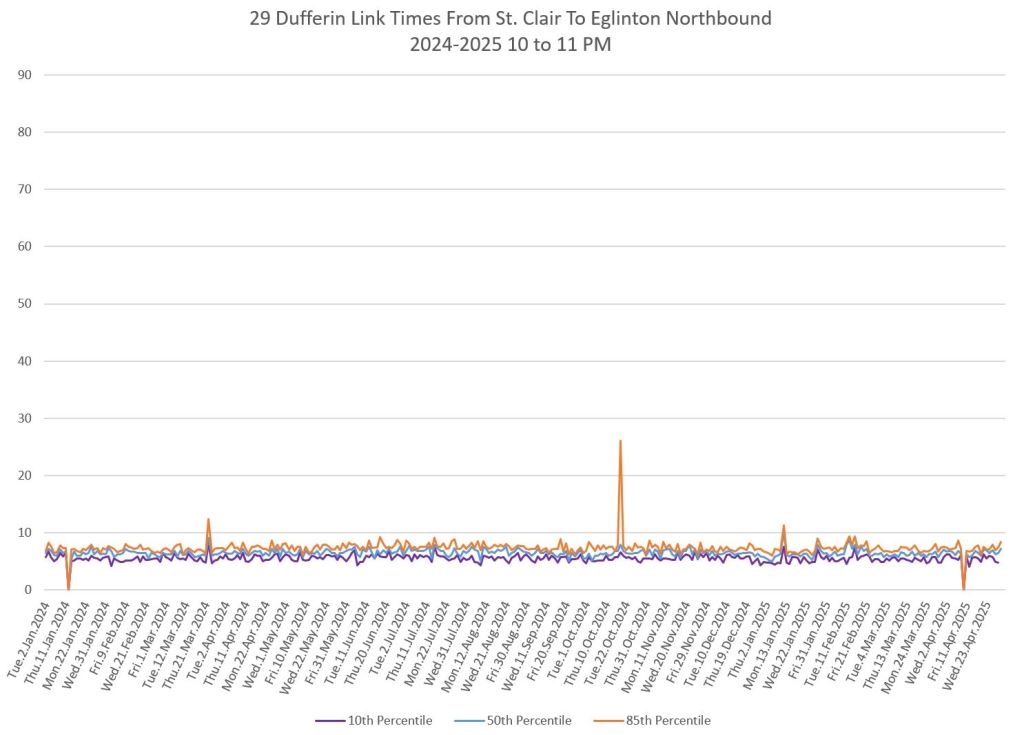
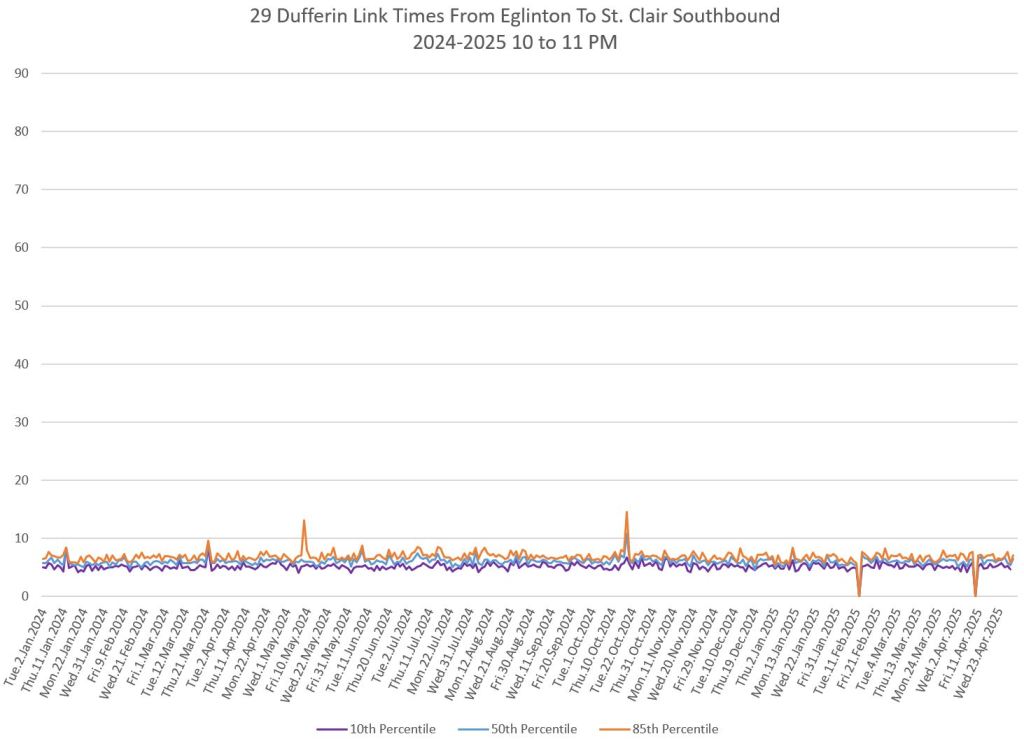
St. Clair to Eglinton
St. Clair to Eglinton travel times are consistent at 8 to 10 minutes depending on the time of day. They rise in 2025 due to snow.

King to Eglinton
These charts show the travel times over the area where RapidTO bus lanes are proposed. The primary benefit is expected to be that peak travel times would be reduced closer to off peak values, but this would not be an all-day benefit.
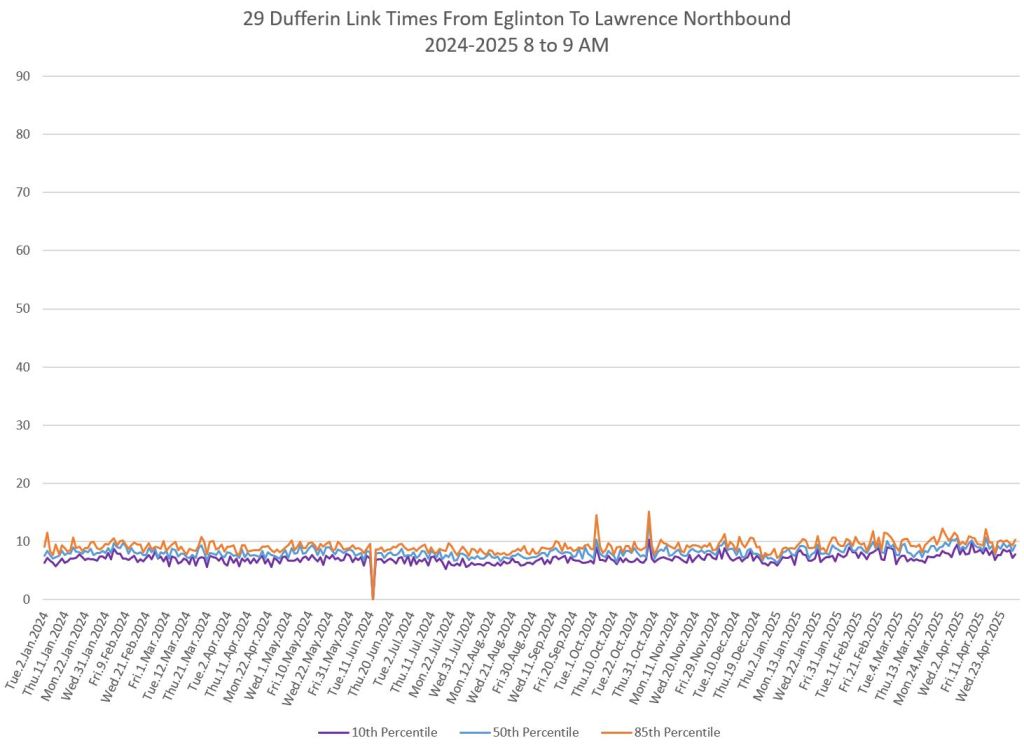
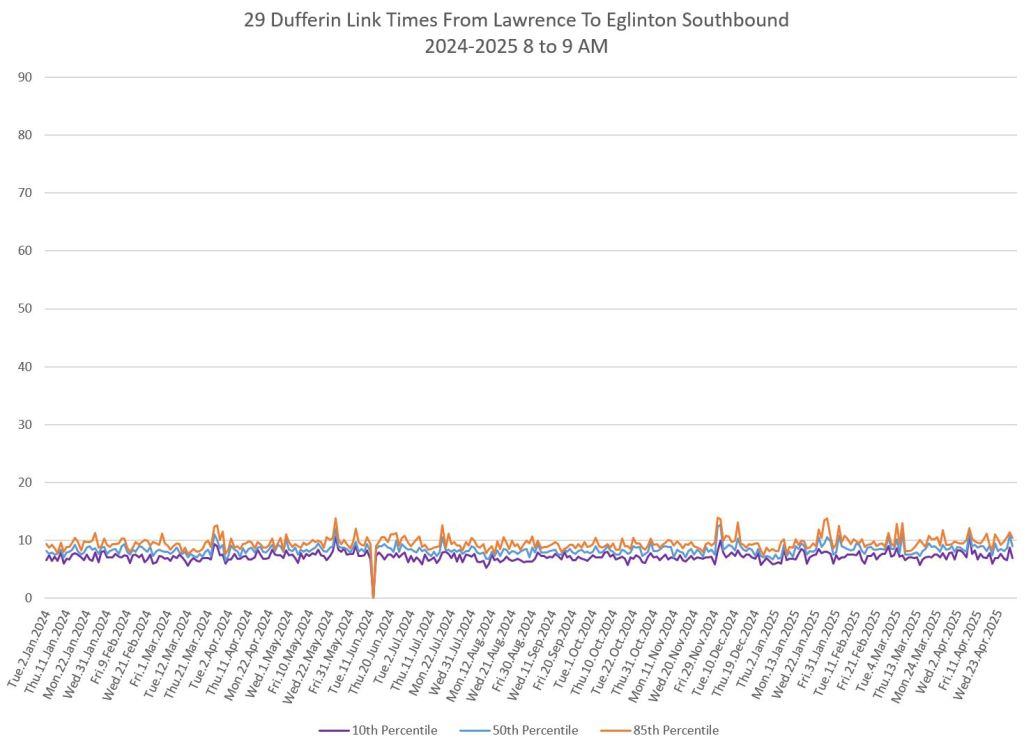
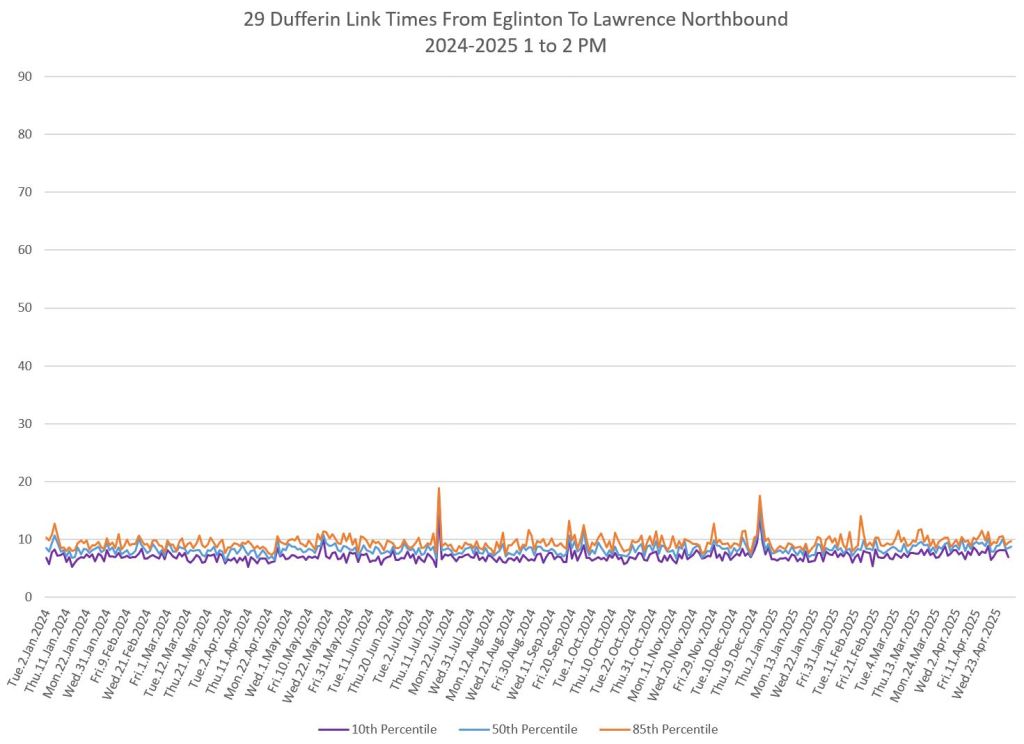
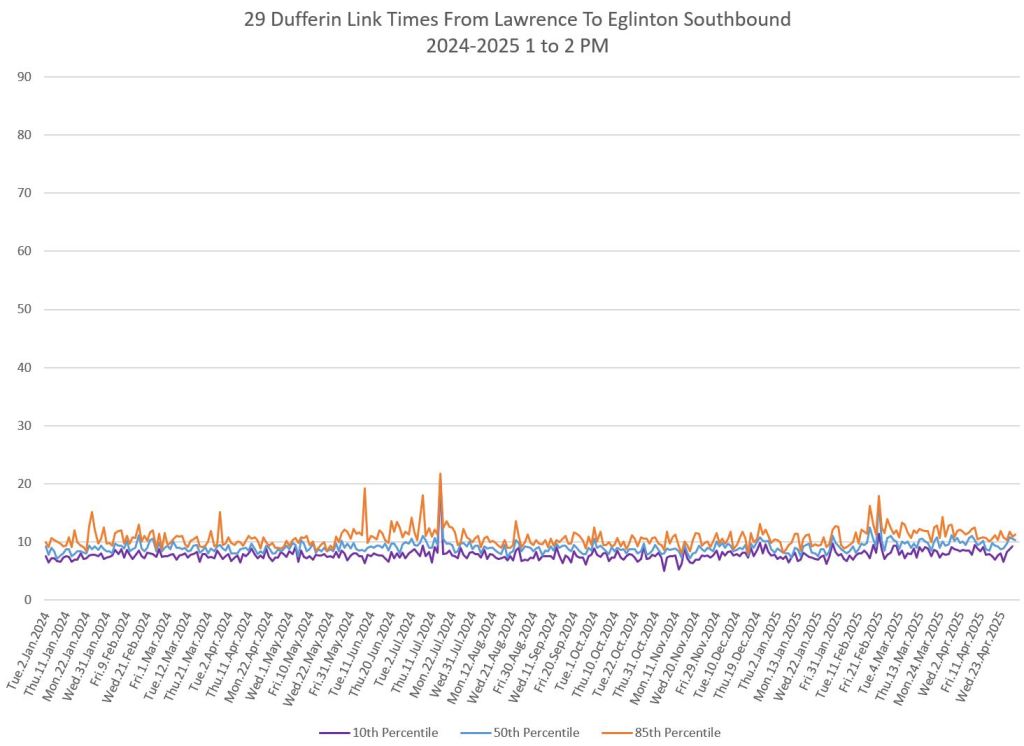
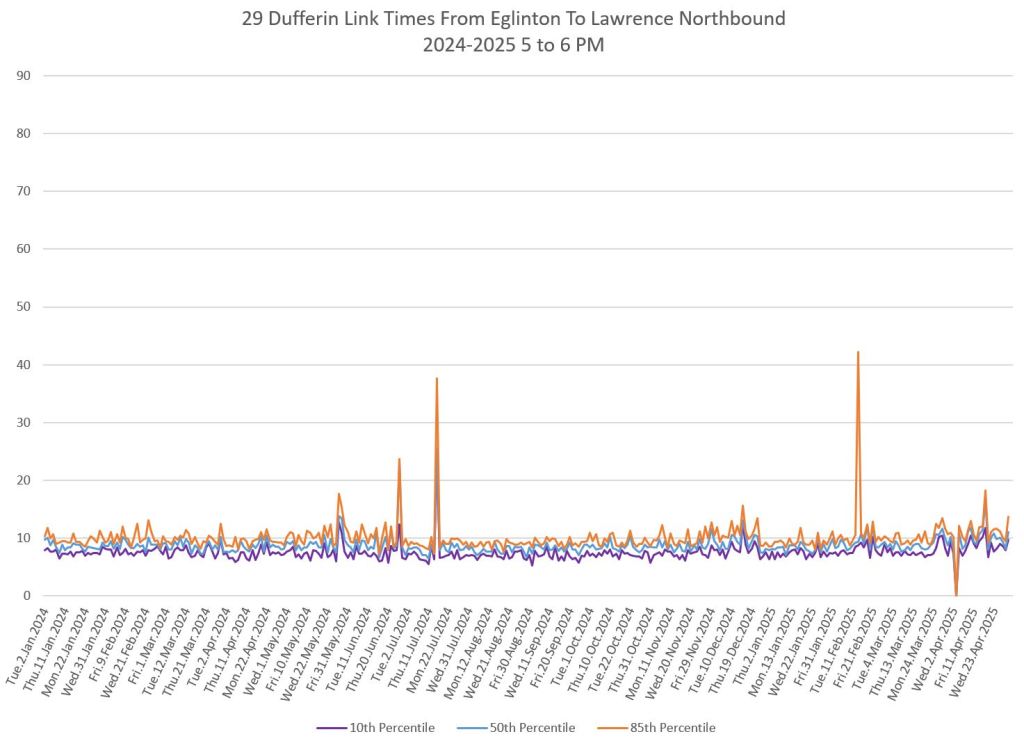
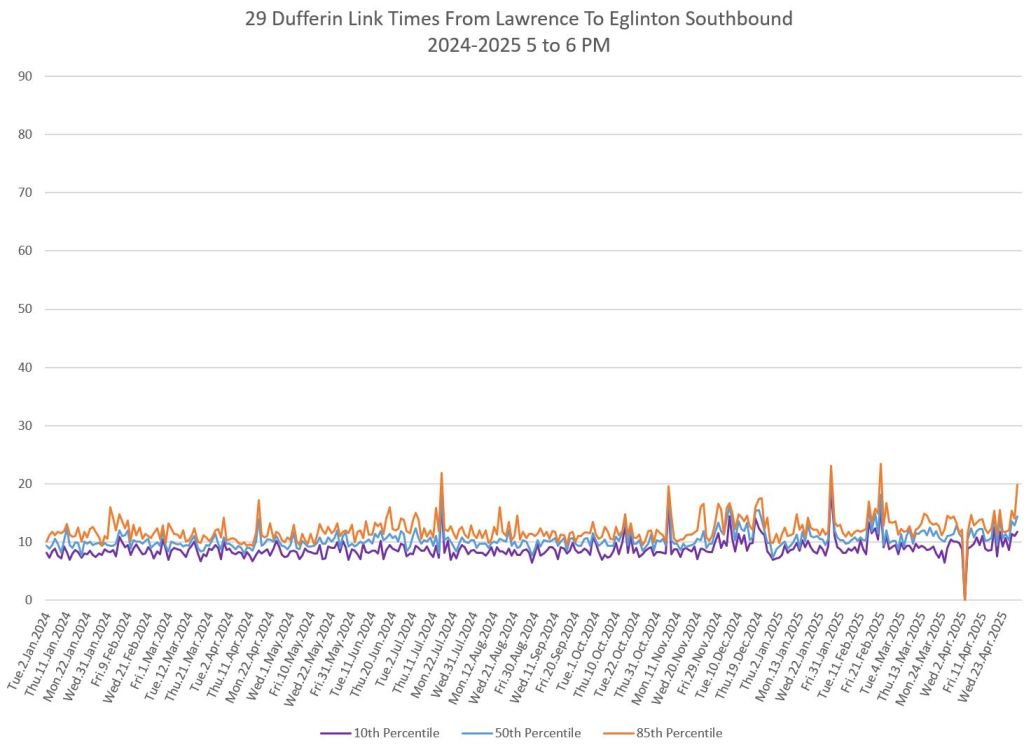
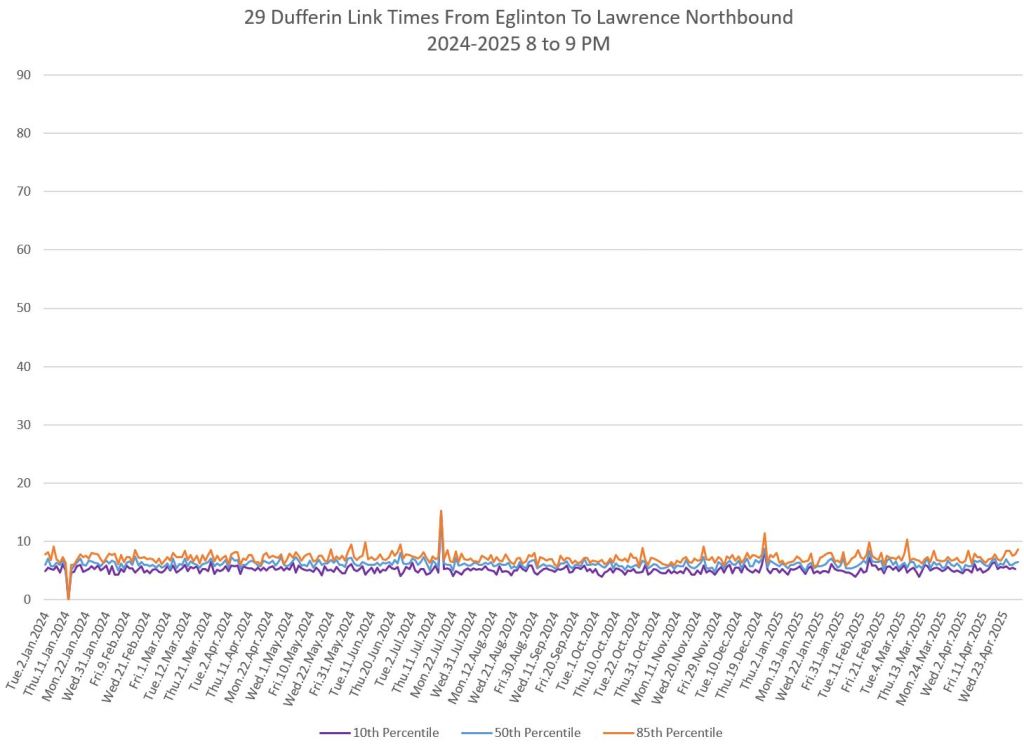
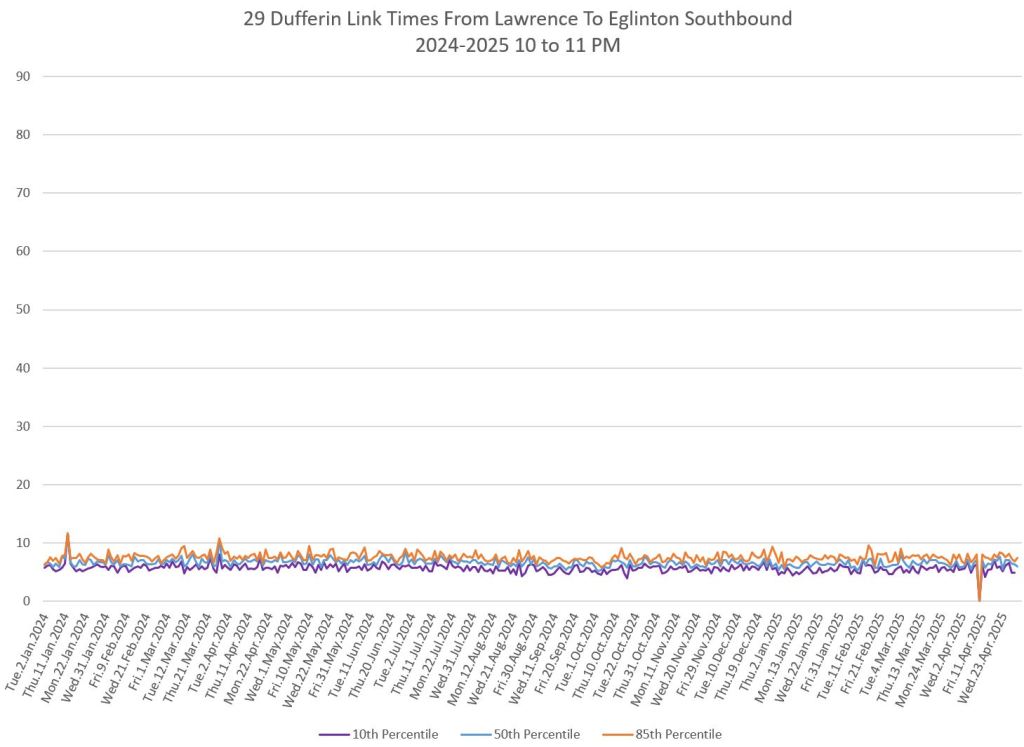
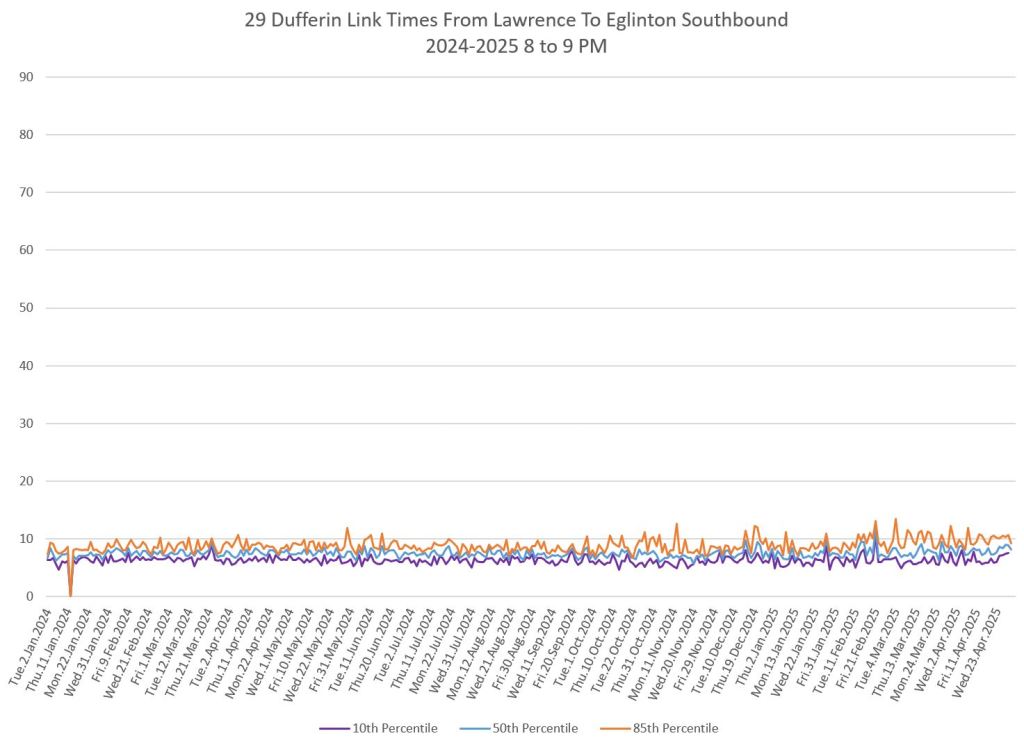
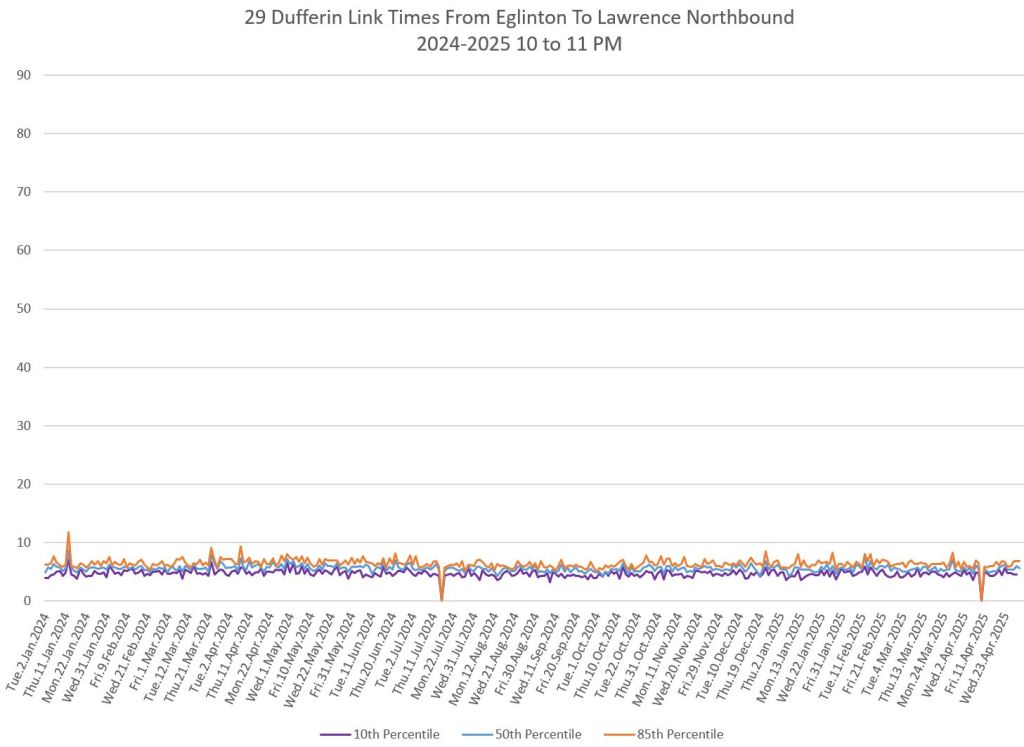
Eglinton to Lawrence
Between Eglinton and Lawrence, there is little change in travel times bothways over the 16 months, and about 2 minutes difference between peak and late evening. Note also how the three lines in the charts are close together showing that there is only a small variation within data for each day.
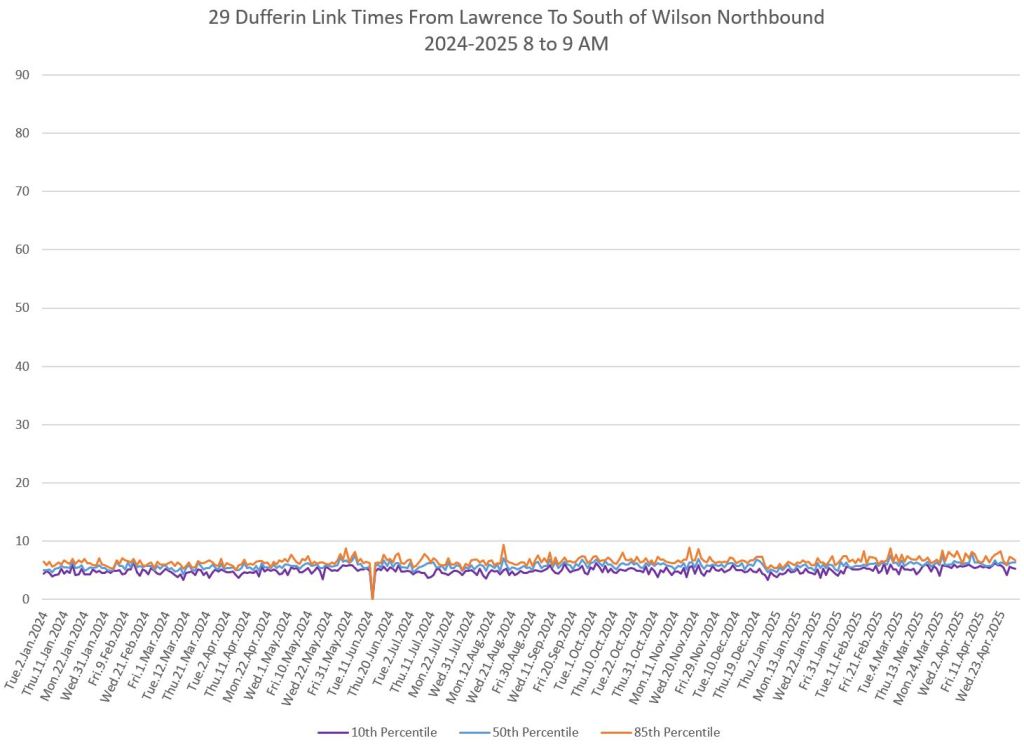
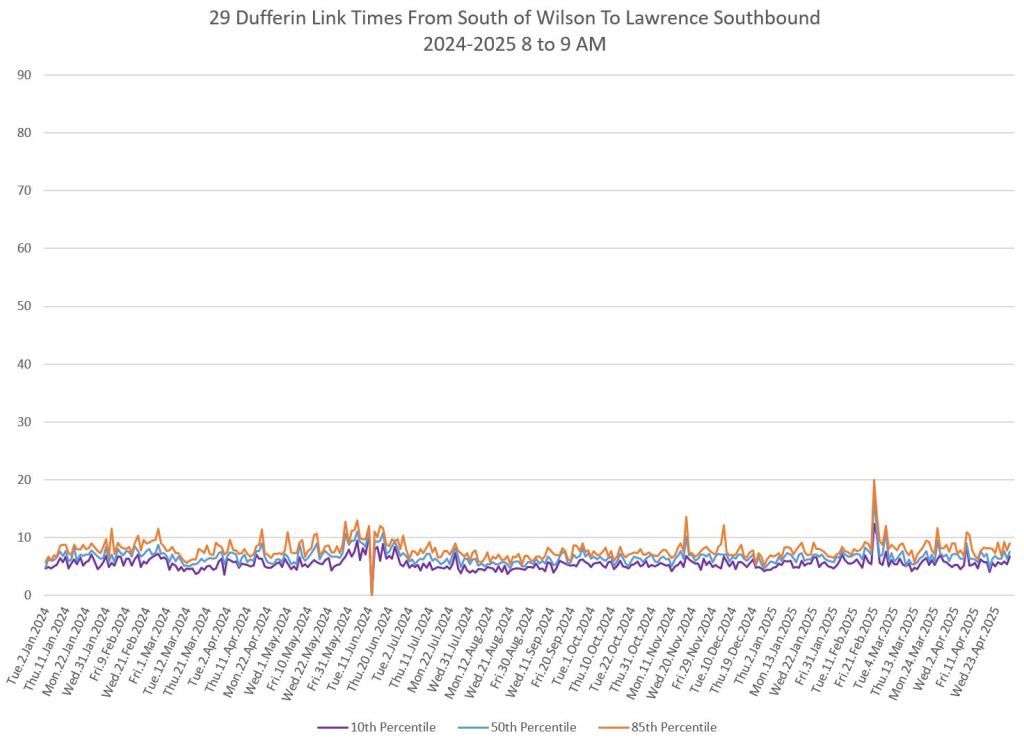
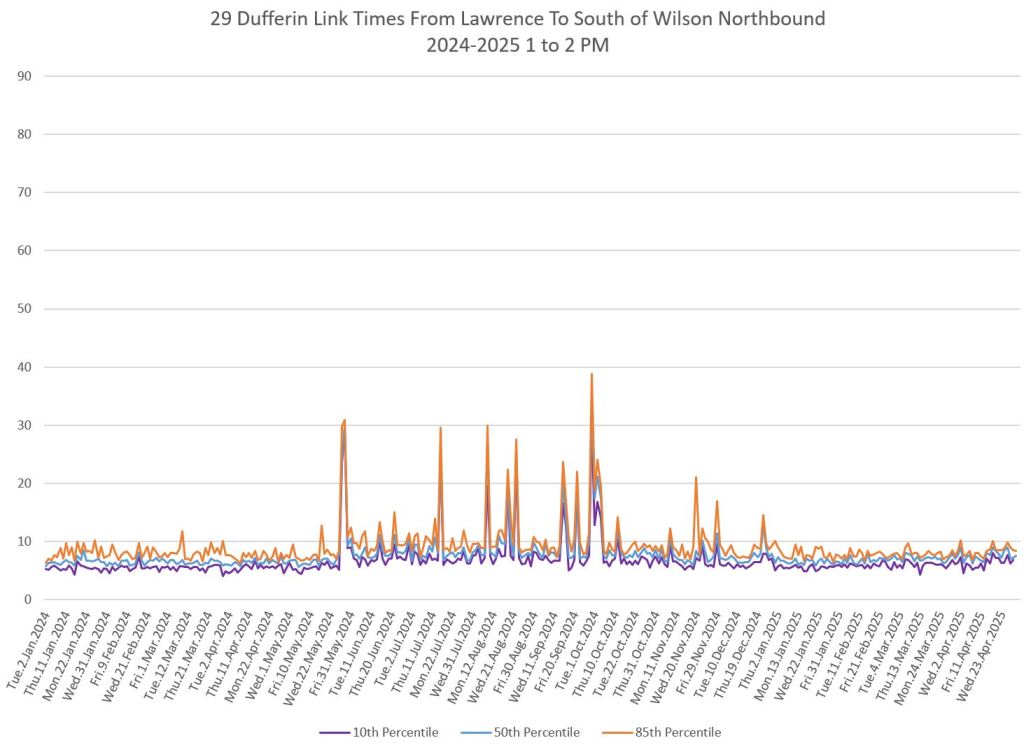
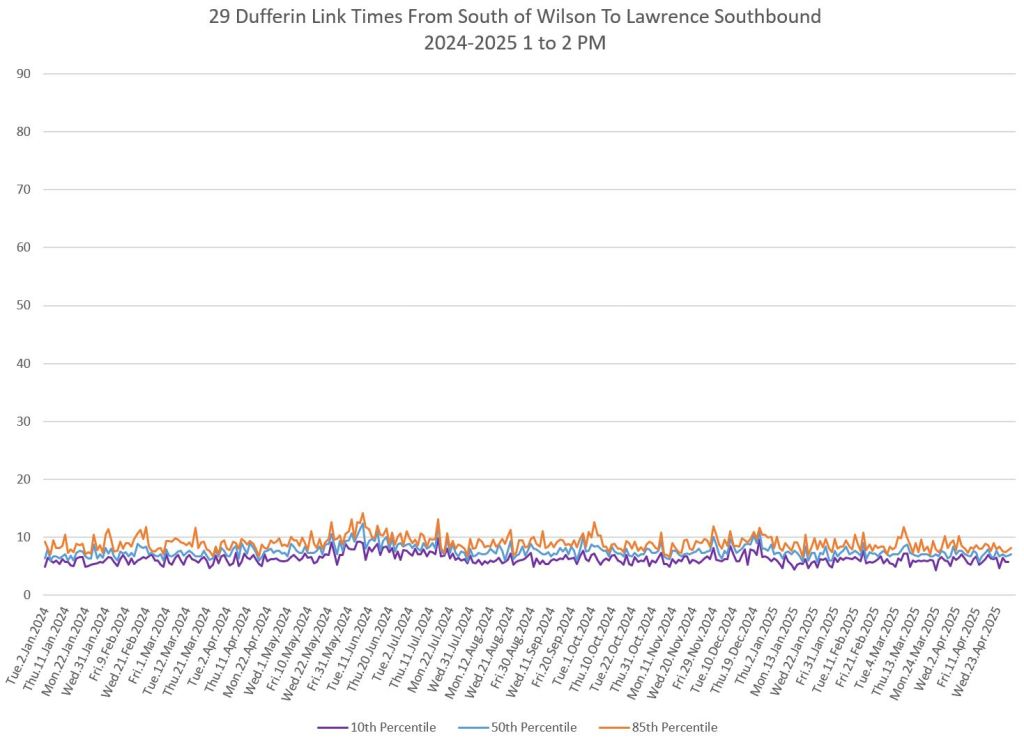
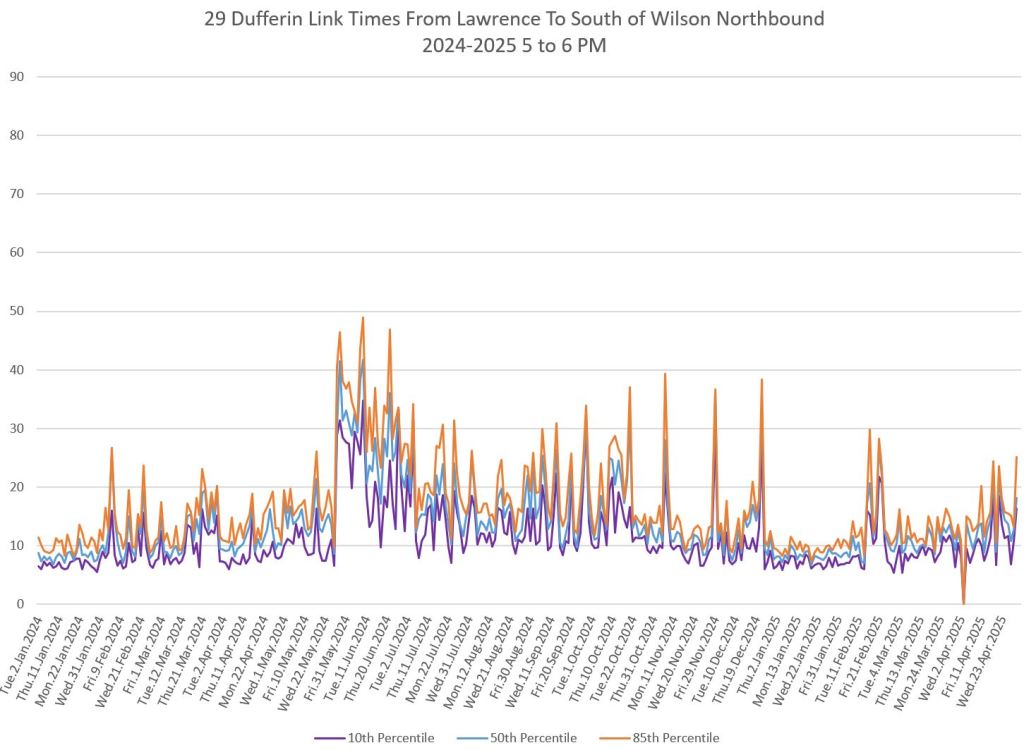
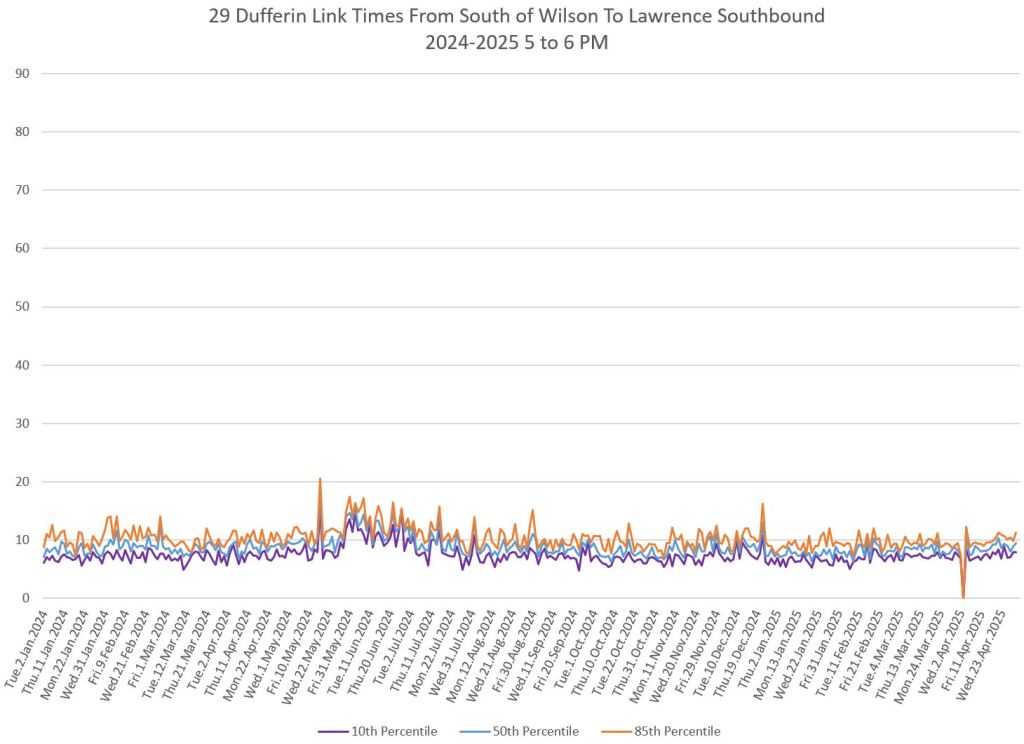
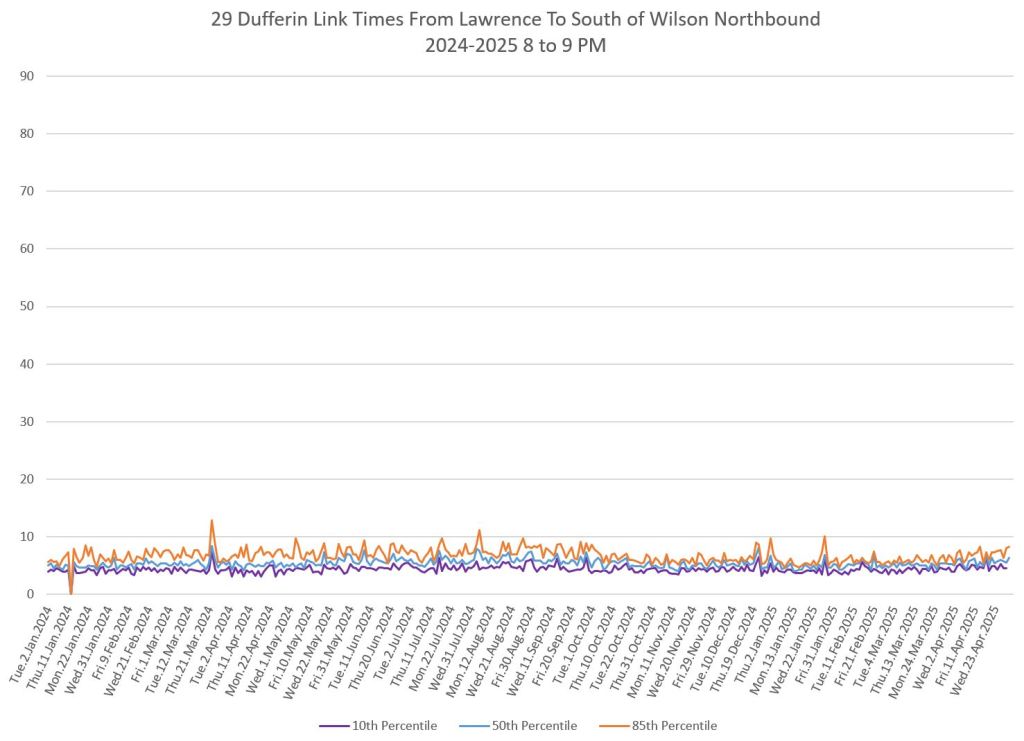
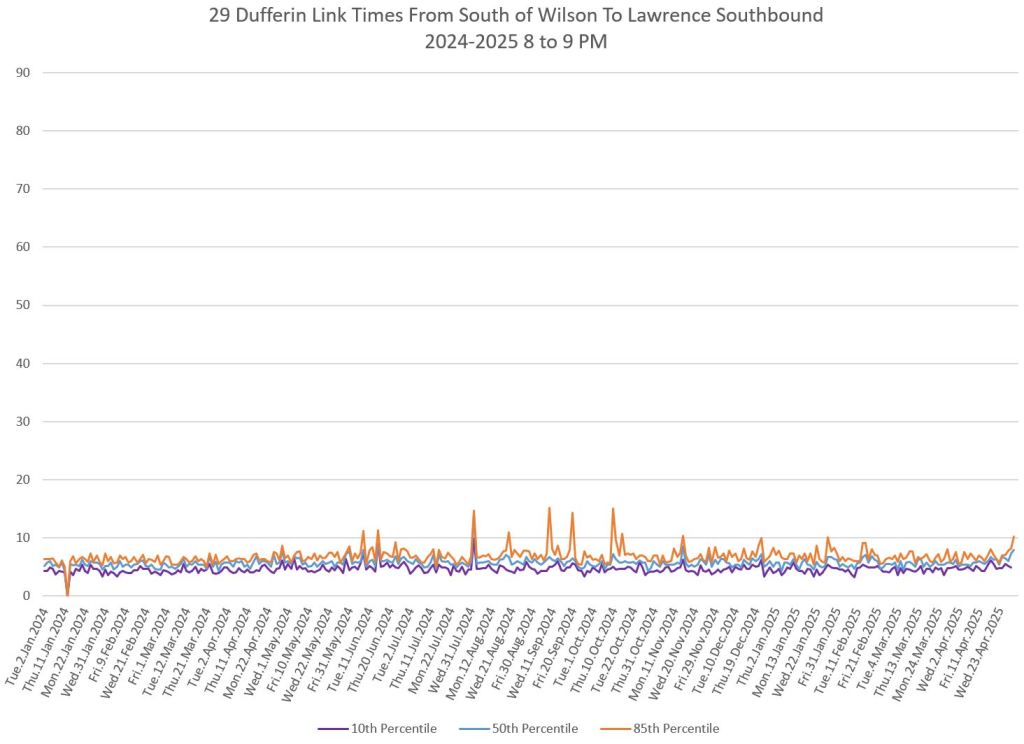
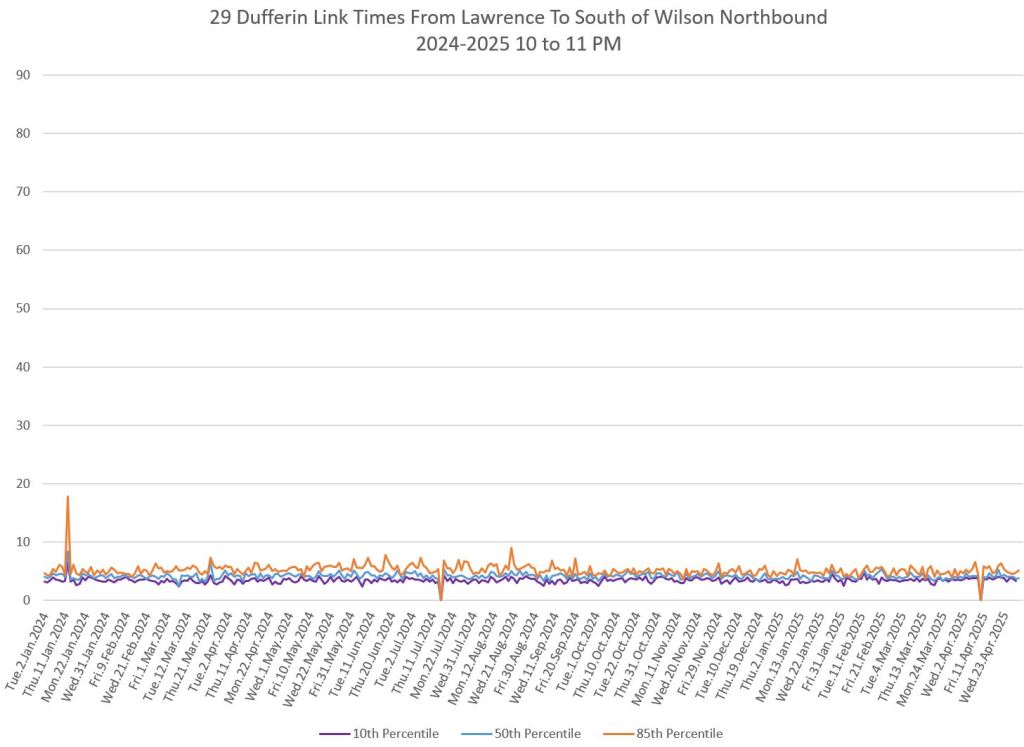
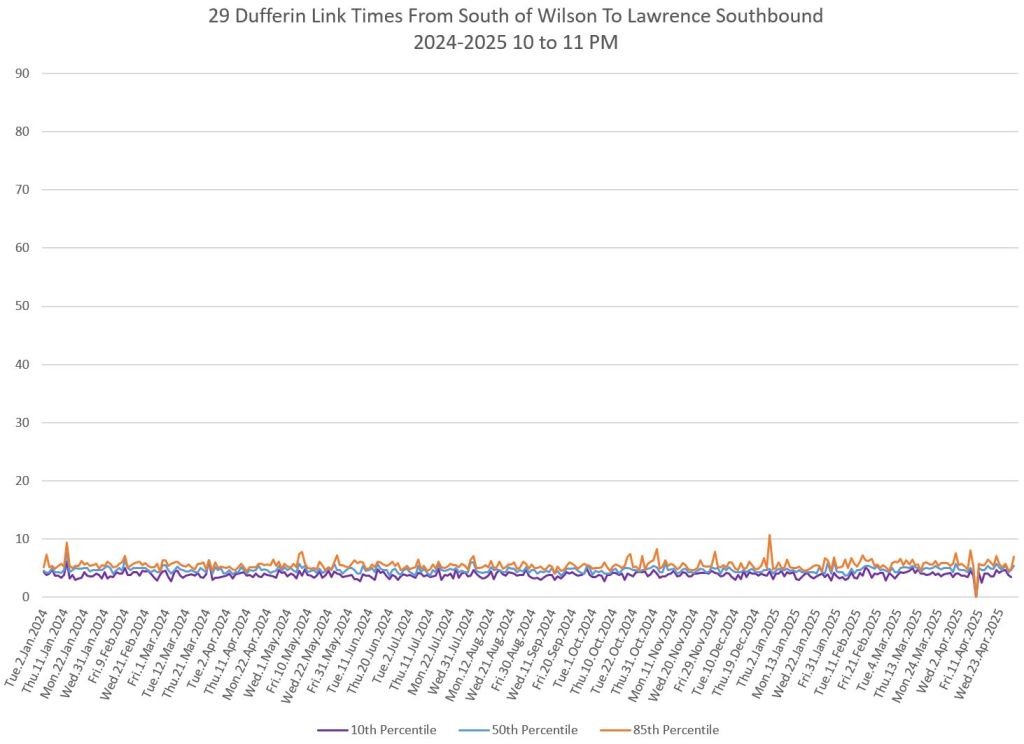
Lawrence to Wilson
The segment between Lawrence and Wilson is affected by backlogs of traffic for the Yorkdale parking lot and for Highway 401 access. This was worsened by other road restrictions during 2024. AM peak and evening times are consistent and with a low range of values.
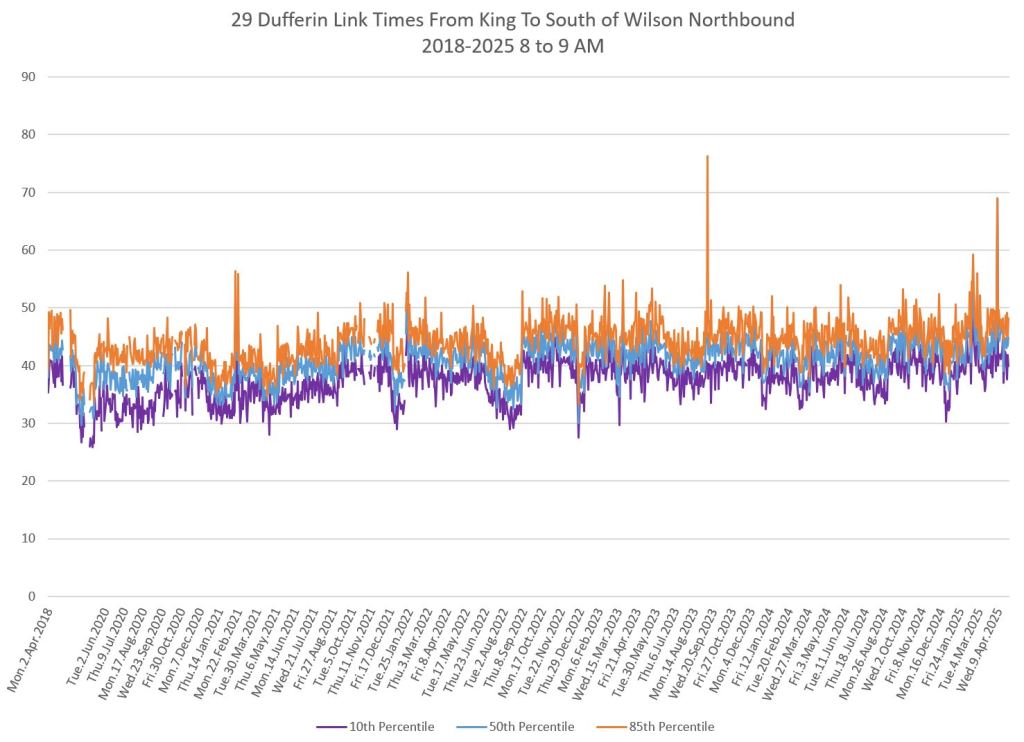
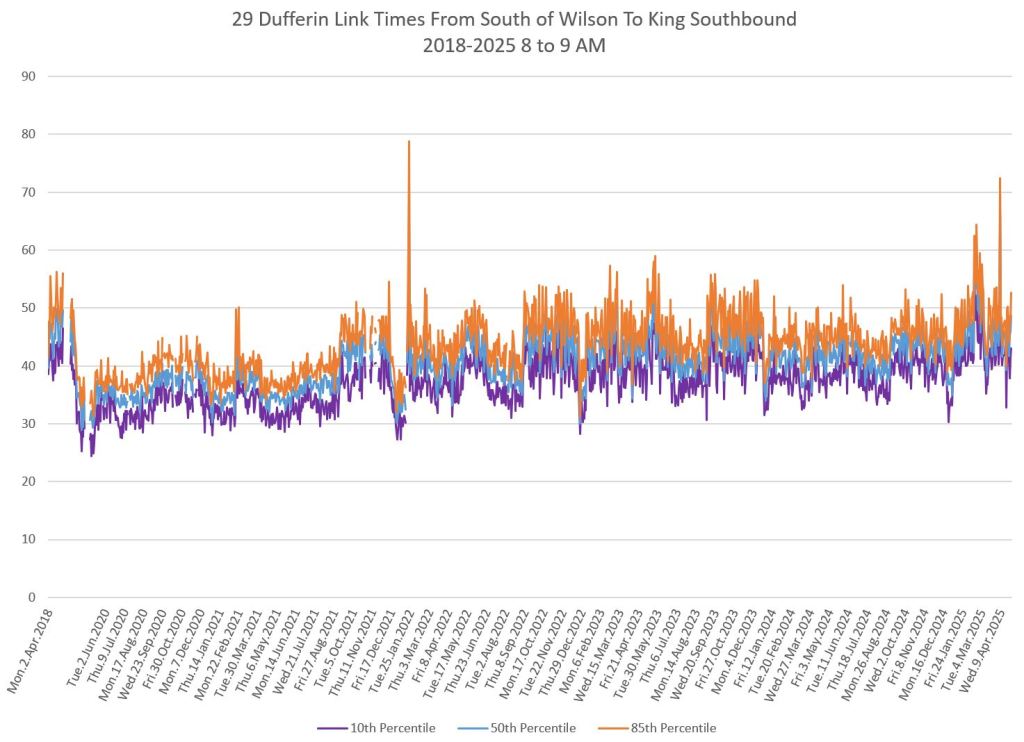
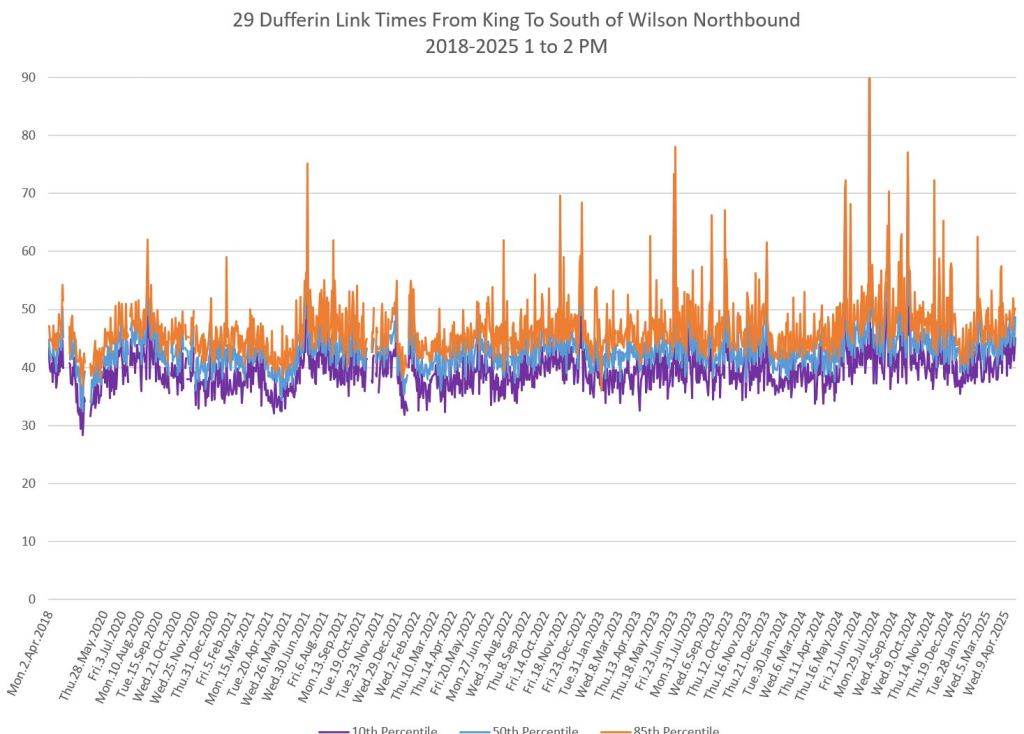
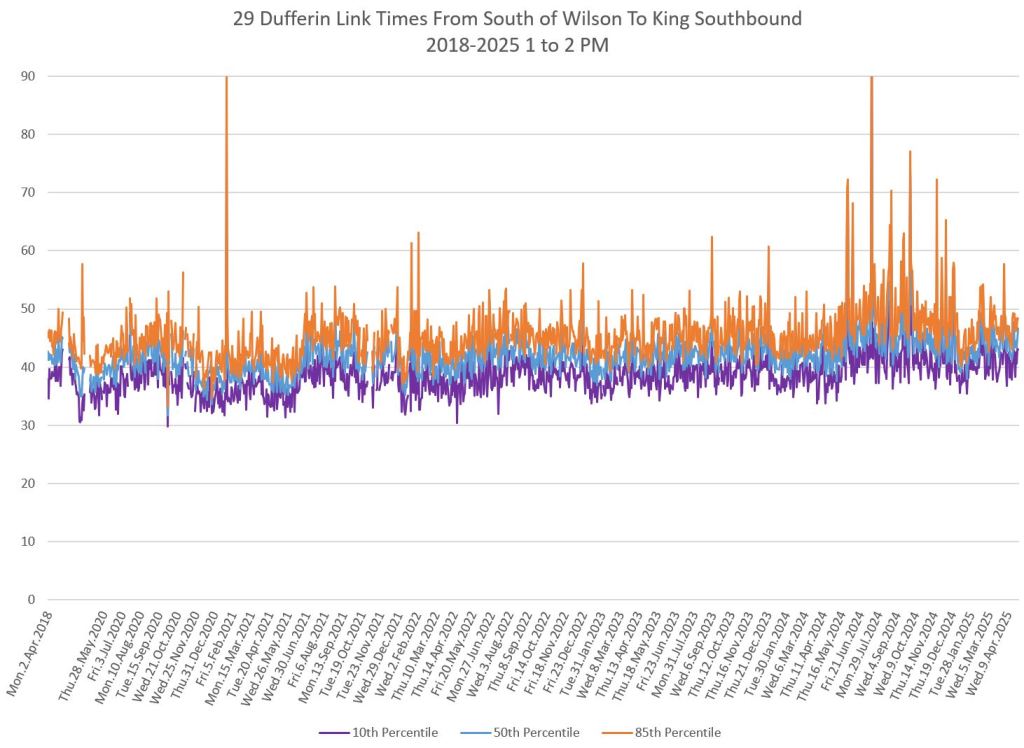
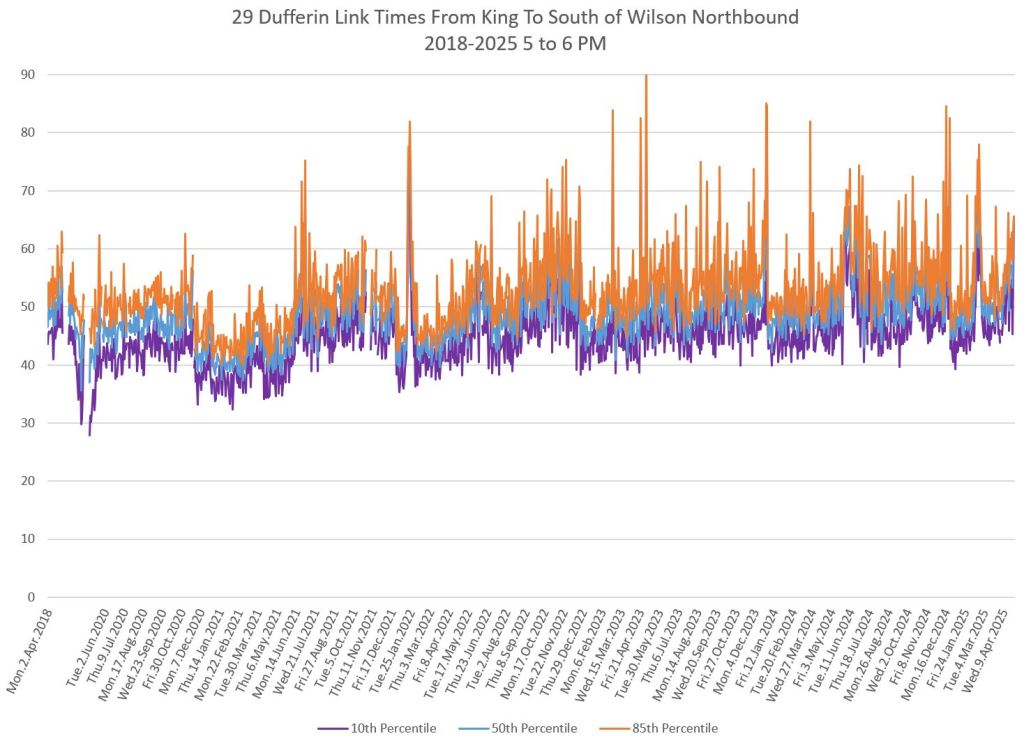
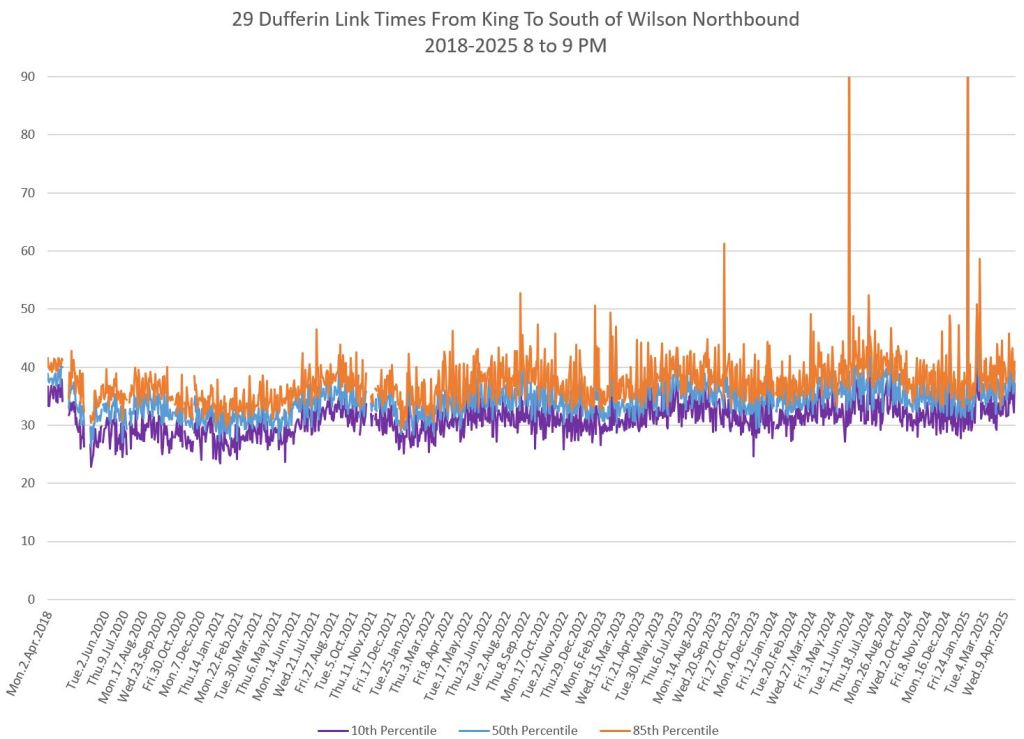
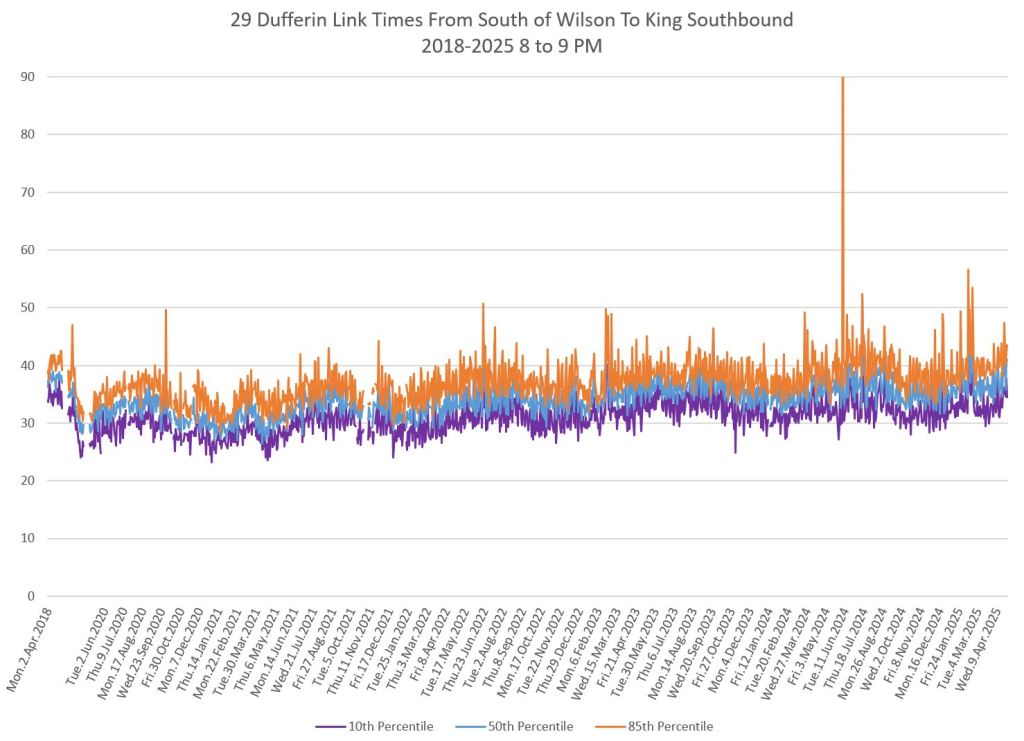
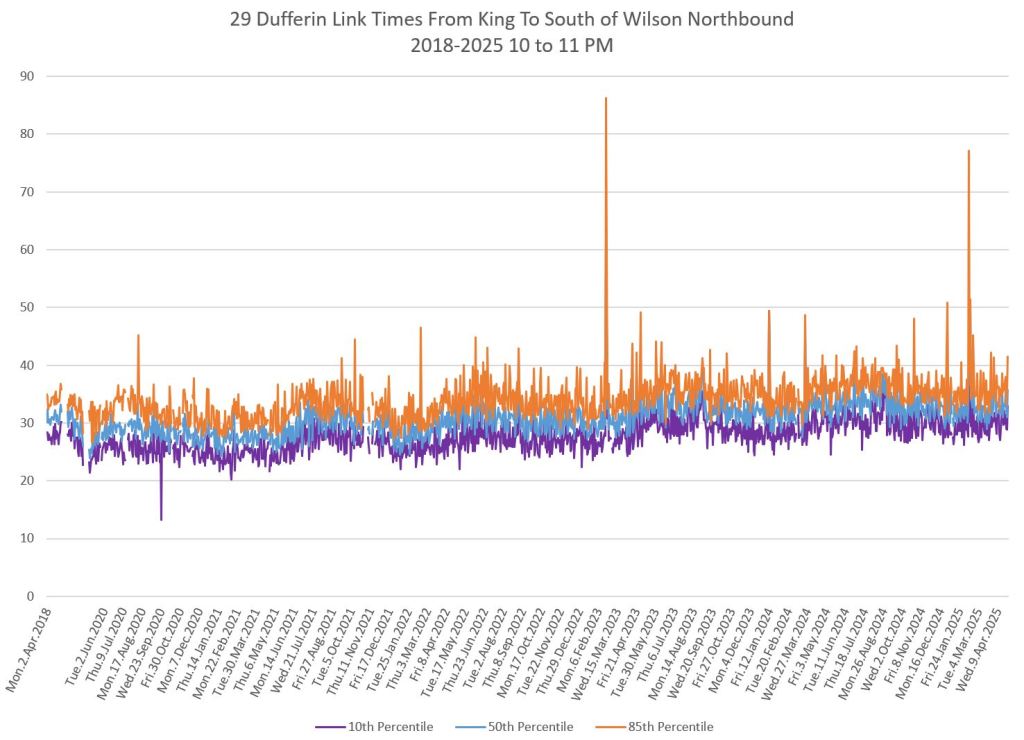
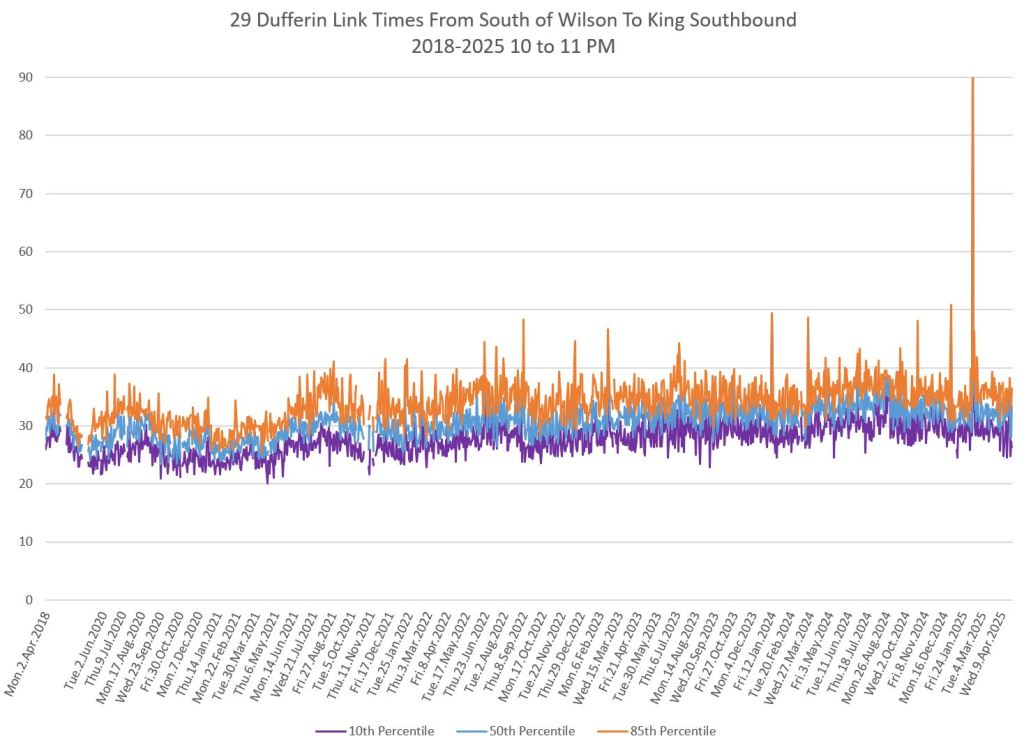
Travel Times – A Longer View from April 2018 to April 2025
I began collecting data for 29 Dufferin sporadically in 2018 and 2019, but with the onset of the pandemic, began to collect information monthly. This was a rare chance to see the route’s behaviour without road traffic and with lower passenger volumes, and to see the recovery as it evolved. The lowest levels during the pandemic probably represent best case possibilities for a route unencumbered by traffic, and with sufficient service and reliability that stop dwell times to not contribute to delays.
The charts below show the travel time data between King and Wilson from April 2018 to April 2025.
The drop in travel times in spring 2020 is most noticeable in the peak period and direction. There is a secondary drop in January 2022 when a second lockdown followed a false hope the pandemic was receding in late 2021.
The band of travel times lies in roughly the same range outside of the pandemic drops, but it has become more ragged and widened in recent years particularly in the afternoon and PM peak both ways.
There is some rise in the median (50th percentile, blue) values over time, but by comparison with April 2018 this is not higher than pre-pandemic conditions.
Consistently the travel times in the late evening are well below peak period values..
Note that I have consistently used screenlines at King and just south of Wilson so that the times omit terminal effects such as bus queuing.