
This article is Part II of my review of service quality on the 29/929 Dufferin routes in April 2025. Part I covered headways (the interval between buses) while this part looks at travel times. Part III will review historic data going back to January 2024.
- Average travel times are fairly consistent, but for any time of day can vary by 10 minutes or more over a one-way trip, much less for shorter segments of a few kilometres.
- The major rise in travel times occurs northbound in the afternoon and PM peak. The effect is much smaller in the AM peak and for southbound trips.
- There is a slight difference between travel times for local and express buses. The time saving either way between King and Wilson lies between three and seven minutes on average. The percentage change is lower in the peak period when travel times rise, but the spread between local and express services does not.
- The dispersal in travel times is similar for local and express buses. This is reflected both in the standard deviation values and in the quartile breakdowns.
- Conditions changed in the latter part of the month increasing travel times on the southern part of the route.
- A considerable part of the PM peak travel time increase lies outside of the proposed RapidTO area notably between Eglinton and Lawrence, and especially between Lawrence and Wilson.
- The time spent by buses at or near terminals varies quite substantially, and reveals periods when schedules could be too tight or, conversely, too generous.
Transit lanes on Dufferin should be able to shave some peaks off of travel times, but this will only apply to periods where buses are routinely fouled in traffic. Some locations where congestion snarls the route are not proposed for transit priority.
As shown in Part I there is a wide variation in departure times from terminals compared to scheduled headways even though most trips appear to have time for recovery to their schedule. Reducing travel time, and more importantly making travel times consistent will help to make headways more reliable, but the problem of regulating departures and vehicle spacing will still remain.
The remainder of this article is a large set of charts for those interested in a fine-grained view of the route.
Scheduled Service
Scheduled travel and recovery times did not change over these routes during the period studied from January 2024 to April 2025. (The 29C to Princes’ Gates was restored in Fall 2024, but with no change to the design for other services.)
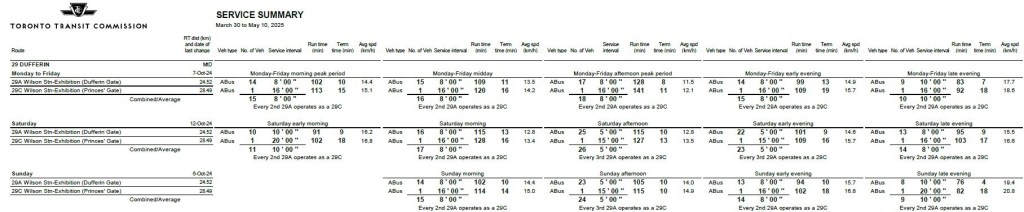

Chart Organization
Charts here are arranged in a similar pattern and format to those in Part I.
Data from the 29 Dufferin local service are on the left, and 929 Dufferin Express on the right. Where both directions are presented together, northbound data are shown in the top row with southbound data in the bottom row.
Some charts include standard deviation values. These measure the degree to which data points are clustered around the average (low SD) or spread out over a wider range (higher SD). The range of values can be seen in scatter charts of all data points, as well as in charts showing the range of each quartile of values
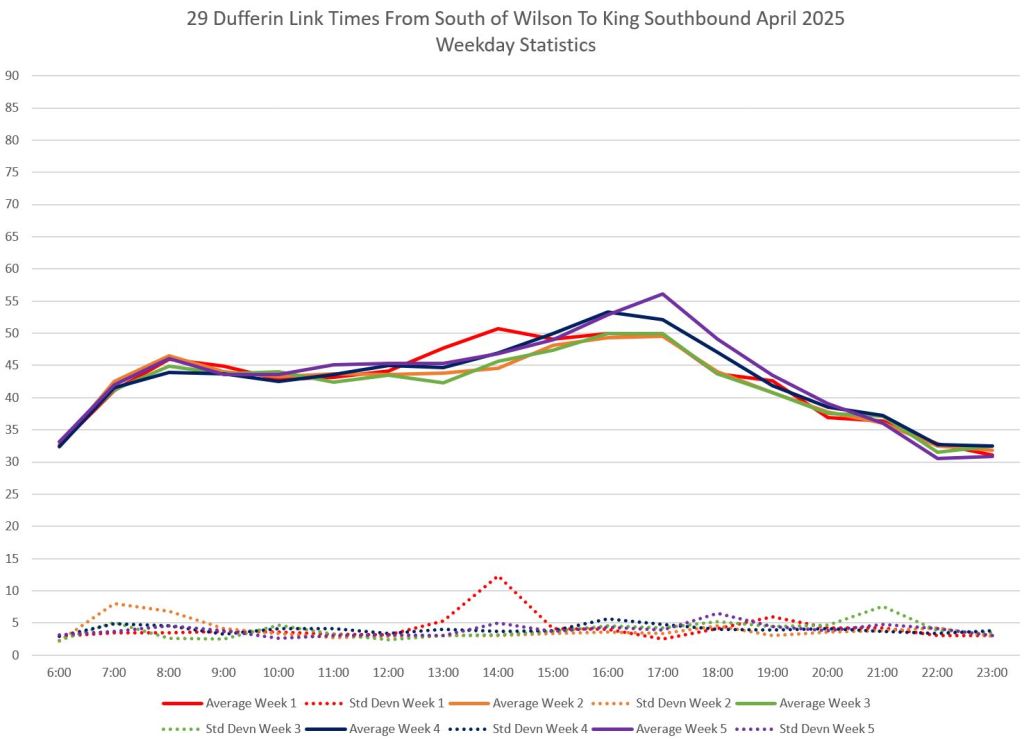
Travel Times Between King and Wilson
This section shows travel times over the main point of the route omitting section south of King (and into the Exhibition grounds), and the leg along Wilson from Dufferin to Wilson Station.
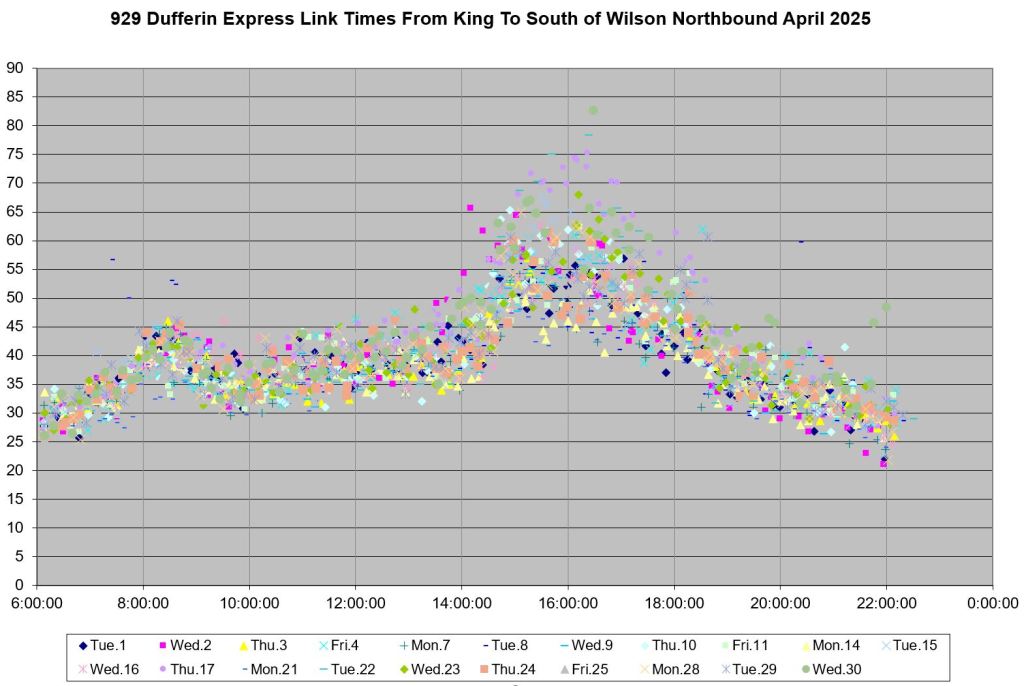
Note that the afternoon peak begins in the 2pm hour, peaks at 3-4pm, and then falls off after 6pm. Any regulation aiming at only a narrow peak such as 4-6pm will not benefit the shoulders where traffic builds up and down.
Monthly Stats


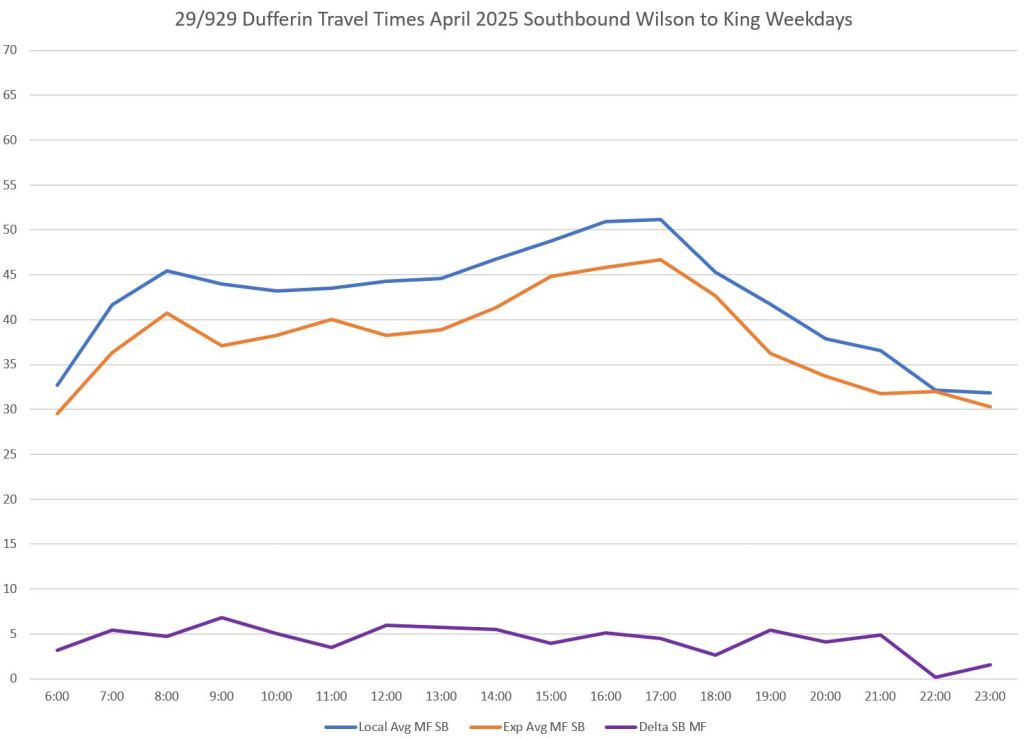
Local vs Express Travel Times
Over the distance between King and Wilson on Dufferin, the difference in average travel times is considerably less than the difference in scheduled times. This gives the 929 express service a tighter schedule with less room for recovery.
The values shown here are the monthly averages for all weekdays. They echo the rise and fall of week-by-week values shown above.
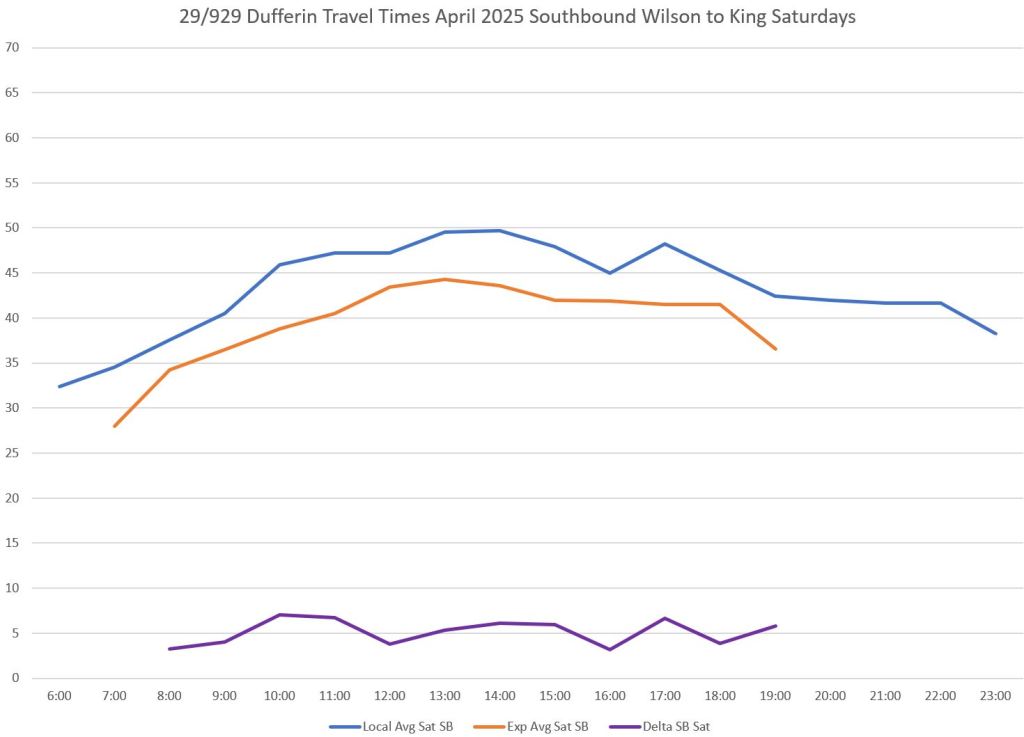
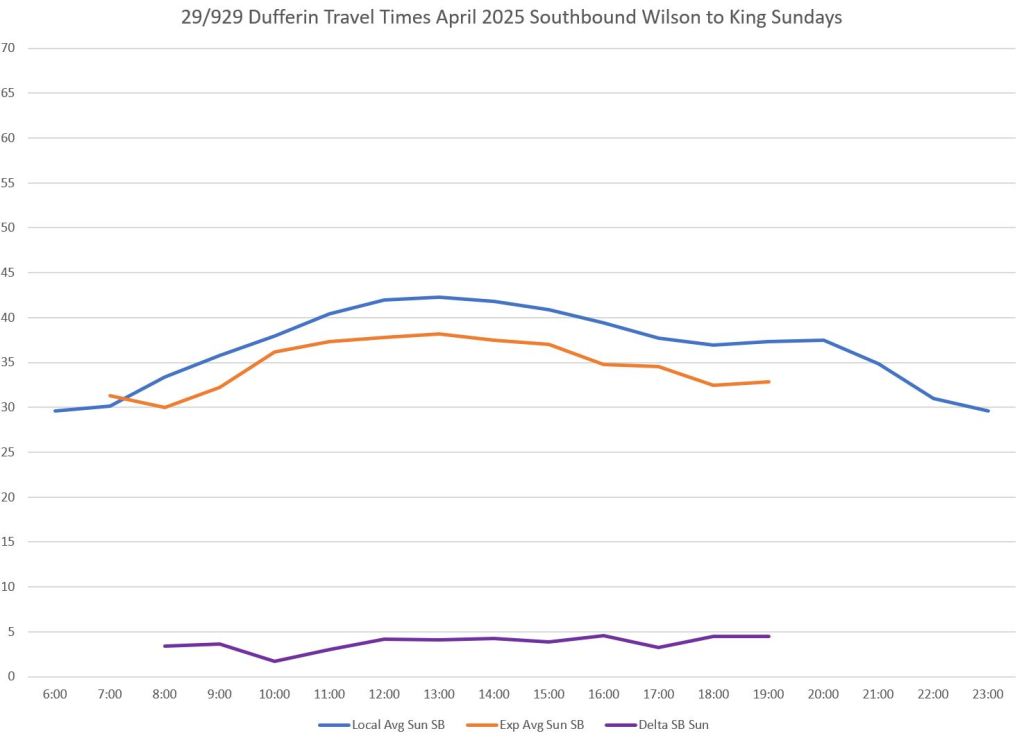
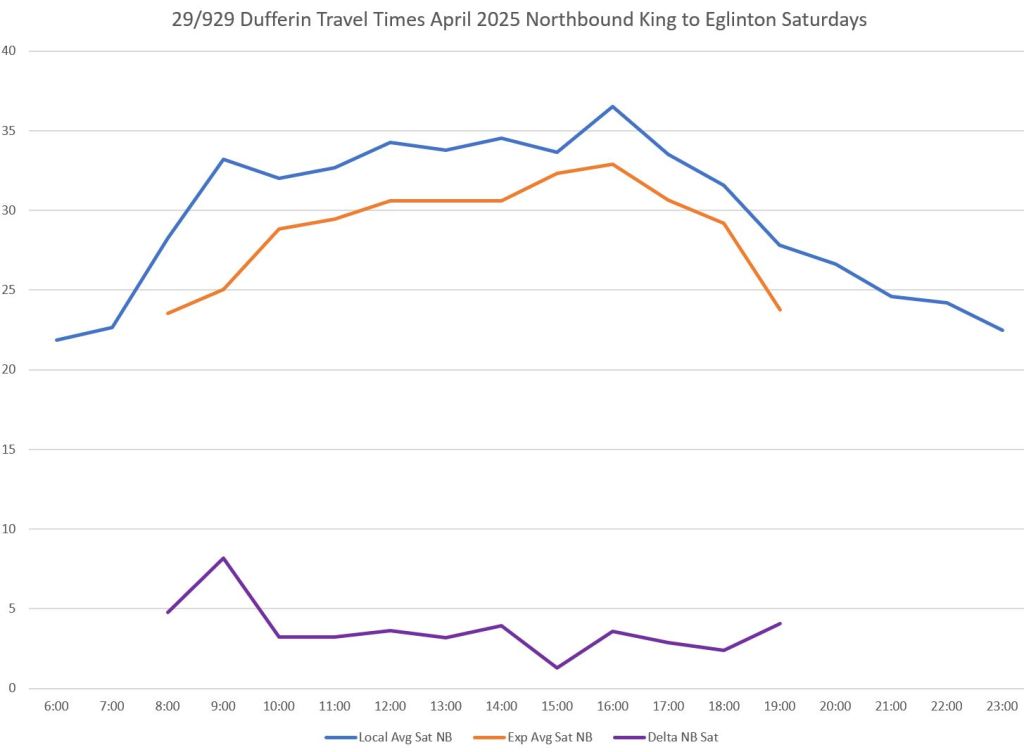
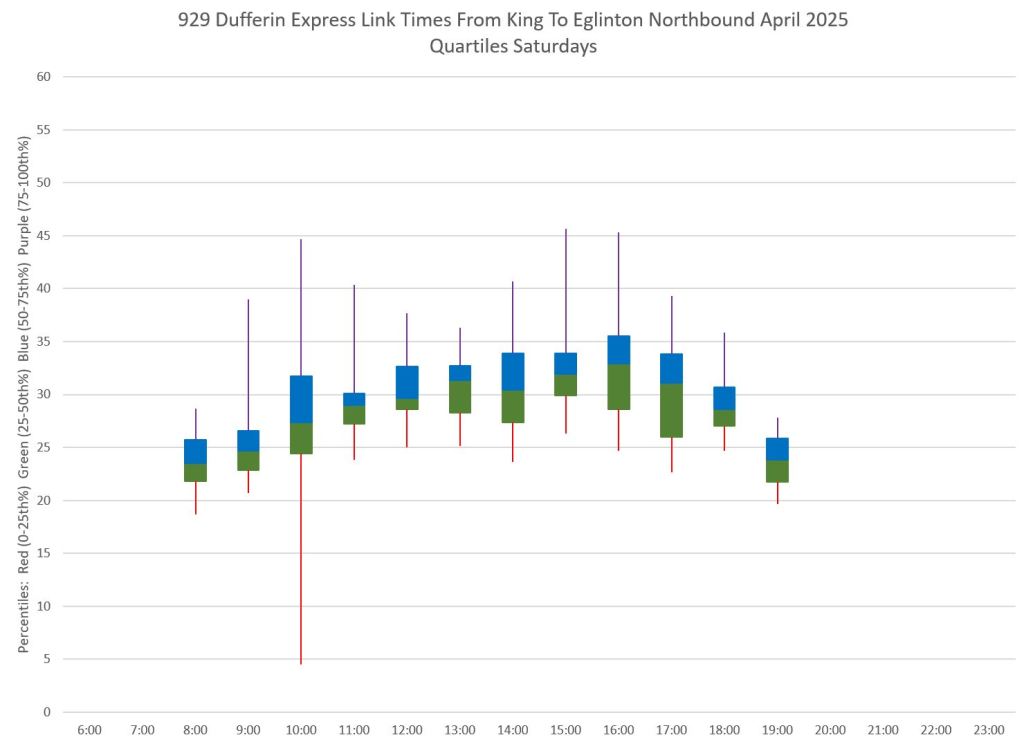
Saturday times are almost as high as weekday times, and that the peak is longer-lasting and centred earlier in the day.


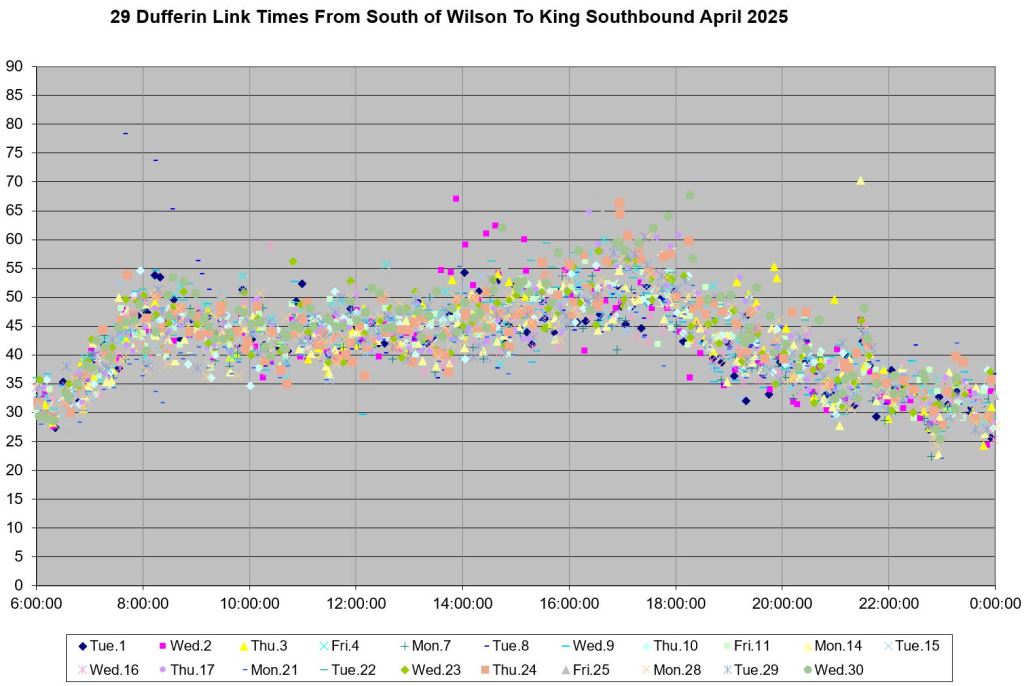
Detailed Data
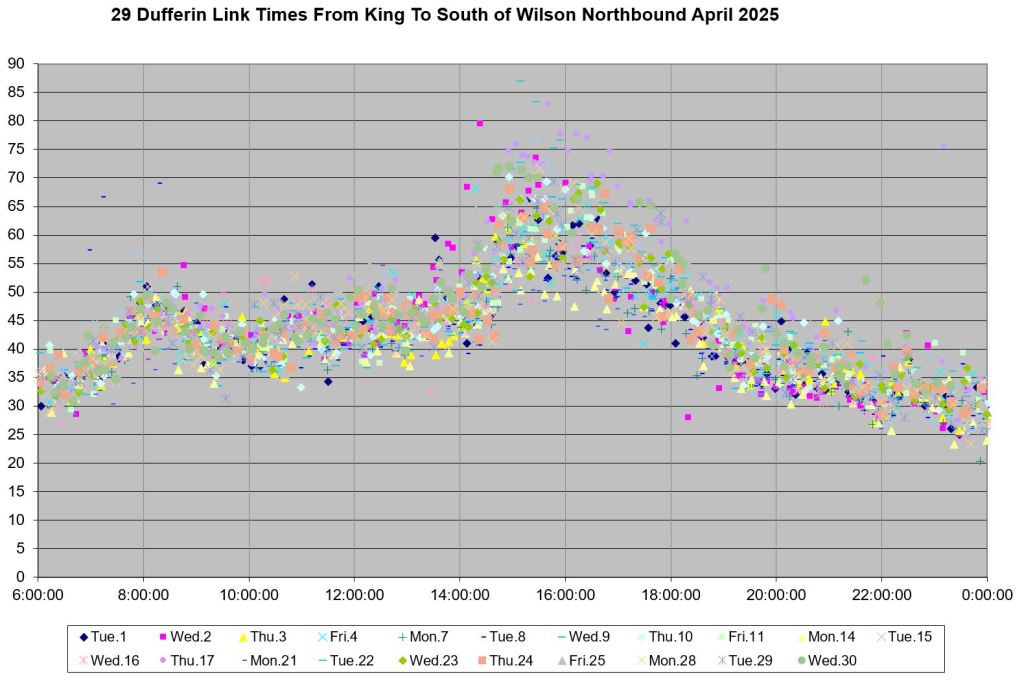
These charts show how the individual data points, each representing one trip, lie in a band roughly ten minutes wide with some overlap outside. Any schedule must take this variation into account so that most trips can be completed in the allocate time, but without so much excess that operators are forced to drive slowly and buses accumulate at terminals.


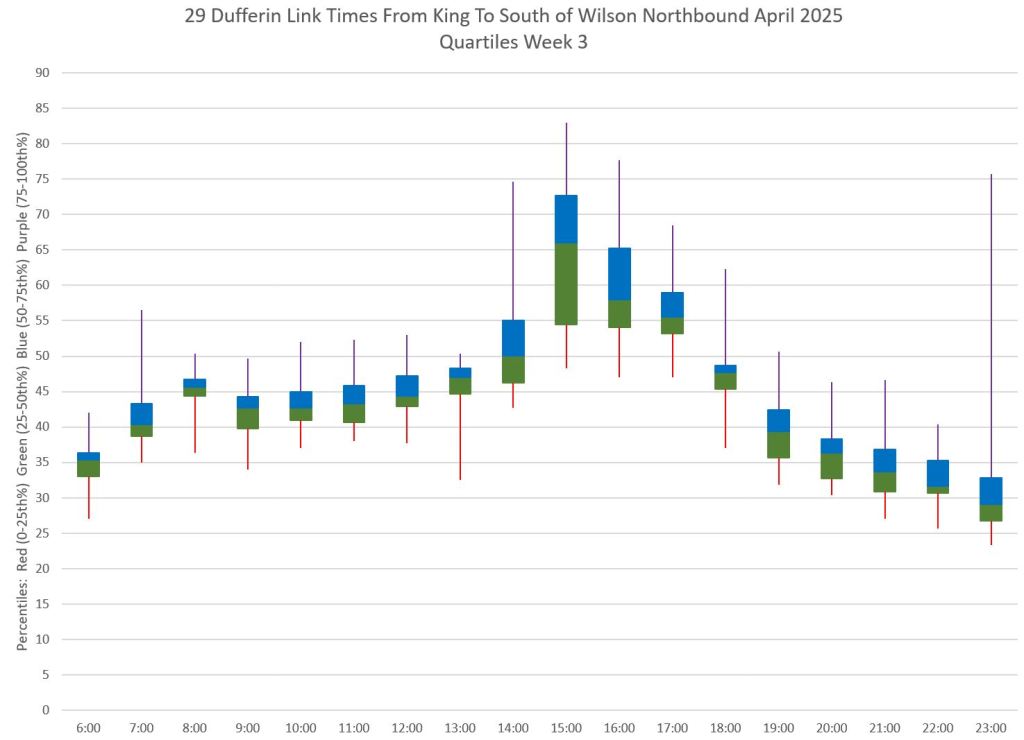
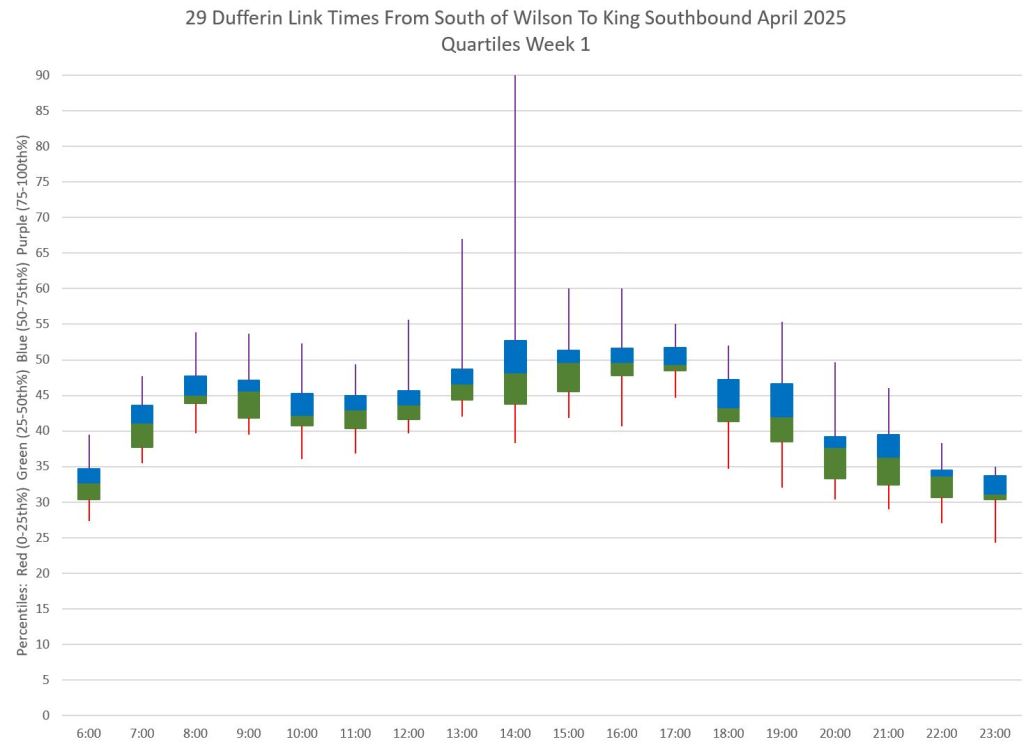
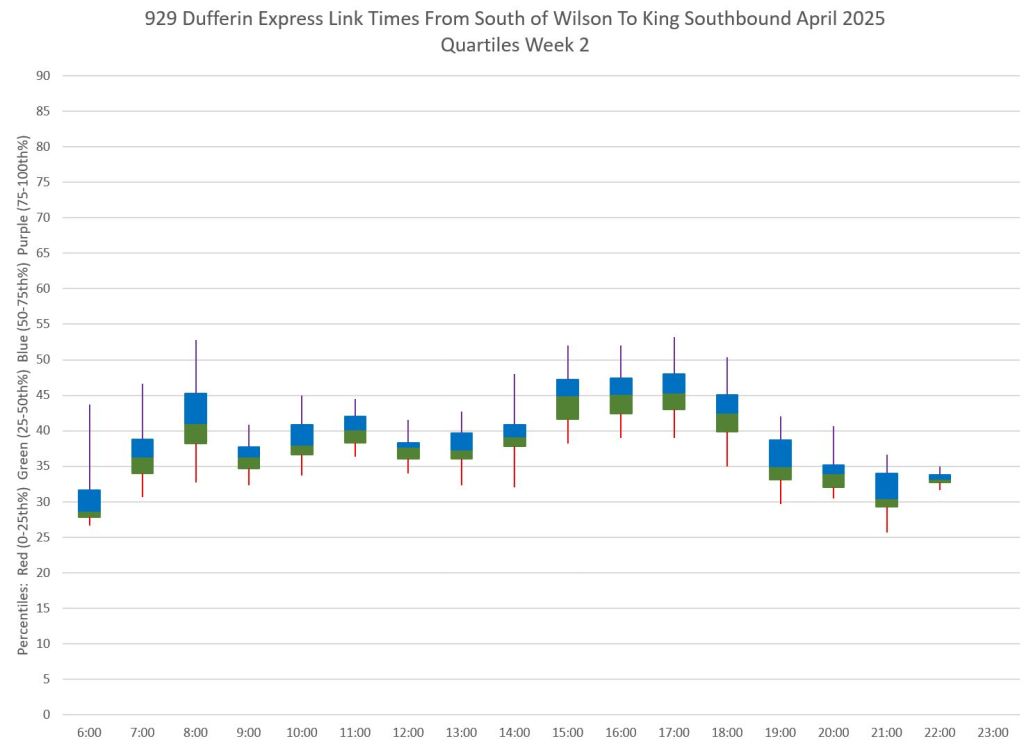
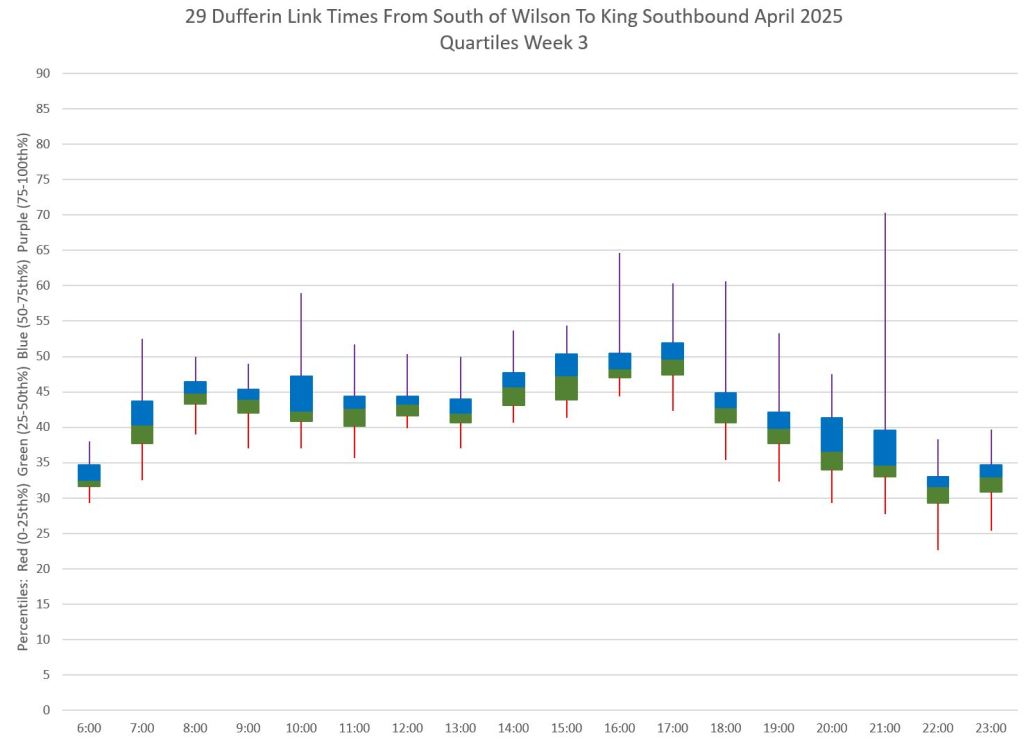
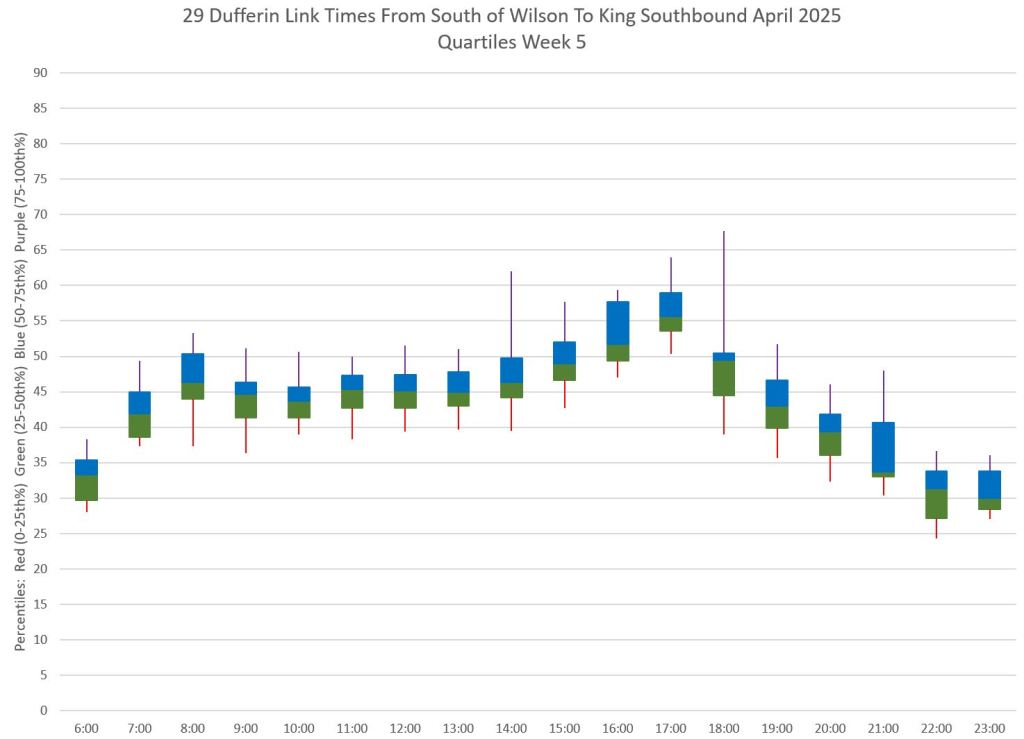
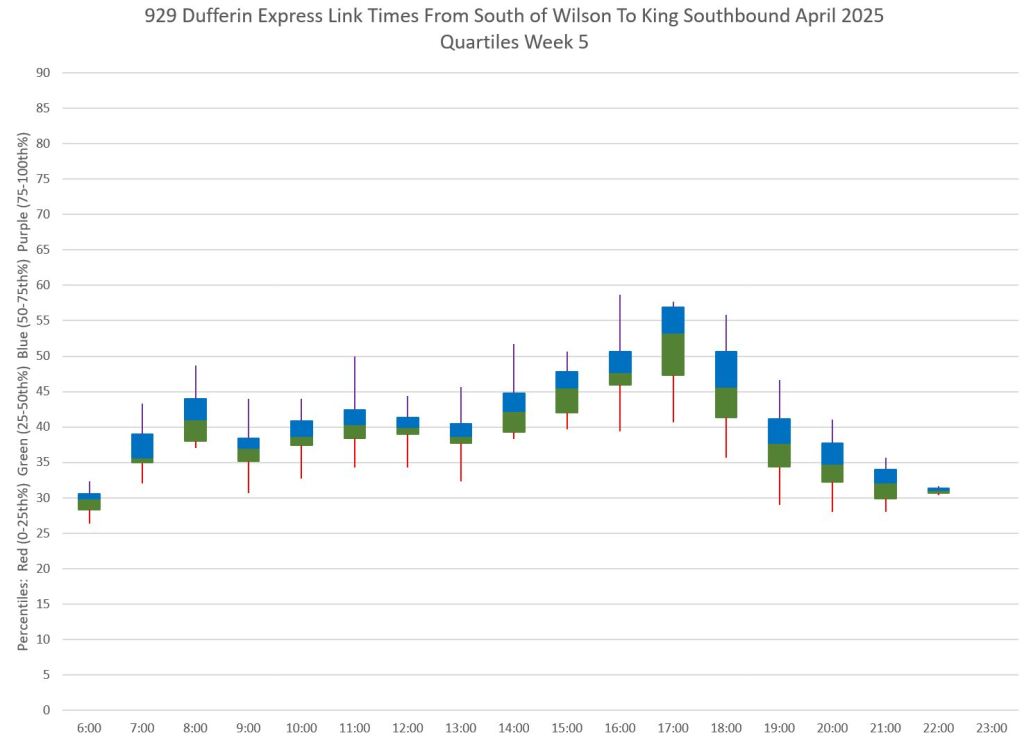
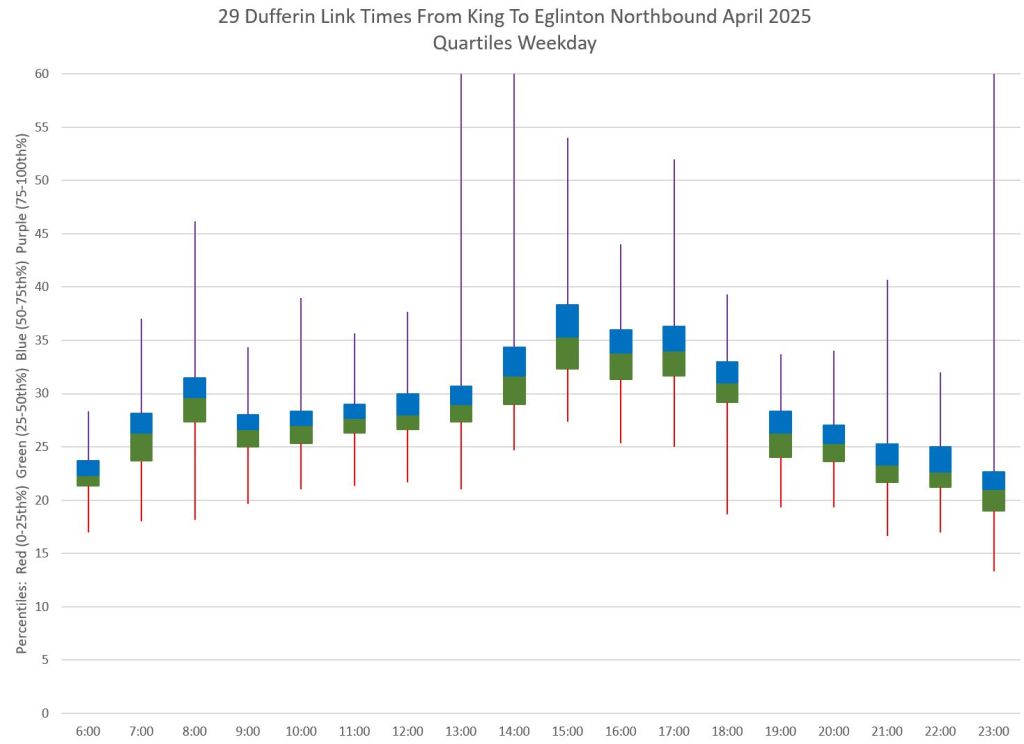
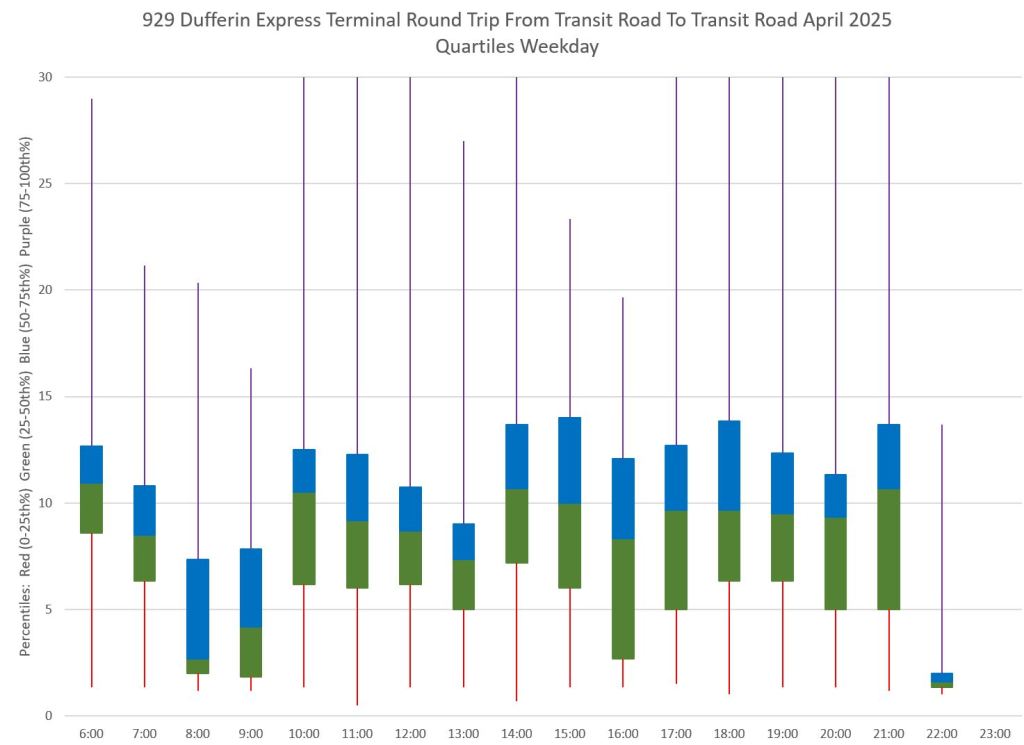
Weekly Quartiles
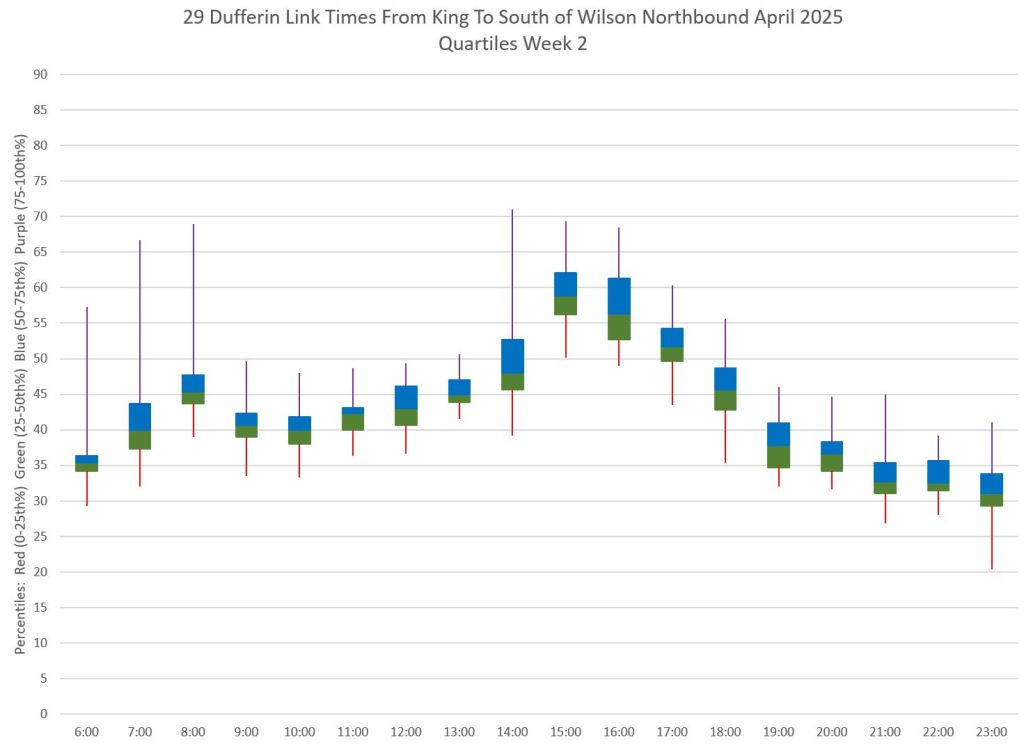
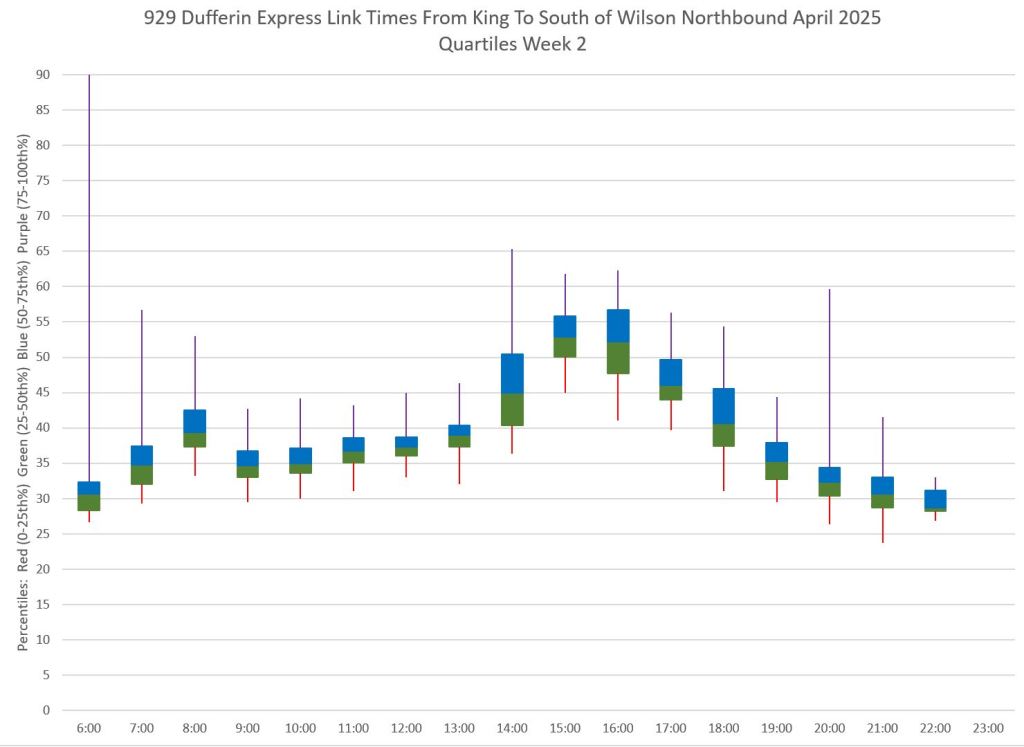
The quartiles show how tightly, or not, travel times are clustered from hour to hour, and week to week. Where the central blue-green boxes are short, half of the trip times are concentrated in a narrow band. The boxes open out mainly in the afternoon and PM peak when travel times are less consistent.
The tails above and below the boxes hold the other half of the trips. Ideally these should be short so that the overall scatter stays within a band of 10-15 minutes, but at some times this is not the case. These are the times when intervention to improve reliability are most important.
Northbound


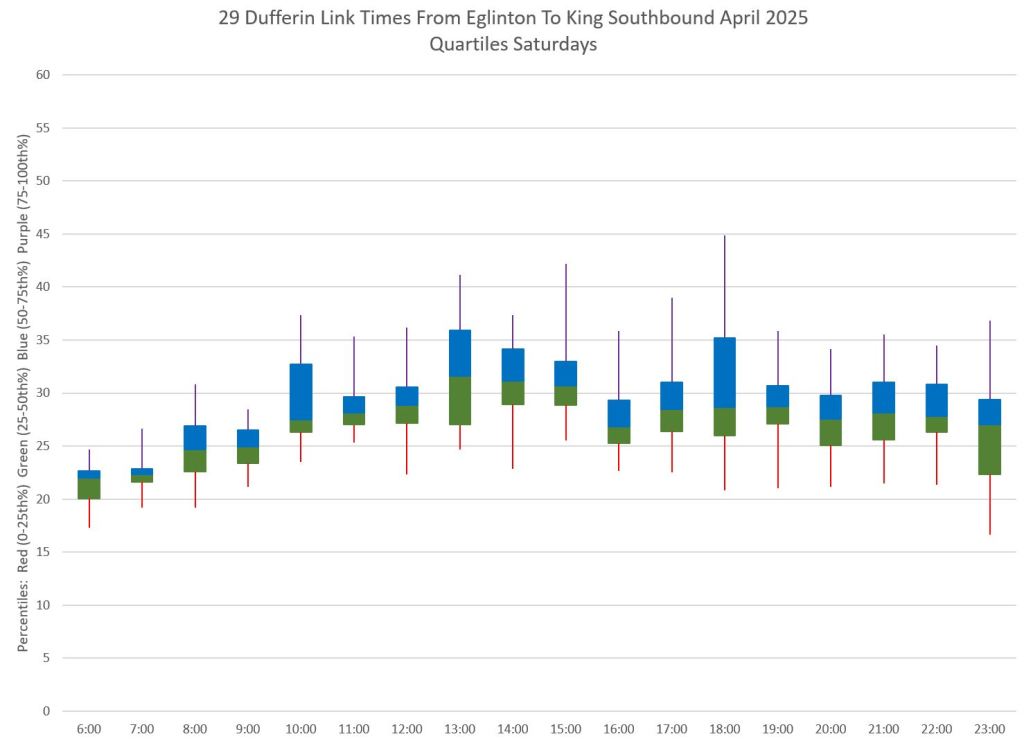
Southbound
Note that the change in height of the central blue-green boxes is generally smaller than in the northbound charts, particularly in the afternoon. This shows that there are greater reliability problems northbound than southbound.


Travel Times By Route Segment
The charts here subdivide the route into segments about 2km long. In some cases there is a noticeable change in travel times for afternoon peak, but for others the averages stay fairly flat. This shows that there is greater interference in bus movement both by route segment and direction.
The SD values lie generally in the 1-to-2 minute range. Note that these do not accumulate along the route, and charts in the previous section showed that values ranged mainly from 3-6 minutes over the King-Wilson segment except northbound in the afternoon peak when they are higher..
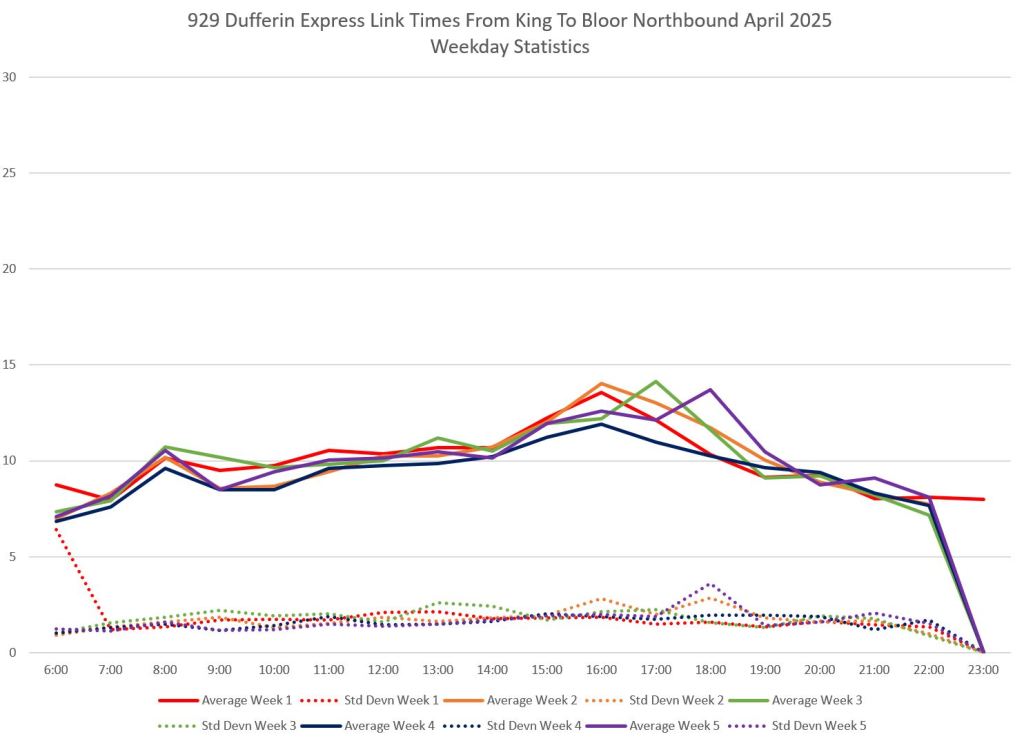
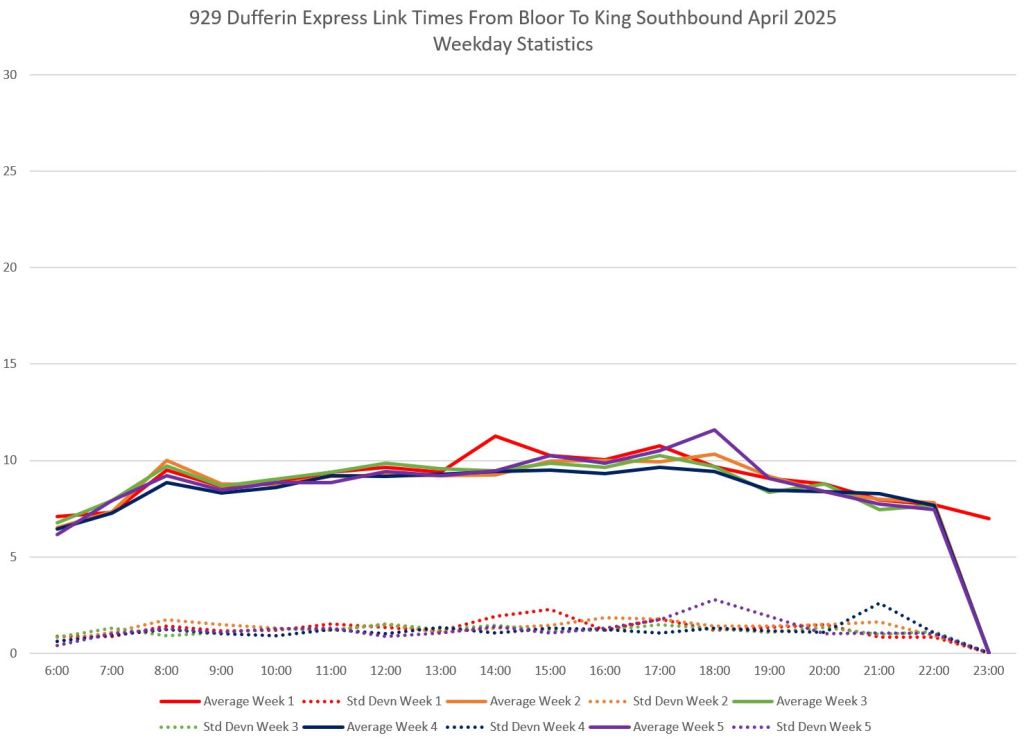
King to Bloor
Northbound travel time averages rise here by about 5 minutes in the afternoon peak, but with a smaller rise southbound. There is a small, brief rise both ways in the morning peak.


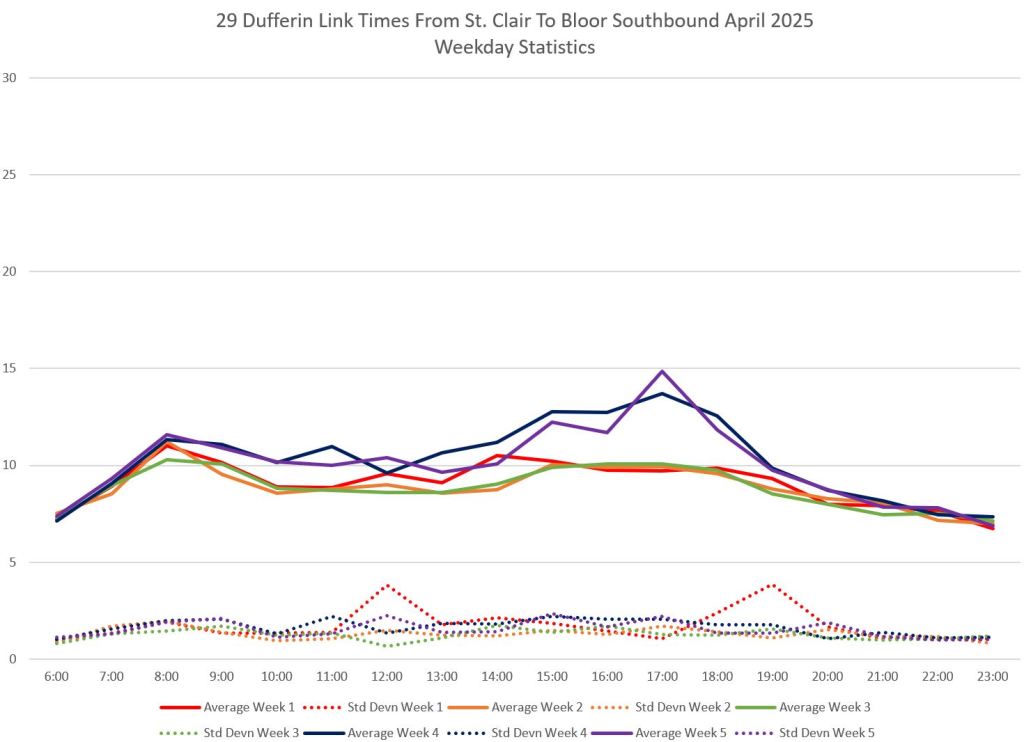
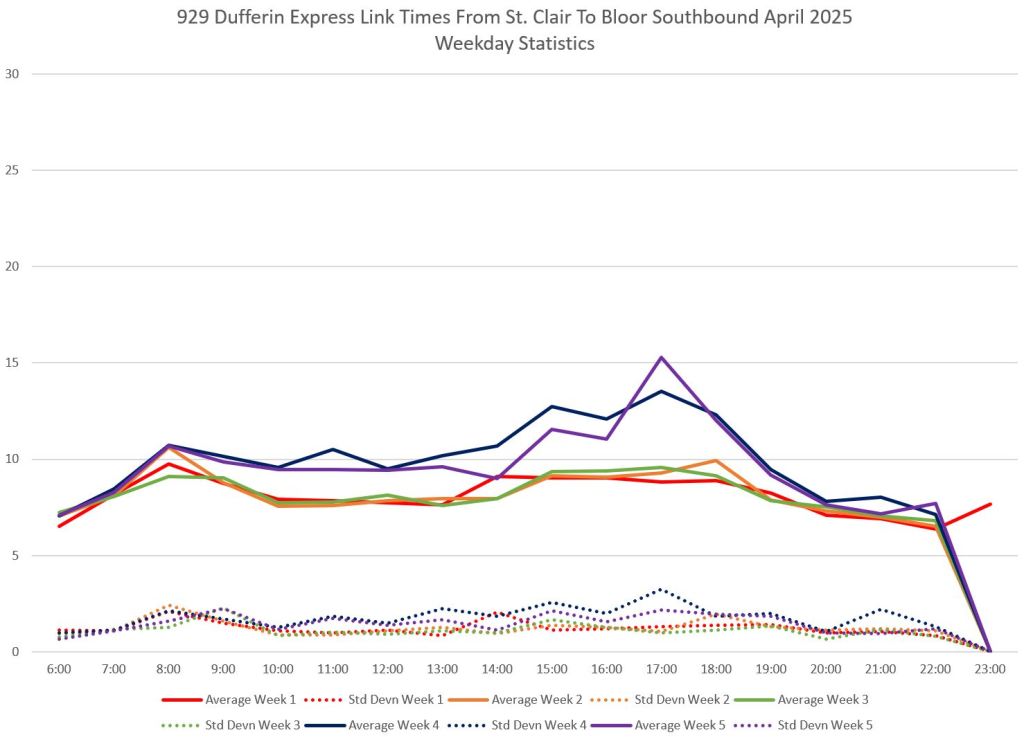
Bloor to St. Clair
Travel times here show a small morning rise and a larger one, about 5 minutes, in the afternoon. This occurs in both directions. It is also clear that there was a change in weeks 4 and 5 contributing to longer travel times mainly during the afternoon (blue and mauve lines in the charts below).


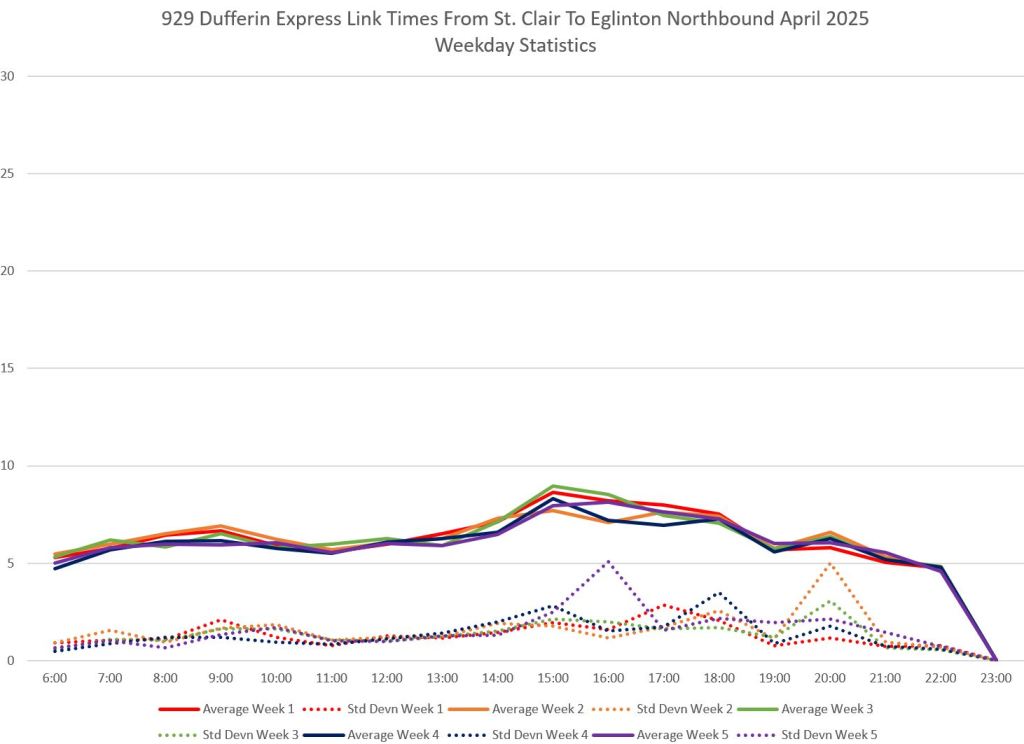
St. Clair to Eglinton
There are small rises in travel times in the peak direction for this segment. Southbound in the morning, and northbound in the afternoon.


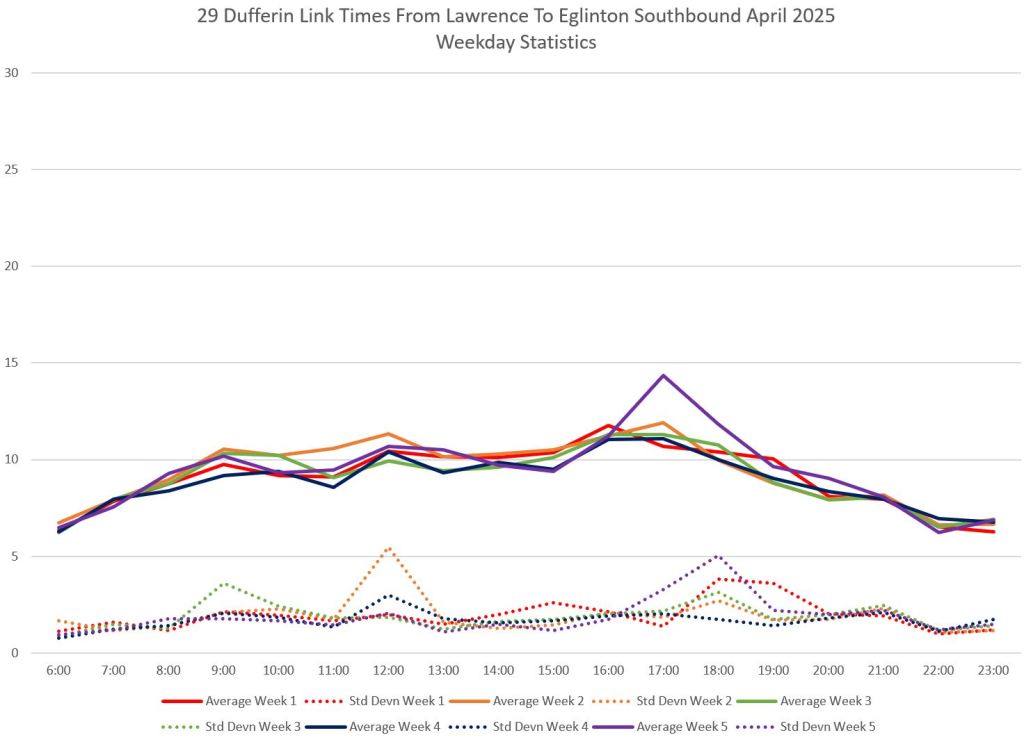
Eglinton to Lawrence
Travel times rise in the afternoon peak in this segment northbound, and to a smaller amount southbound. There is also a small northbound morning peak.


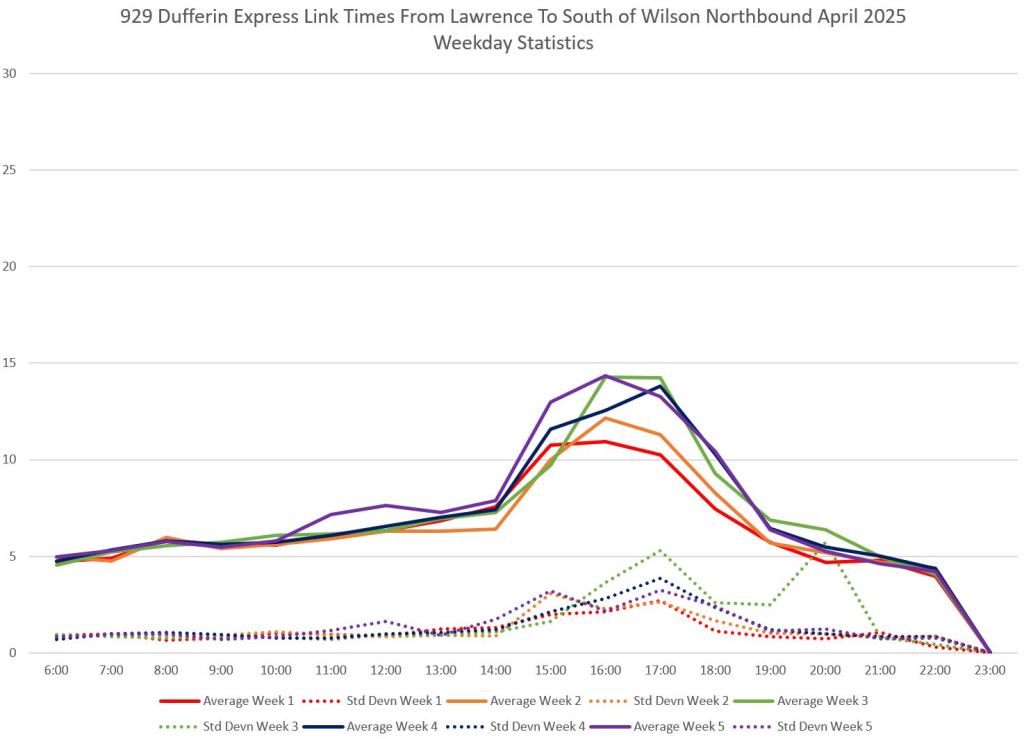
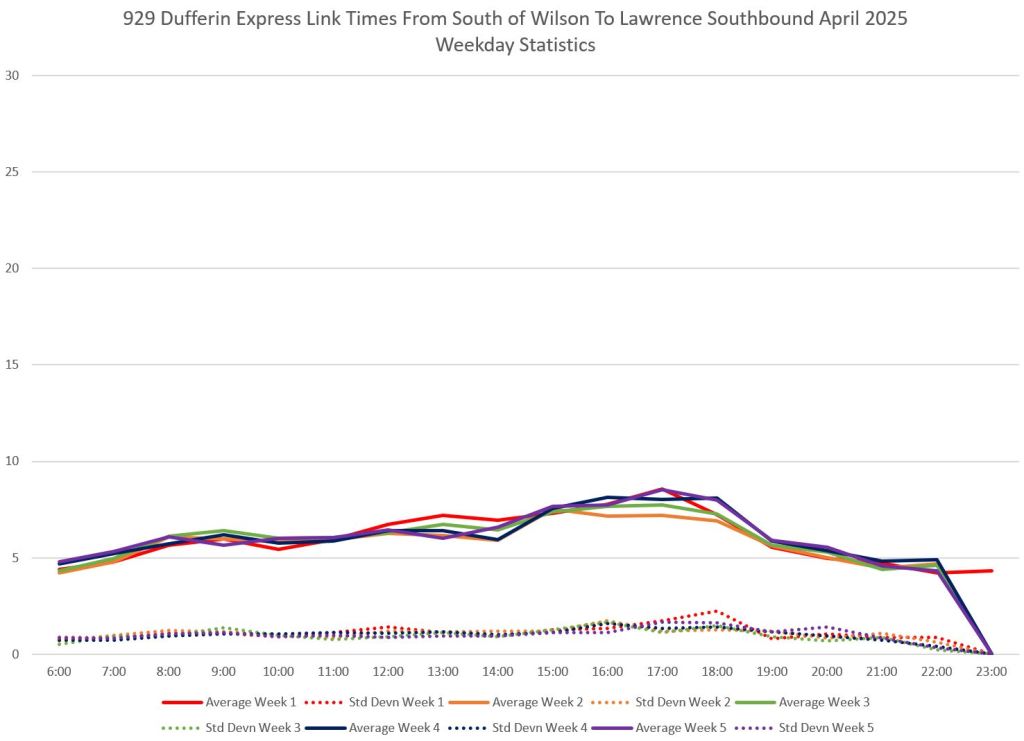
Lawrence to Wilson
Northbound travel times from Lawrence to Wilson roughly double in the afternoon peak, with a much smaller rise southbound. The northbound peak can be even higher when there is a major shopping event at Yorkdale Mall, typically around Christmas.


Local vs Express Travel Times
Over the distance between King and Wilson on Dufferin, the difference in average travel times is considerably less than the difference in scheduled times. This gives the 929 express service a tighter schedule with less room for recovery.
The charts below show the average weekday travel times for local service in blue, express in orange and the difference between them in mauve.
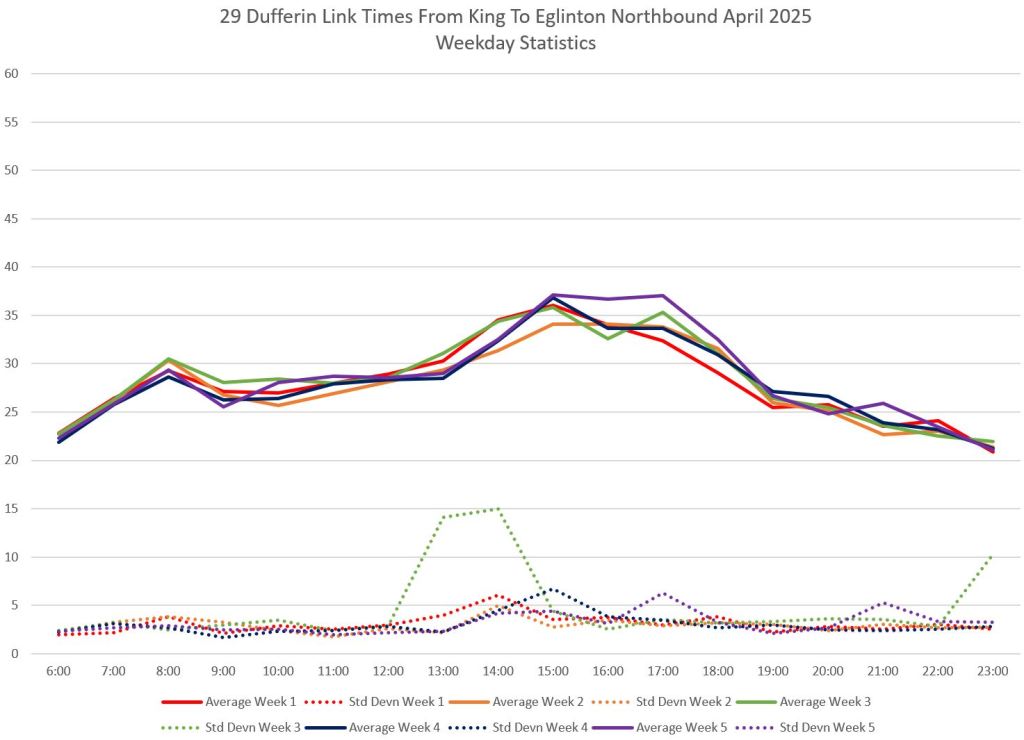
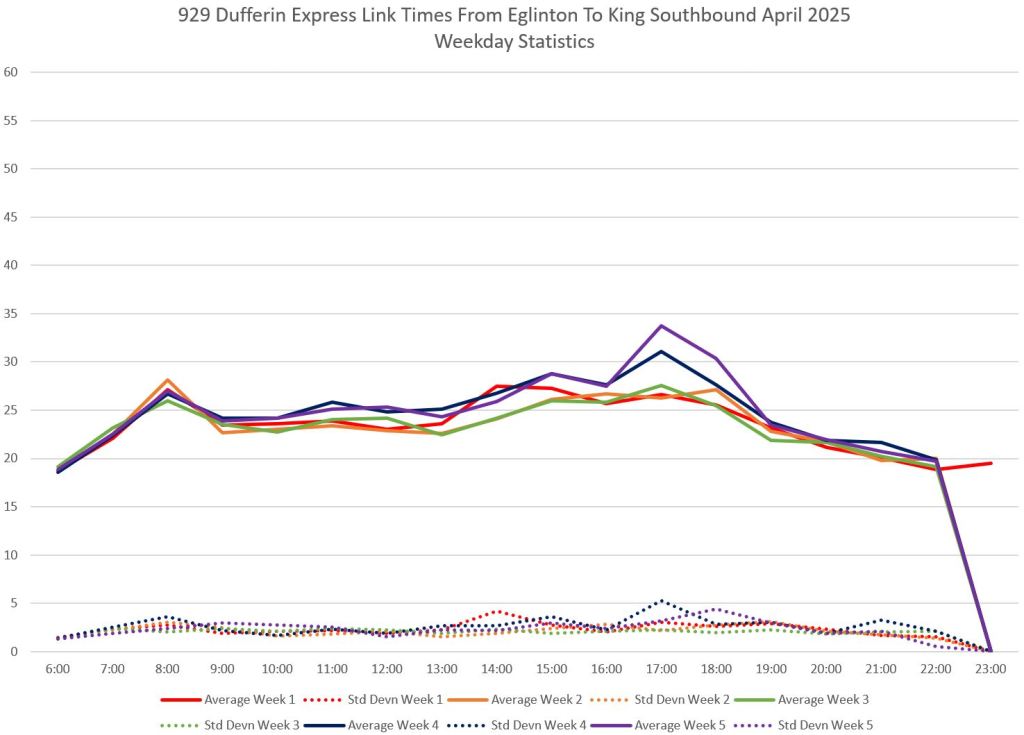
Travel Times in the Proposed RapidTO Segment
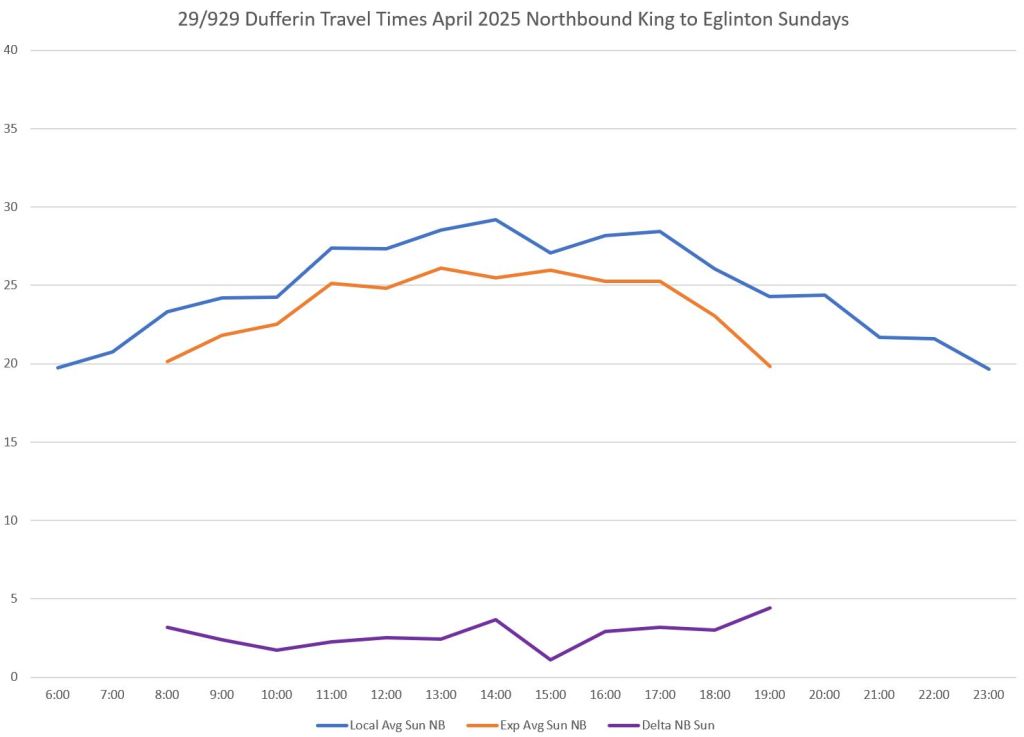
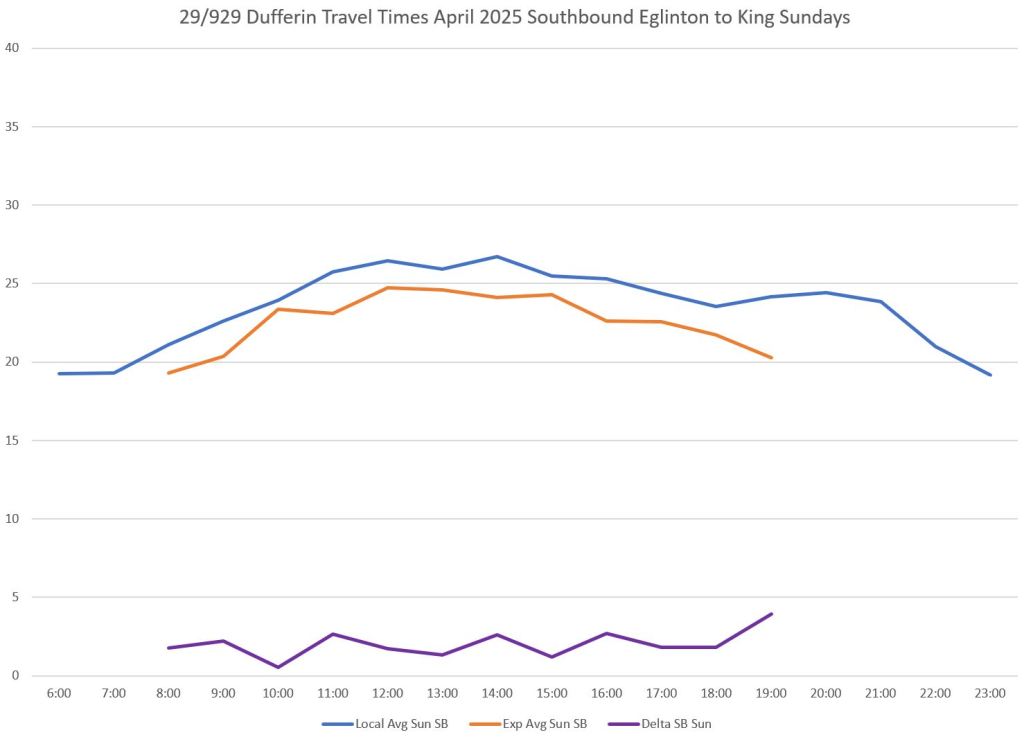
Charts in this section show data only for King to Eglinton, the proposed RapidTO area, rather than for the longer King to Wilson data above. The patterns are familiar with a small morning peak and a longer, higher one in the afternoon.
Weekdays


Local vs Express
Over the King-Eglinton segment, express buses make 3-4 minutes shorter trips than locals.


Detailed Weekday Data
The detailed data show the same pattern for King-Eglinton as for King-Wison, but with a narrower spread of values.


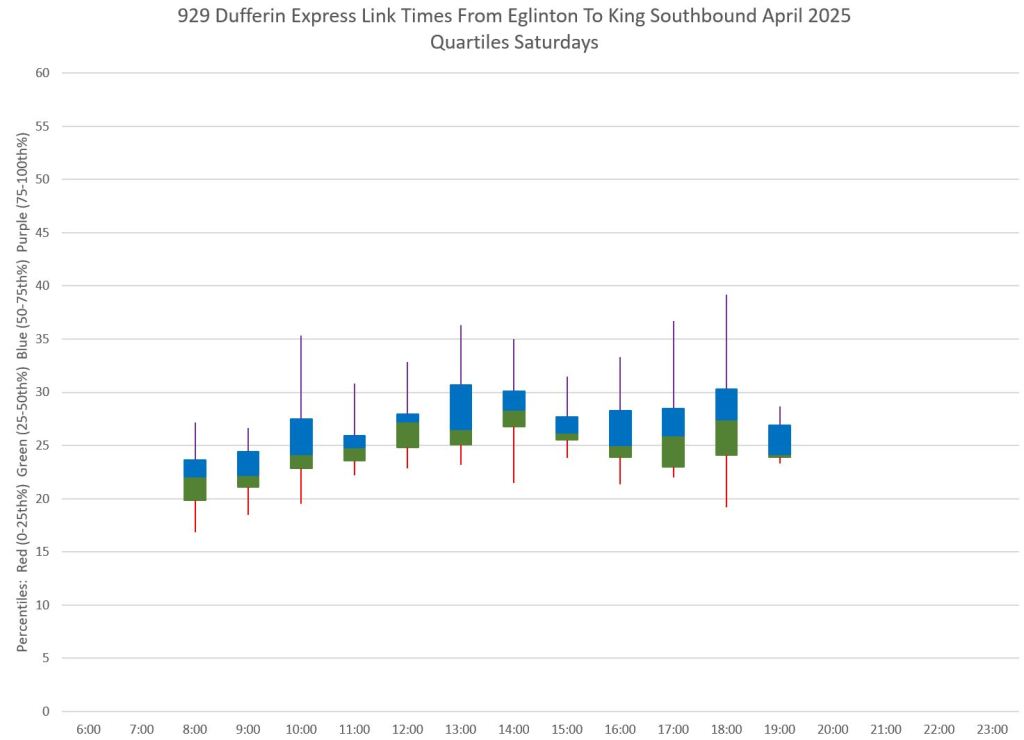
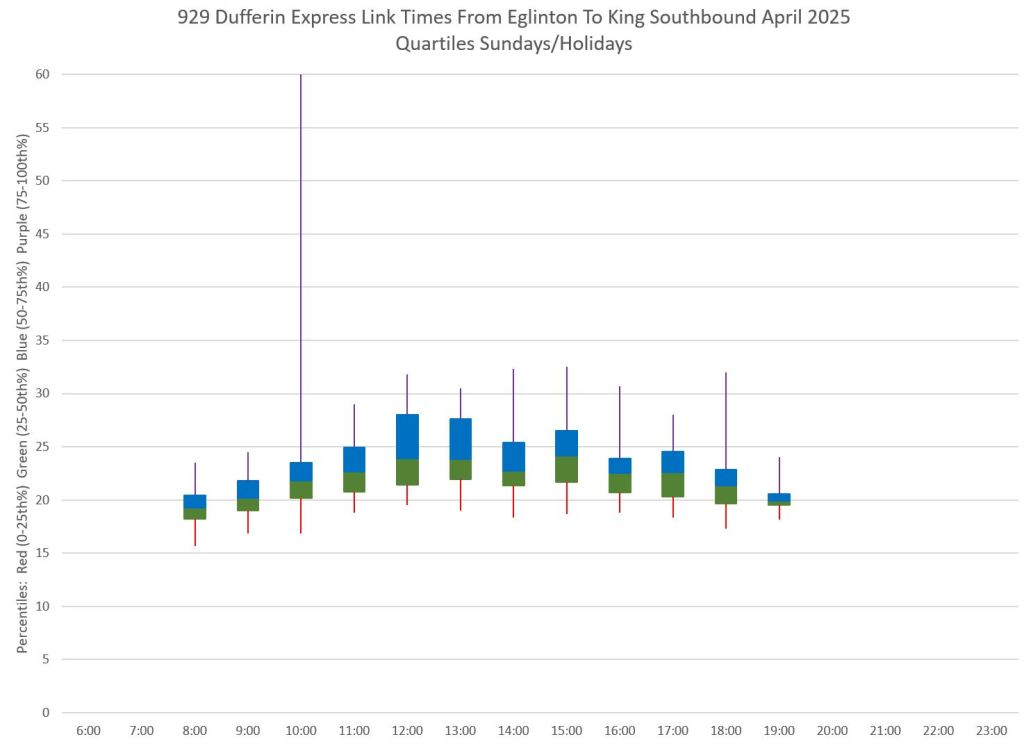
Quartiles
The breakdown of travel times between King and Eglinton into quartiles shows the rise in the spread of travel times on weekday afternoons, and to a much smaller extent on weekends.
Although the central blocks holding the 2nd and 3rd quartiles are fairly compact, the upper tails holding the 4th quartile are quite extended in some cases., primarily the afternoon peak northbound. This echoes the charts for the full route earlier in the article.
Weekdays


Saturdays

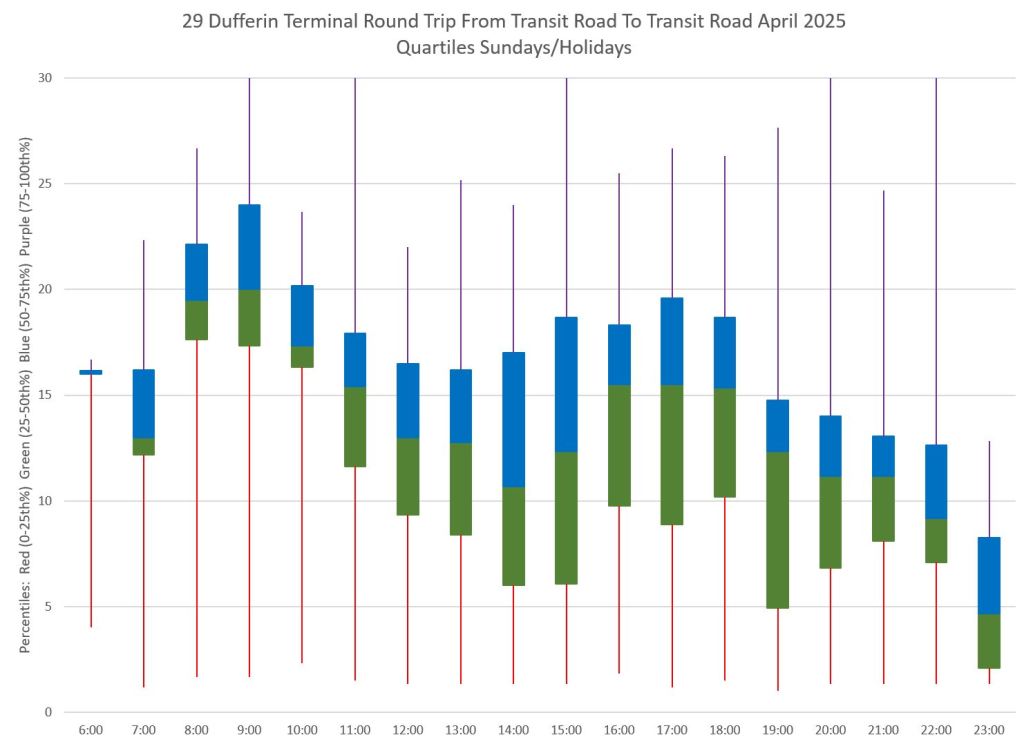
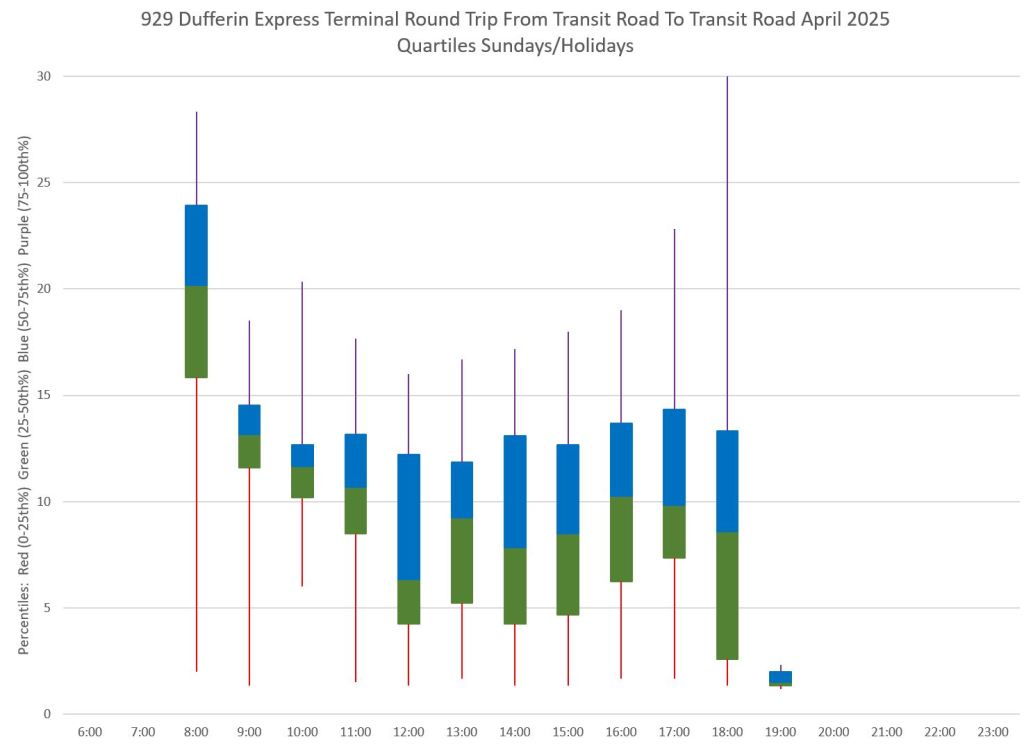
Sundays


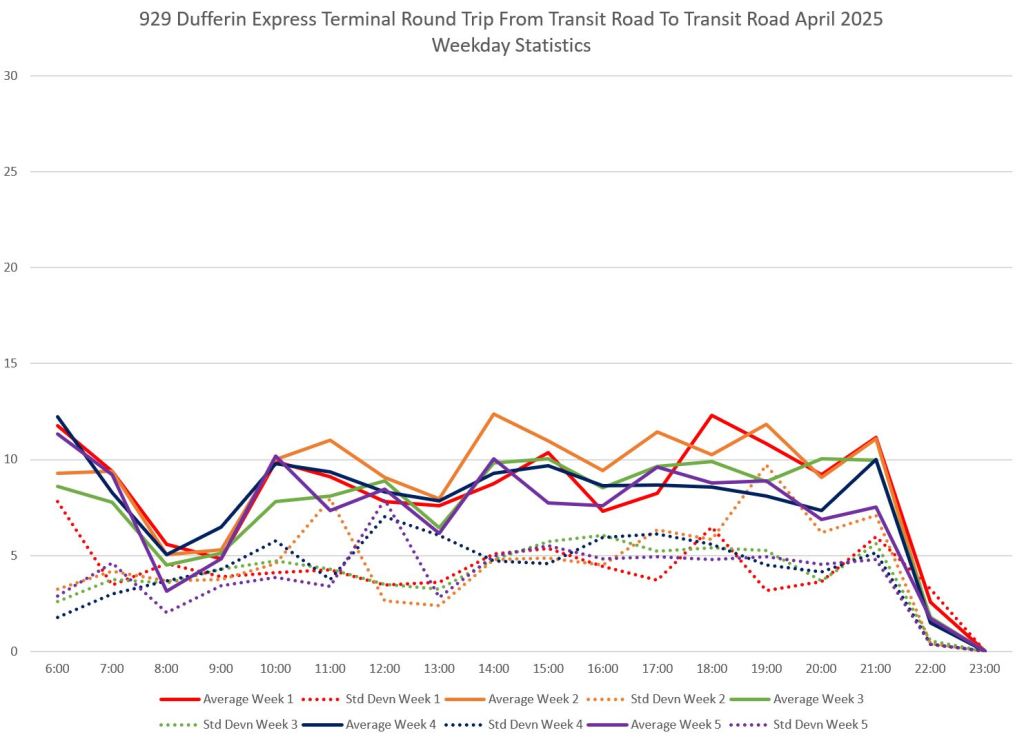
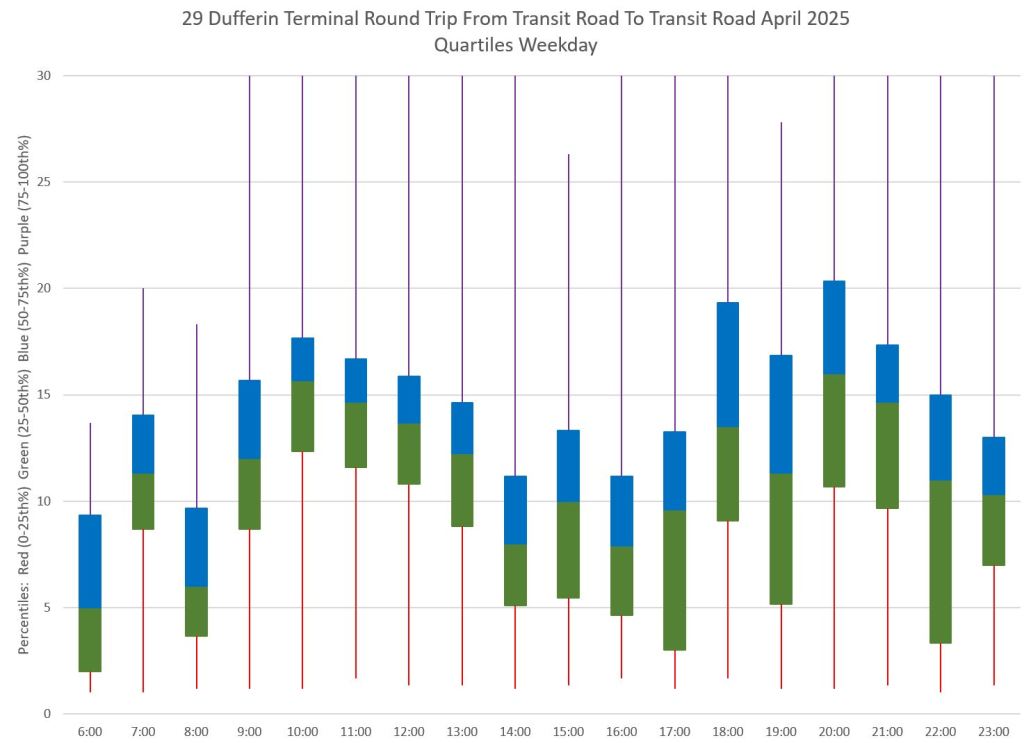
Time Spent at Terminals
The degree to which scheduled times are adequate to conditions can be inferred from the length of time buses spend at terminals. Very short periods where a bus enters and leaves quickly suggest too-tight times, whereas long times suggest that there is room for trimming.
The situation on Dufferin is intriguing because both conditions are evident, and there is a wide range of values. This echoes the variation in travel time over the full route as conditions change from day to day.
Wilson Station
The screenline for measurement here is at Wilson and Transit Road so that access time to and from the terminal is included. The values for local and express buses are not the same reflecting the tighter schedules for the express trips. The difference in travel times shown earlier between local and express buses is less than the spread in scheduled time, and so there is less room for recovery on the express trips.
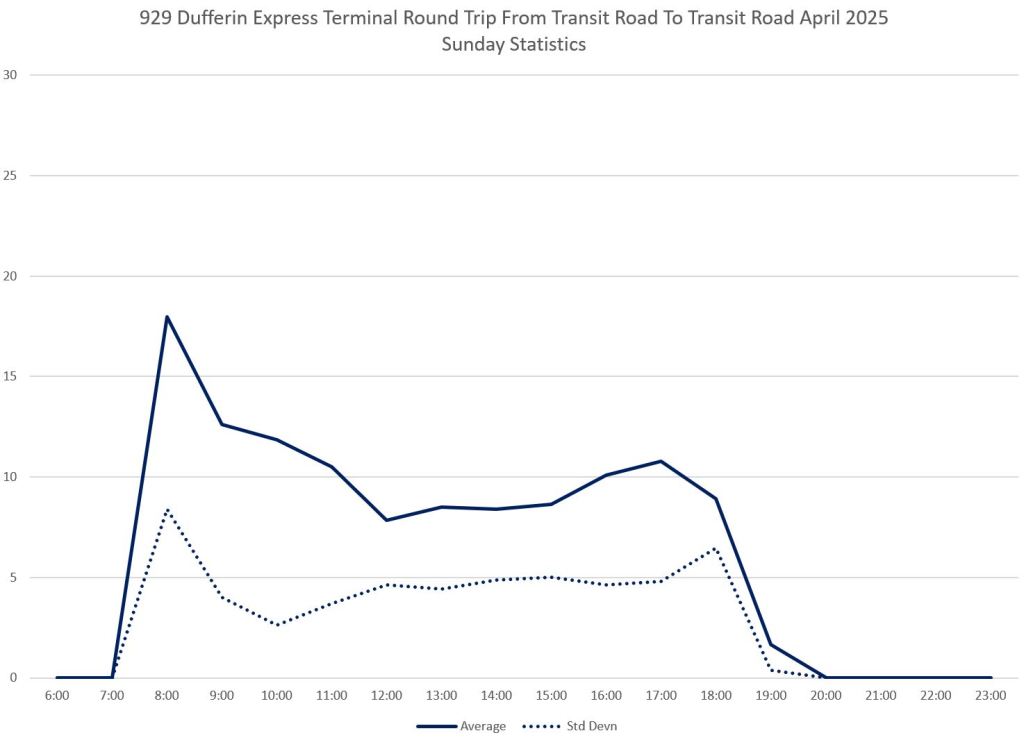
Terminal time averages are quite high on weekend mornings but drop back later in the day.
Weekdays

Saturdays


Sundays


Thanks Steve. Maybe the solution for Dufferin – and it is fairly narrow in many portions – is a subway? From Wilson/Yorkdale to the Ex/Lake? And both direct and shallow – either cut/cover (which is disruptive) or a near-surface tunnel the west side being better as that’s where the Dufferin Mall is and the Dufferin Bloor stop extends to the west, so easier connection. And we have a mall at Yorkdale, and I’m sure a mall could be sprouted near the south end. This presumes we can ‘do’ better planning to allocate subway resources where they’re more of public value, and lessen the private value of land enhancement and help to the construction interests that we now seem to have for our billion$. And yes, that would mean not having a ‘carservative’ transit czar at QP, and a more open/logical process.
Steve: The current hourly capacity of the Dufferin local and express services combined is in the same range as one subway train. As for alignment, going down the west side of Dufferin at Bloor runs into problems with the Bell Canada switching building just north of the intersection. Going under that is not happening. Also, the alignment could not be shallow at Bloor because it would have to pass under the existing subway structure. A mall at the south end? We are getting a spa! Don’t give DoFo ideas or he will build a subway to it (on top of whatever gerrymandered connection to the Ontario Line and GO Metrolinx cooks up).
LikeLike