
This is the first of three articles about TTC services on Dufferin Street, the 29 Dufferin local bus and its 929 Dufferin Express counterpart.
- This article reviews headway performance at the terminals and along Dufferin during the month of April.
- Part II will review travel times over the same area.
- Part III will review historical data back to January 2024 to see whether there have been changes in the route’s behaviour over the past 16 months.
Major points worth noting:
- Other than the restoration of the 29C service to Princes’ Gate in Fall 2024, there was no change in the scheduled level of service or travel times over the period studied here.
- Headways are not well-regulated on either the local or express services from either terminal during the entire day.
- At the point where buses would enter the proposed RapidTO red lanes, the service is already disorganized. Travel times might improve, but the irregular headways will not.
- Weekend service is even more disorganized than on weekdays.
- Congestion is evident at some locations and times along the route, but it is not pervasive. Some problem locations are within the proposed transit priority area (south of Eglinton), but some are not (notably near Yorkdale northbound).
Service Design
Service in the Dufferin corridor consists of two routes:
- 29 Dufferin provides local service south from Wilson station with two branches at the south end.
- 29A runs to Dufferin Loop just outside of the Exhibition grounds beside the GO corridor.
- 29C runs through the Exhibition to Princes’ Gate at the eastern end. This branch was suspended for construction and special events until fall 2024.
- 929 Dufferin Express runs from Wilson Station to Dufferin Loop.
The TTC service designs are shown below. There was no change in service levels or travel times in the corridor through 2024-25.
Note that local service on weekend afternoons as well as on Saturday evenings is more frequent (5′ vs 8′) than on weekdays, but this is offset by less frequent express service (10′ vs 8′) in these intervals.
In effect until Sept-Oct 2024:


In effect Fall 2024 to April 2025:
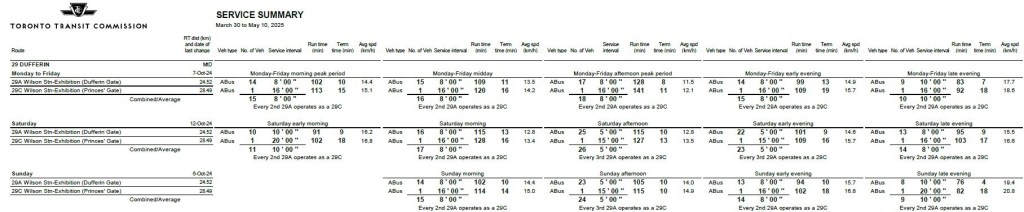

Chart Organization
The charts in this article are arranged with the 29 local service on the left and the 929 express service on the right. Where data for both directions are included in one group, the northbound data are in the top row and the southbound in the bottom row.
For the purpose of these charts, I have measured headways (the interval between buses) at:
- Northbound at King: This consolidates both the Dufferin Gate and Princes’ Gate services of the local 29 Dufferin, as well as the 929 Dufferin Express at a common point. This is only a few blocks from the terminus for most buses, Dufferin Loop, and it avoids any confusion with buses jockeying right at the loop.
- Southbound at Transit Road: This screenline is just south of Wilson Station and measures headways on both 29 and 929 services leaving the station.
Some charts include both average and standard deviation (SD) values. The SD is a measure of the dispersion of individual values around the average. If the SD is very low, then most headways will lie close to the average. If the SD is higher, then many trips will operate on either well below or above the average. Note that the average is not necessarily the same as the scheduled headway because there might be missing or extra trips.
For an SD value of 5 minutes, about 2/3 of trips will lie within a band 10 minutes wide around the average, and the remaining 1/3 will be further away. This is visible in charts showing the detailed data, as well as breakdowns by quartiles.
Service Standards
The TTC Service Standards allow departures from terminals within a window from 1 minute early to 5 minutes late. Recently, management has tightened this standard to prohibit early departures so that the window is now only 5 minutes wide. However, on a scheduled 8 minute headway, the common level on both local and express services, this means that a pattern that should go 0-8-16-24-32-40-48-56 minutes past the hour can actually be 0-13-16-29-32-45-48-61 and still be considered as “on time”.
Even then, reliability is not measured once buses leave the terminal, and so service mid-route can worsen without being measured or reported. Moreover, the target need only be met for 60% of trips. This is the reason why TTC reports much rosier performance from its routes than riders actually experience.
On Dufferin there are two further issues:
- On-time performance is measured separately for express and local trips. This makes sense because express bus cannot stay on an even spacing with locals. This means that stops served by both types will see uneven services because they operate at different speeds.
- Service is not measured where branches join, and there is no guarantee that a 29C from the Princes’ Gates will blend properly into a gap in 29As coming out of Dufferin Loop.
Note that the values reported here are headways, the space between buses, not the “on time performance” relative to the schedule. Obviously if service were strictly “on time” it would also be regular, but riders experience headways, not schedules, as they peer into the fog hoping a bus will come into sight.
Headway Reliability
Northbound from King / Southbound from Transit Road
Monthly Stats
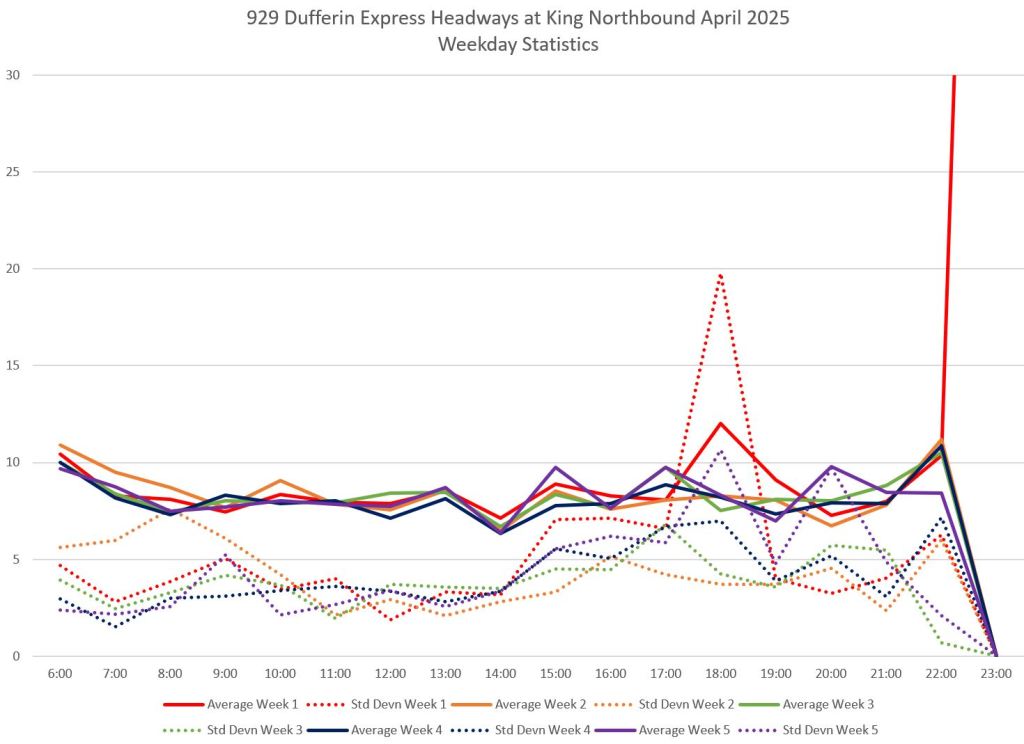
For both the local and express services, the standard deviation (SD) of headways is high, and crests the five minute line particularly in the PM peak. This indicates that buses are not evenly spaced leaving the terminals.
One issue (explored later in this article) is that although every third 29 Dufferin originates from the Princes’ Gate, this service is not blended with the other two-of-three buses leaving Dufferin Loop. This is not a scheduling issue, but an operational one.
All of the 929 express buses originate at Dufferin Loop, but their departures are erratic.
At the north end of the route, all buses originate at Wilson Station, but with similar SD values to the south end of the route. Buses are not leaving the terminal on a regular spacing.

Detailed Data
The next set of charts shows the detailed data points corresponding to the stats above. Although there is a denser band of points between five and ten minutes, many points lie outside of this range. Values above fifteen minutes and close to zero (buses running in pairs or worse) are common.
These “clouds” show just how unpredictable service can be on Dufferin during all service hours. Riders might be lucky and get one or more buses immediately, but they could also wait 15 minutes or more. A basic problem is that more waiting riders will accumulate during a gap in service, and they will be packed onto a bus that is carrying more than its share of the route’s load.
Again, these data represent conditions at or near terminals before the effects of traffic congestion enroute.


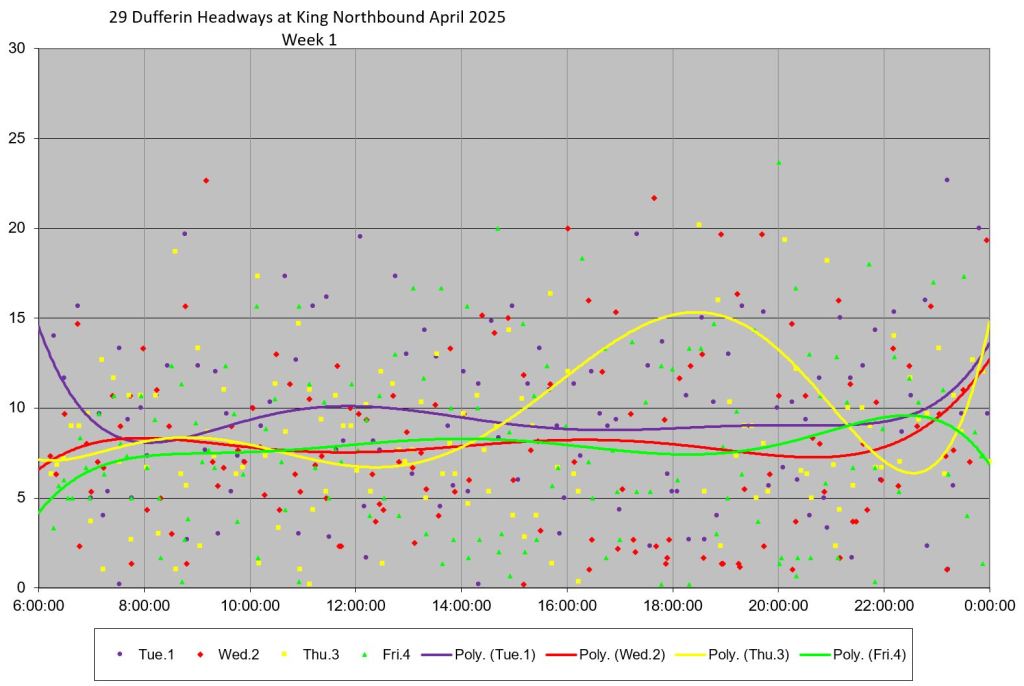
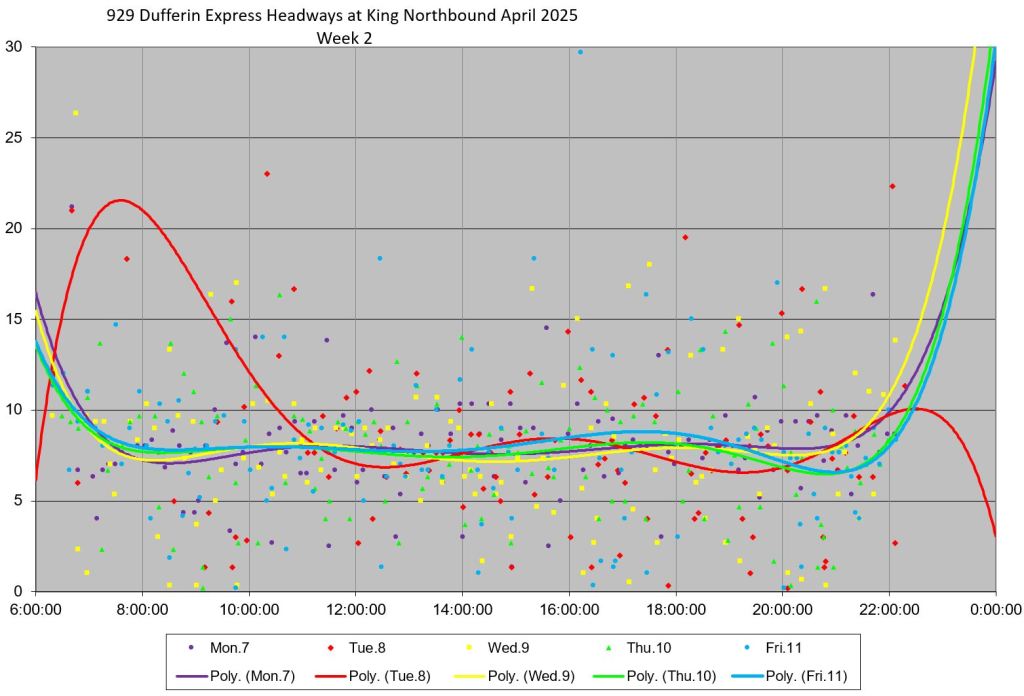
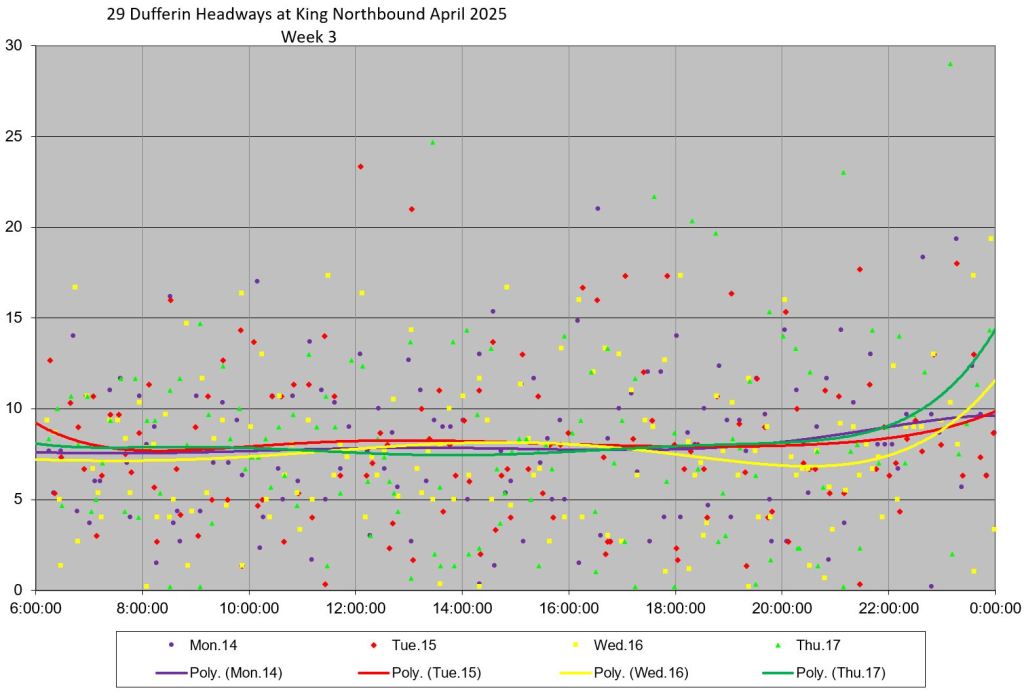
Daily Breakdown By Week
The weekly and daily breakdowns show data for each day in its own colour with an interpolated trend line. These lines generally thread across the page through the data points at roughly the scheduled headway. All of the buses are there but they do not arrive evenly spaced.
Headways are scattered on all days, not just on a few with unusual events.
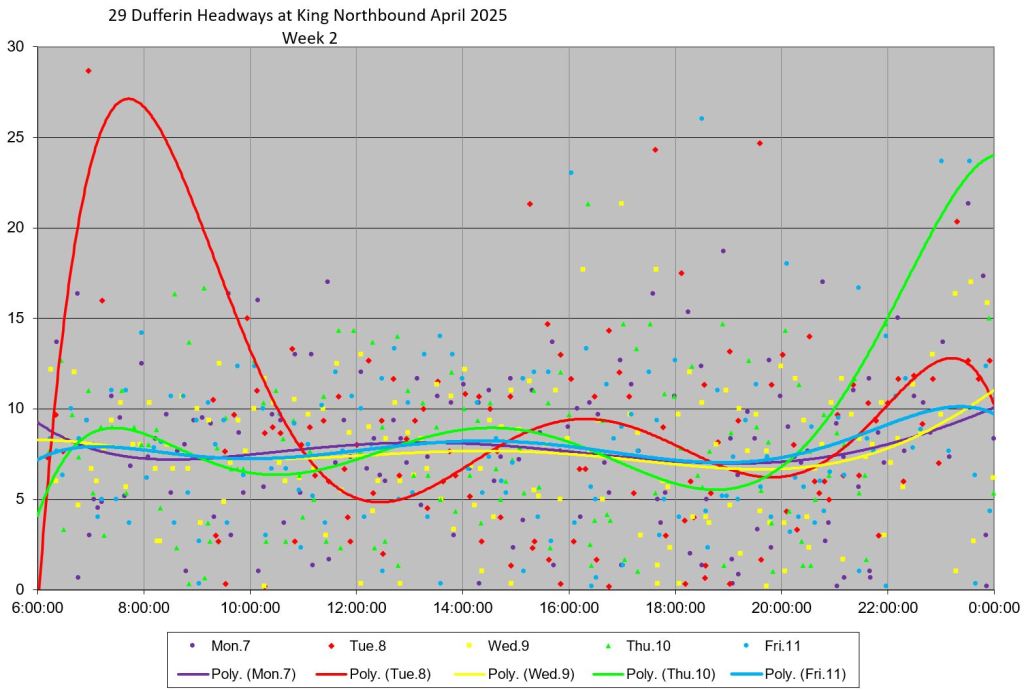
A few lines on the charts wander substantially:
- Thursday, April 3 (yellow, week 1): There is a gap of about 90 minutes in the TTC’s data archive that causes the trend line to drift upward at about 6pm.
- Tuesday, April 8 (red, week 2): There was a major service interruption due to snow accumulation in the early morning. This delayed and diverted buses south of Eglinton and caused very wide gaps in service where it did operate.
These days and a few others of interest are explored in more detail later in the article.
Northbound


Southbound
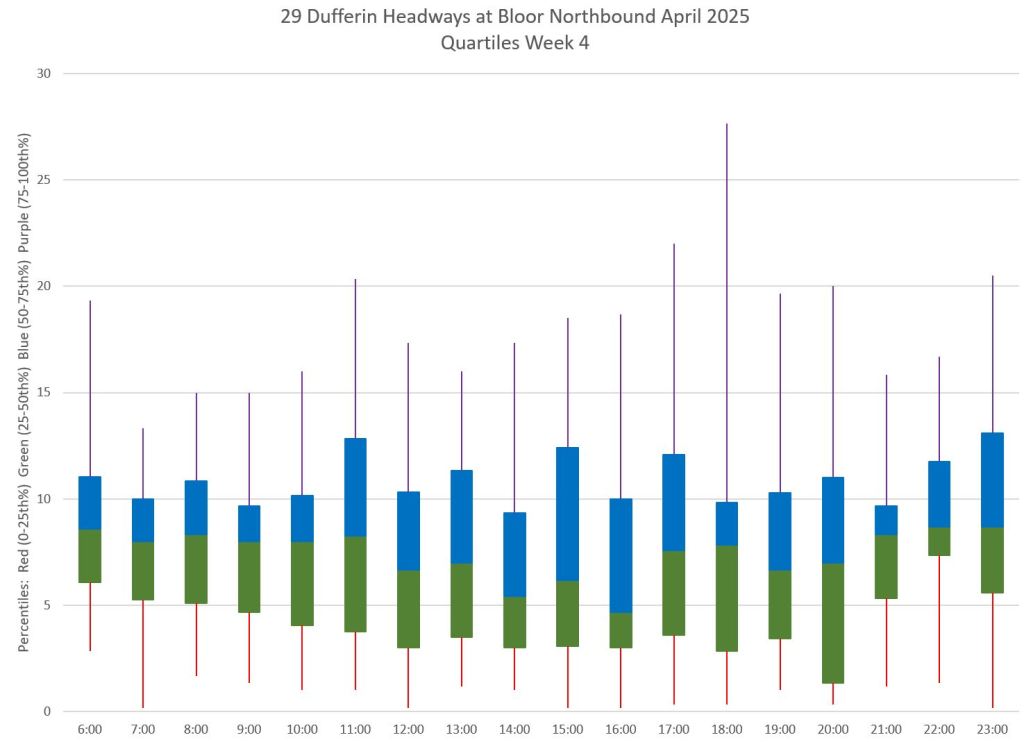
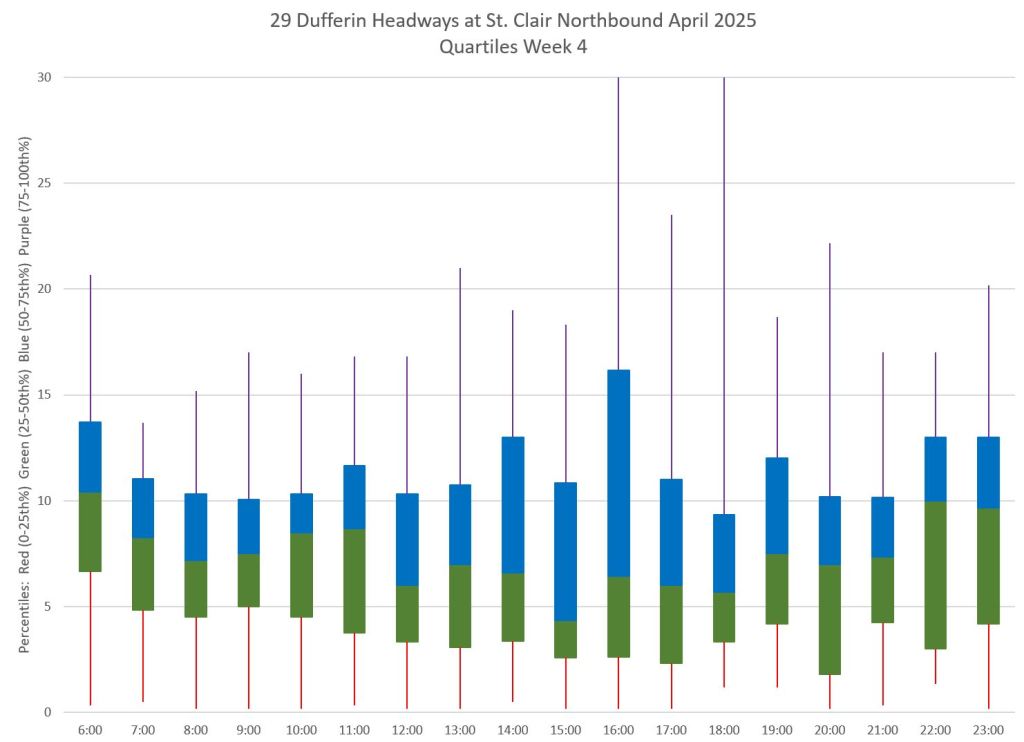
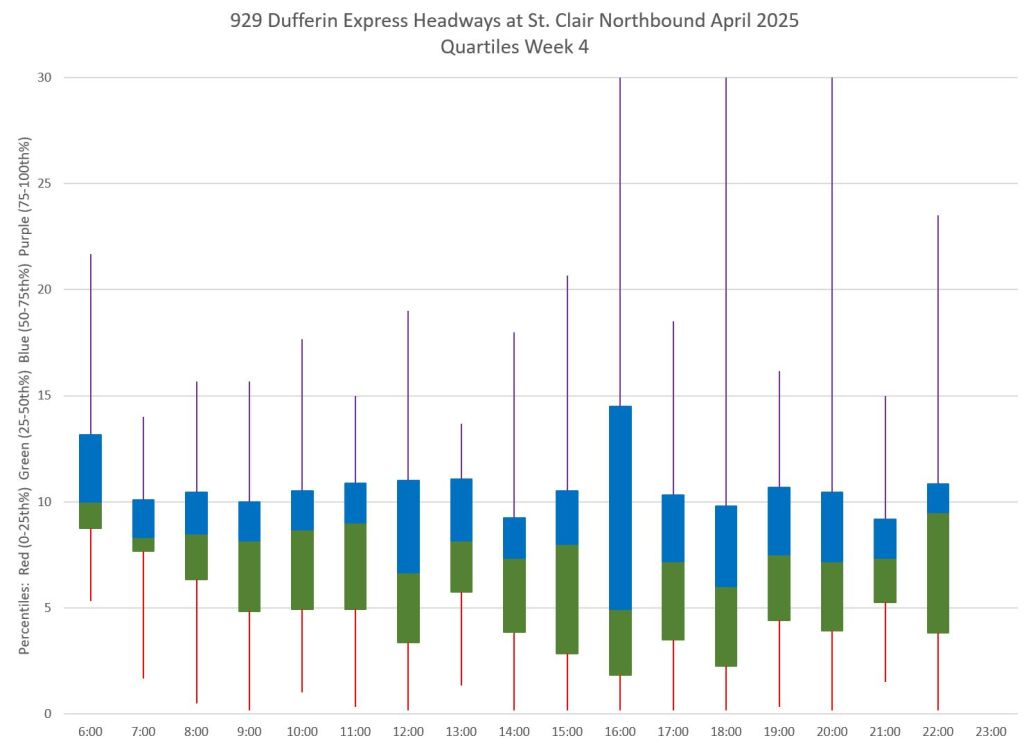
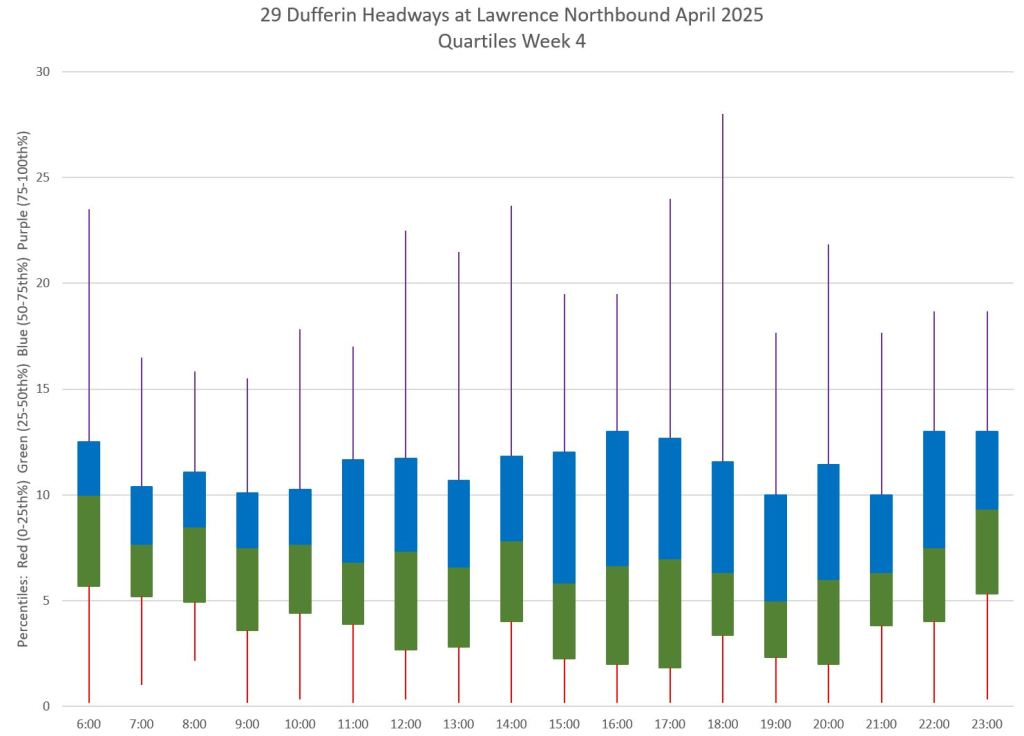
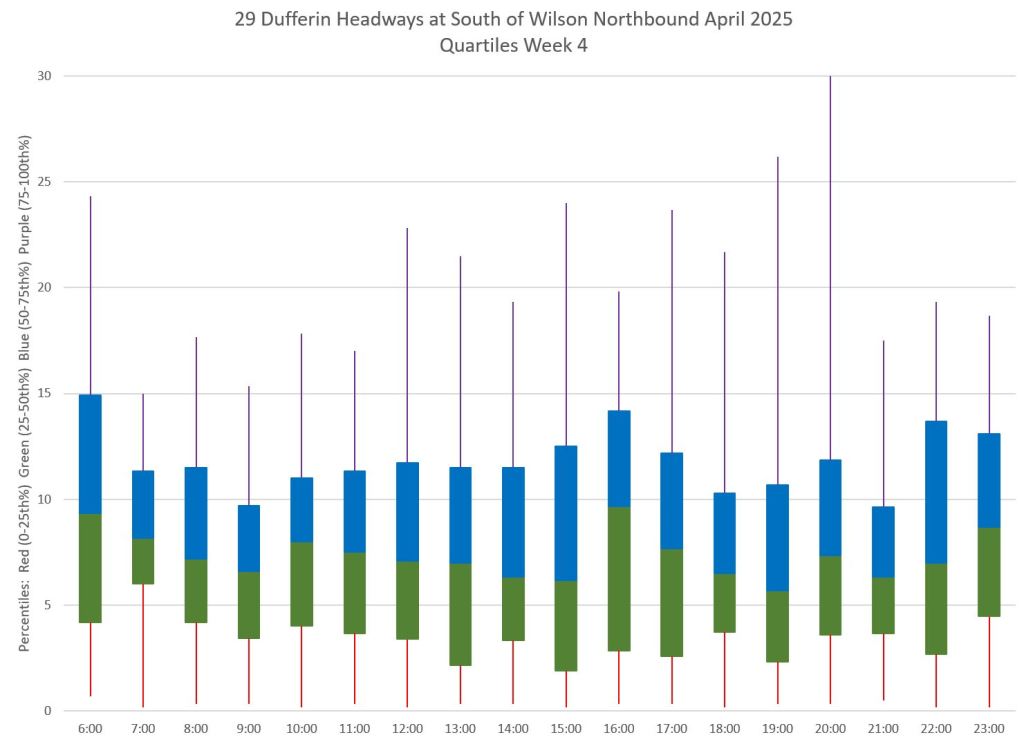
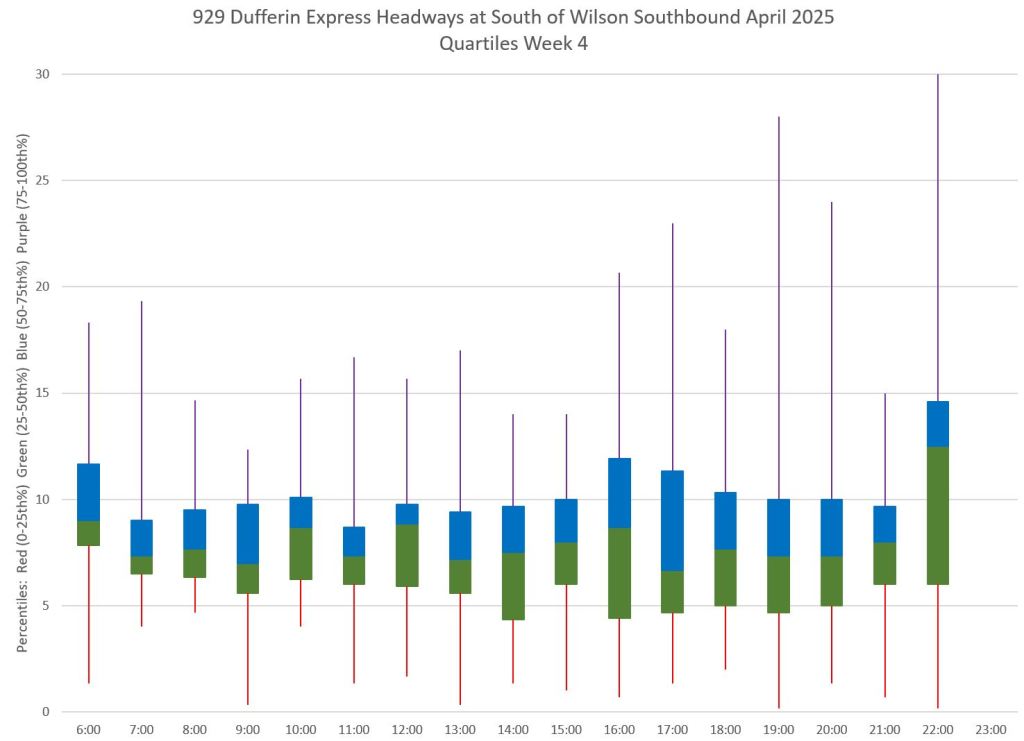
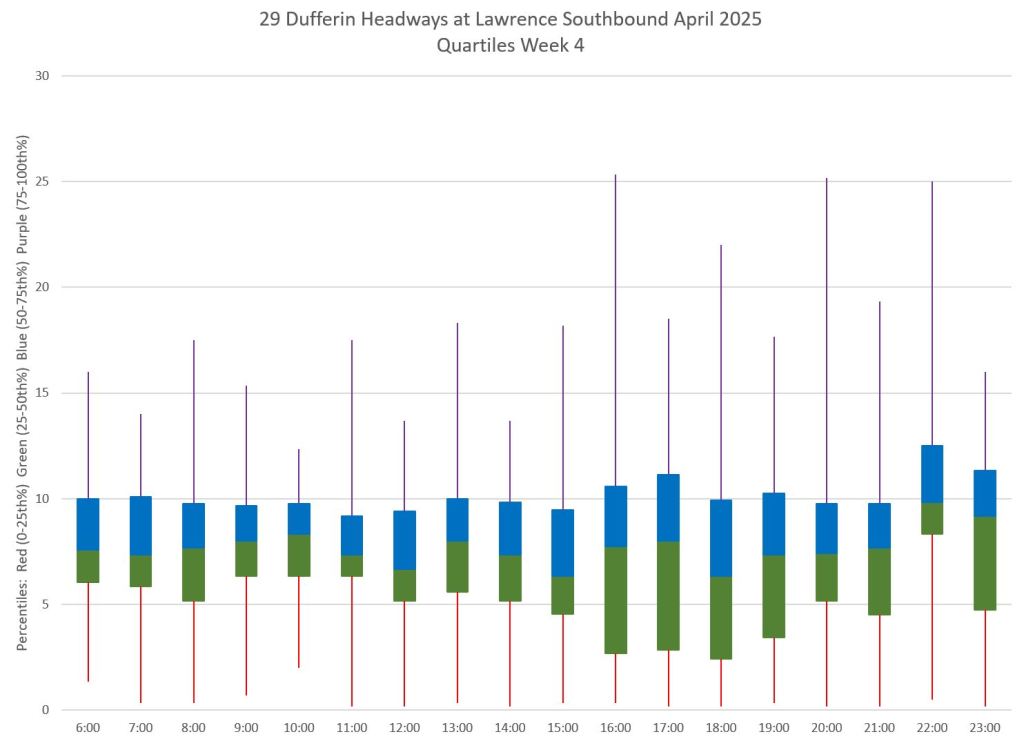
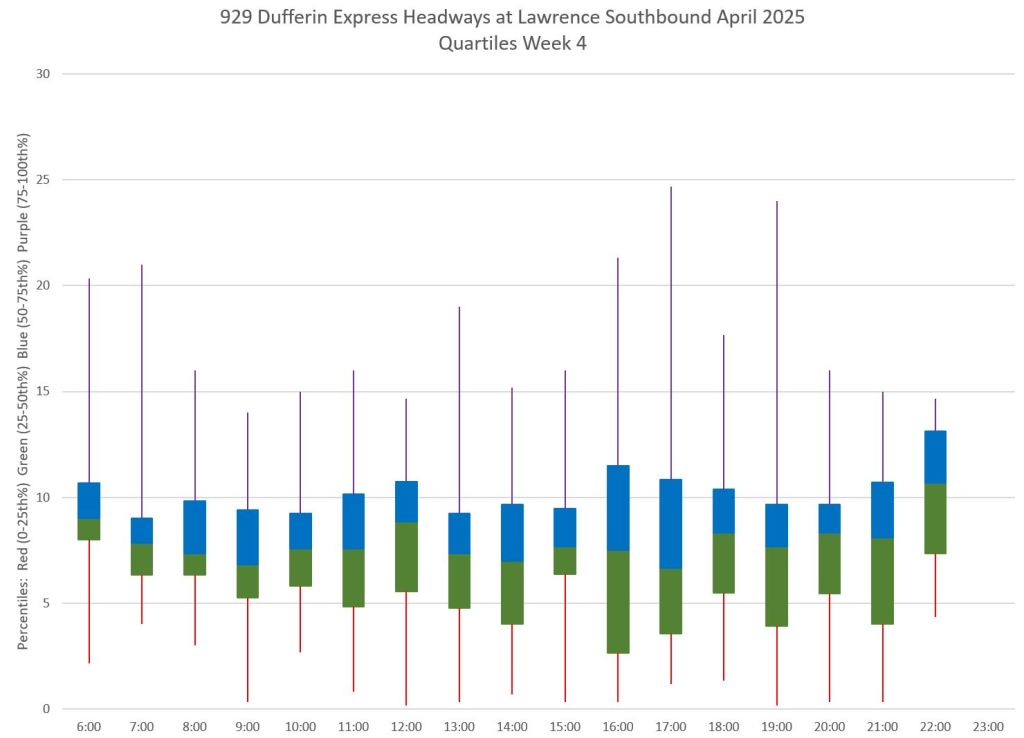
Evolution of Headways Enroute
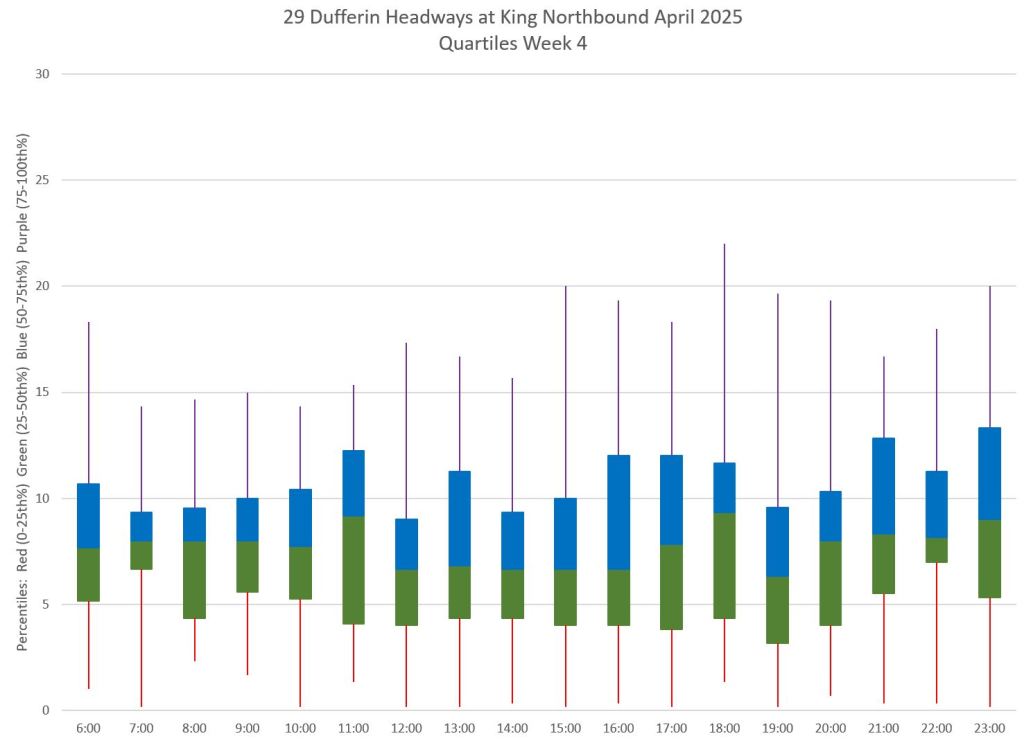
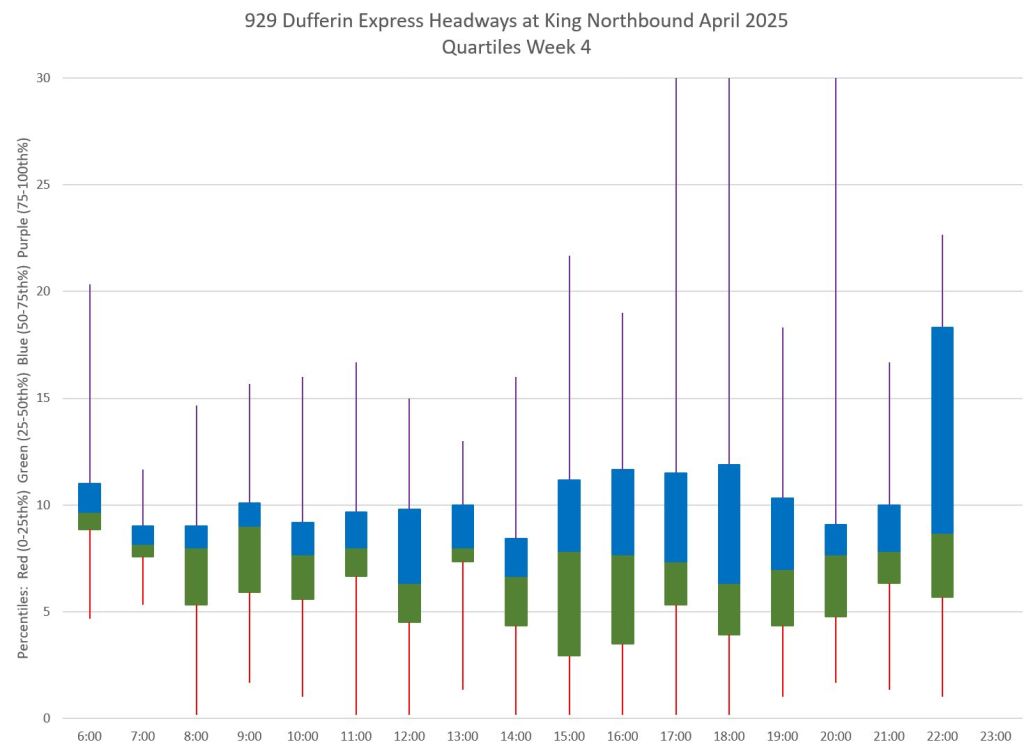
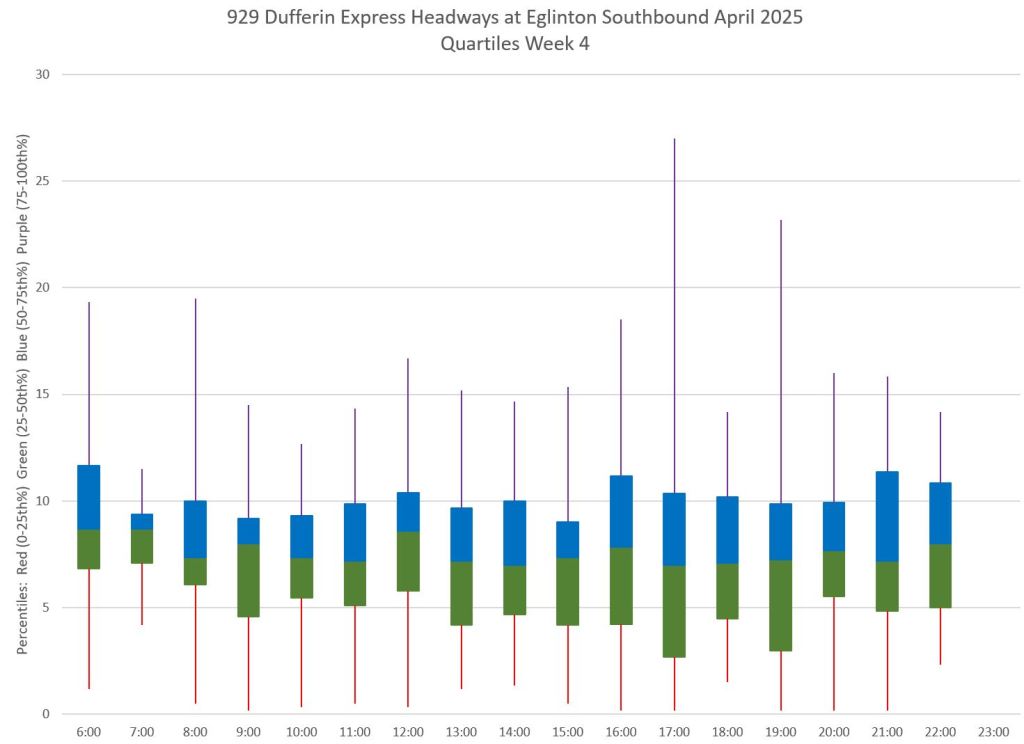
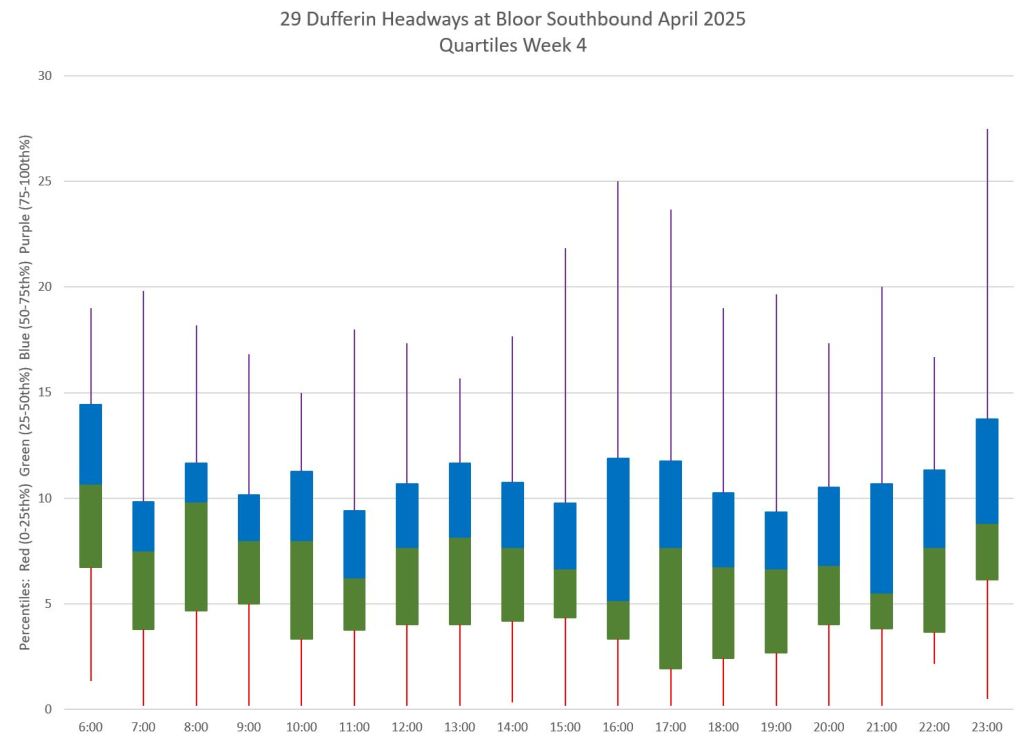
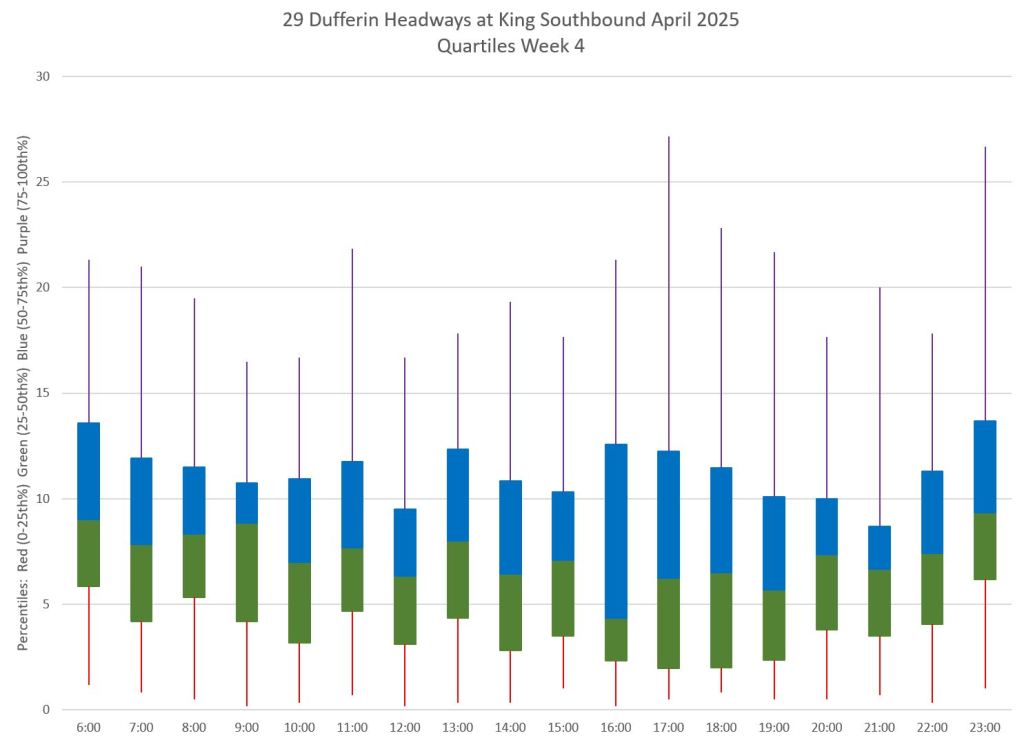
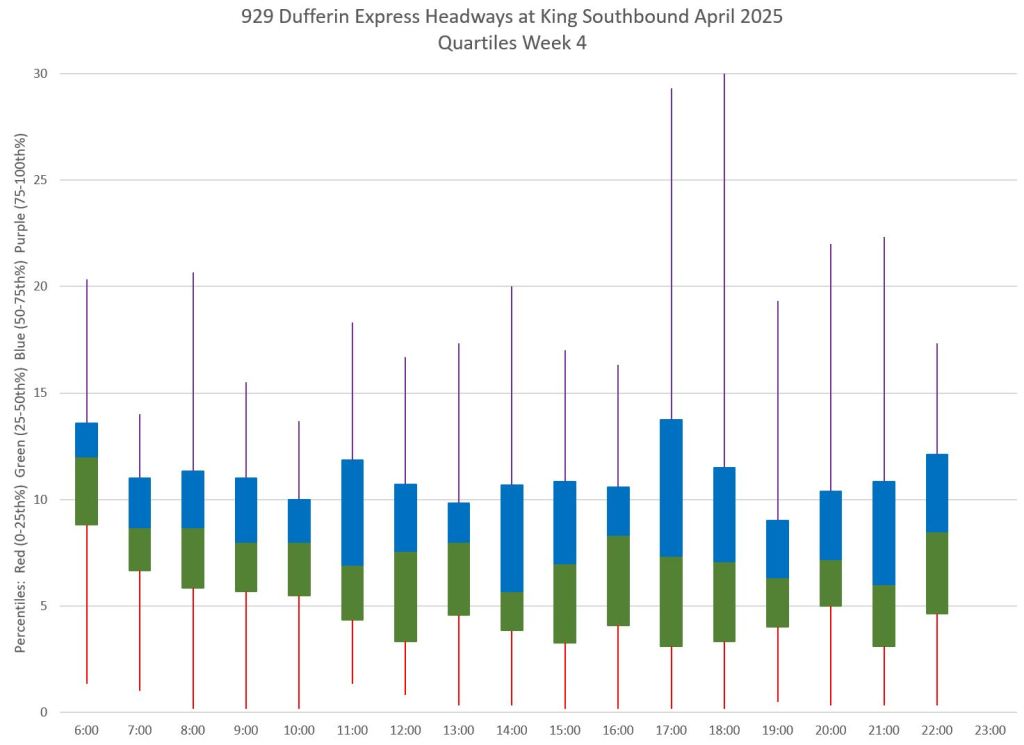
The charts in this section present the data by hour in quartiles:
- 1st (0-25%): lower red tail
- 2nd (25-50%): green box
- 3rd (50-75%): blue box
- 4th (75-100%): upper mauve tail
If the central green and blue boxes occupy a small space, this means that half of the trips operated on headways in a correspondingly small range. The tails show the range of values for the other half of trips above and below the median.
Note that the median is not the same as the mean (average), but represents the middle of the set of values. Half are above, half are below. Although the scheduled headway might be 8′, the median could be above or below this depending on the actual behaviour of the service. If most buses ran on short headways while a few ran on long ones, then the median will be below the average.
These ranges are already fairly wide at the terminals. The red tails showing the lowest quartile routinely extend down to zero, and the mauve upper tails stretch to 20 minutes and beyond.
The height of the central boxes varies and generally grows as vehicles move along the route. This is due to closely-spaced buses catching up to each other leaving an ever widening gap behind. This is more noticeable southbound where headways are in better shape at Transit Road than northbound starting from King.
King Street northbound and Eglinton Avenue southbound are the entry points to the proposed RapidTO exclusive lanes. Headways at these points are already dispersed over a wide range, and the red lanes will not fix this problem. Travel times on the lanes will improve in parts of the day where buses now face delays, but this will not fix erratic service north and south of their coverage.
The data here are taken from Week 4 when there were no holidays or unusual events that might skew the charts.
Northbound


Southbound


Weekends
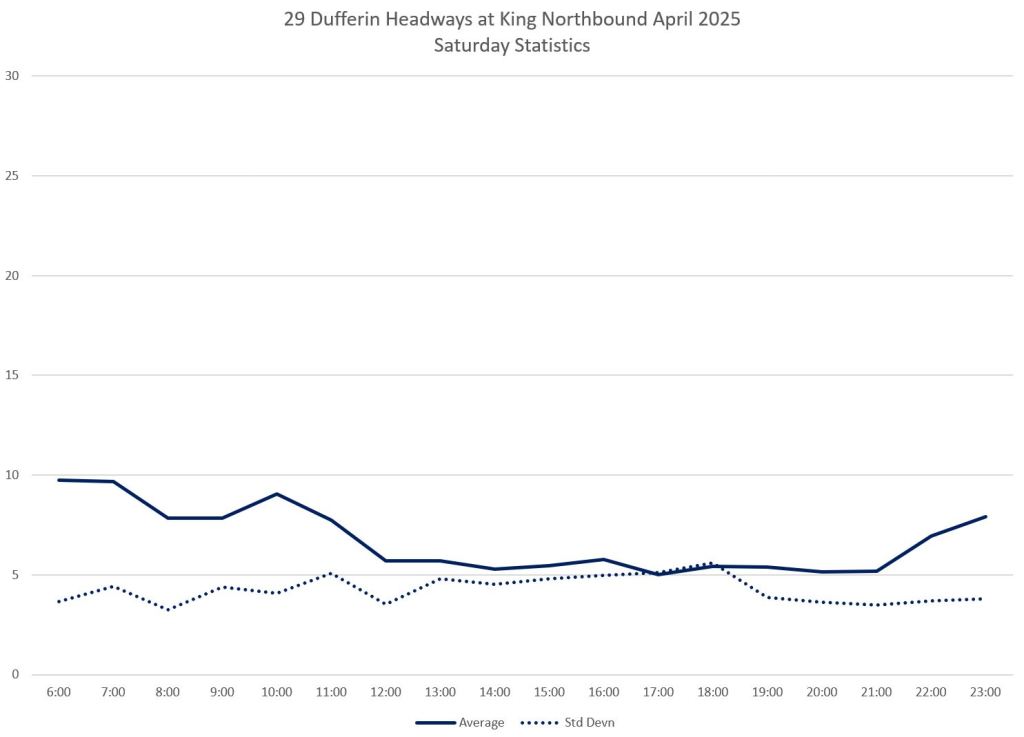
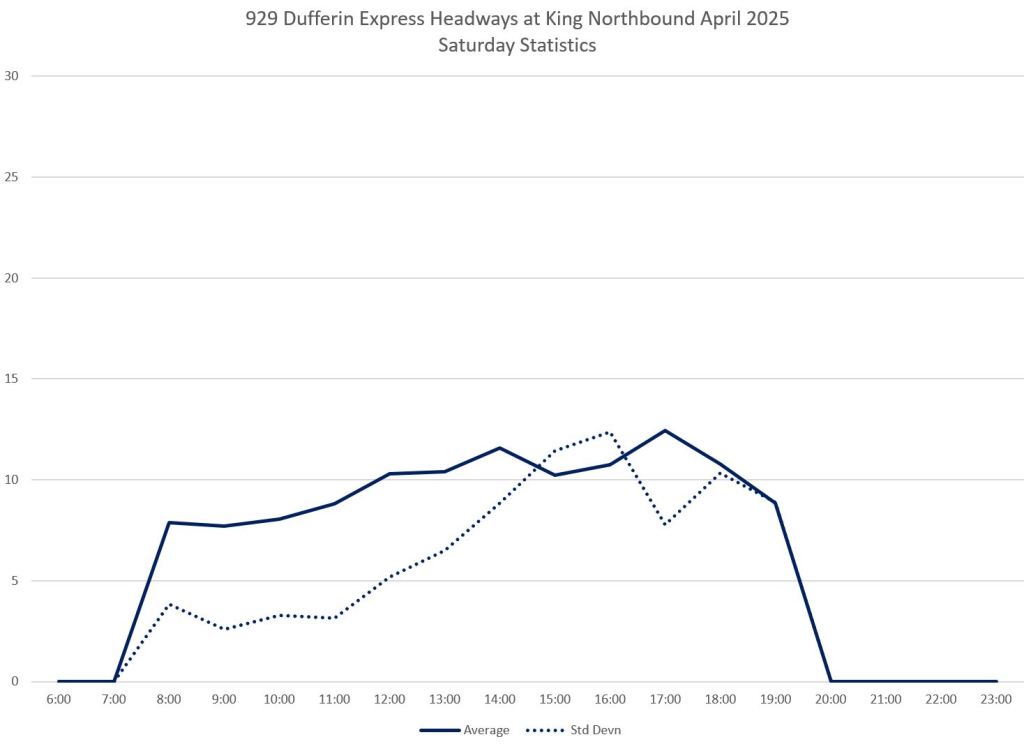
Saturday Stats
Headway statistics on Saturdays are worse than on weekdays especially for the express service with high SD values. The local service operates every 5′ in the afternoon and early evening, but with an SD value almost equal to the average showing that bunching is very common with a mix of wide and narrow headways. The express service SD values climb to 10′ from the mid-afternoon onward showing this service is even more disorganized.
These values are shown at or near terminals where, in theory, service should be well-regulated and reliable. Quite clearly it is not. The situation along the route does not improve. The segment-by-segment charts are similar to the weekday ones shown above, and I have omitted them in the interest of brevity. [Readers are allowed to chuckle here.]
Saturday Detailed Data
The detailed data shows the scatter of actual headways for local and express services on each Saturday. In both cases the trend lines stay fairly close to the scheduled headways, but the individual data points are widely scattered.


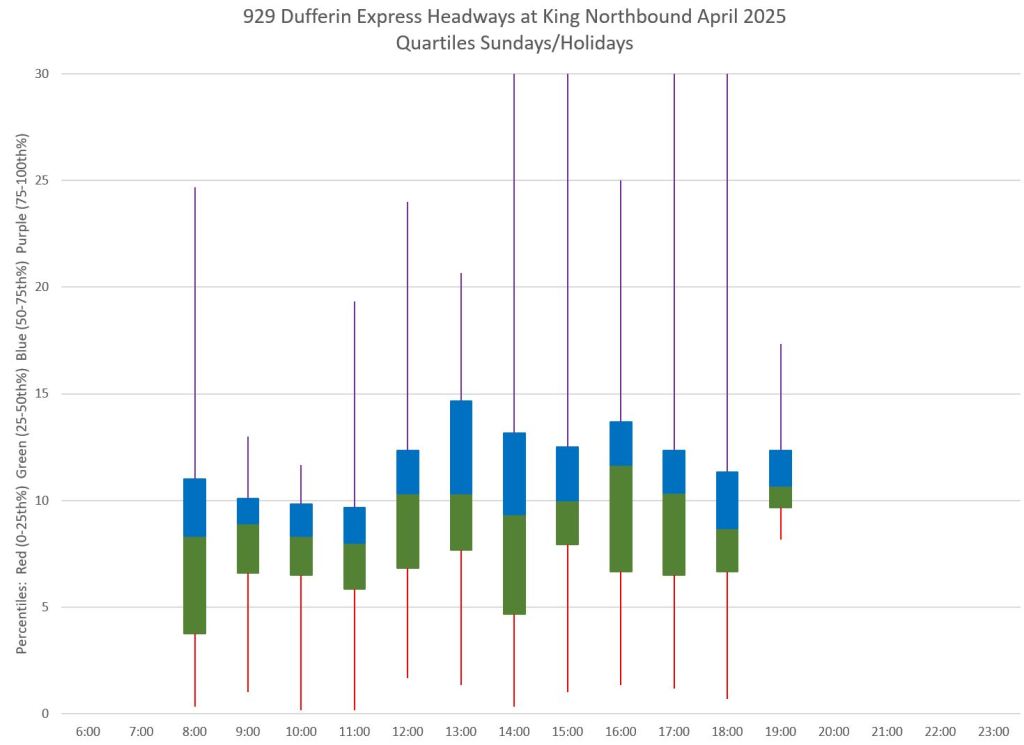
Saturday Quartiles
These charts show data from the four Saturdays consolidated by hour and quartile. The range for the central quartiles on the local service is slightly wider than the TTC’s five minute target, but the express service is atrocious from mid-after onwards.


Sunday/Holiday Stats
These charts contain data for the four Sundays in April plus Good Friday when service operates similarly to Sundays. Note that the 29 local service does no report any data on Sundays until about 8am because the 329 night bus operates until the subway opens.
The statistics for Sundays are similar to Saturdays, but not quite as extreme with SD values staying mostly lower here for both services. Even so, with values around 5′ for both local and express buses, the headways are dispersed beyond the TTC’s target.


Sunday/Holiday Detailed Data


Sundays/Holiday Quartiles

Sample Daily Service Charts
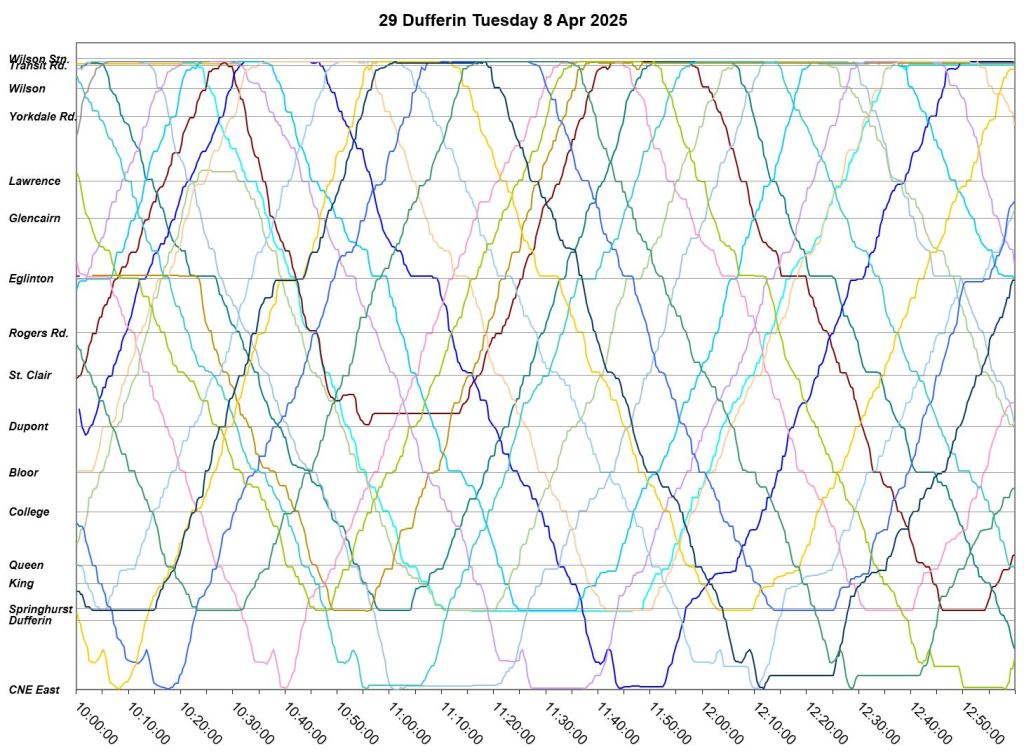
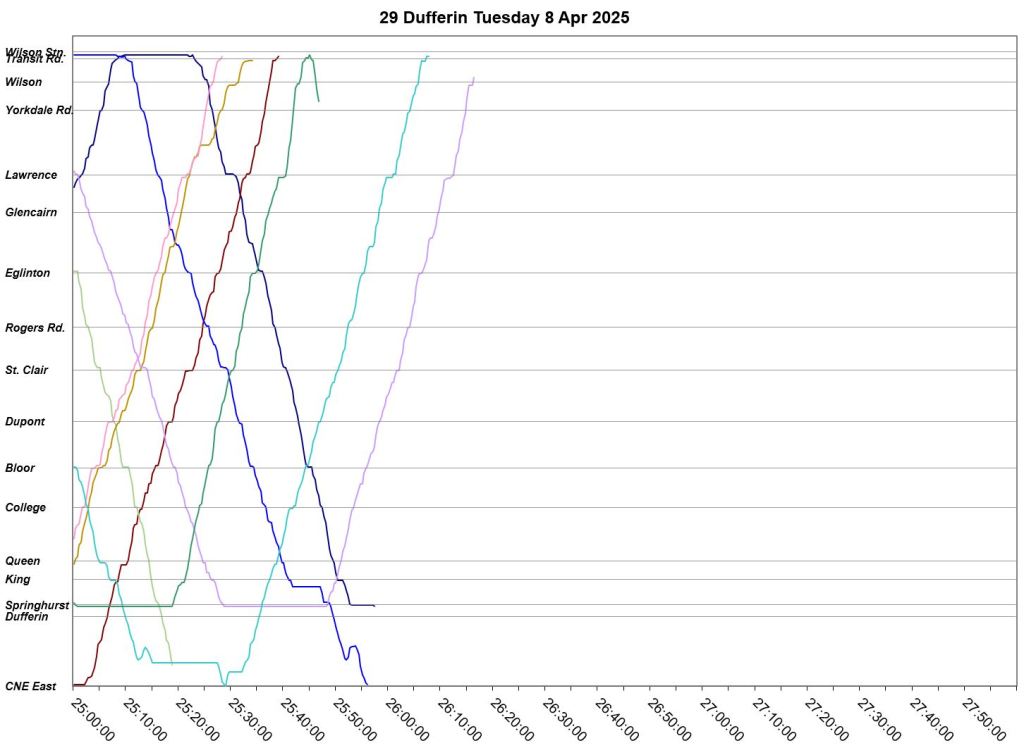
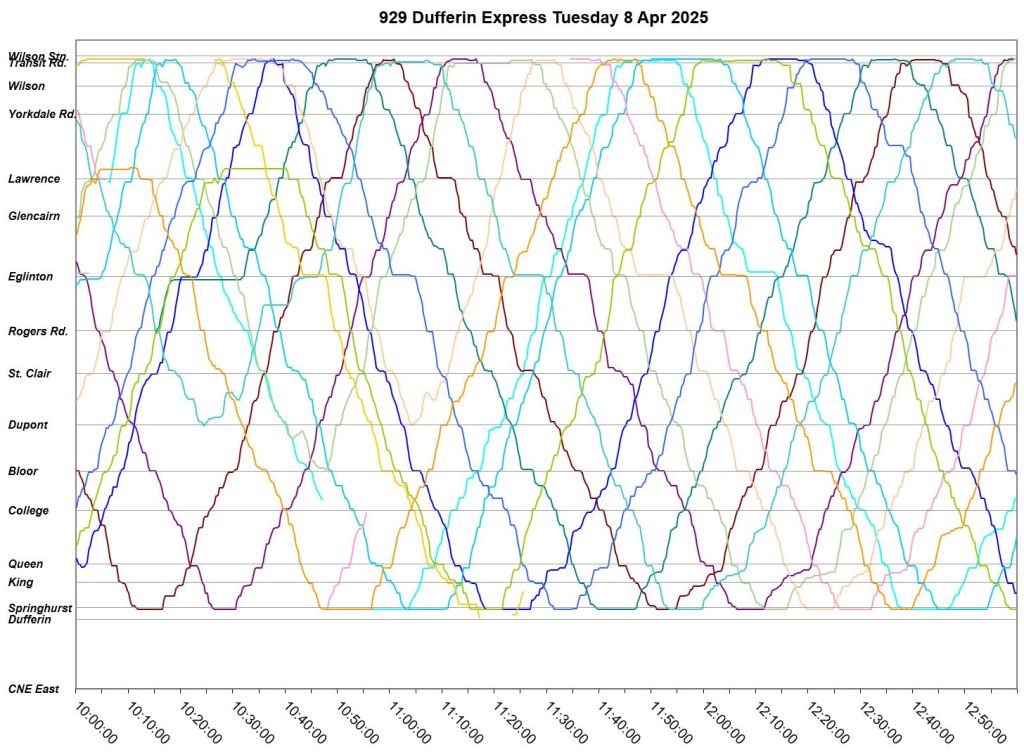
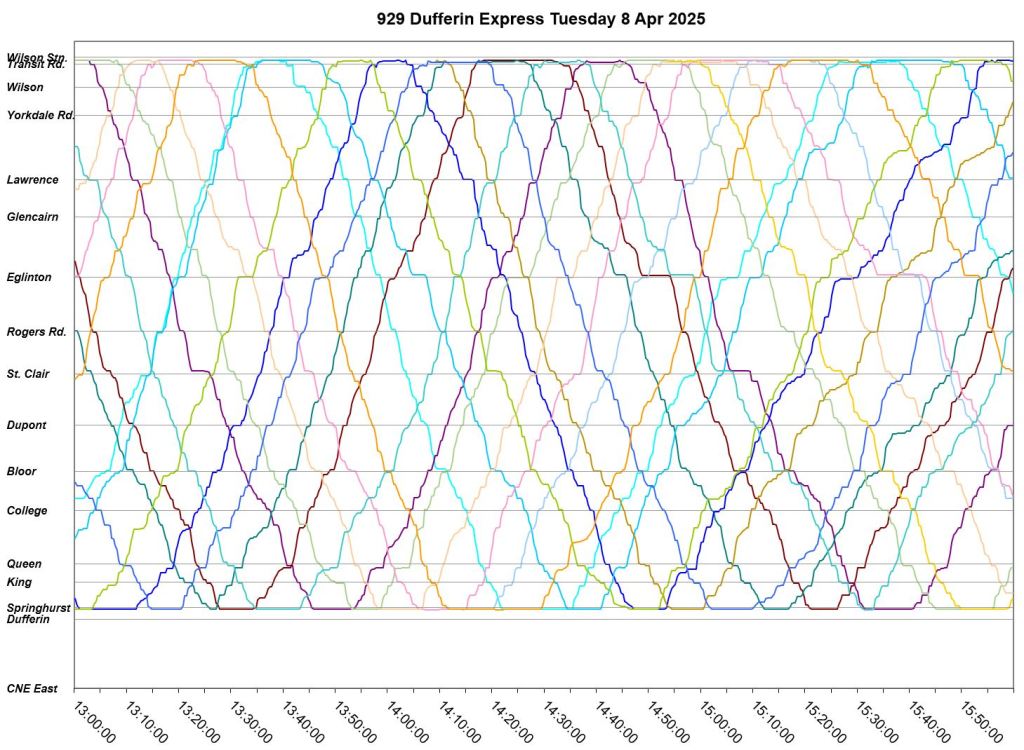
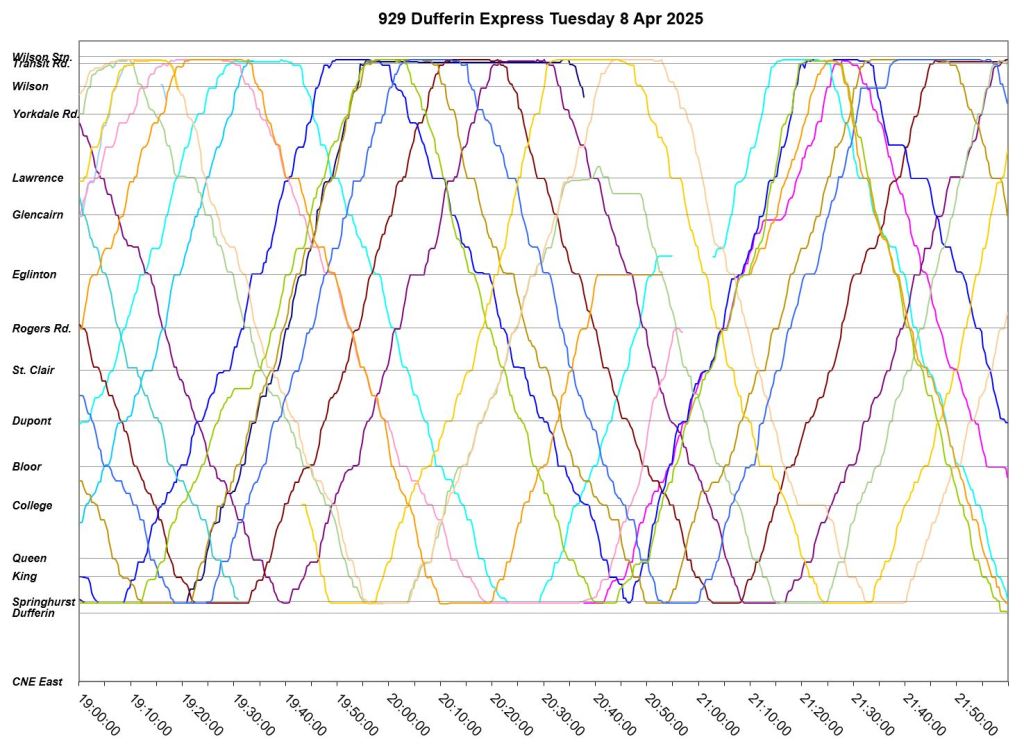
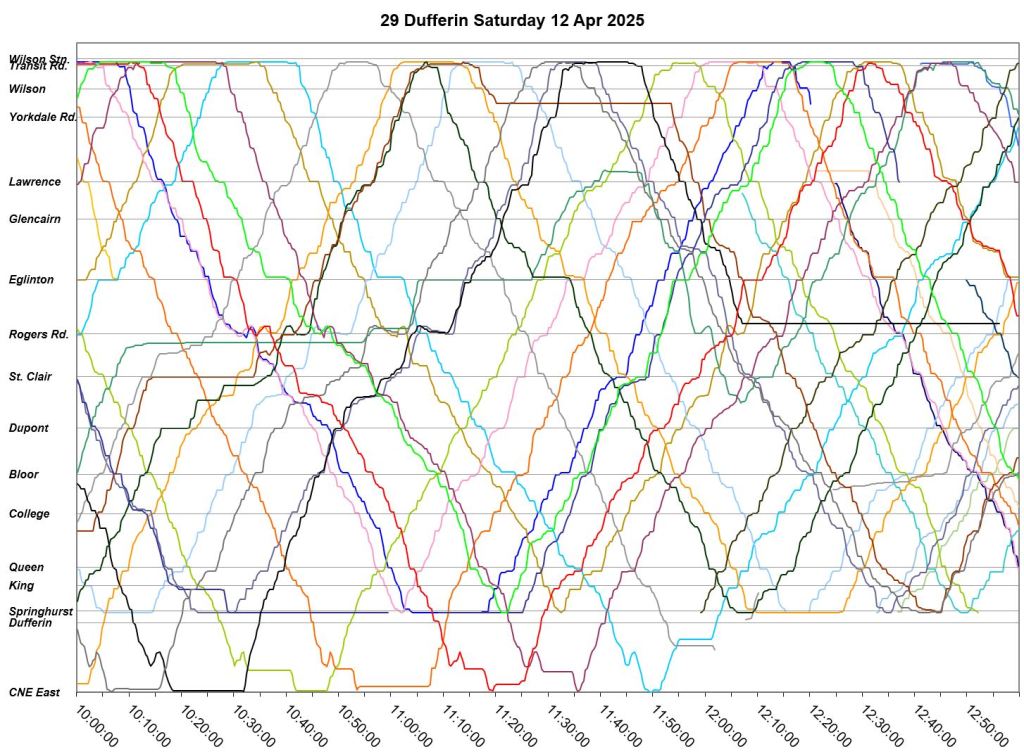
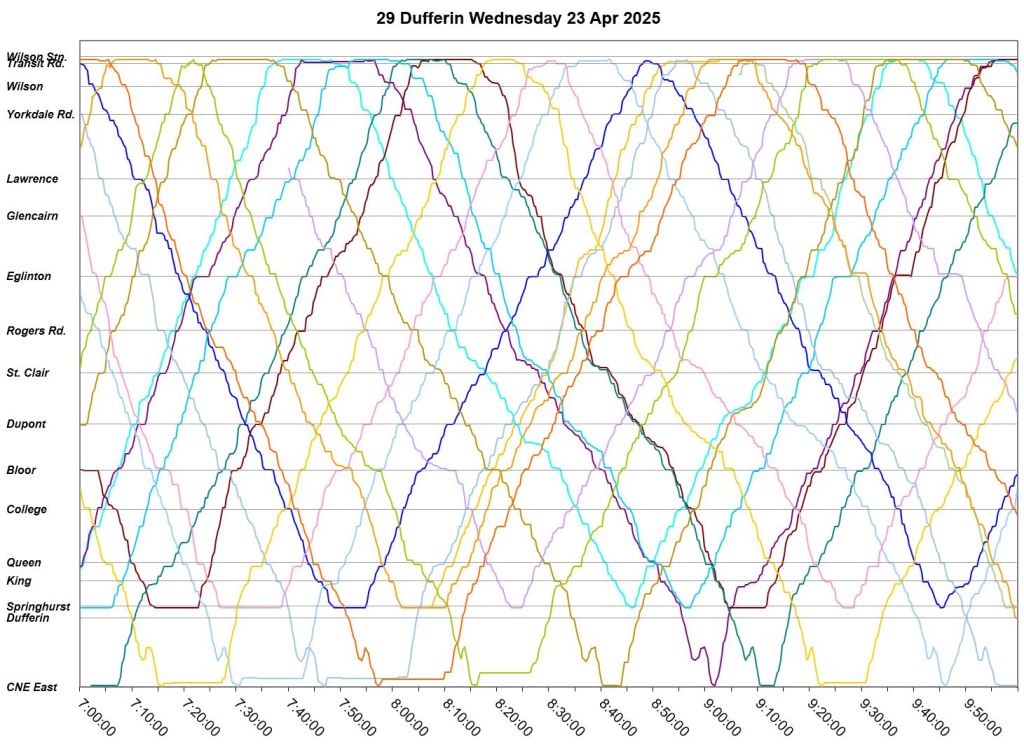
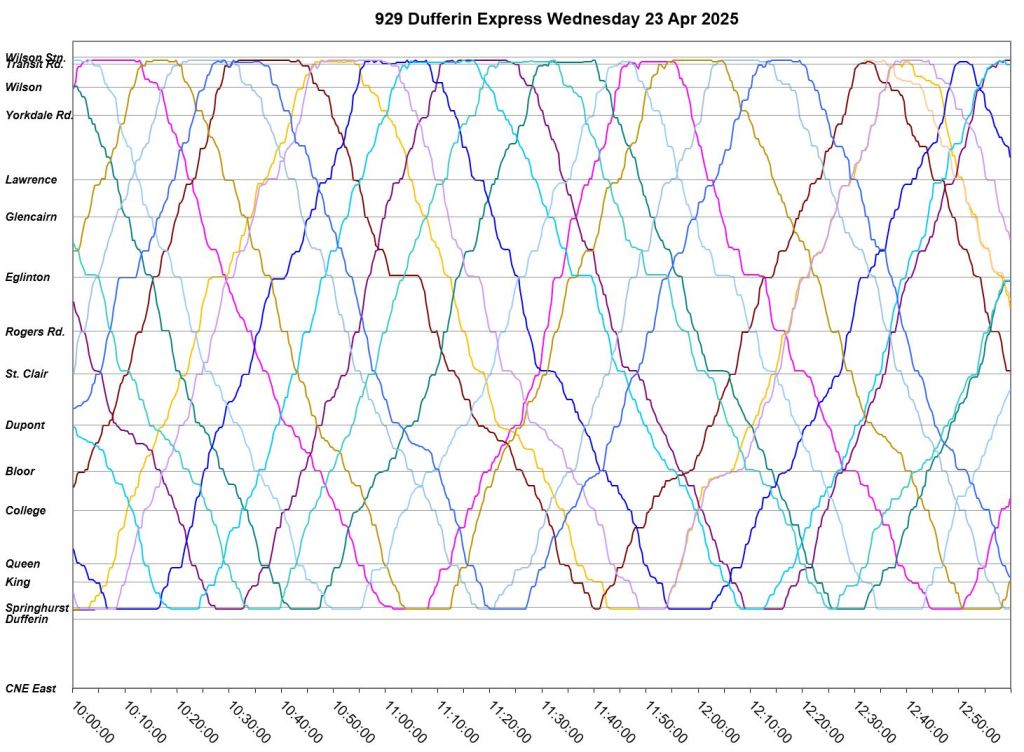
The following section shows the operation of the routes in detail for a few days to illustrate how service behaves in detail. These are the time-distance charts familiar to readers on this site, a technique that has been around since the mid-19th century. It is used both for railway scheduling (as discussed in the linked article) but also to display actual operations to visualize how well, or not, the service ran, where problems were located and how recovery efforts, if any, succeeded.
In these charts, time runs from left to right over several pages with three hours on each page. Location runs vertically with Wilson Station (north end) at the top and Princes’ Gates (south end) at the bottom.
In one case, between Dufferin and Princes’ Gates loops, buses appear to turn around. The reason for this is that I “mapped” this segment only for east-west travel and as the bus meanders through the grounds, it doubles back on the E-W axis.
The speed of a bus is indicated by the slope of the line. The more vertical, the faster; the more horizontal, the slower locations of slowdowns or blockages stand out because the lines change slope. There are some locations along Dufferin where congestion appears regularly, but these are not all within the southern portion of the route where transit lanes are proposed. Congestion is not a pervasive, all-day condition. (Travel time patterns will be explored in Part II of this series.)
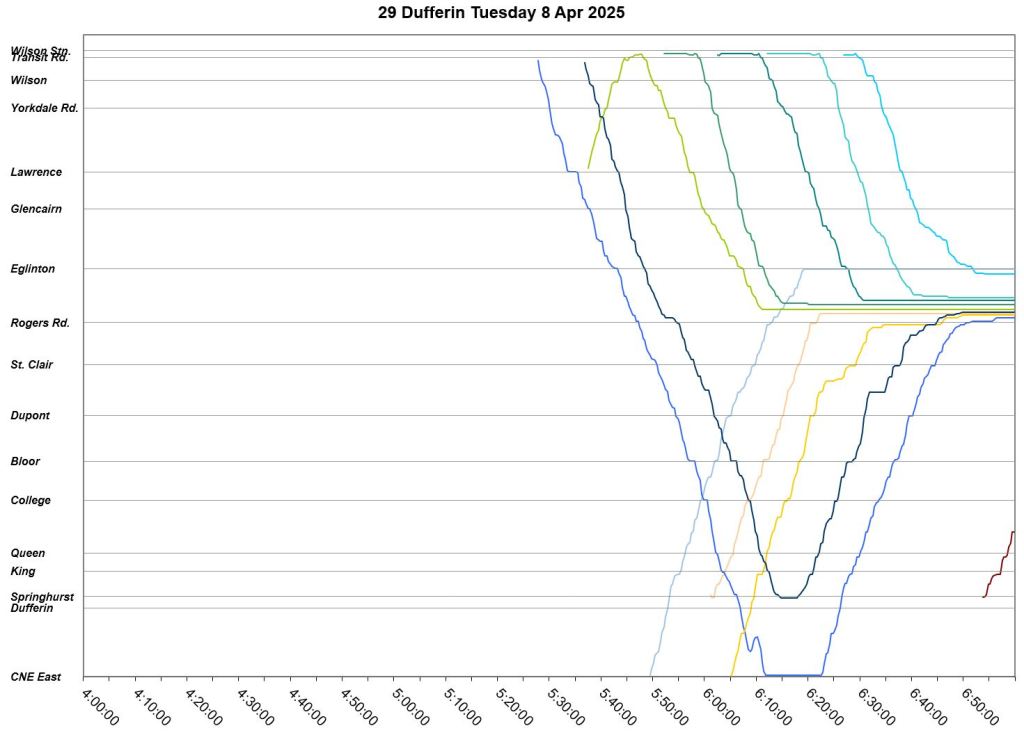
Tuesday, April 8
Overnight snow early on April 8 made the route impassible north of Rogers Road until about 8:30am. Many buses were immobile from about 6am to 8:30am and little service operated on the route. By noon, the service was sorted out and the remainder of the day shows a typical weekday period for both local and express service.
The vertical scale of these charts is set to match actual distances along the route, and so a consistent slope of a line indicates a regular speed of the bus. Where lines slope more horizontally, this indicates a slowdown typically for congestion. Examples include northbound approaching Bloor in the PM peak, but also further north on the route southbound to Eglinton and northbound south of Yorkdale.
Local
Service originating from Princes’ Gates (bottom of the charts) in some cases reaches King midway between buses originating at Dufferin Loop, but some operate as part of a pair or trio northbound along the route.
Almost all vehicles sit for several minutes (horizontal lines) at the terminals indicating schedules are adequate for the conditions on most of the day. This is not necessarily true every day depending on factors such as weather and traffic levels.


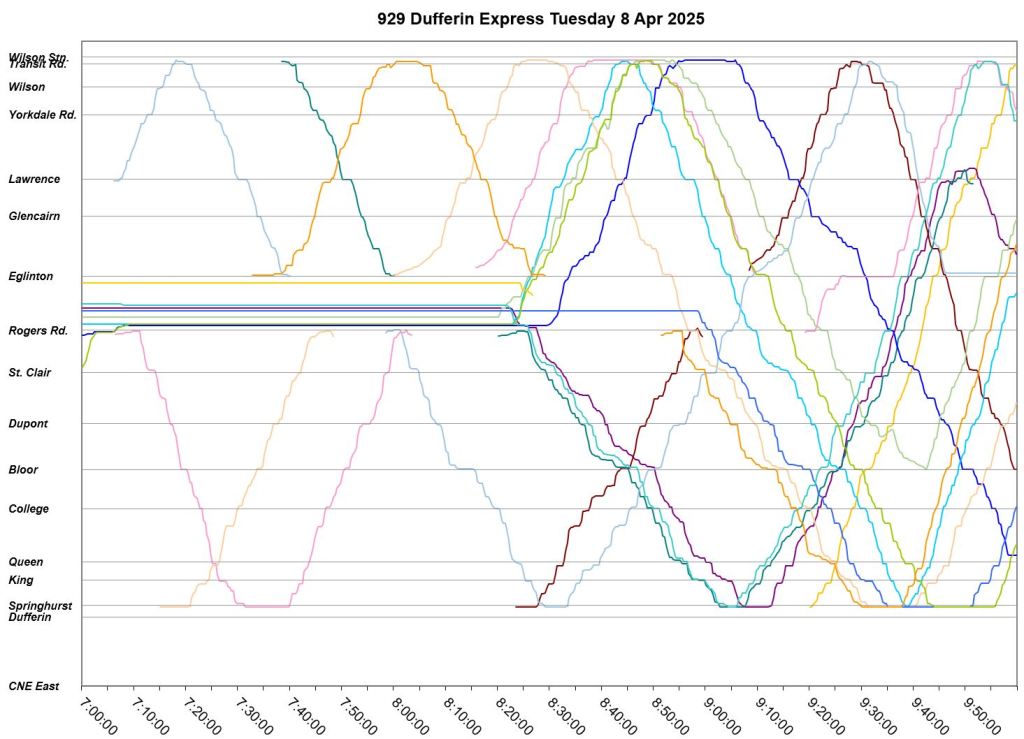
Express
Express service behaves similarly to the locals including bunching particularly in the late afternoon and evening.


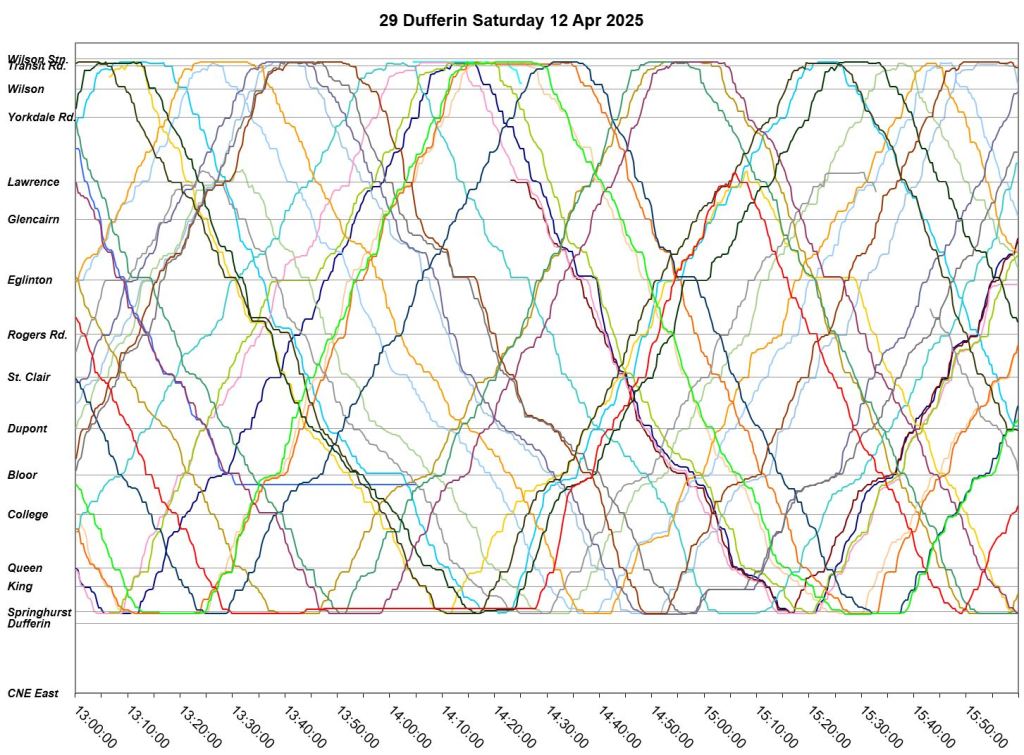
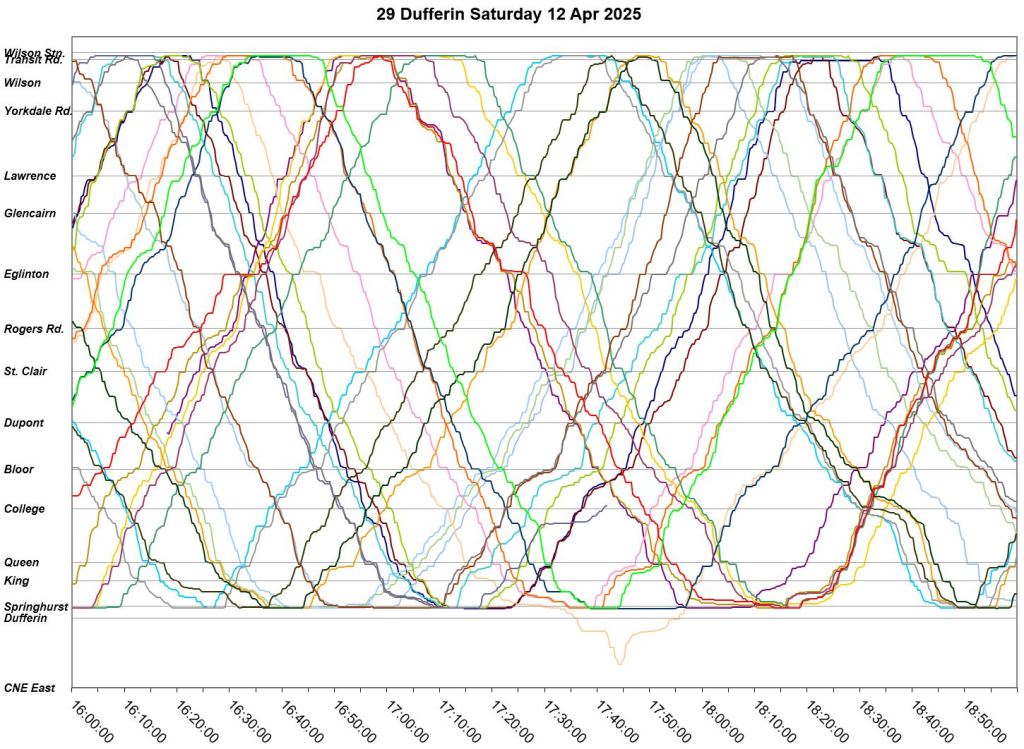
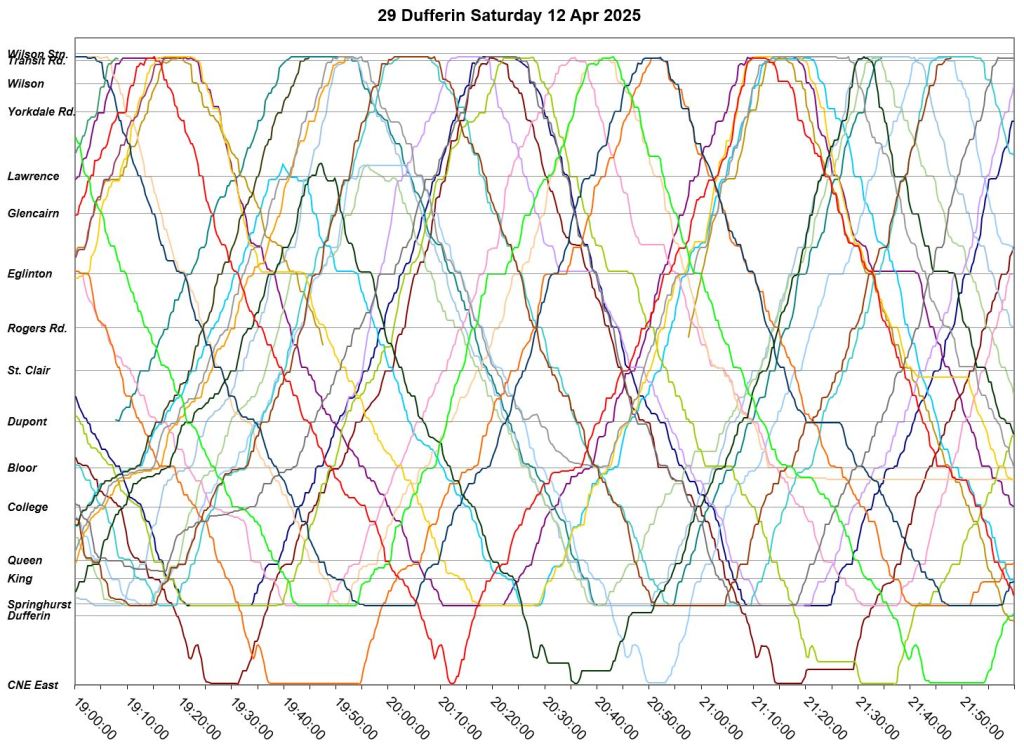
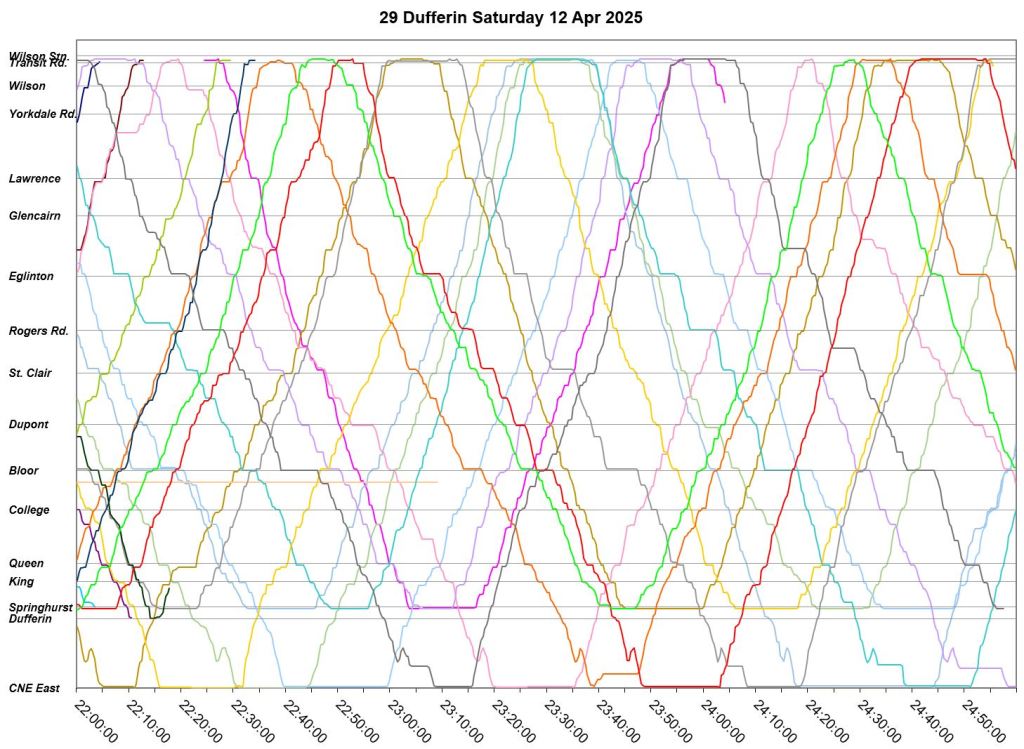
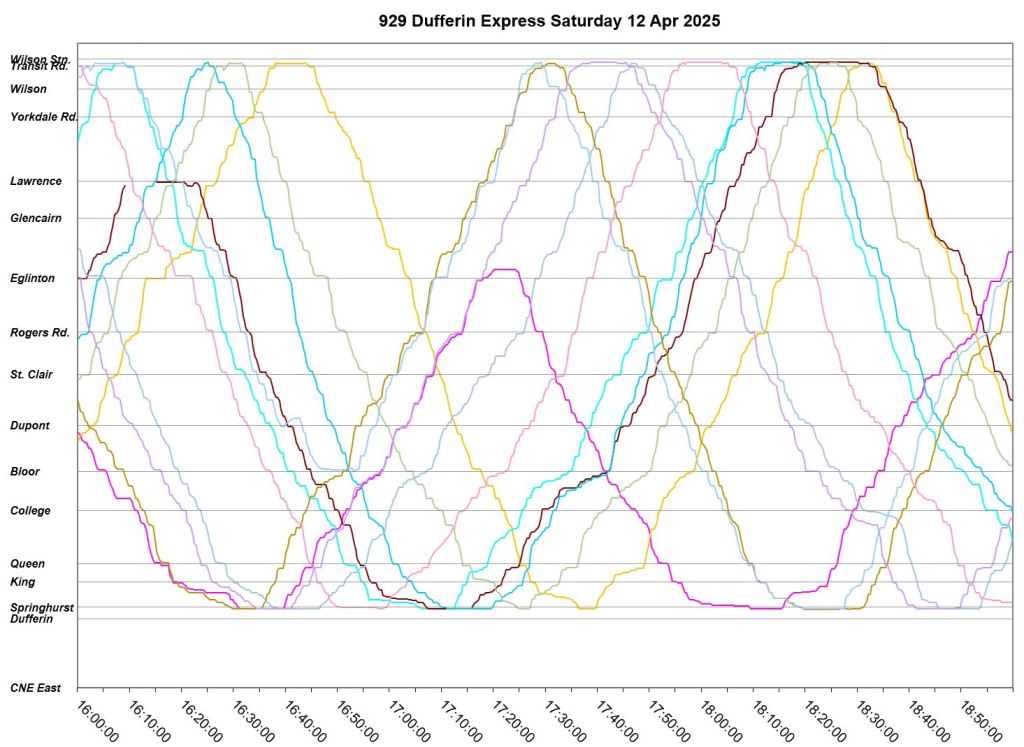
Saturday, April 12
Local
Service on Saturday shows a great deal of bunching through the afternoon and evening. Groups of vehicles travel together over the route and sometimes remain together even after a terminal layover. Congestion problems are visible at several locations.
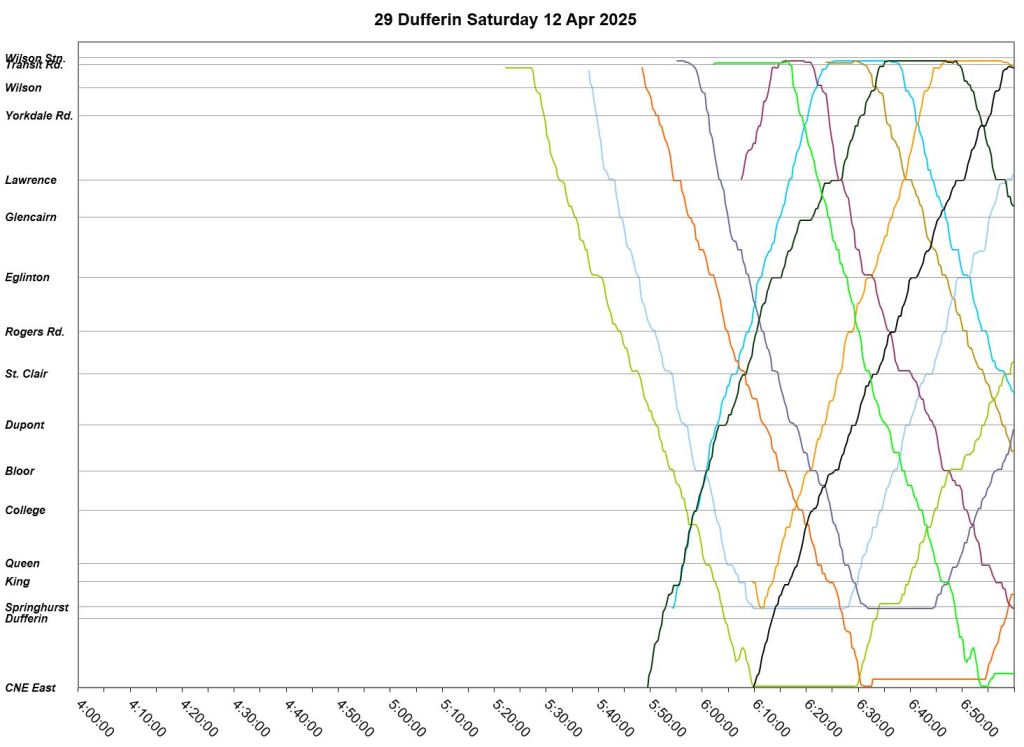


Express
Like the local service, express buses are bunched through much of the day. A wide travelling gap opens up in the afternoon due either to misplaced or missing buses.


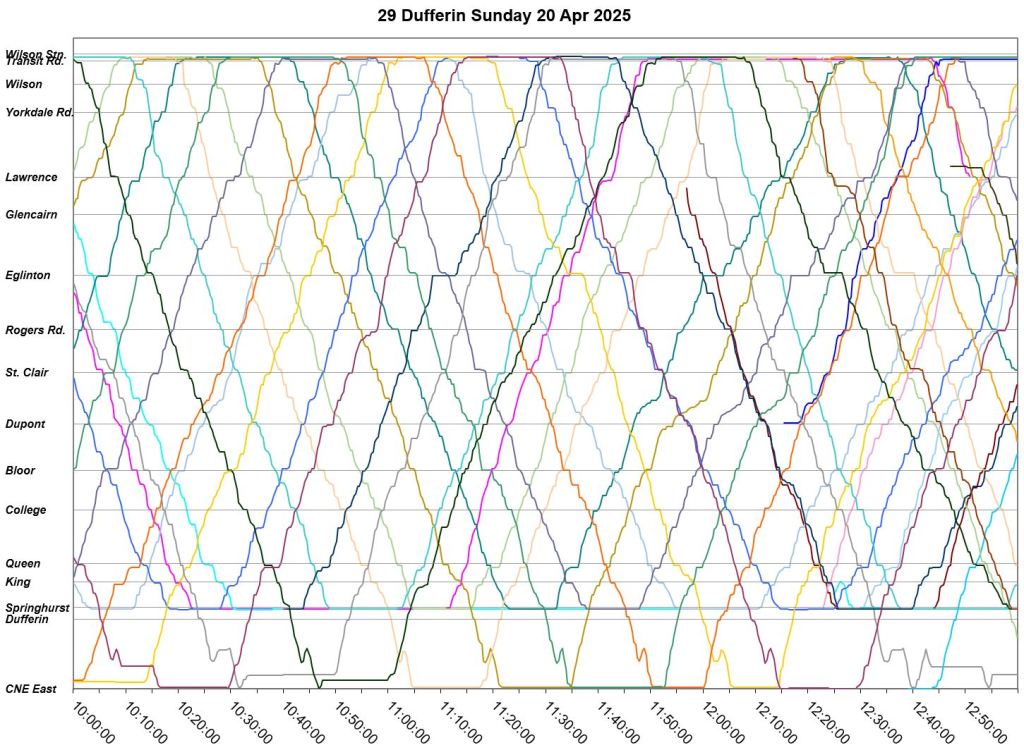
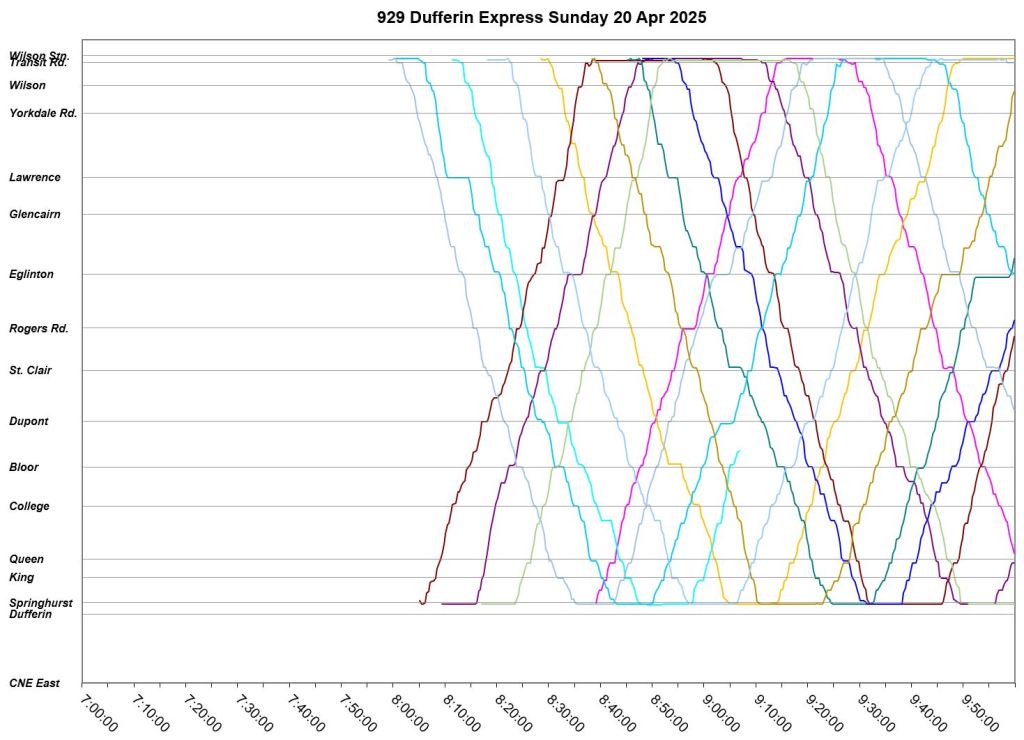
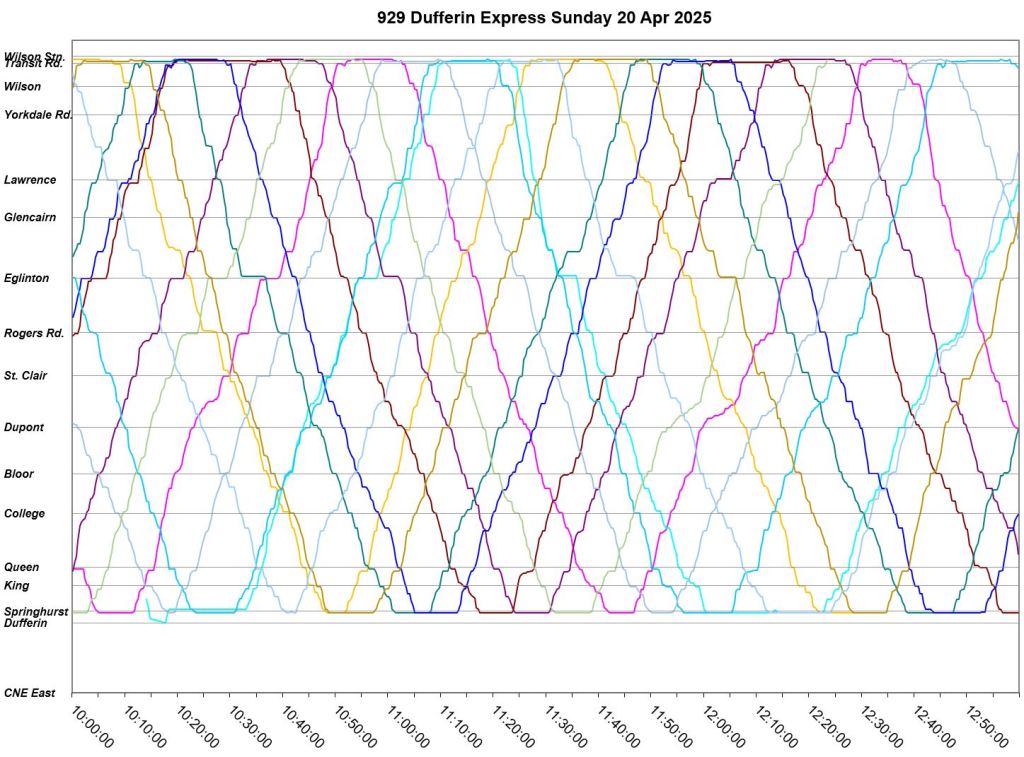
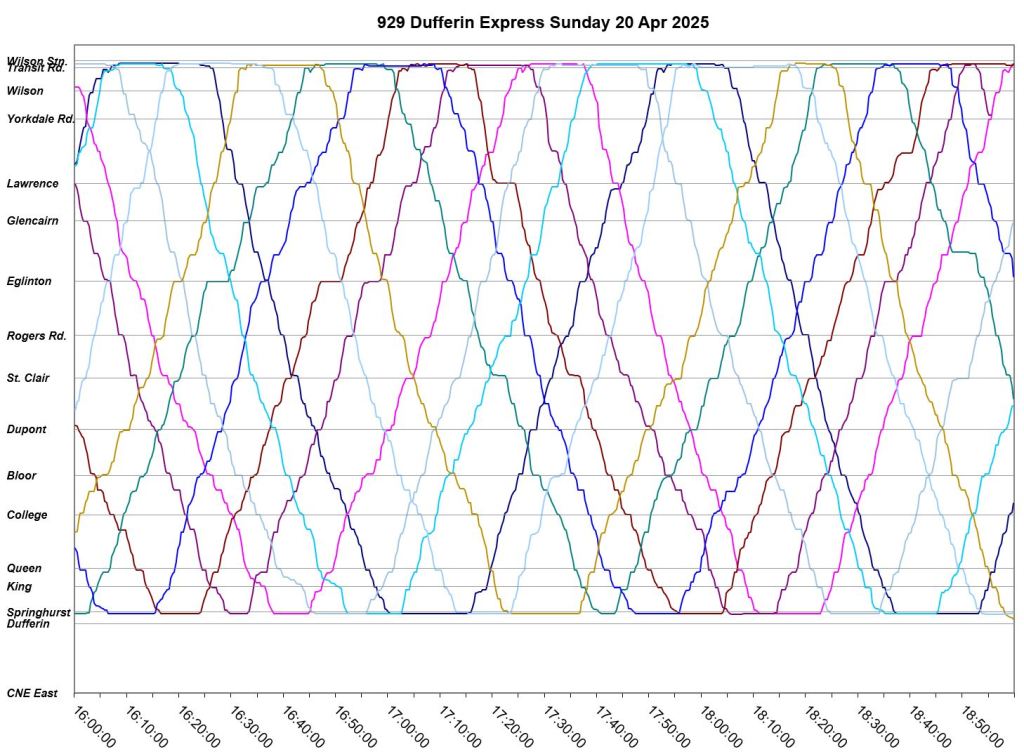
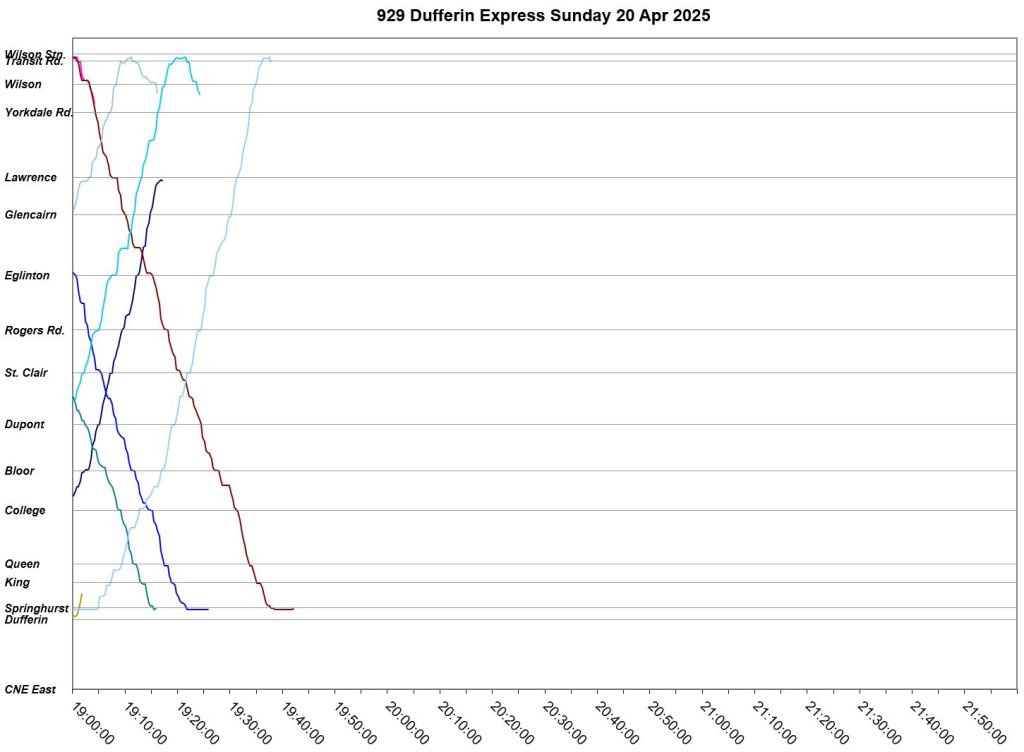
Sunday, April 20 (Easter)
Easter Sunday shows a best case situation on Dufferin with almost no traffic congestion. Buses have layovers at both terminals indicating scheduled times are adequate. Nonetheless, bunching is a problem.
Local


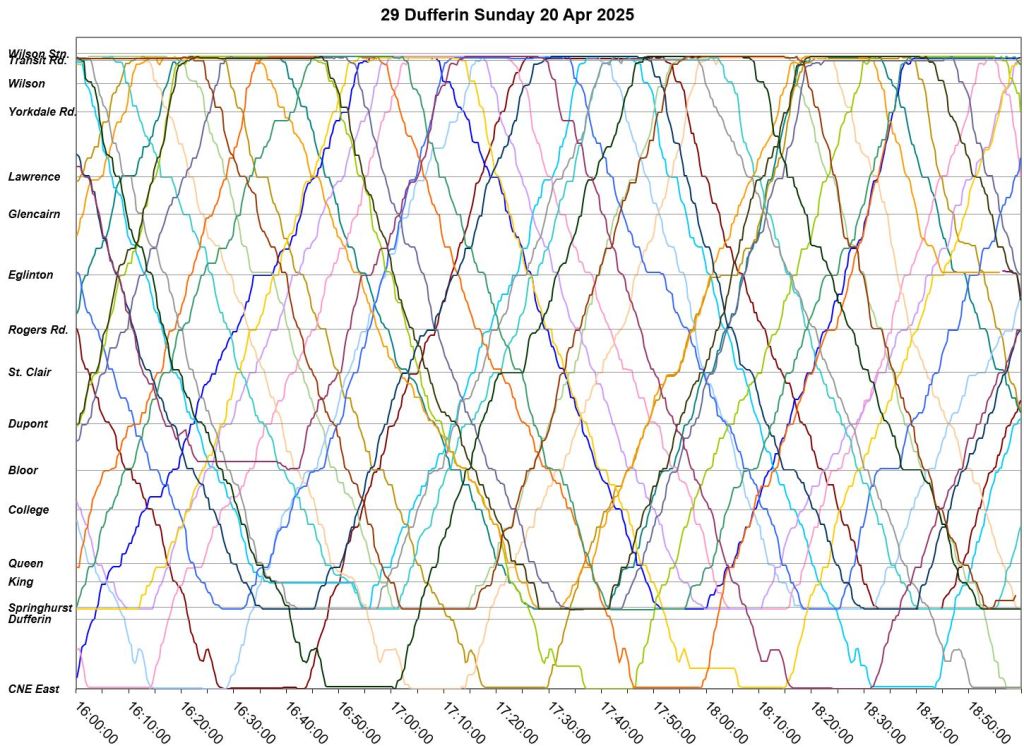


Express
Express service on Easter Sunday is better behaved than the local trips with few instances of bunching. However, at about 10:30am two buses leave Dufferin Loop northbound and remain as a pair for an extended period.

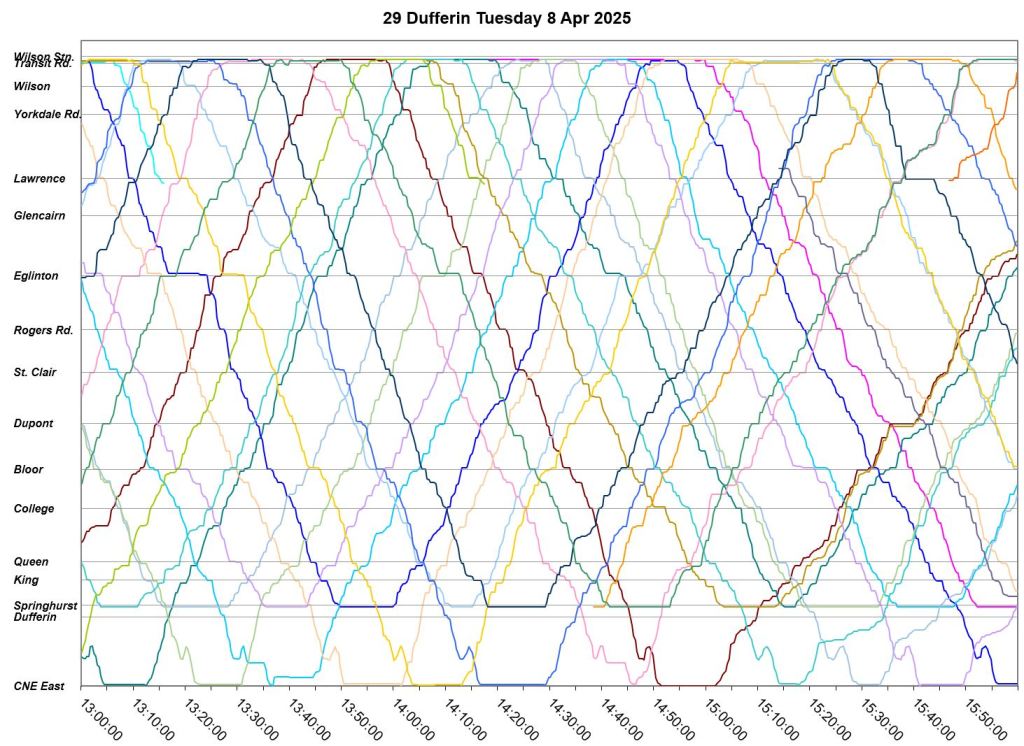
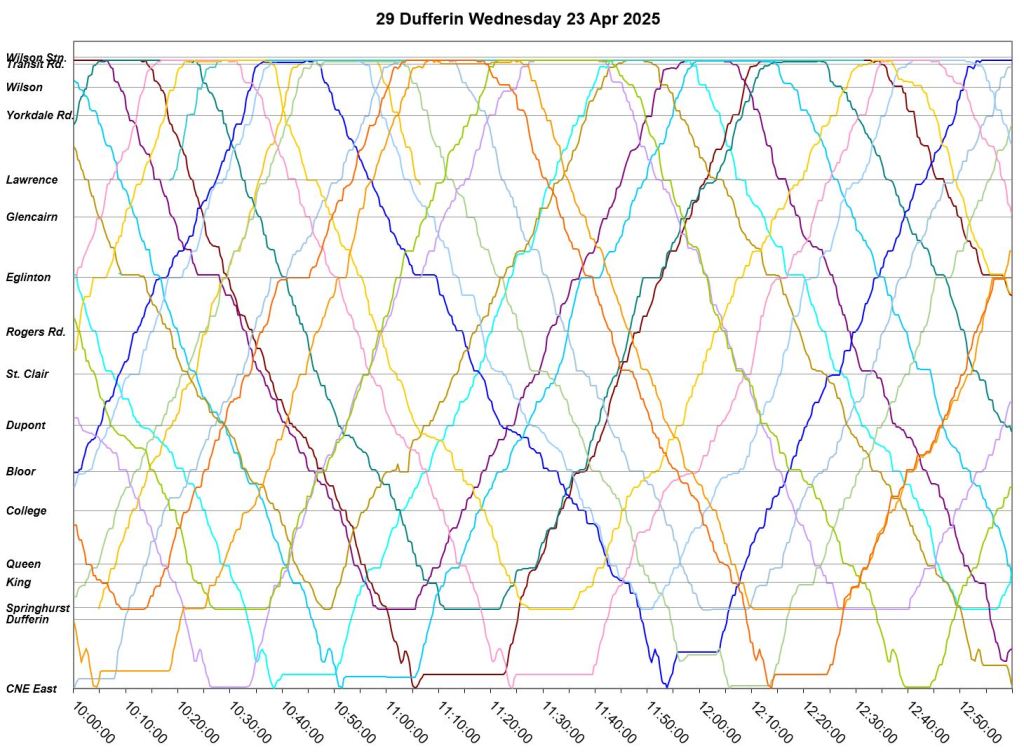
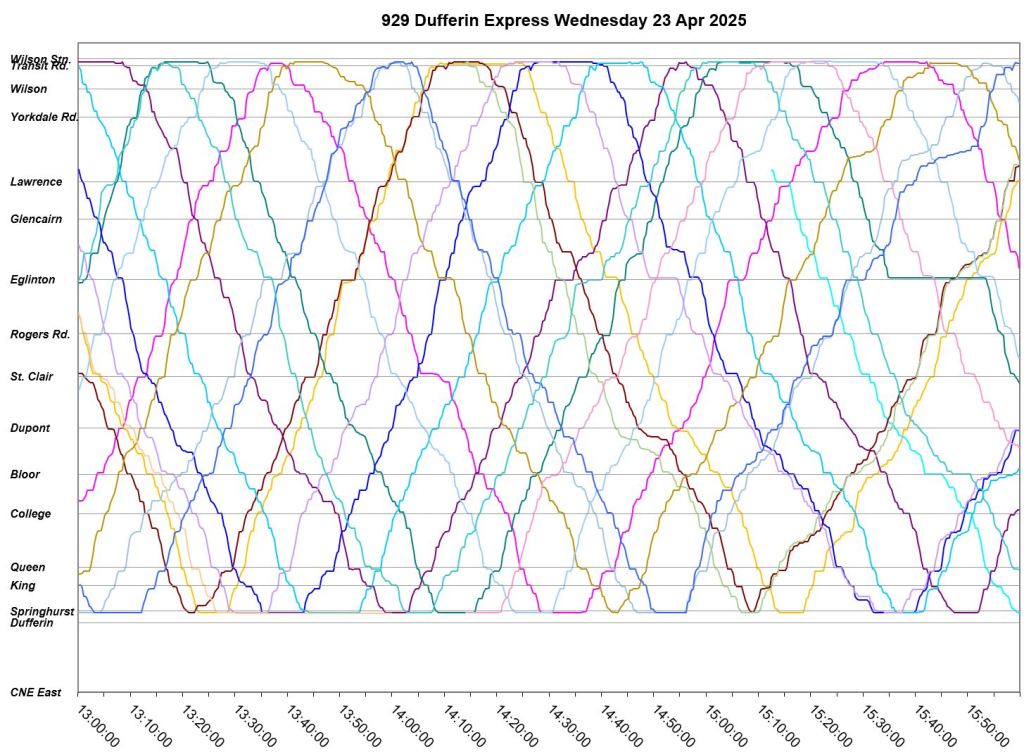
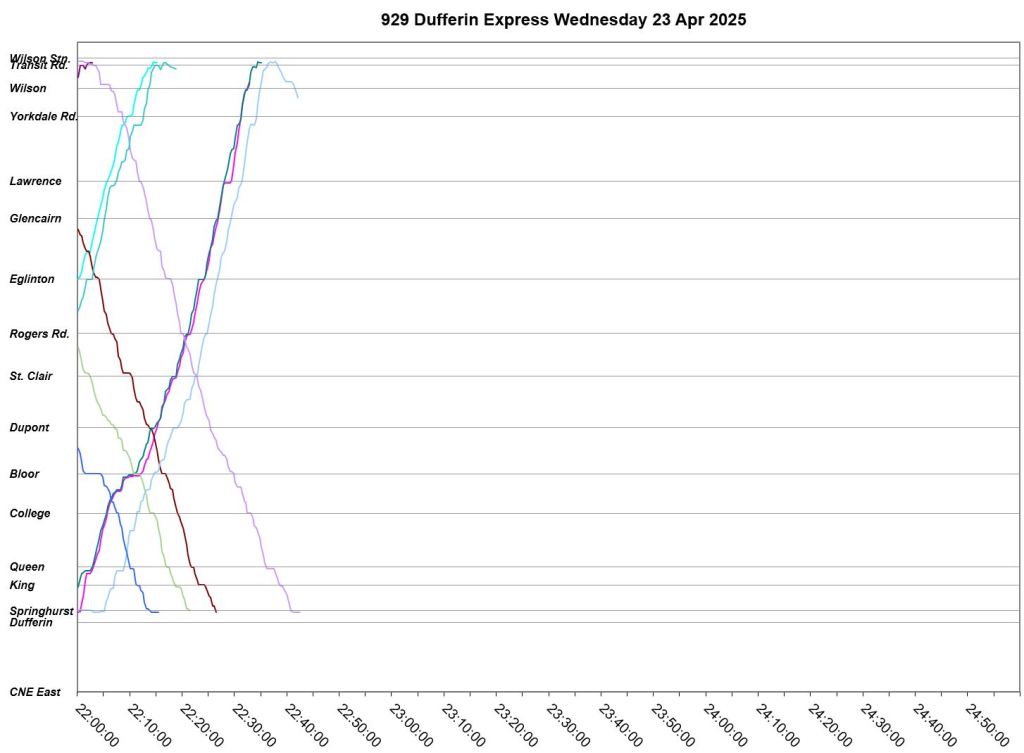
Wednesday, April 23
April 23 is part of Week 4 that is detailed earlier in this article. Bunching is visible in both directions and congestion is evident particularly in the late afternoon northbound to Yorkdale and southbound between Dupont and Bloor.
Local


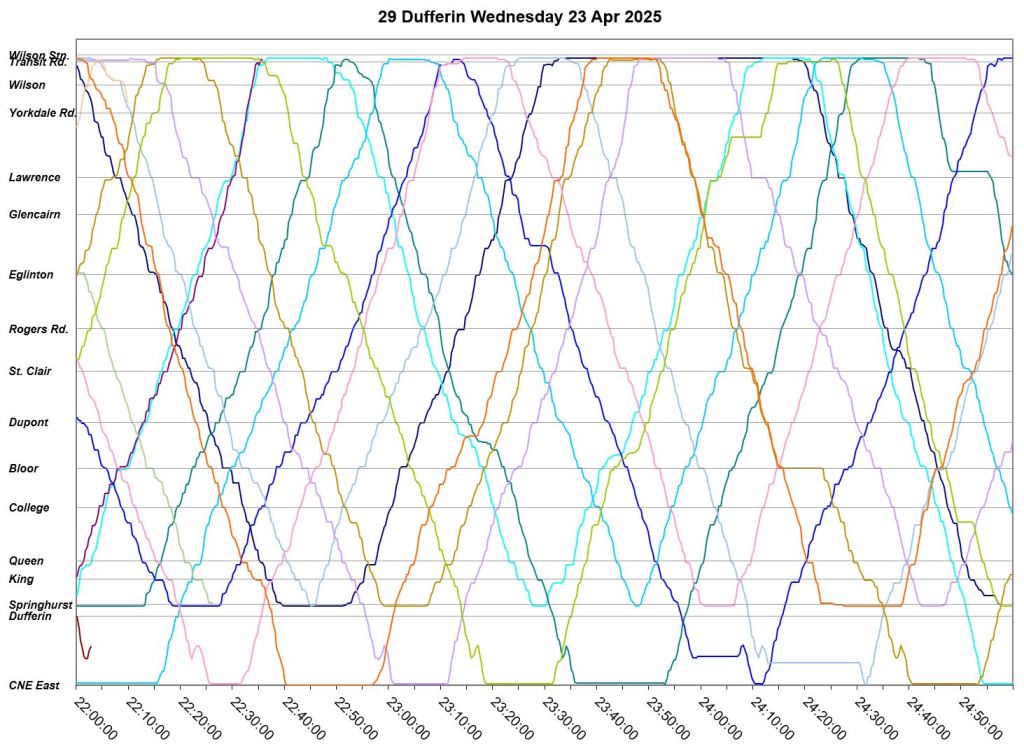
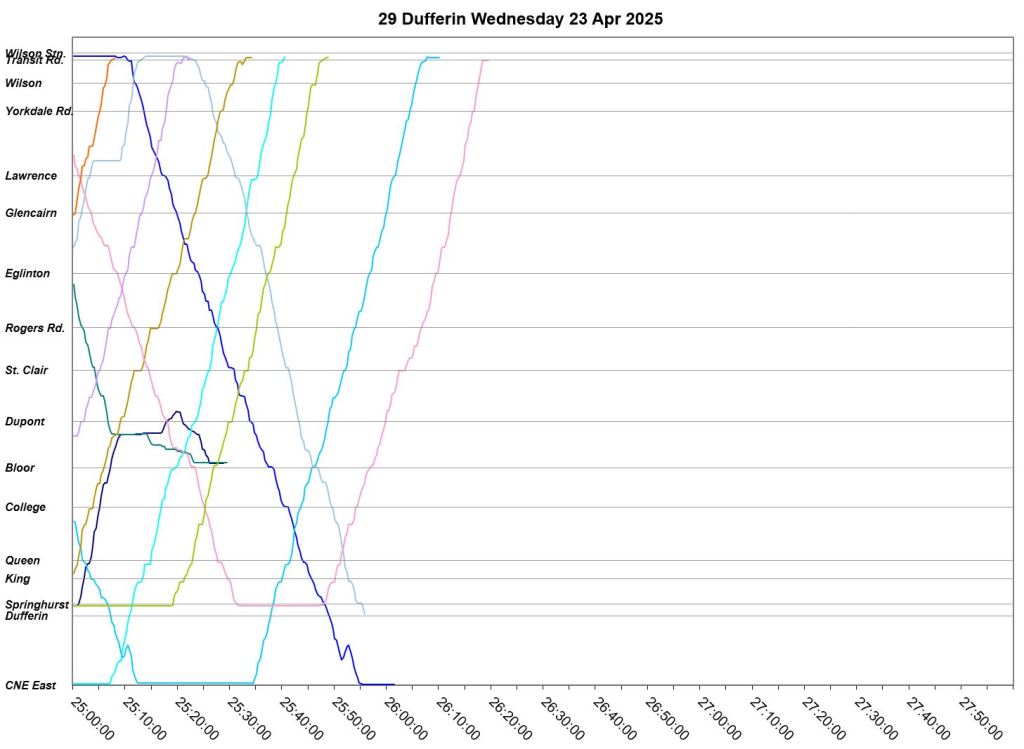
Express
Service is fairly regular up to the early afternoon, but becomes bunched with gaps from 3pm onward.


The mode is the most common value, not the median.
Steve: Thank you. I will correct the explanation in the text.
LikeLike
Steve, thank you for comprehensive analysis as usual. As has been stated many times in other similar threads – the TTC simply doesn’t devote time and resources to proper route management.
As an example, I was passing by Wilson station around 7:50 pm today and I saw two 118 buses going right behind each other heading west. This route operates on 25 minute headway with 3 buses at the time. If one of those buses was actually the bus that was suppose to leave at 7:25 perhaps transit control should have either dead head it to where it is suppose to be to get it back on schedule or make the 7:50 bus leave in the middle of the headway so that at least there is some semblance of “regular service”. As the buses actually ran relatively empty I would expect that those two 118s would continue travelling in a pack either all night till end of service or until one of them went out of service in late evening (late evening uses 2 buses).
Steve: This is a case where I can’t fault the TTC. I looked at the tracking data, and one of those buses was running out of service to the garage. The route drops from 4 buses in the PM peak to 3 in the evening at that time. The service for the rest of the evening was properly spaced.
In any event, thanks for reading!
LikeLike