
This article is the final part of a review of route 7 Bathurst where the City of Toronto and TTC are currently studying the implementation of reserved bus lanes from Eglinton to Bathurst Station north of Bloor Street.
See also:
- Service Analysis of 7 Bathurst Part I: Headways in April 2025
- Service Analysis of 7 Bathurst Part II: Travel Times in April 2025
Data presented here are from all weekdays from January 2024 to April 2025 for three screenlines on Bathurst:
- Barton Street just north of Bathurst Station
- Just north of Eglinton Avenue
- Just south of Steeles Avenue
These show headway behaviour at terminals and at the dividing line between the portion of Bathurst proposed for RapidTO bus lanes (south of Eglinton) and the portion that will not change. Travel time behaviour is shown for the entire route, as well as for the segments north and south of Eglinton.
In each chart, both the median value (50th percentile) and 85th percentile are shown. The latter value shows, generally, the degree to which the peaks lie above the median, while filtering out the worse case values in the top 15 percentiles.
Median headways over the 16 months are fairly consistent and lie near 10 minutes, the scheduled level of service. There value drops only in the period from November 2024 to March 2025 when additional unscheduled service operated during the morning.
The 85th percentile of headways stays close to the median during most off peak-periods and at terminals, but it drifts higher at Eglinton both ways showing how small variations leaving the terminals can grow enroute. In peak periods and directions, the 85th percentile is often well above the median value showing erratic departures from terminals.
Travel times along the route vary substantially from about 35 minutes in late evenings to over an hour in the peak periods. Although the length of the trip varies a lot by time of day, the 85th and 50th percentiles stay close to each other indicating that the travel times are consistent within each period. There is a day-of-week effect visible in repeating peaks in the values on midweek days. This is seen on several routes across the system, and shows how a formal schedule does not face the same conditions every day.
Not included here are the weekend data which, as shown in Parts I and II, are not as “well behaved” because of schedule shortcomings, very wide variation in the spacing of departures from both terminals, and a high level of short turning in an attempt to keep buses on time.
Although Toronto proposes reserved lanes on part of this route, this will not improve behaviour outside of the target area. Travel time savings would occur in the peak period primarily south of St. Clair.
Reading the Charts
Each of the charts in this article tracks values during one hour’s operation on weekdays from January 2024 to April 2025. The lower blue line is the median value (50th percentile) while the upper orange line is the 85th percentile.
Where the two lines are close together, the headways or travel times were fairly consistent, but where the orange line pulls higher this shows that some data points are substantially higher than the median value. For headways this indicates gaps and bunching, and for travel times this indicates that traffic conditions cause less predictable times over the route.
Headways
Service leaving terminals sets the pattern for the rest of the route. As we saw in Part I, these departures do not match the TTC’s target for reliability (itself fairly generous). The problem is much worse on weekends when scheduled travel times are tight, but weekday service can be irregular even when buses have adequate time for terminal layovers.
Even when terminal departures are regular, headways are affected by conditions along a route and small variations grow as buses on short headways catch up to their leaders. This can be compounded by congestion adding variation to travel time.
Northbound
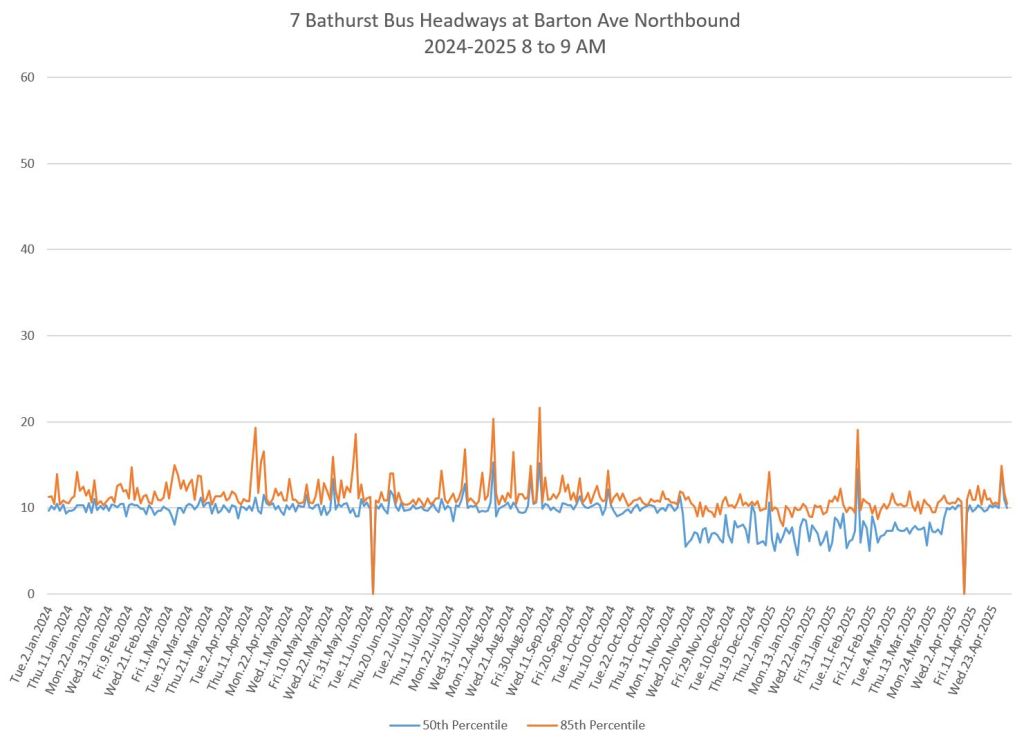
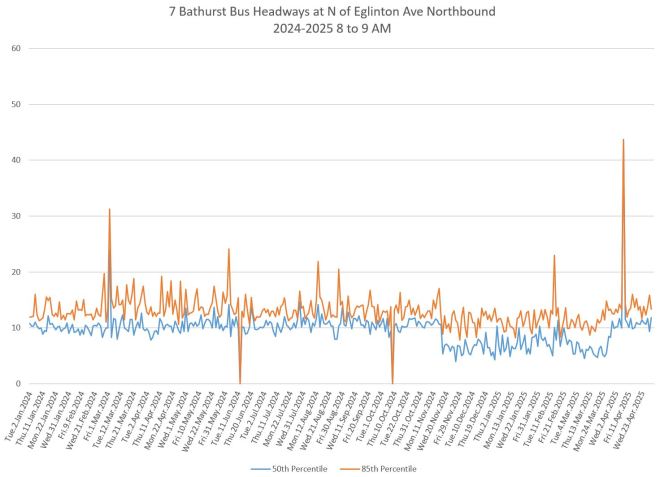
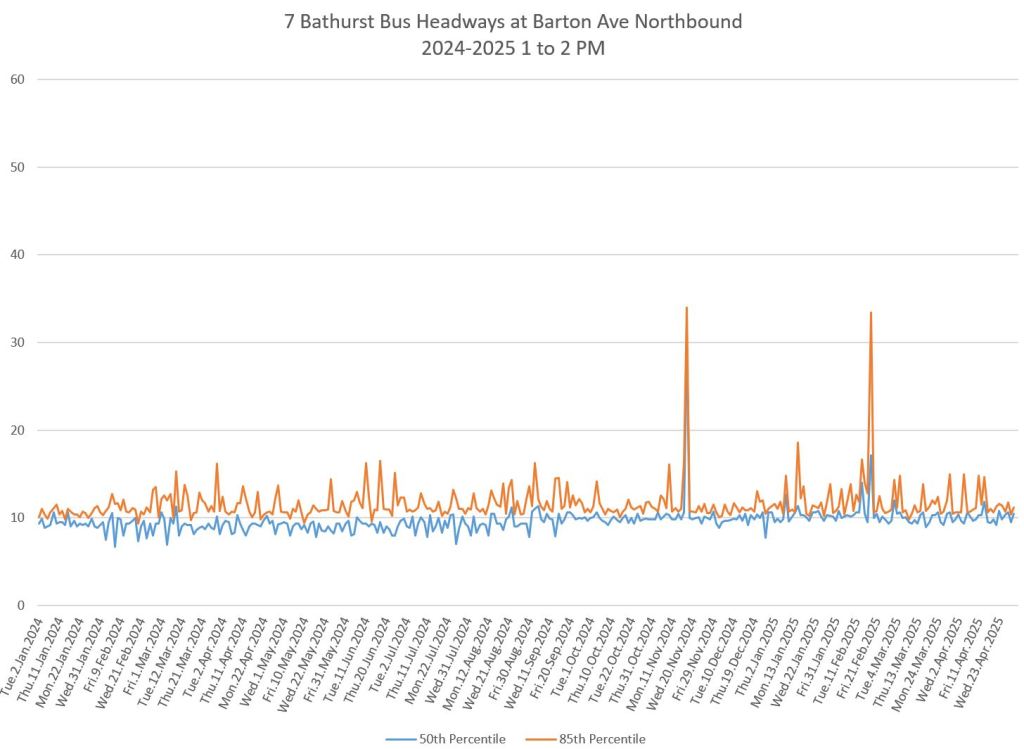
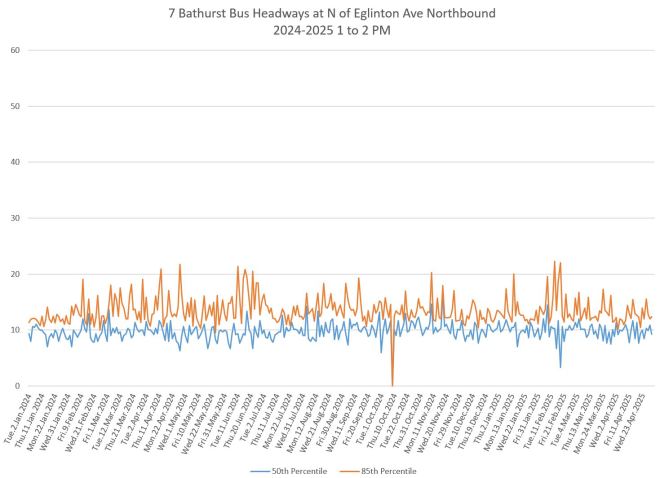
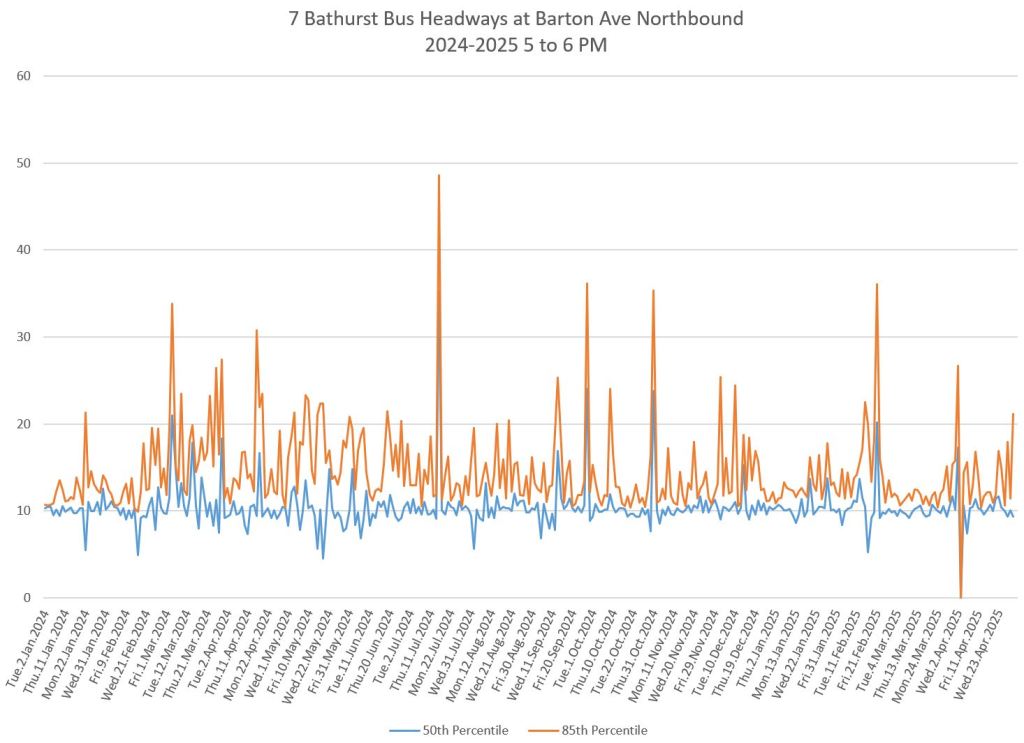
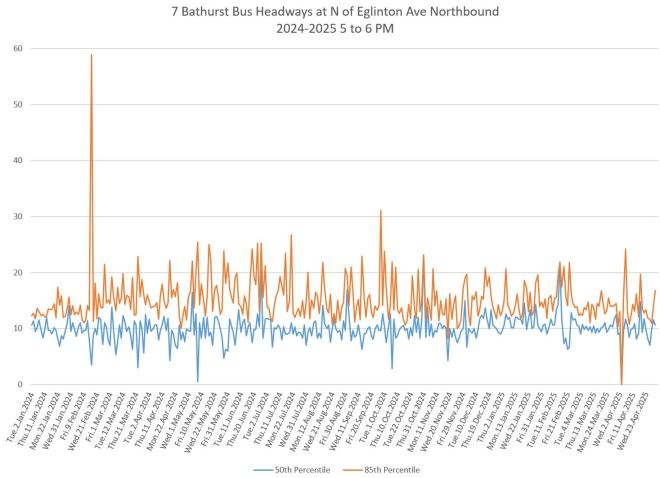
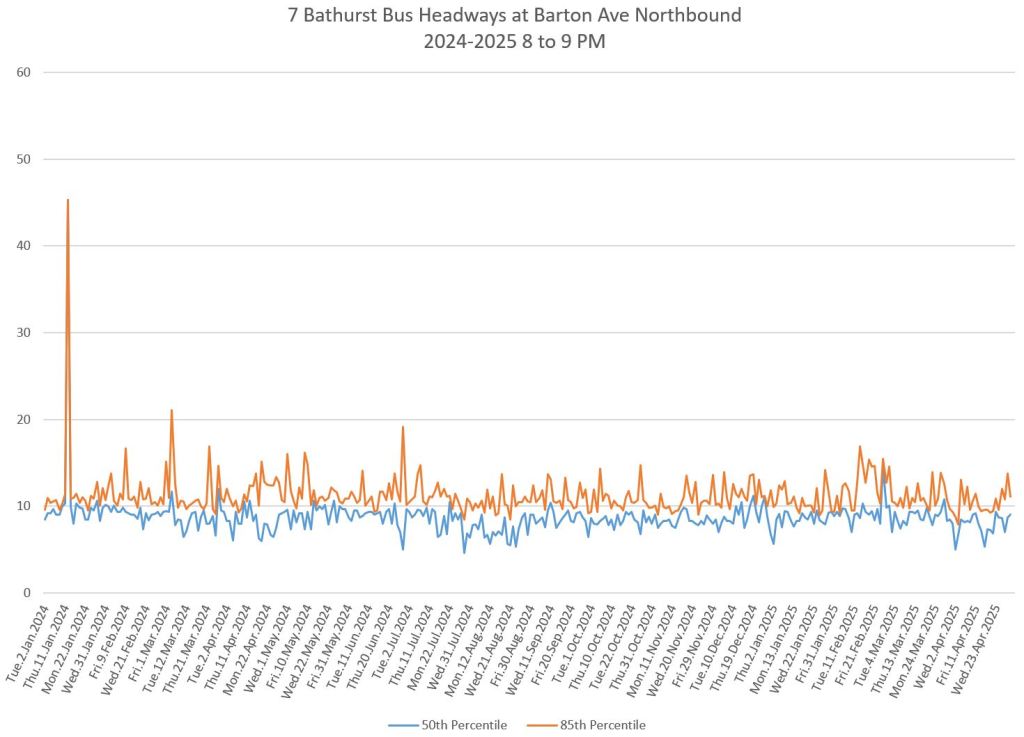
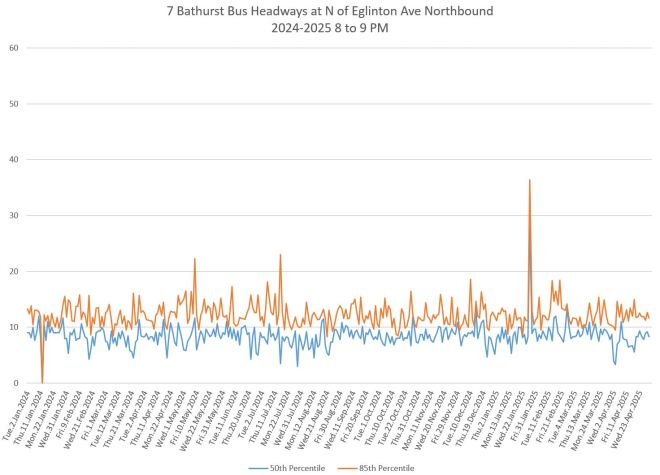
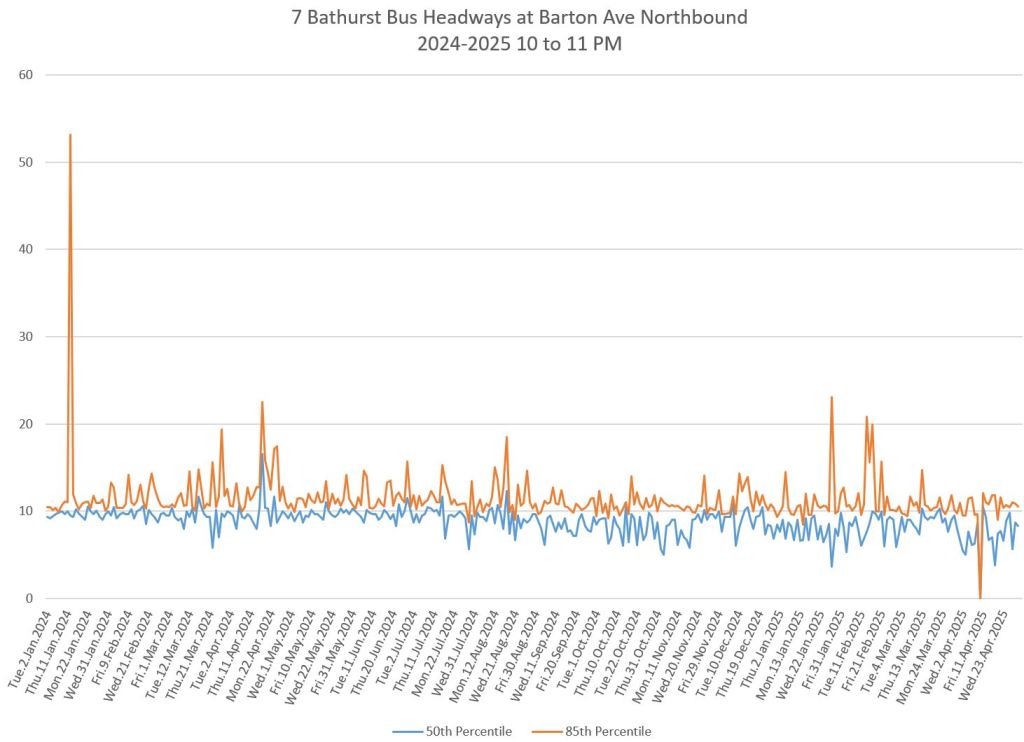
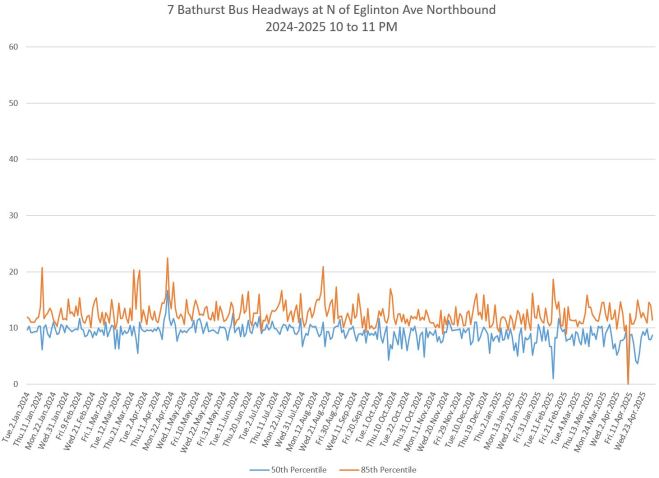
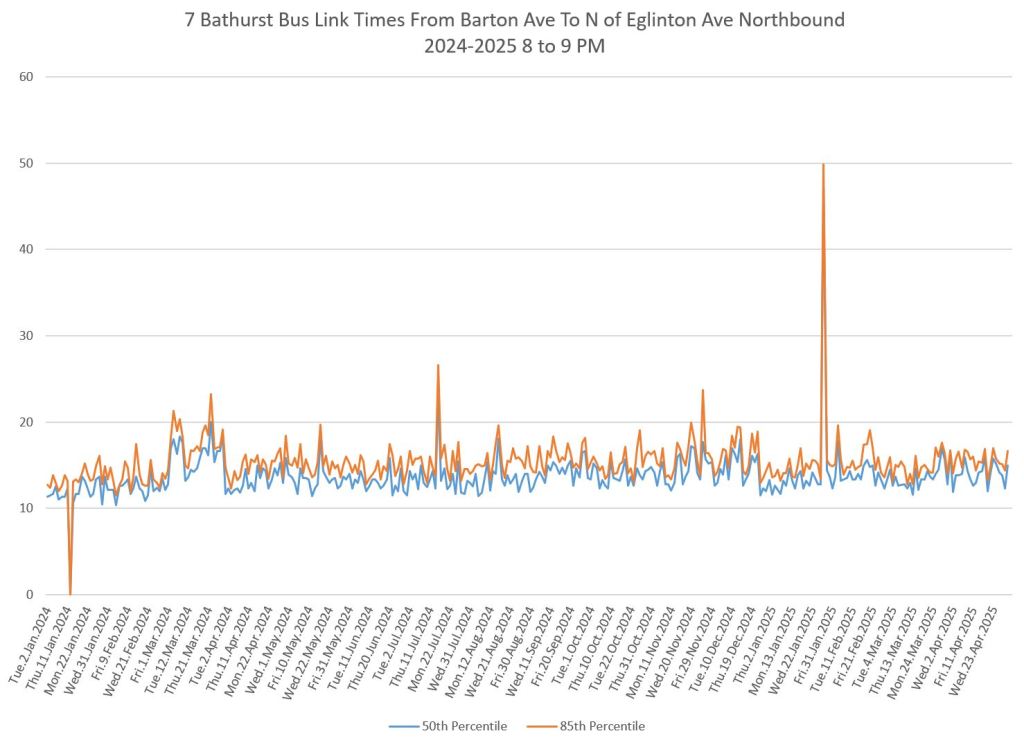
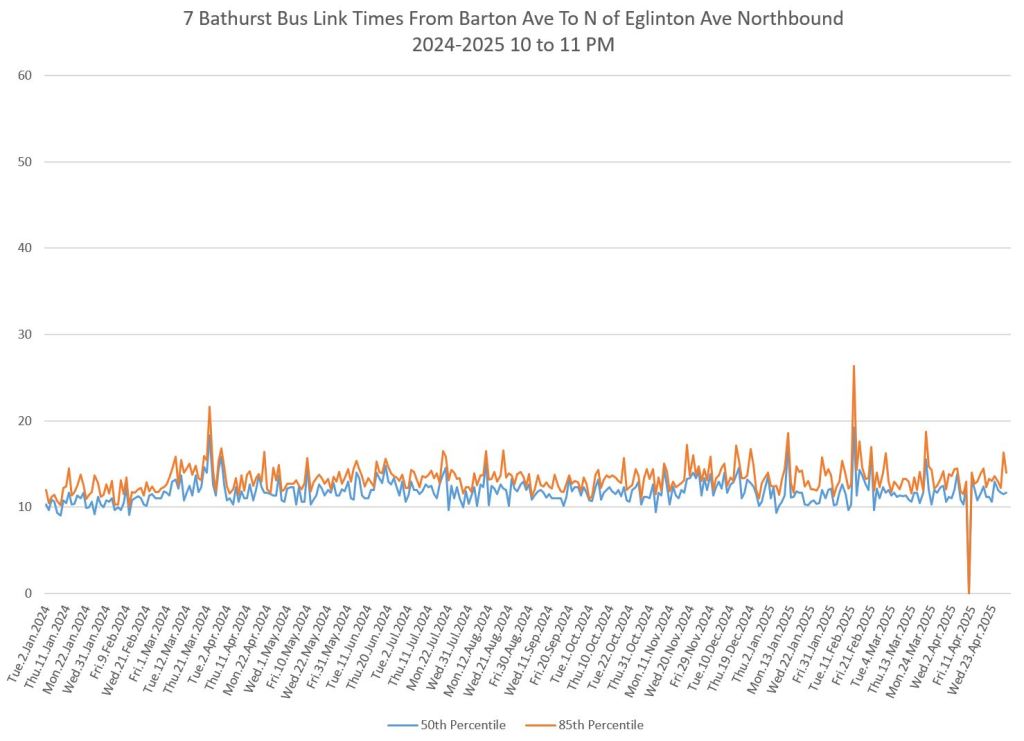
The charts below show the median and 85th percentile headway values on weekdays at various times northbound from Barton Street (just north of Bathurst Station) on the left and from Eglinton Avenue on the right. Data are shown for the hour beginning at 8am, 1pm, 5pm, 8pm and 10pm.
For the most part, the median value sits along the 10 minute line corresponding to the scheduled headway. From November 2024 to March 2025, additional service operated in the AM peak and morning. This brought the median value down, but the 85th percentile represented the common 10 minute schedule where no extras operated between the regular buses.
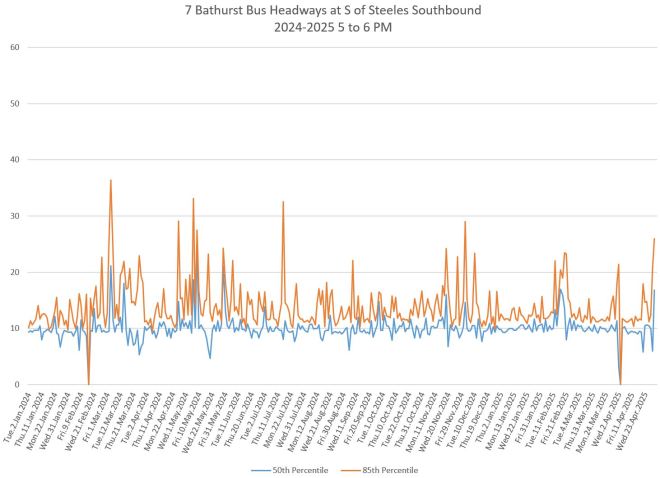
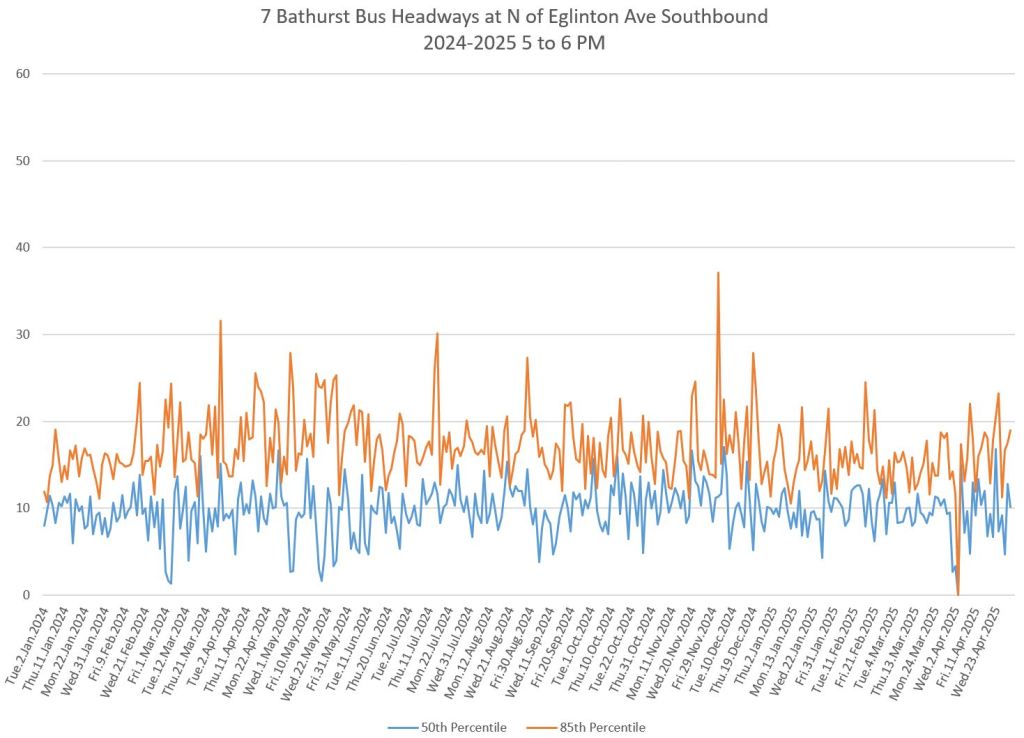
The value of the 85th percentile moves around a lot, but is strikingly higher between 5pm and 6pm routinely extending above 20 minutes particularly northbound in 2024.
The 85th percentile values at Eglinton are higher than at Barton Street showing the effect of bunching and gaps evolving along the route, notably in the 5-6pm data. (This was shown in more detail in Part I.) This behaviour is consistent over the 16 months shown.
Wrestling that variation down so that the 85th and 50th percentiles stay close together is an important goal for any transit priority project.
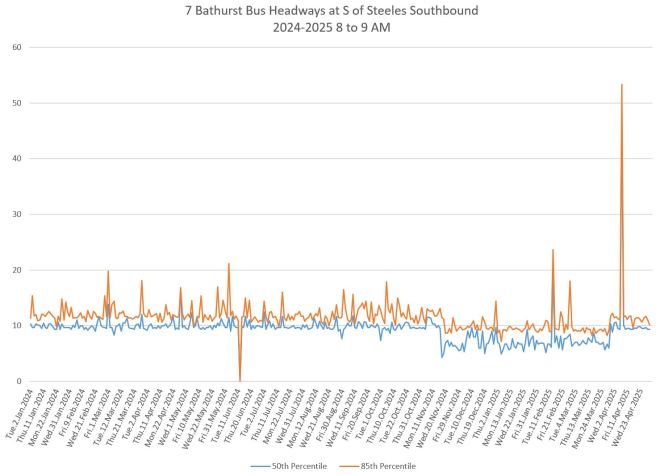
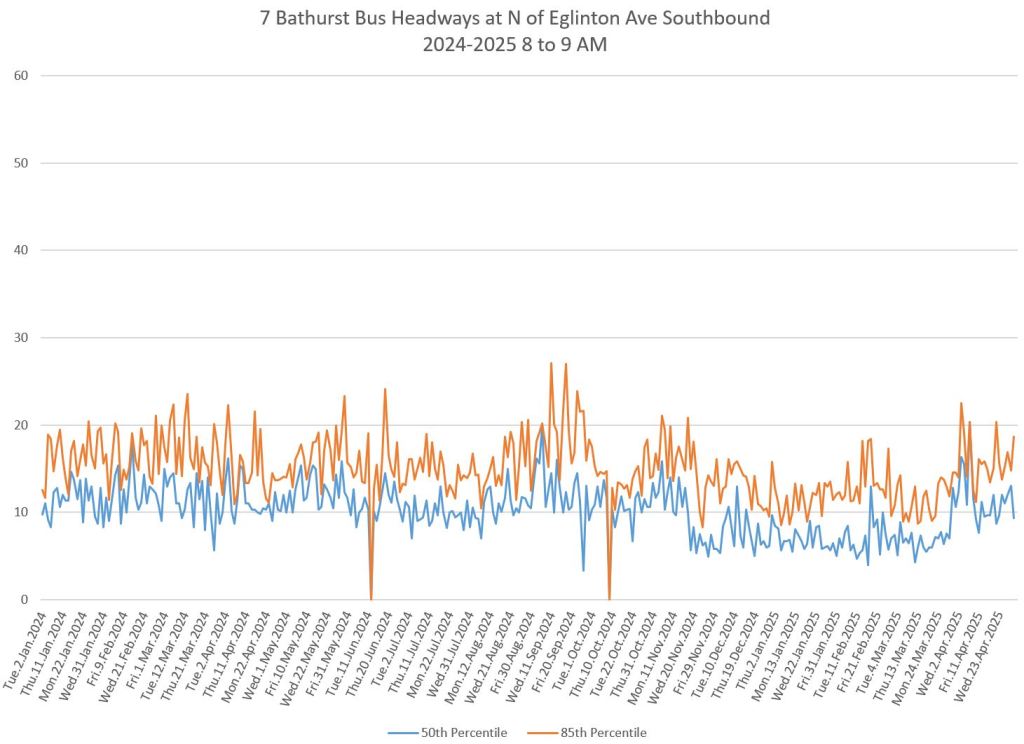
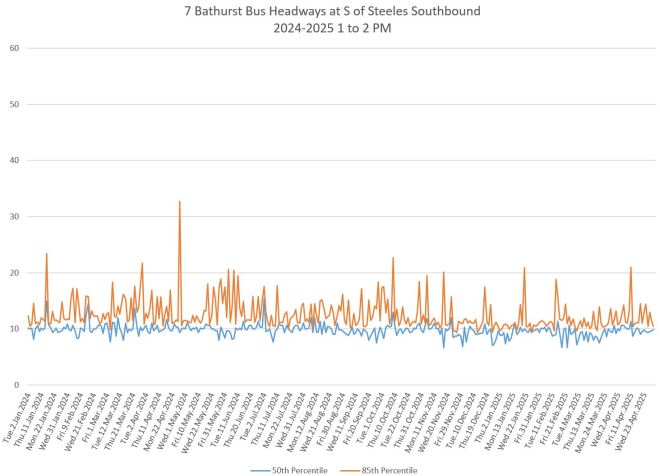
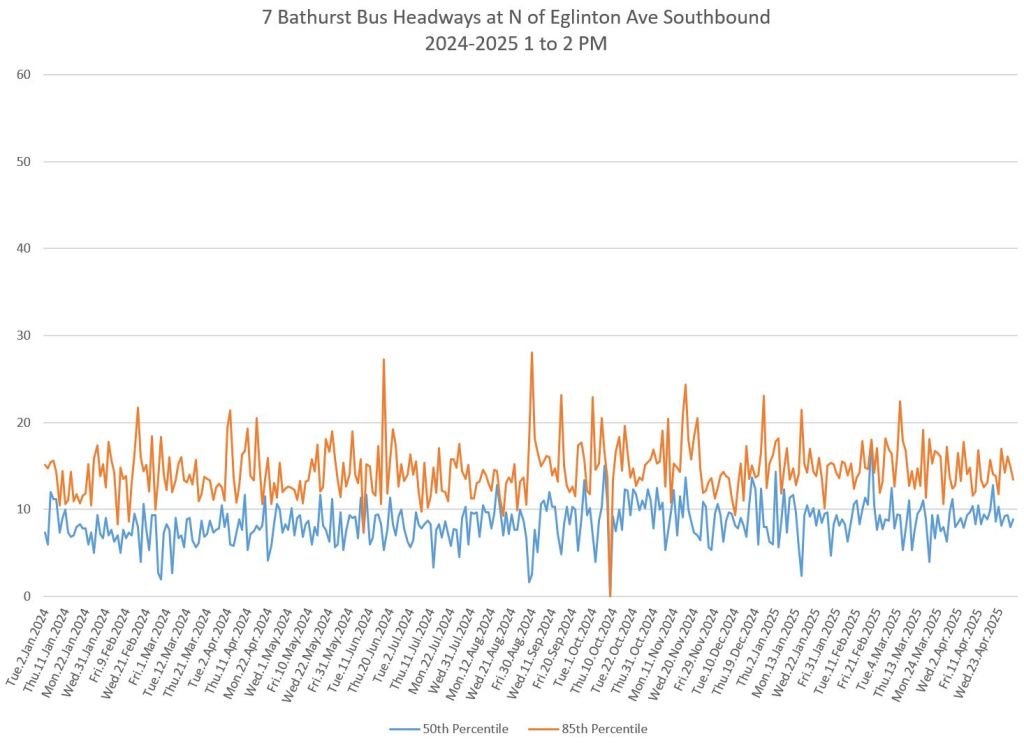
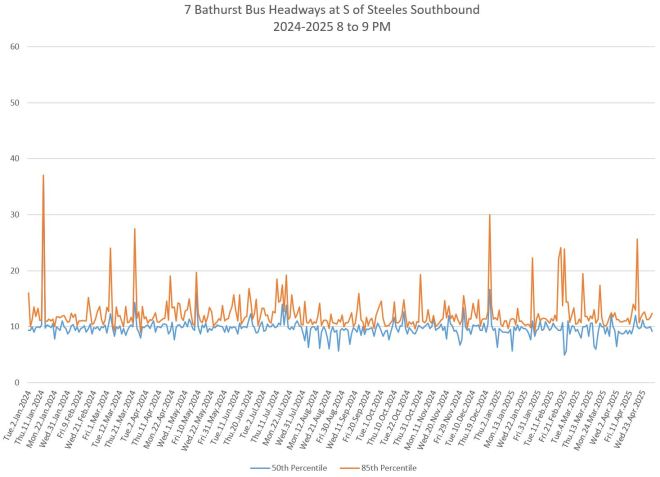
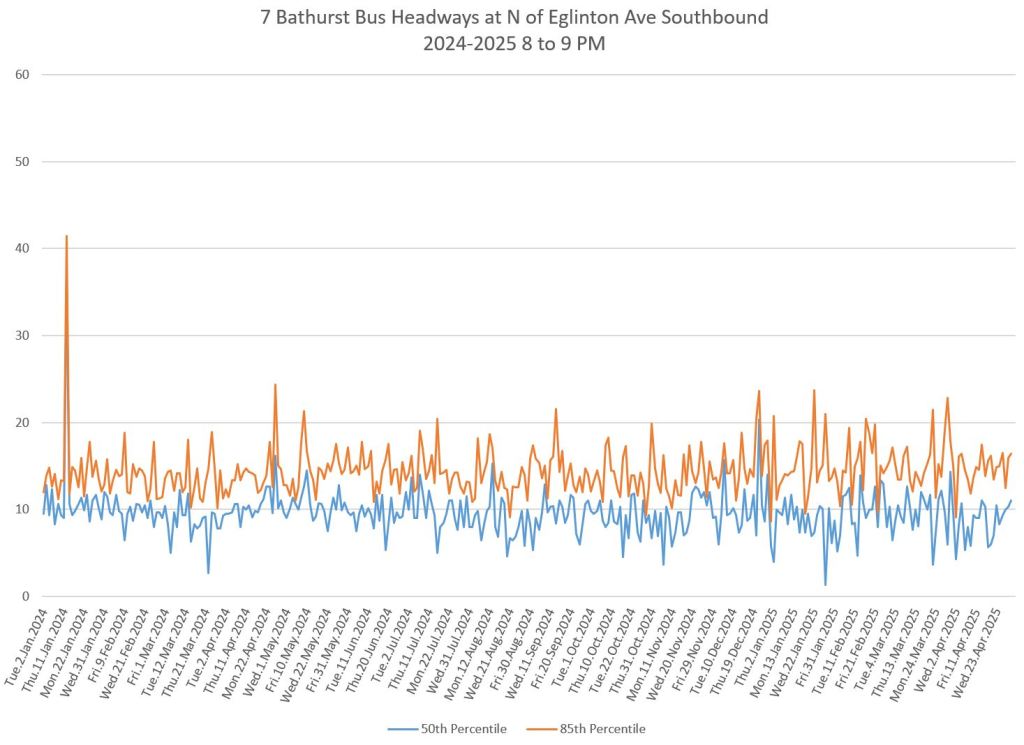
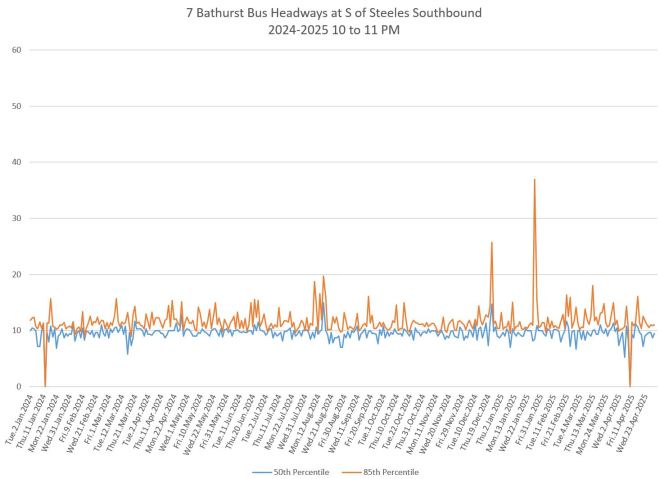
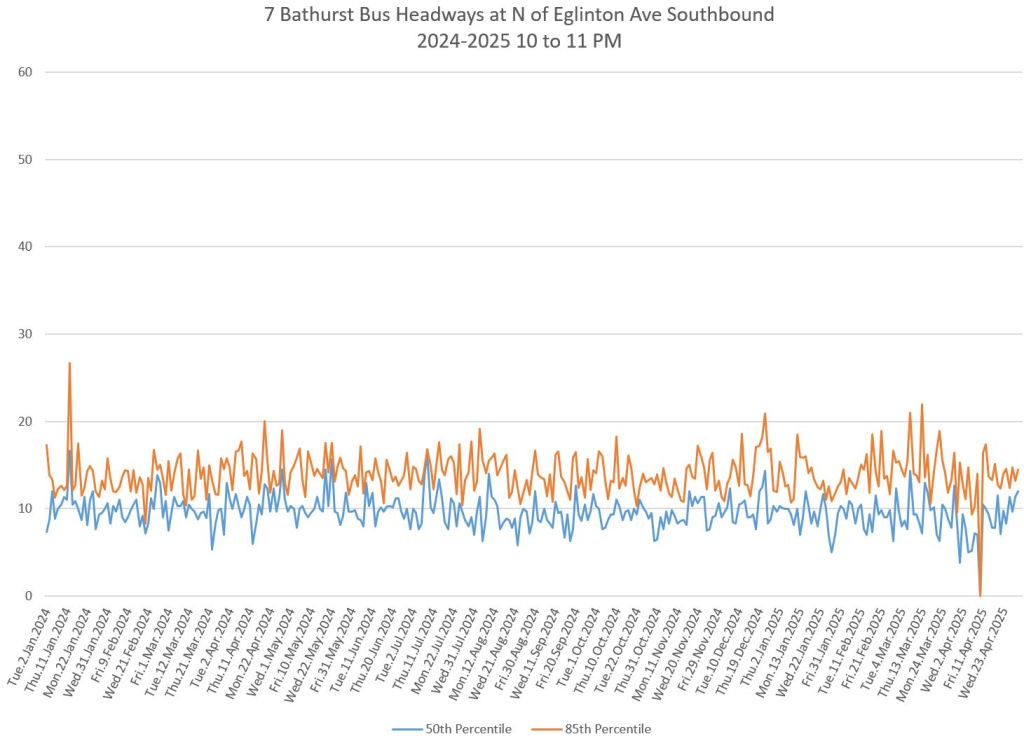
Southbound
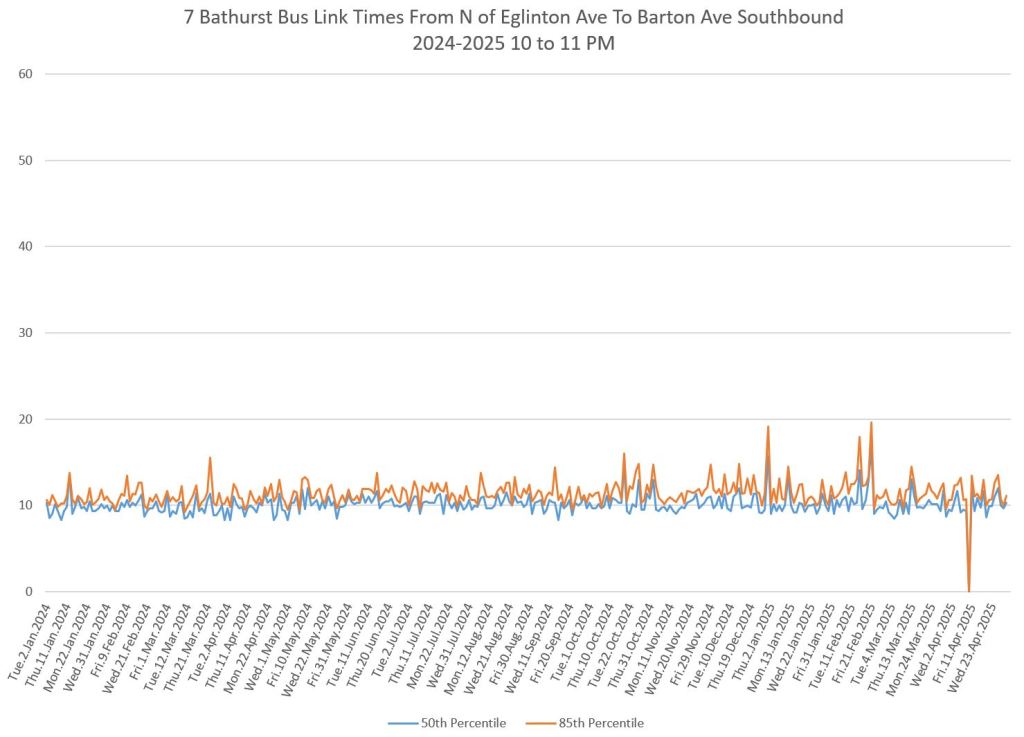
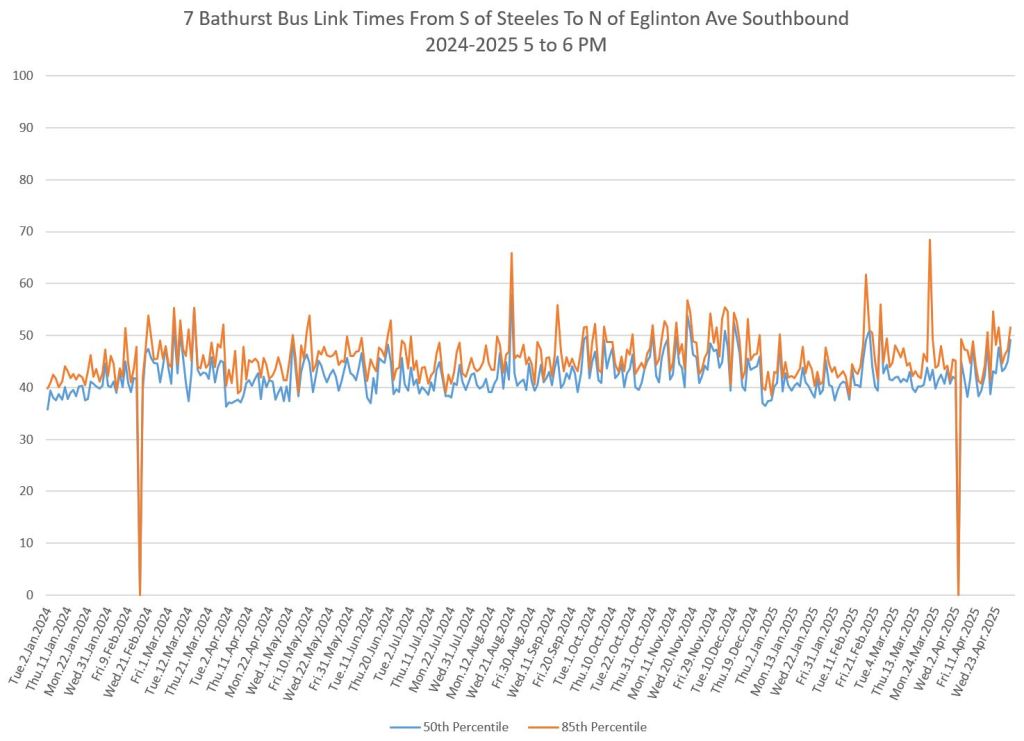
The left column shows service southbound from Steeles, and the right column show the data at Eglinton. For the latter, the values show greater variation and the 85th percentile is further above the 50th. This illustrates how vehicle spacing evolves as service moves south from Steeles to Eglinton, a longer distance than Barton to Eglinton northbound.
In the context of the RapidTO proposal, it is important to note that it is the less well-behaved service at Eglinton that will feed into the red lanes. Even with transit priority south from Eglinton, the erratic service originating further north will not be improved.
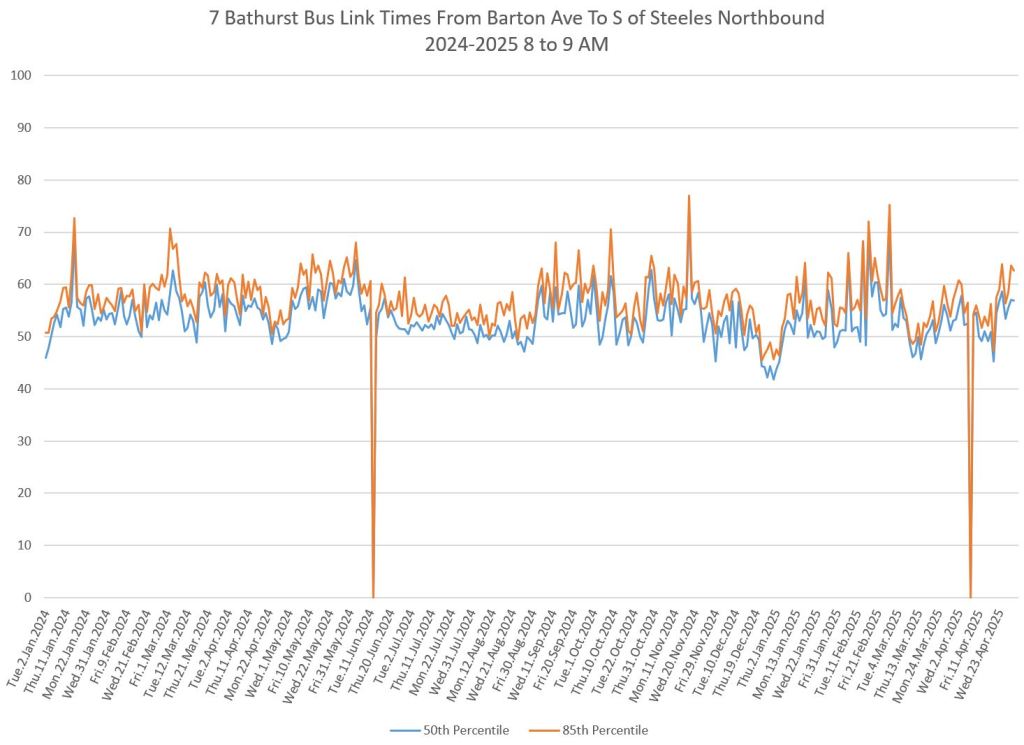
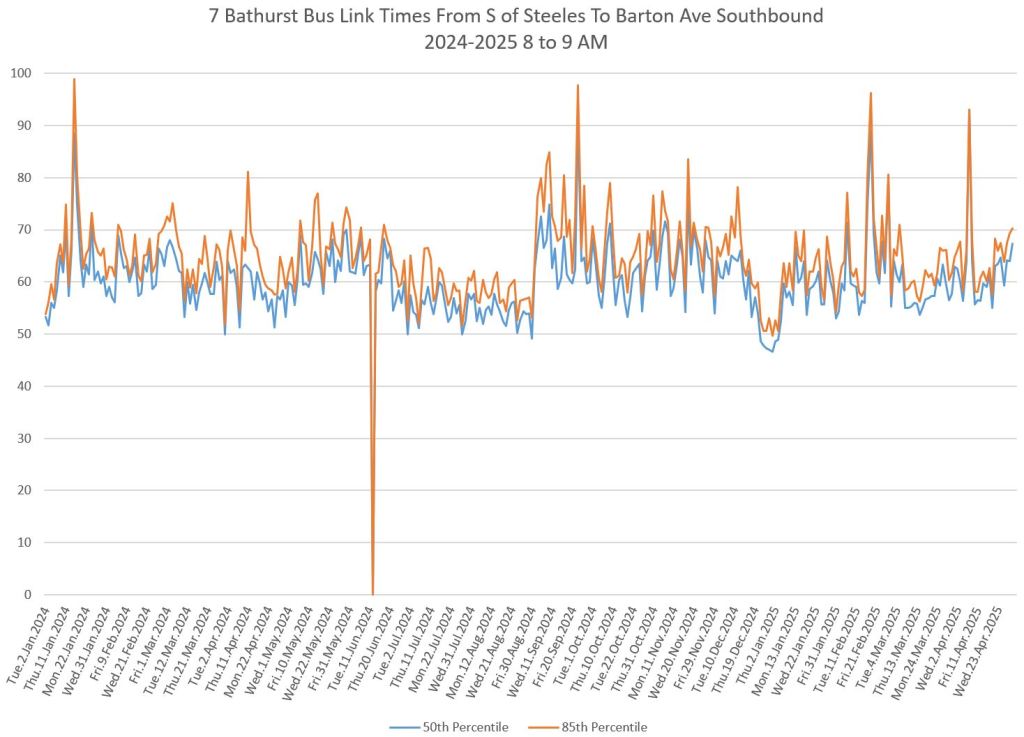
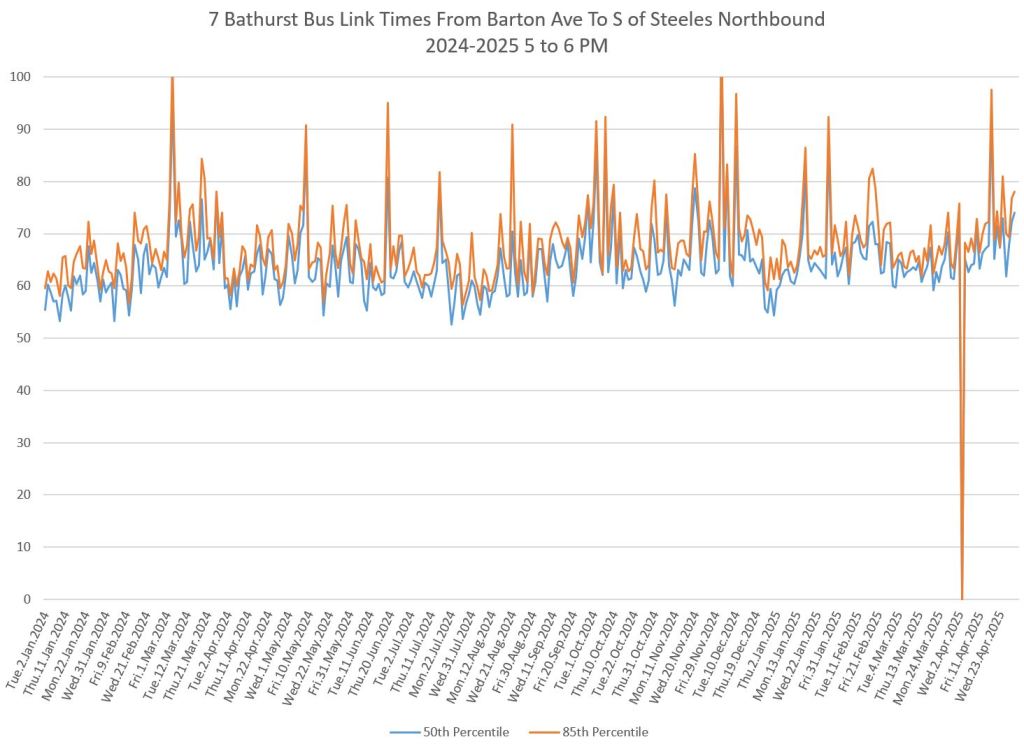
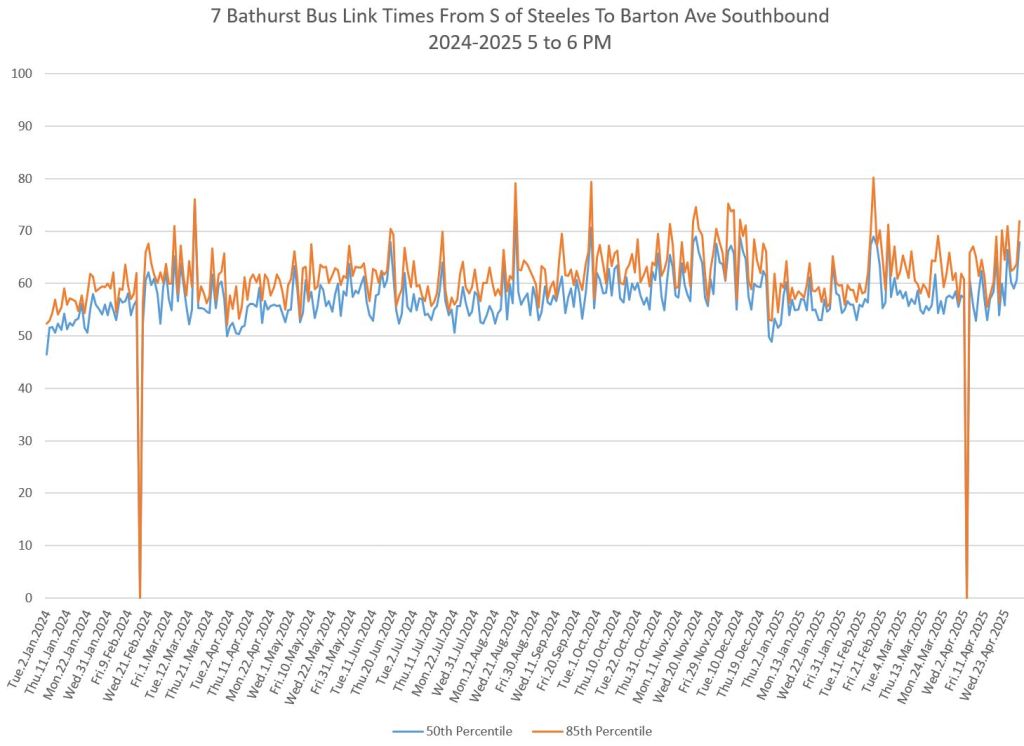
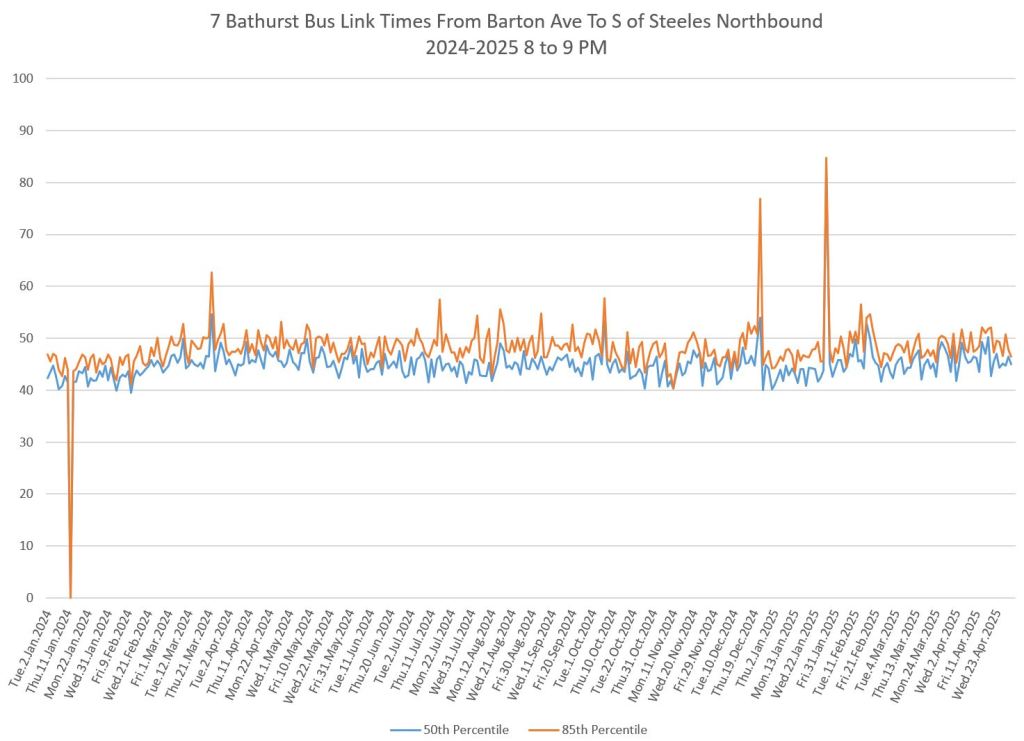
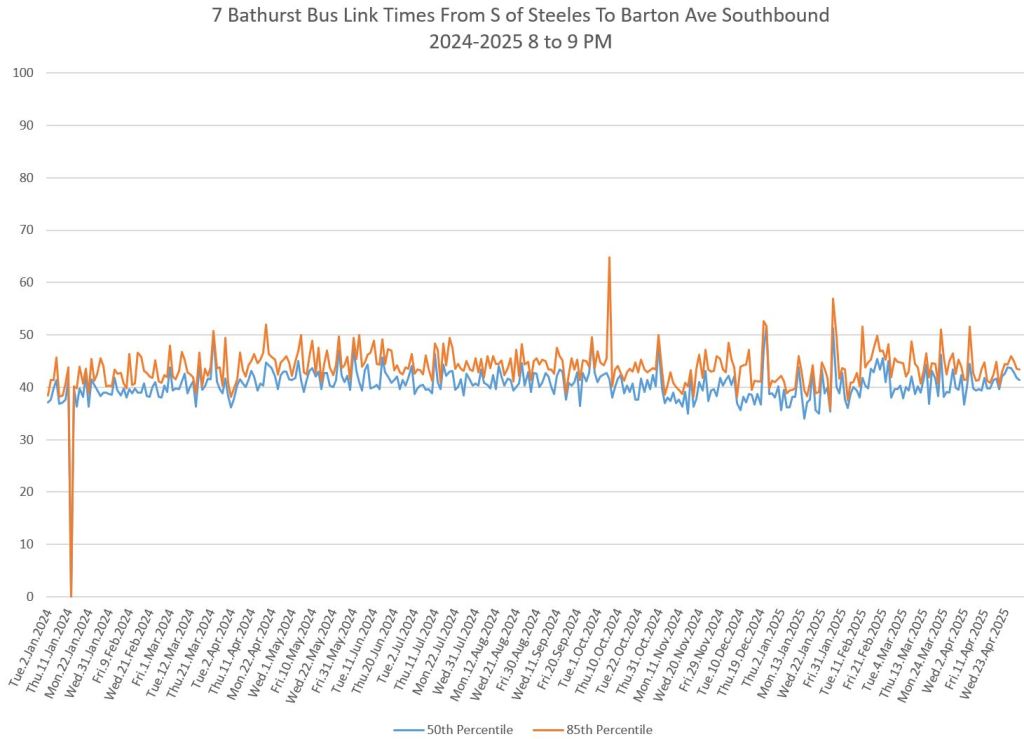
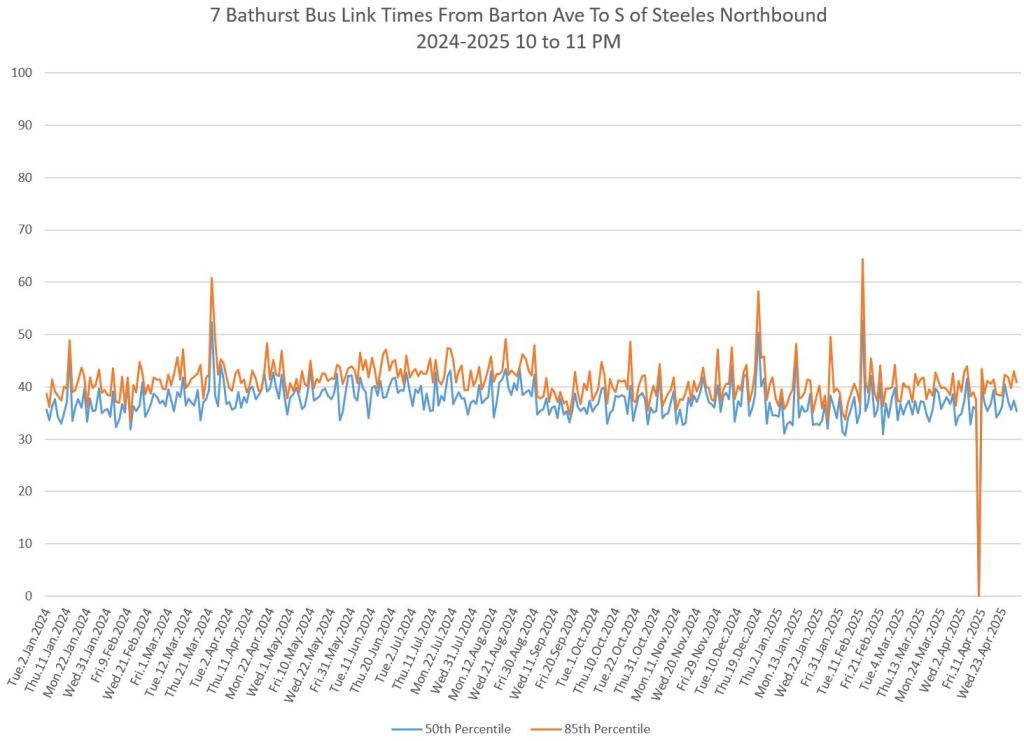
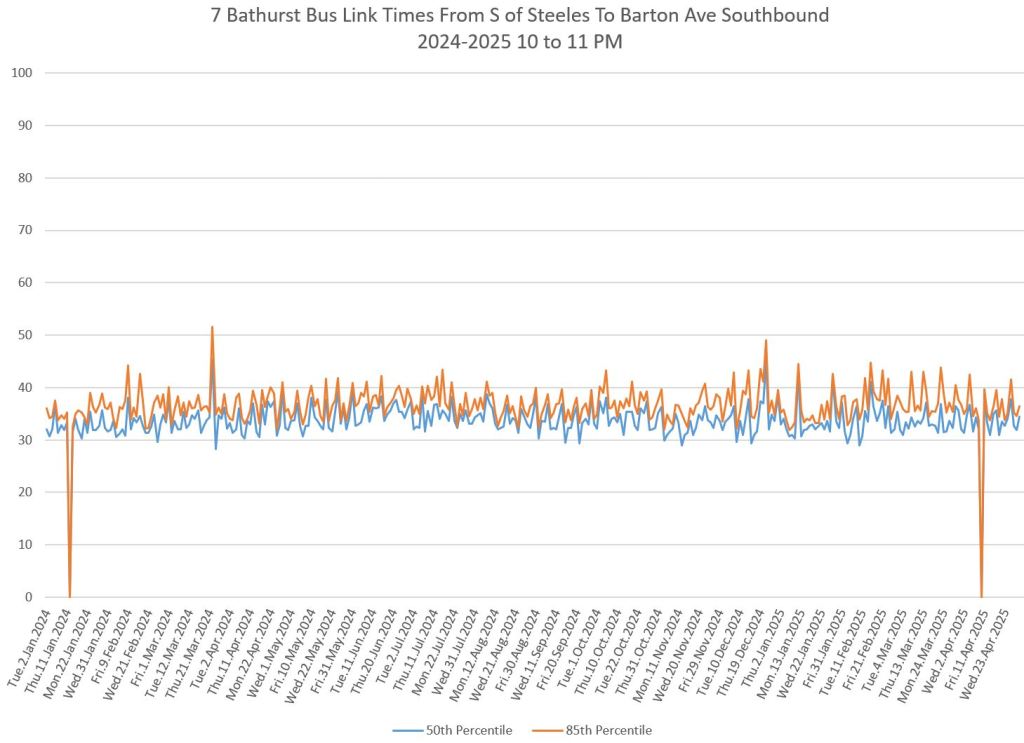
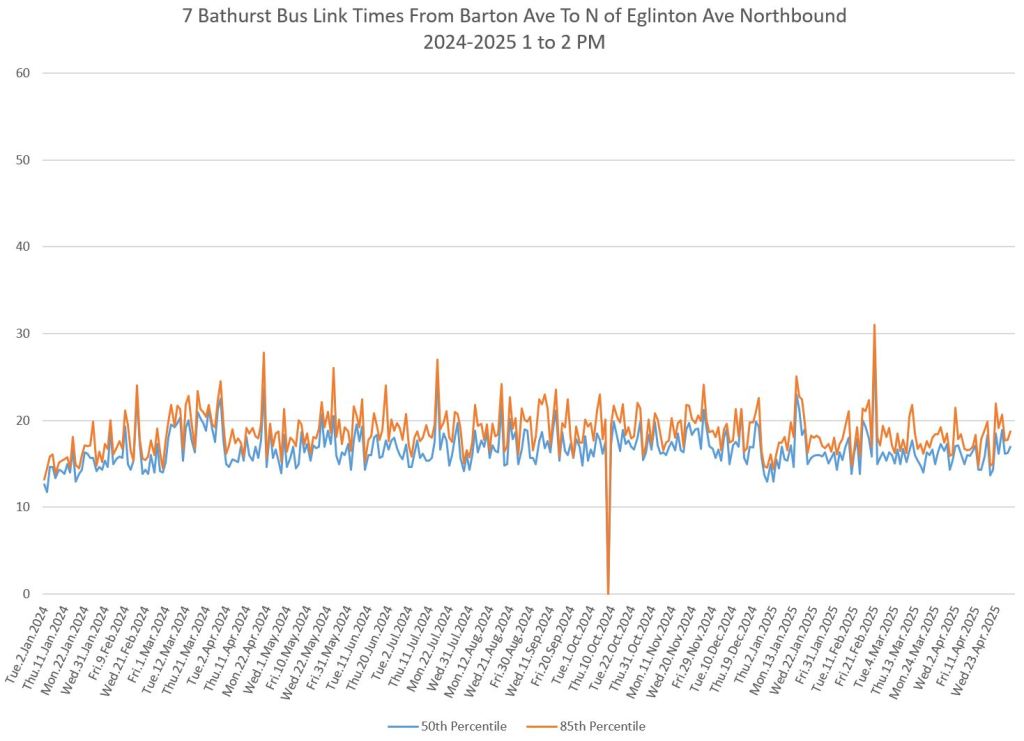
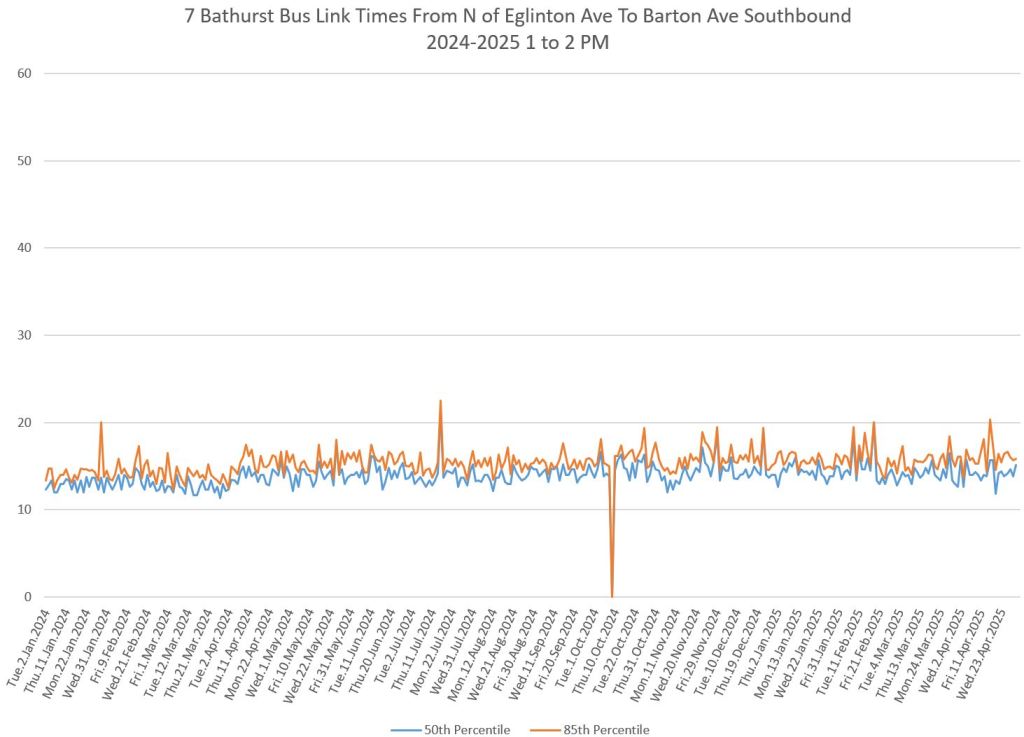
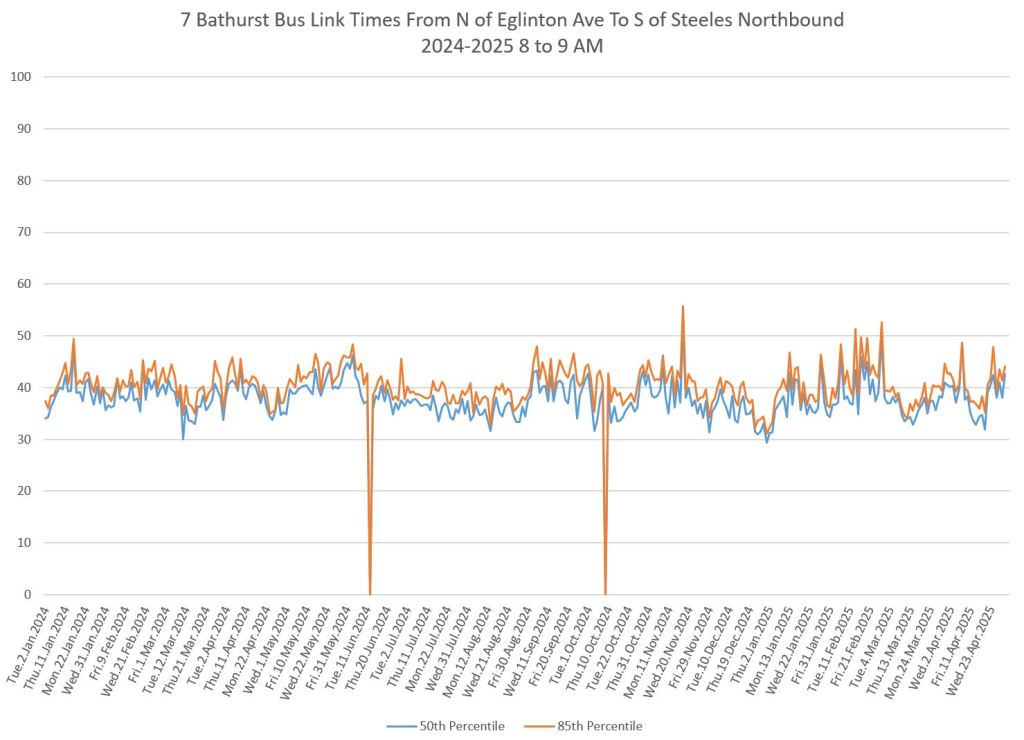
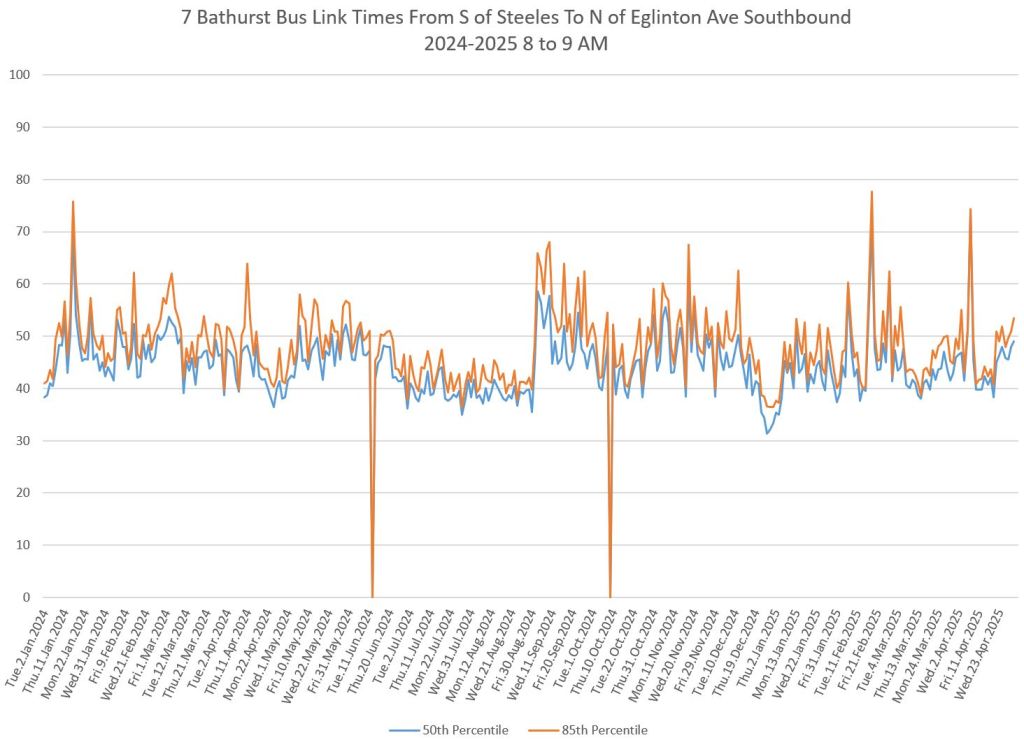
Travel Times Over the Full Route
Unlike the headway values, the 85th and 50th percentiles values for travel times remain close together. Values may change by time of day, and from day to day, but the 85th percentiles track each other.
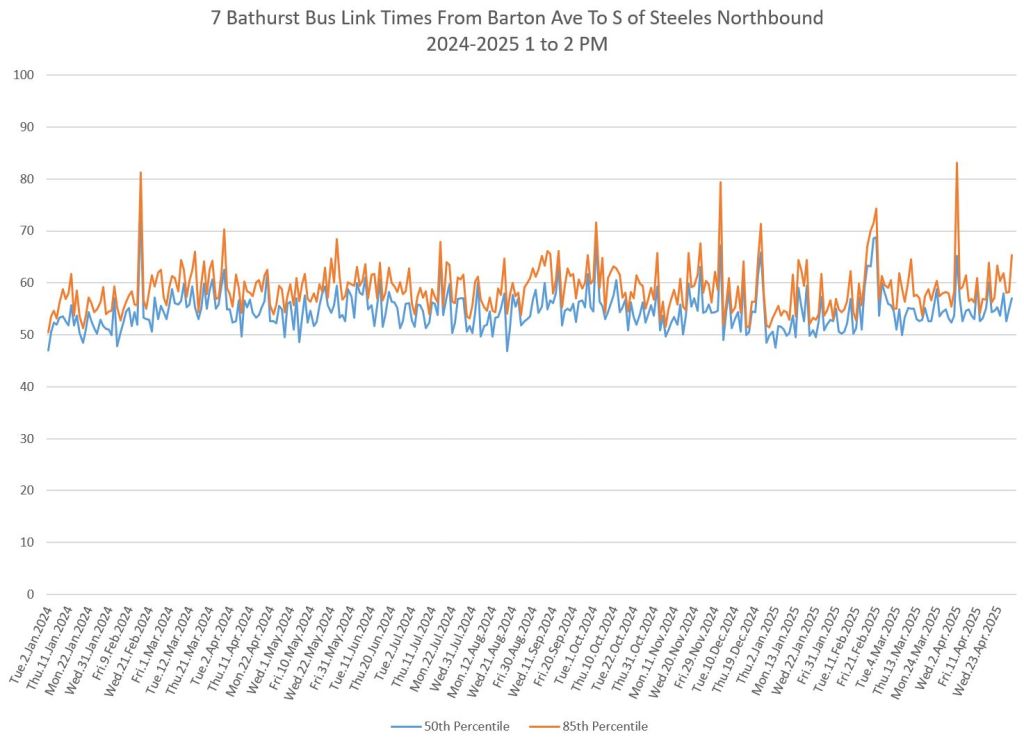
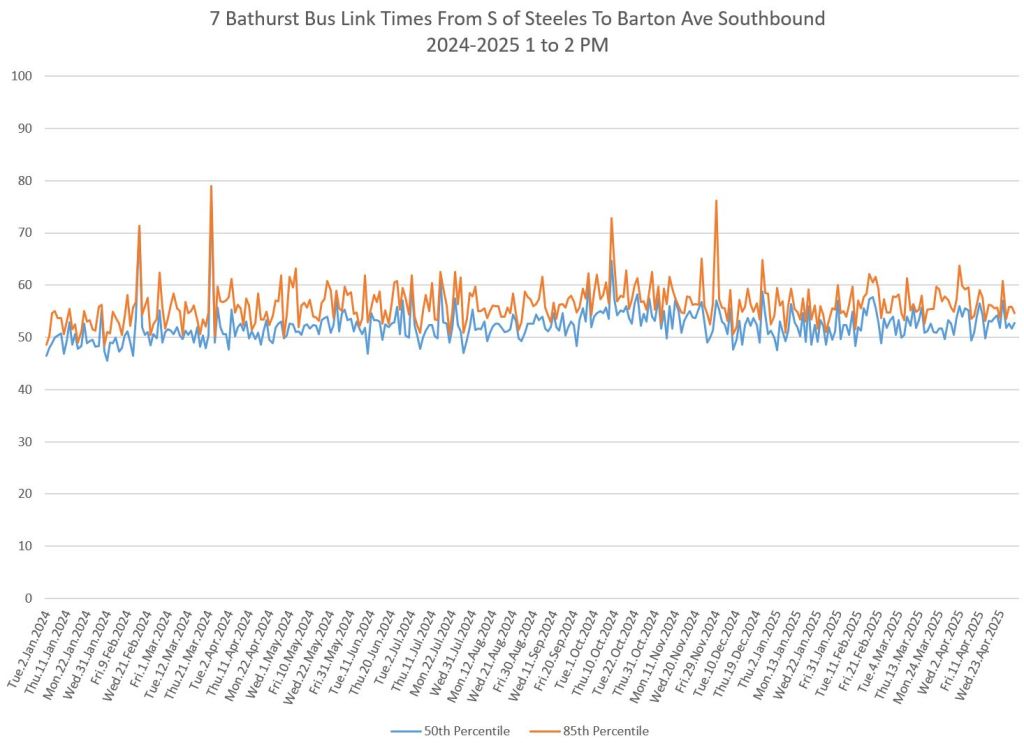
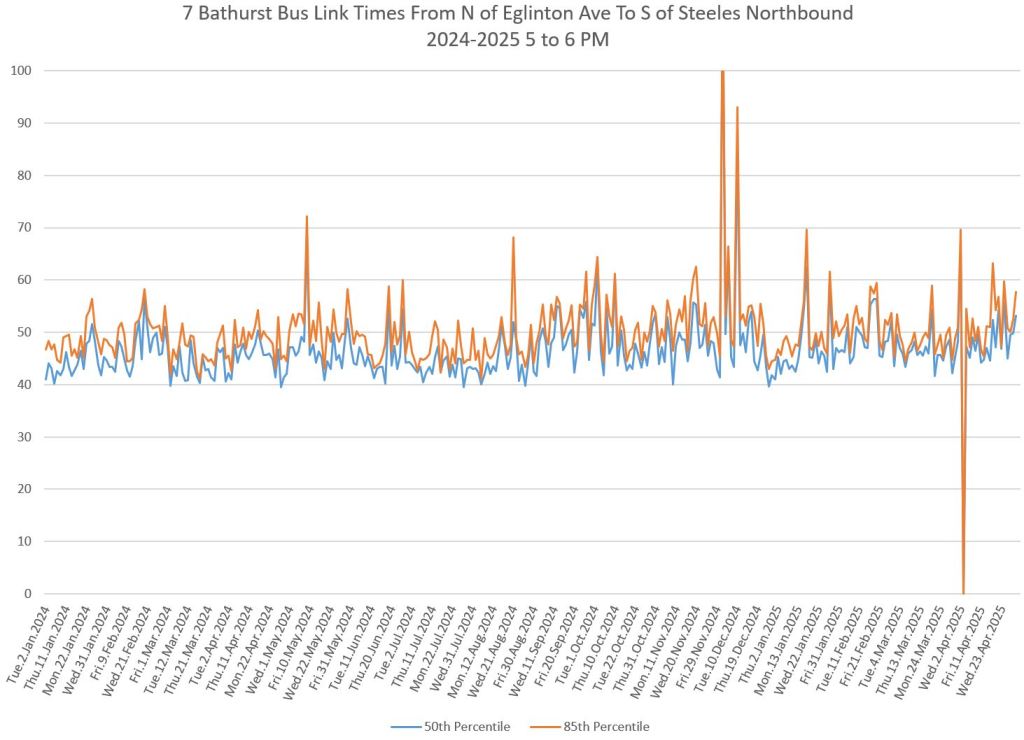
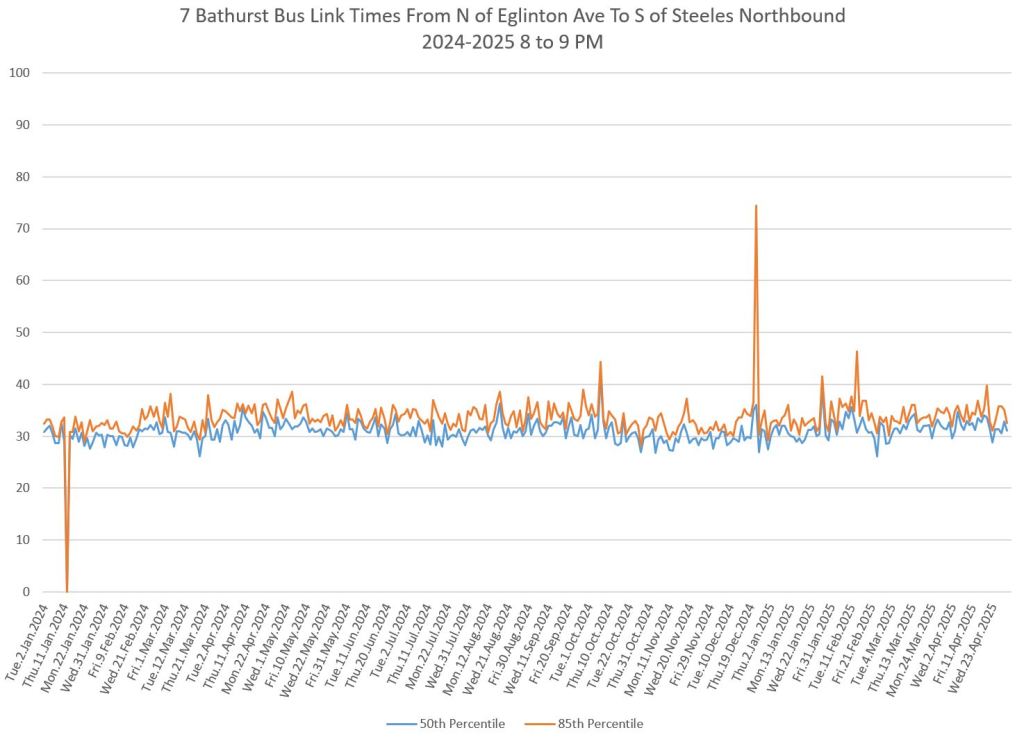
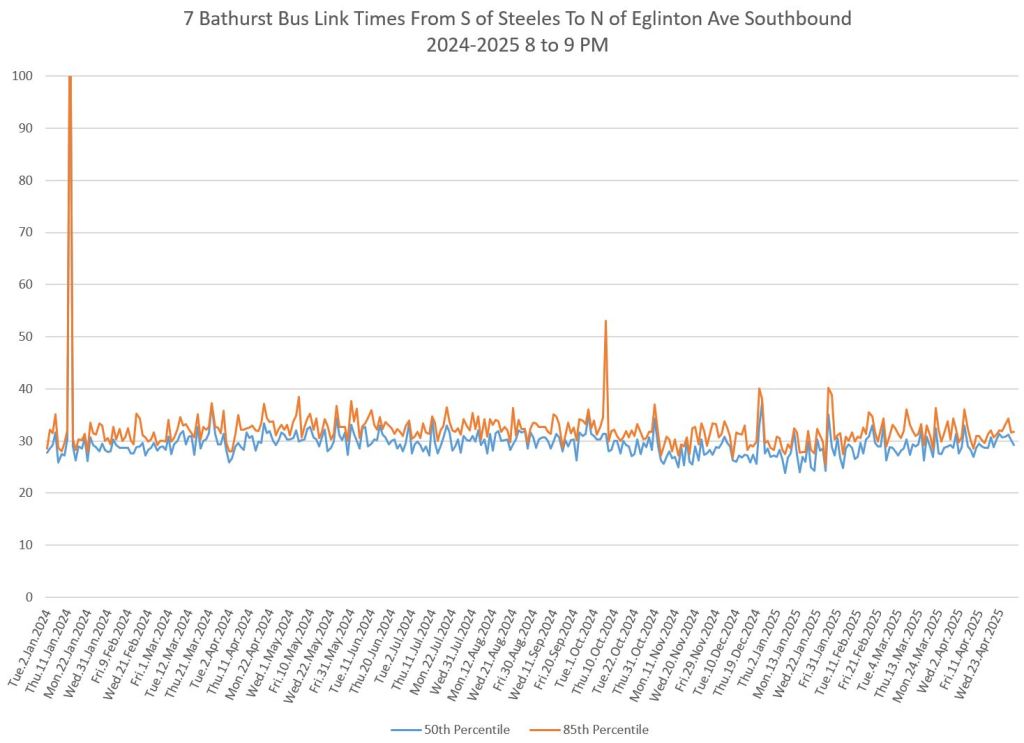
This set of charts shows the travel time from Barton to Steeles northbound on the left, and for the southbound trips on the right for each of five separate periods in the day. Southbound travel times are higher in the morning (8am data) while northbound times are higher in the PM peak (5pm data).
Note also that the times are more consistent from day to day for midday (1pm) and evening (8pm and 10pm) trips.
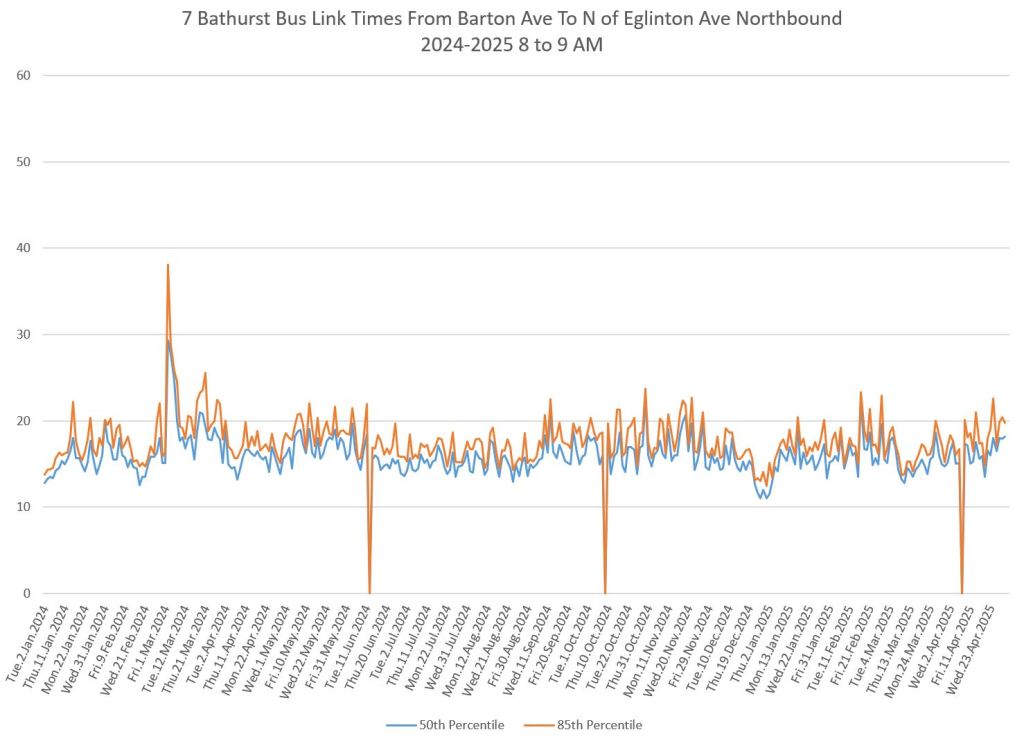
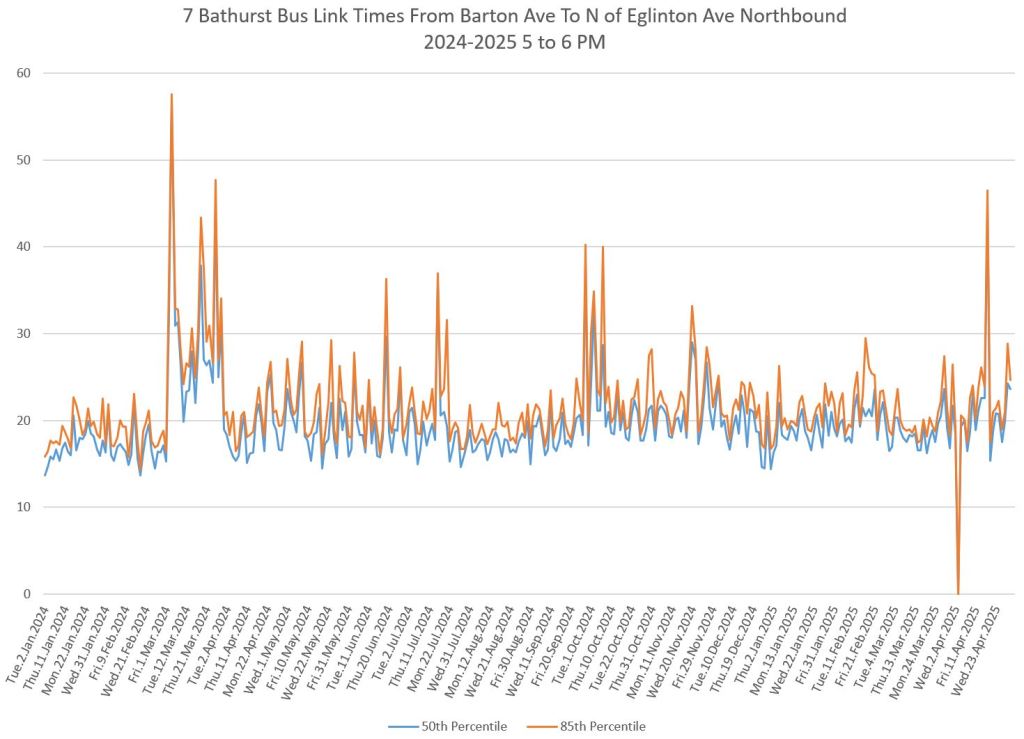
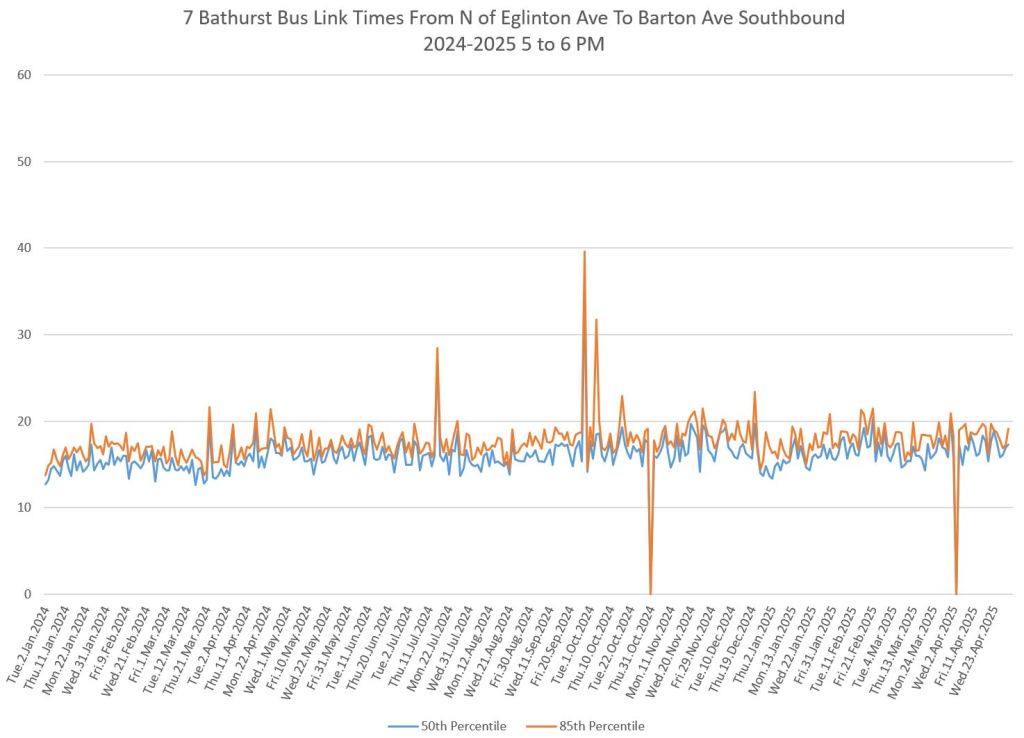
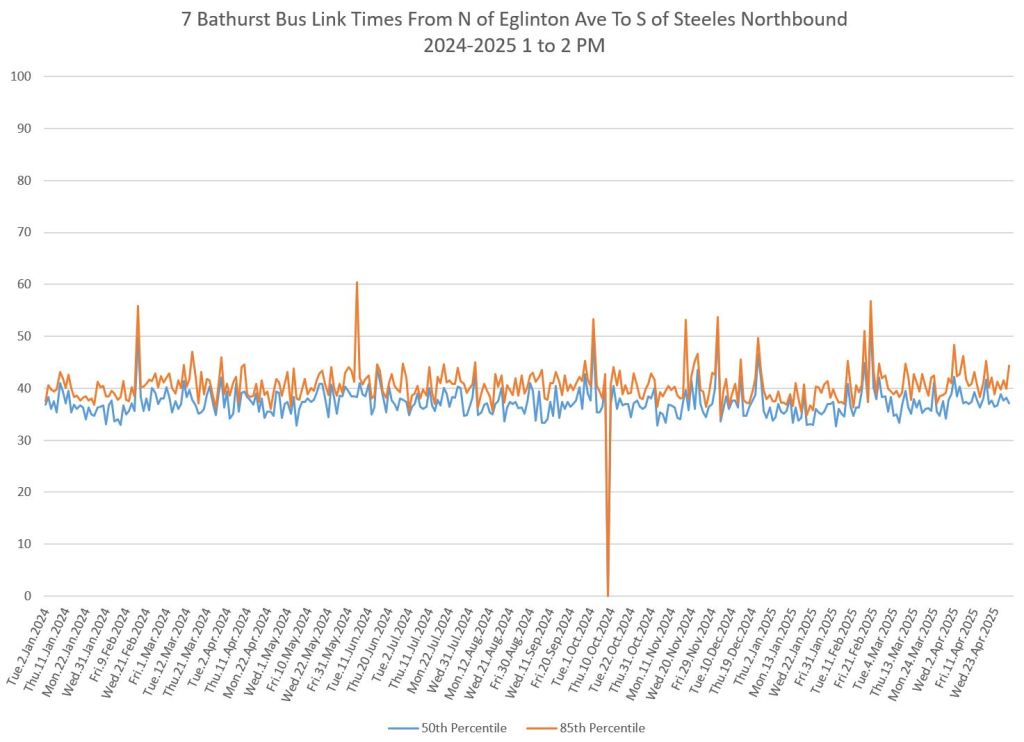
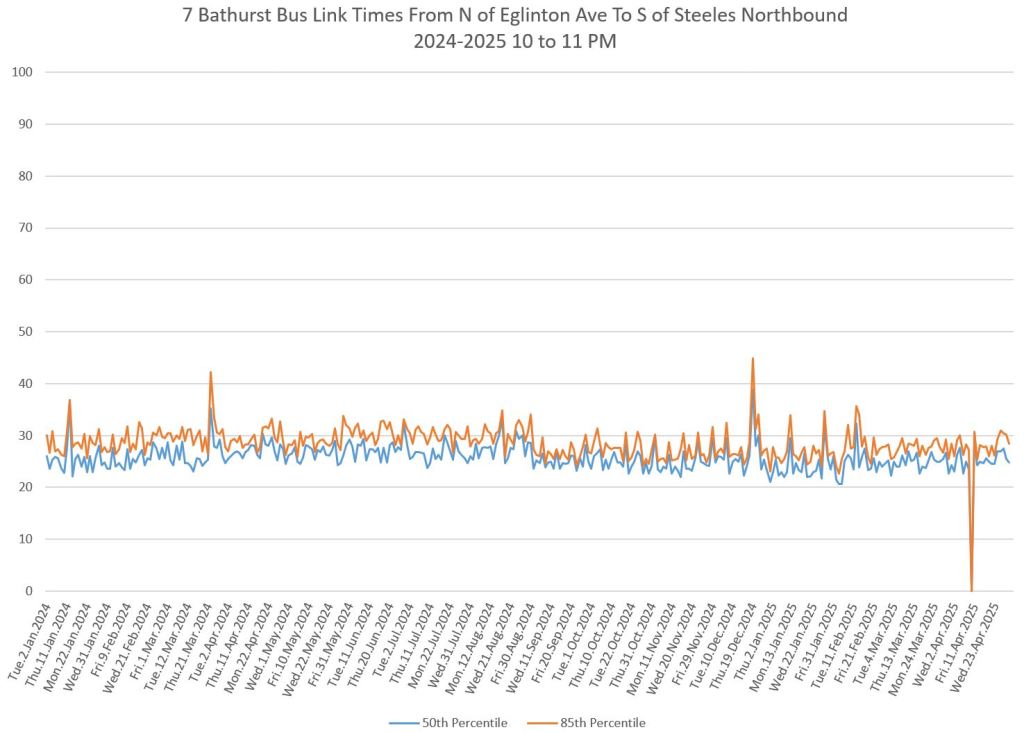
Travel Times Between Bloor and Eglinton
This set of charts look at travel times over the segment where red lanes would be installed. The chart showing the most variation is for northbound trips in the 5pm hour, followed by the northbound trips in the 8am chart. This suggests that the greatest saving in travel time with red lanes, assuming that the spikes in the chart can be flattened, lies in the PM peak northbound.
The steep rise in northbound travel times in March 2024 was caused by congestion south of Eglinton likely the result of construction work at Forest Hill Station on Line 5.
Of interest here is the “heartbeat” pattern of the spikes in travel times. They generally fall on Tuesday or Wednesday showing that there are regular variations in traffic conditions at midweek versus Mondays and Fridays.
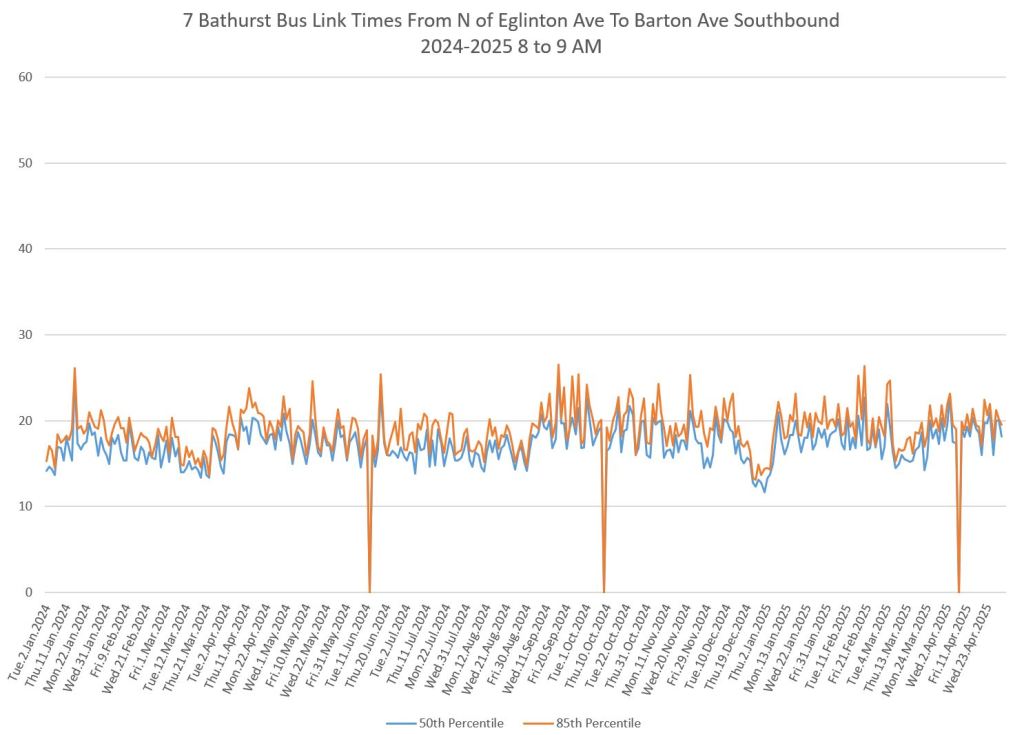
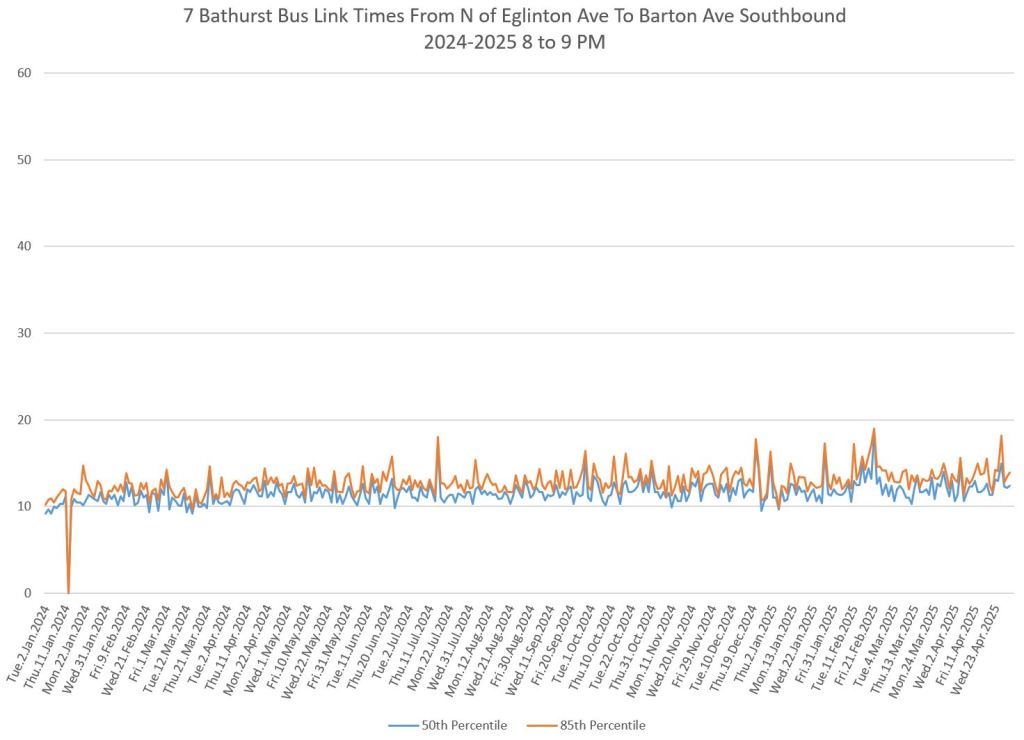
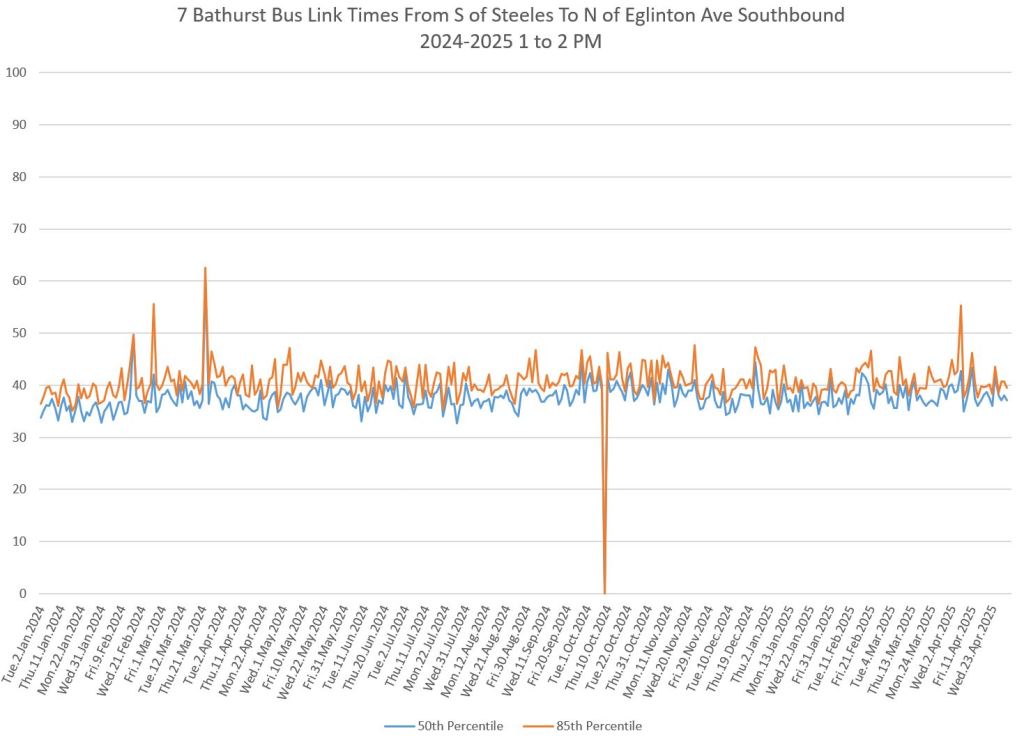
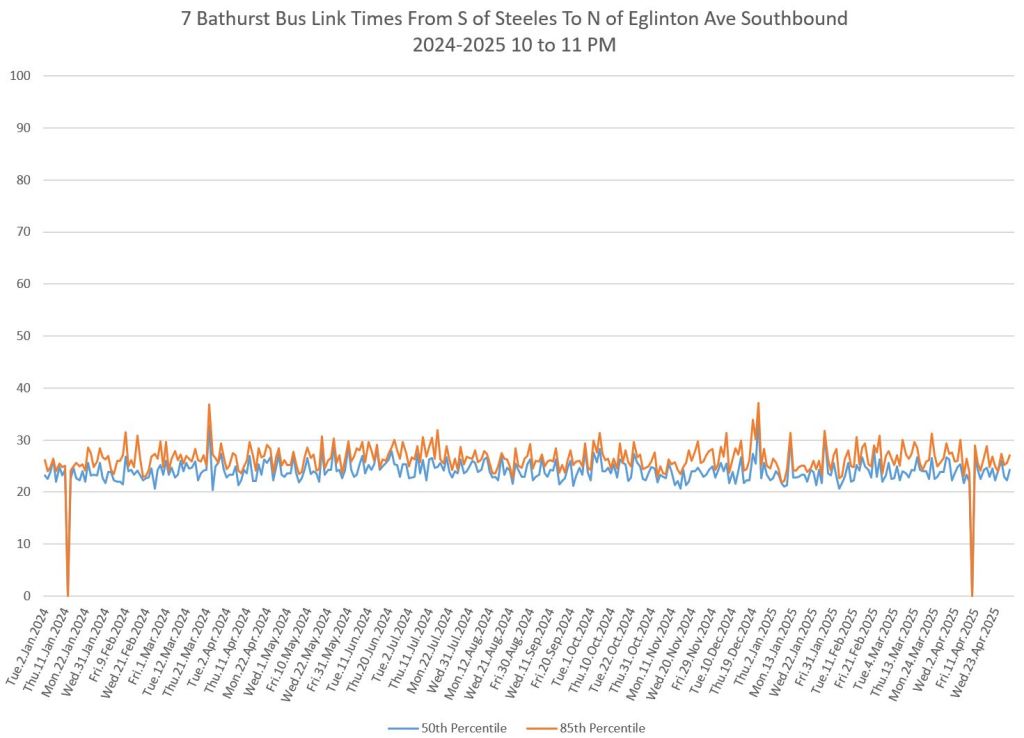
Travel Times Between Eglinton and Steeles
Although red lanes will assist in evening out travel times between Bloor and Eglinton, the situation further north also shows variations primarily in the peak direction and peak period.
Off peak travel times in both directions show little variation particularly in the evening.

Thanks for summary in email. Cheers.
Ben__________________________ Ben Barkow, Ph.D. Behavioural Team …making the world user-friendly
LikeLike
As someone that takes the 7 Bus regularly during the mid-day period, there are usually 2 or 3 buses sitting at Bathurst Stn.
Watching the buses on the transit app, usually in pairs coming south from Lawrence.
How about some proper line management…
Steve: I am going to update Part II, the Travel Times article, with info about the length of time buses sit at Steeles and at Bathurst Station. Stay tuned.
LikeLike
Hi Steve, not exactly related but today I saw a supervisor at Victoria Park and Lawrence. She had a clipboard and seemed to be writing stuff down as buses passed. She was in uniform too, not plain-clothed. It’s been ages since I’ve seen an on-street supervisor, hopefully a good sign.
LikeLike
A fellow reader noted “She had a clipboard and seemed to be writing stuff down as buses passed.” I assume she was also peering into the distance trying to see the next vehicles coming over the horizon like the ‘good old days’. Interesting to see that the TTC seem to be continuing to avoid equipping their on-street supervisors with modern equipment! That said, 20 years ago when I moved to Toronto, all of these on-street supervisors seemed to be elderly men (with hats) so having a woman is a small sign of progress.
Steve: Some years back, the TTC had handheld devices for Route Supervisors, but they were little used because they were large and heavy. The problem is that without an overview of where vehicles are, it is impossible to “manage” a route beyond very basic headway regulation. Ticking off buses as they pass is not “management”.
This is an example of the TTC implementing a “solution”, presumably because “it was better when we had on street supervisors”, but without looking at the context of how they might do their jobs and what they would achieve. For example, a shift to headway-based management also requires a change in the service quality metric because the buses won’t be “on time” if managed to headways. There are also implications for crew changes and relief breaks. It’s not a one-dimensional problem.
LikeLike