
Toronto plans to implement reserved bus lanes on Bathurst Street between Eglinton and Bloor. The project is notionally in support of future service to the FIFA World Cup events in 2026, but there is a good chance that they will permanent. Substantial travel time savings are claimed for this change, but the overall question must be of how service behaves on the route and what the RapidTO red lanes will add.
Part I of this series reviews headway reliability (vehicle spacing) and travel times in April 2025. Part II will review travel times in April 2025, and Part III will look at historical data going back to January 2024.
The scheduled service on 7 Bathurst is not as frequent as on other corridors where reserved lanes have been added. Weekday service has been every 10 minutes operating with articulated buses for the past two years. Weekend service was slightly more frequent, but operated with standard sized buses until September 2024 when it changed to artics and a 10 minute headway at all hours.
Another change in September 2024 was an increase of terminal recovery times, partly offset by a reduction in scheduled travel times, during most weekday periods.
Not shown in the schedule summaries is additional service from November 18, 2024 to March 28, 2025 using spare operators. These trips operated with standard sized buses between roughly 7am and 1pm. The effect of these will show up in Part III of the series.
In the detailed review, it is clear that weekend service on 7 Bathurst is much less reliable than weekdays. In the tables below, note that scheduled travel times are considerably less on weekends than weekday midday and early evening. This is reflected in shorter terminal layovers and many more short turns on weekends.


Headway Reliability in April 2025
Service Standards
TTC measures service quality at terminals. The official Service Standards call for departures no earlier than 1 minute and no later than 5 minutes relative to the schedule. On 7 Bathurst with a 10-minute headway all day long, buses should appear on a pattern every 0-10-20-30-40-50 minutes past the hour, but could actually be at 5-9-25-29-45-49 and be “on time” for quality measurements.
Recently, management changed the metric (but not the official standard which needs Board approval) to 0 minutes early, 5 minutes late. The resulting worst case “on time” pattern would be 5-10-25-30-45-50. That is an alternating pattern of 5 and 15 minute headways where buses are scheduled every 10 minutes.
The problem with this standard is that it measures buses against the scheduled time, not against each other, although it is the bunches and gaps that riders actually experience. Even worse, the TTC’s goal is to achieve the standard only 60% of the time on an average basis. This leaves 40% of all service outside of any standard at all.
From Terminals
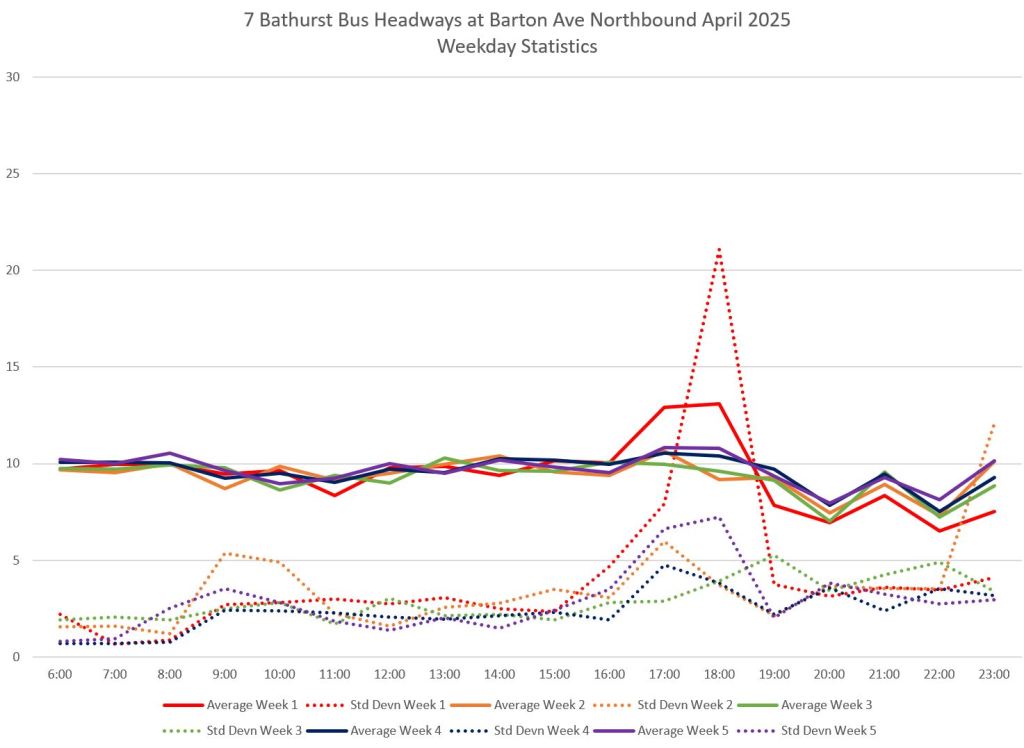
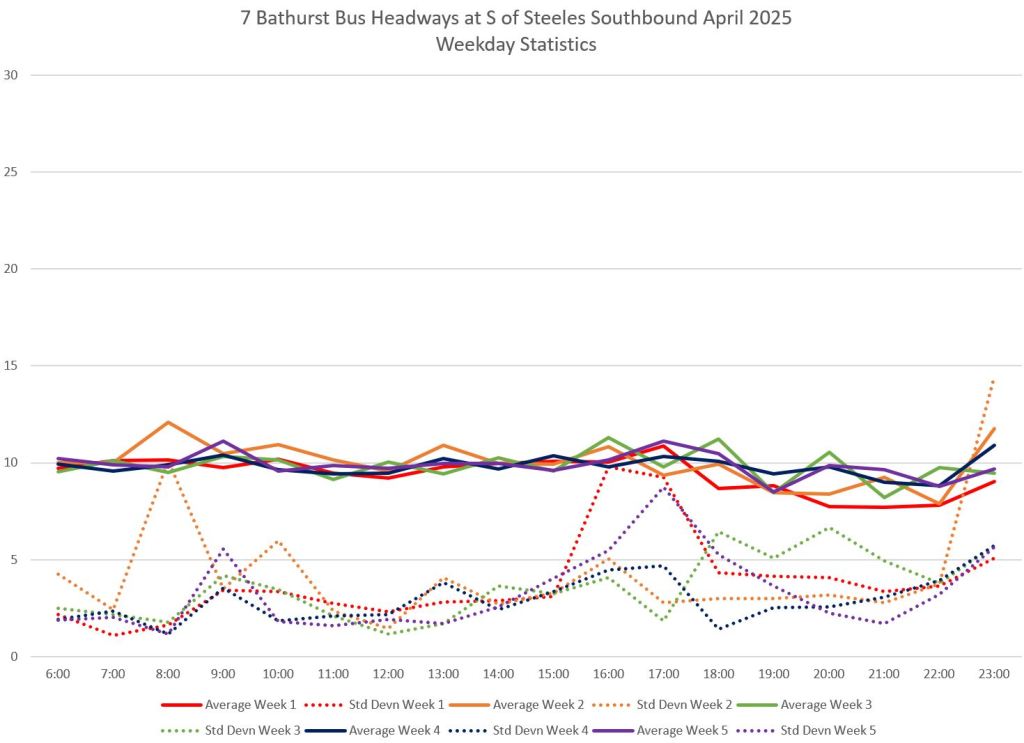
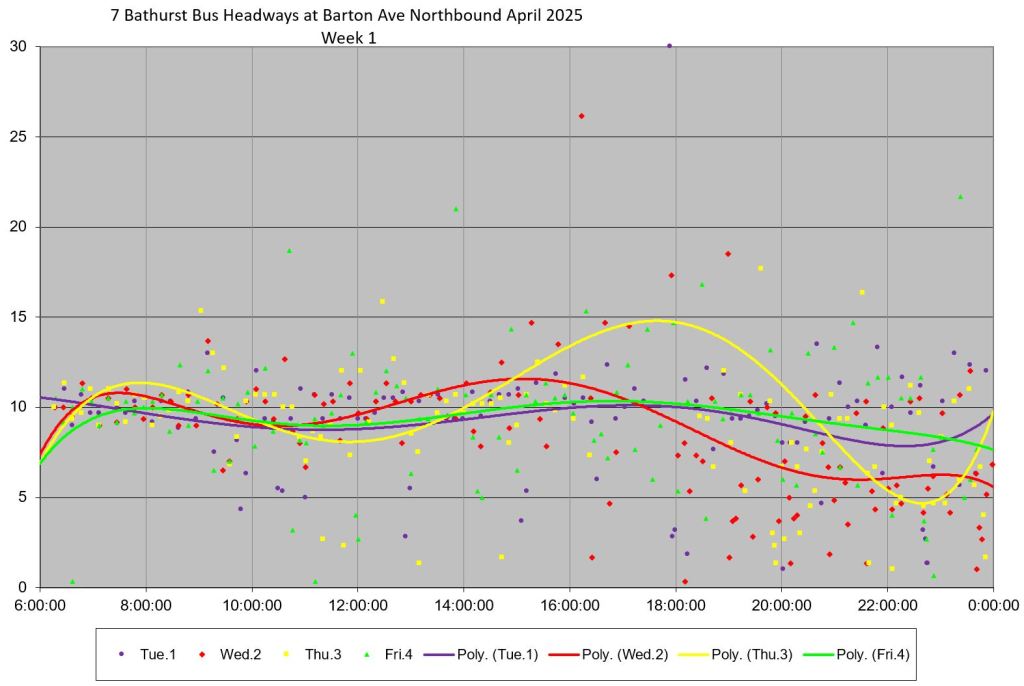
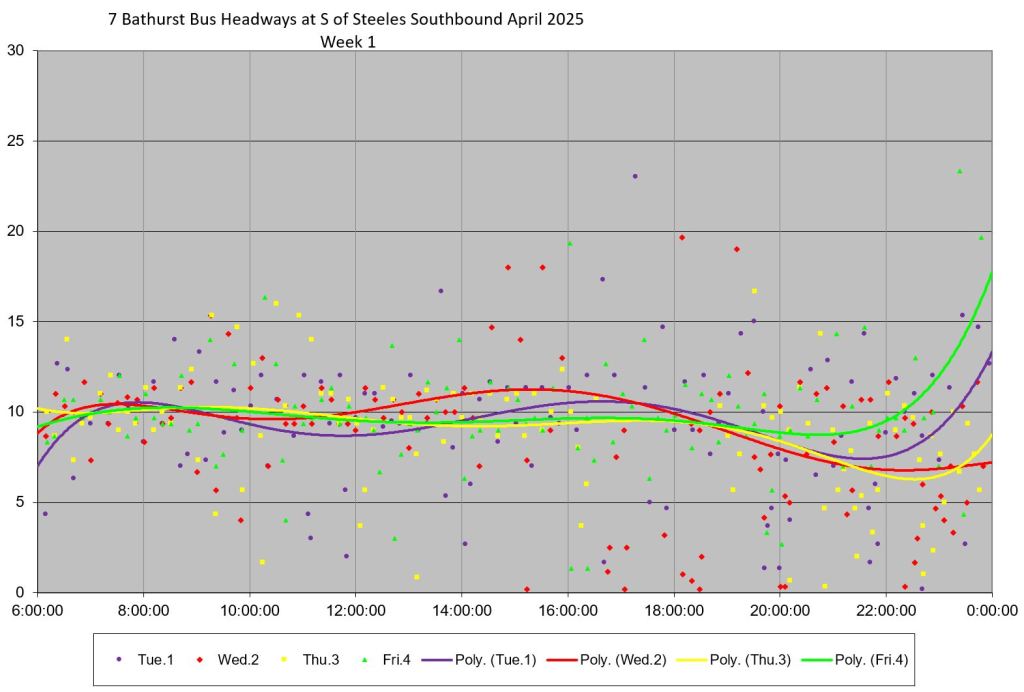
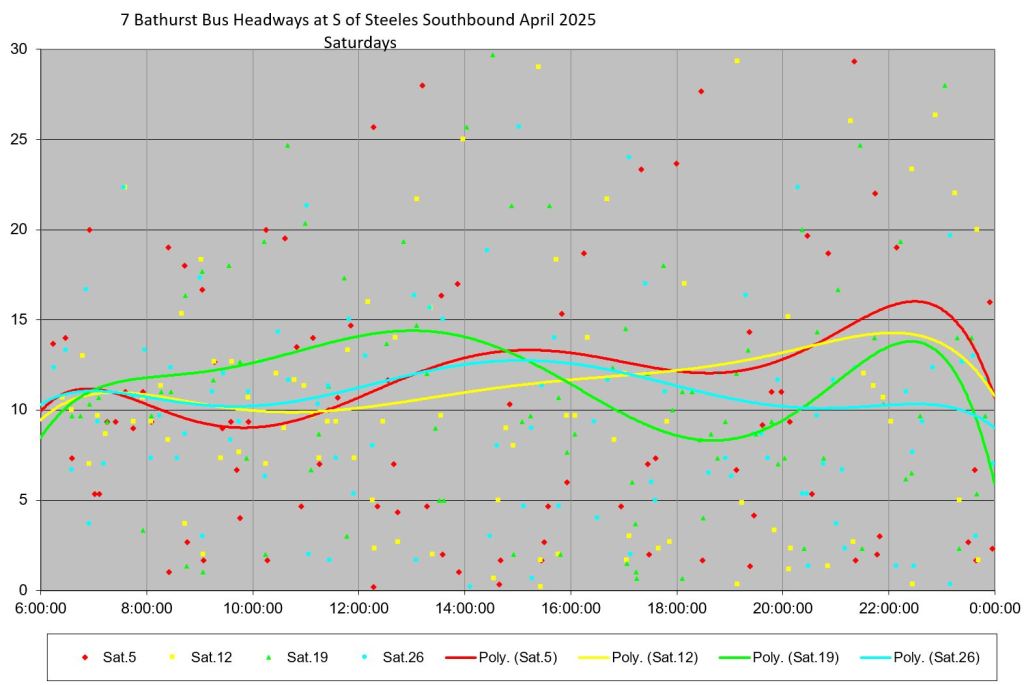
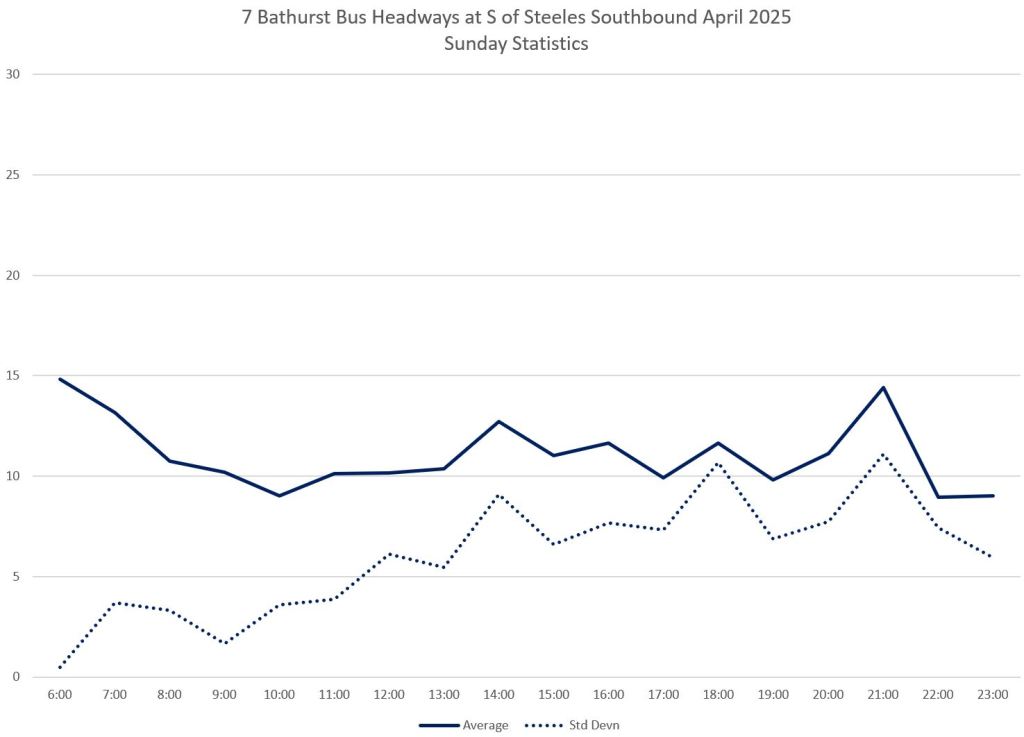
The first set of charts below shows the behaviour of service on 7 Bathurst measured near the two terminals. The screenlines for measuring headways used here are northbound at Barton Avenue and southbound south of Steeles Avenue. The locations are chosen to be free of any spurious vehicle movements within the terminal areas that might register as a departure.
The values shown are the spacings between buses, and there is no attempt to reconcile the actual times with the schedule. This is a “rider’s eye” view of the service.
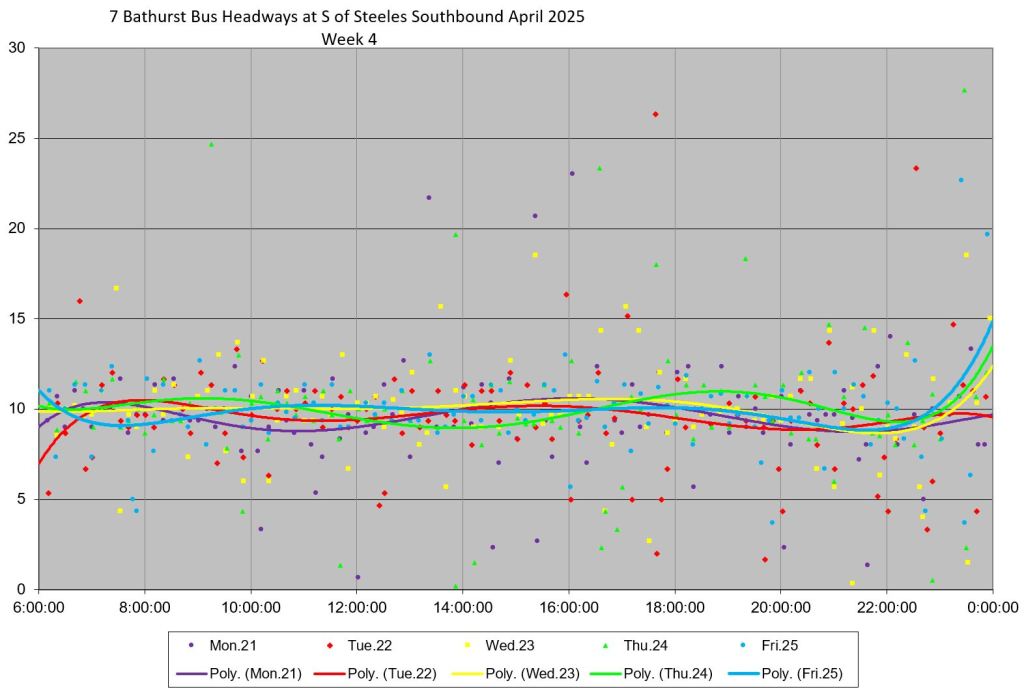
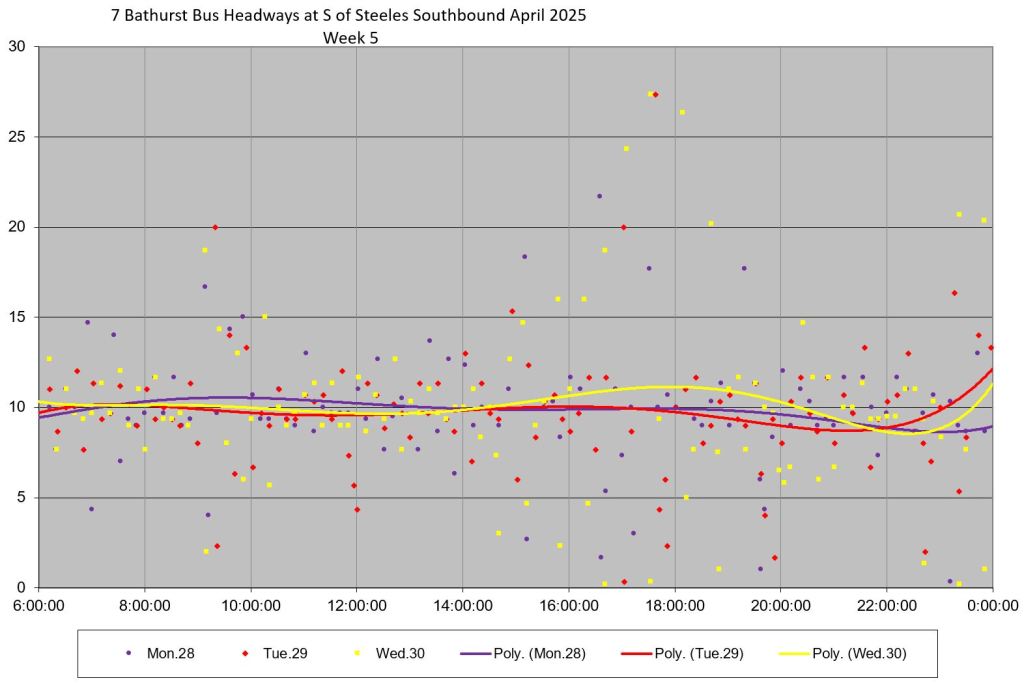
The left column shows data northbound while the right column shows southbound data for the same period.
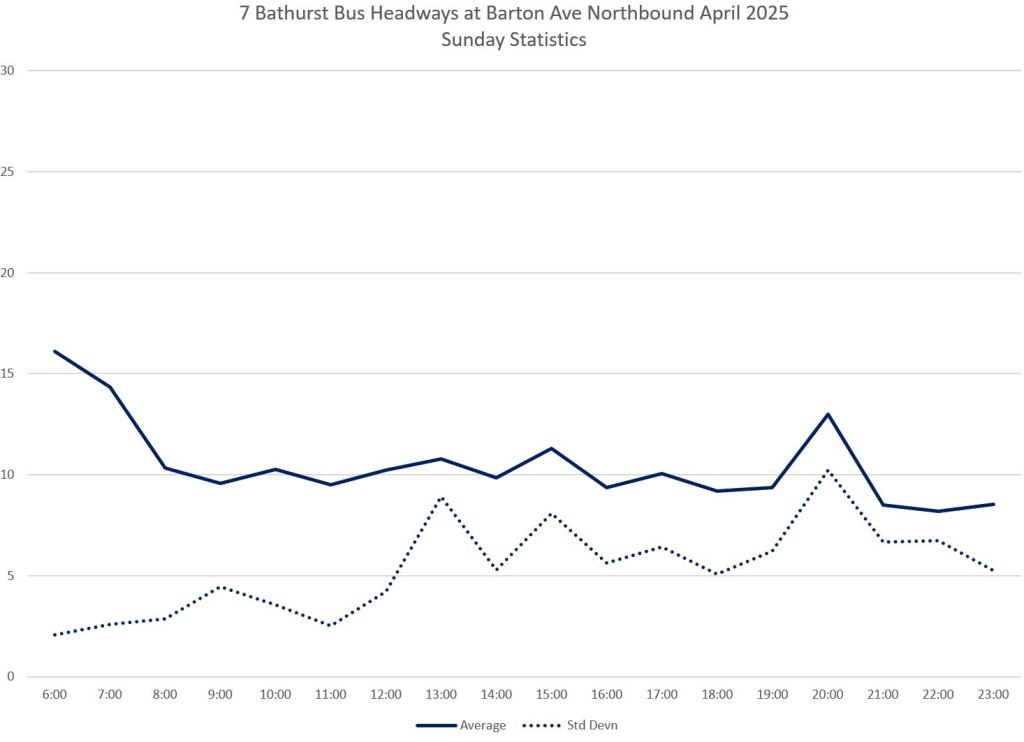
The first pair of charts shows general statistics for all weekday trips. The solid lines are the averages and the dotted lines are standard deviations of the values, a measure of how scattered individual data points are. If the SD value is 5 minutes, then a majority of the data points lie within a 10-minute range either side of the average (5 to 15 minutes). The standard allows up to a 15 minute range and so the SD value has to be very high to breach the standard.
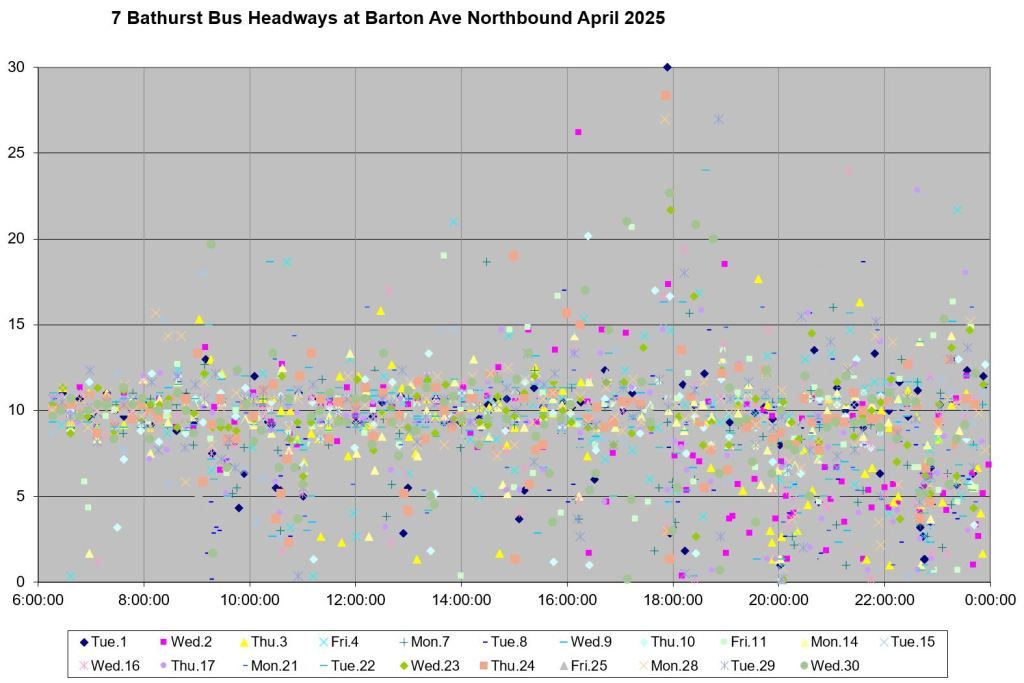
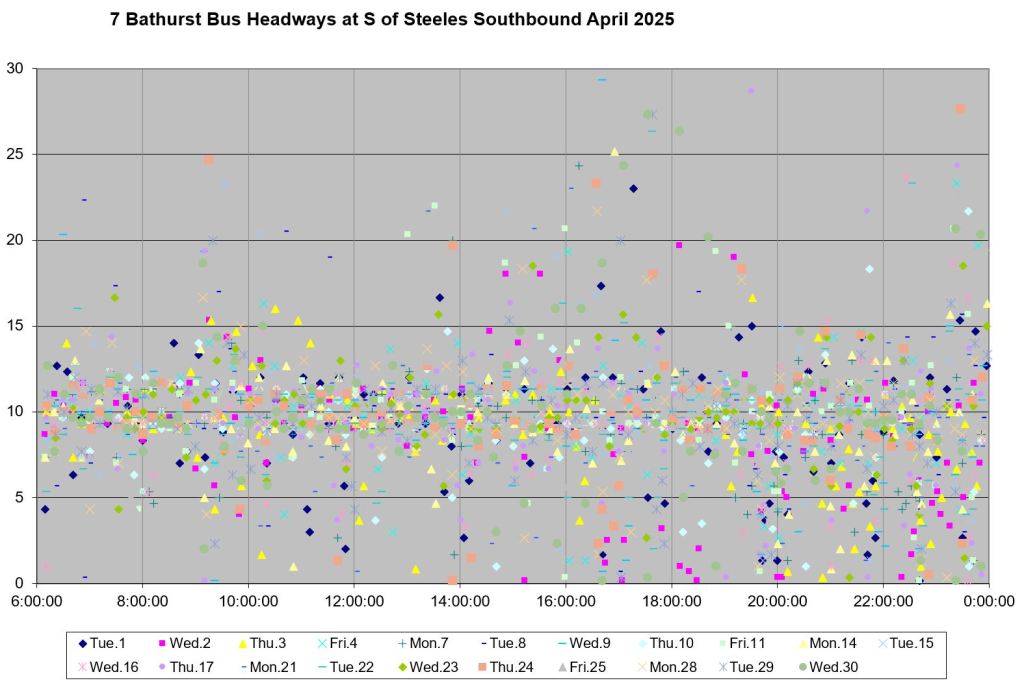
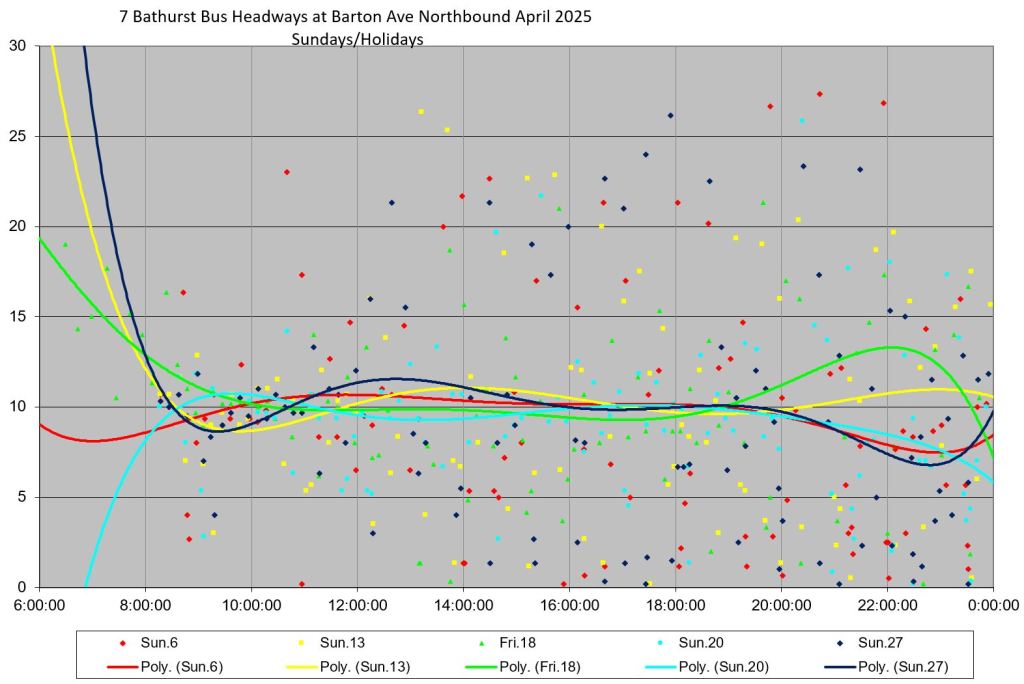
The next pair of charts show the individual data points from on which the stats are based. The main part of the “cloud” of points is clustered along the 10-minute line as one would expect, but many values are well above and below it, especially in the evenings.
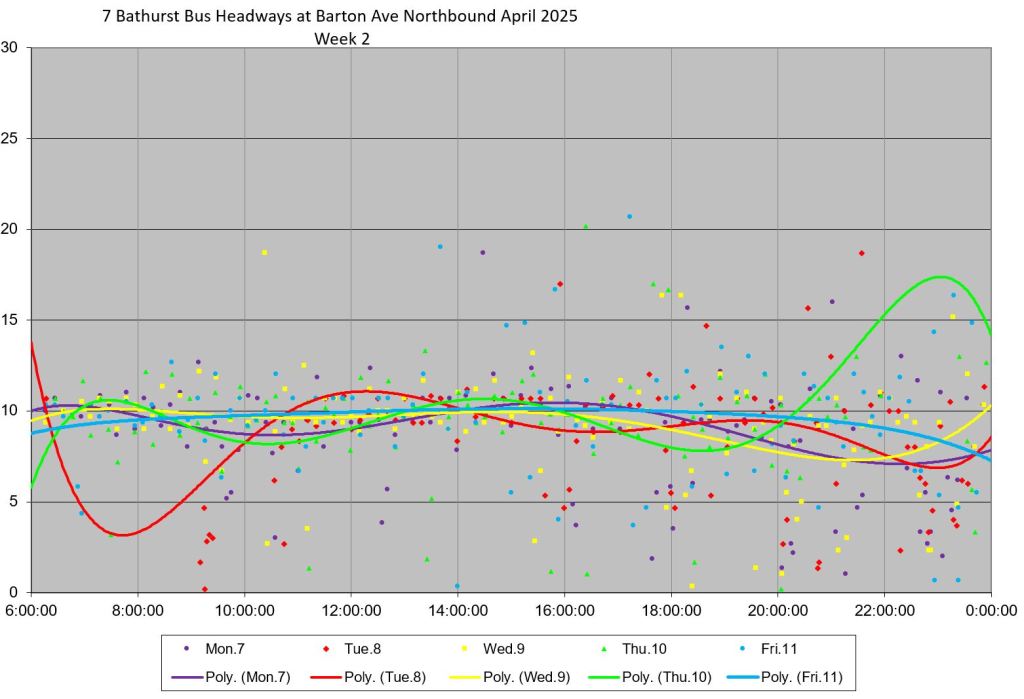
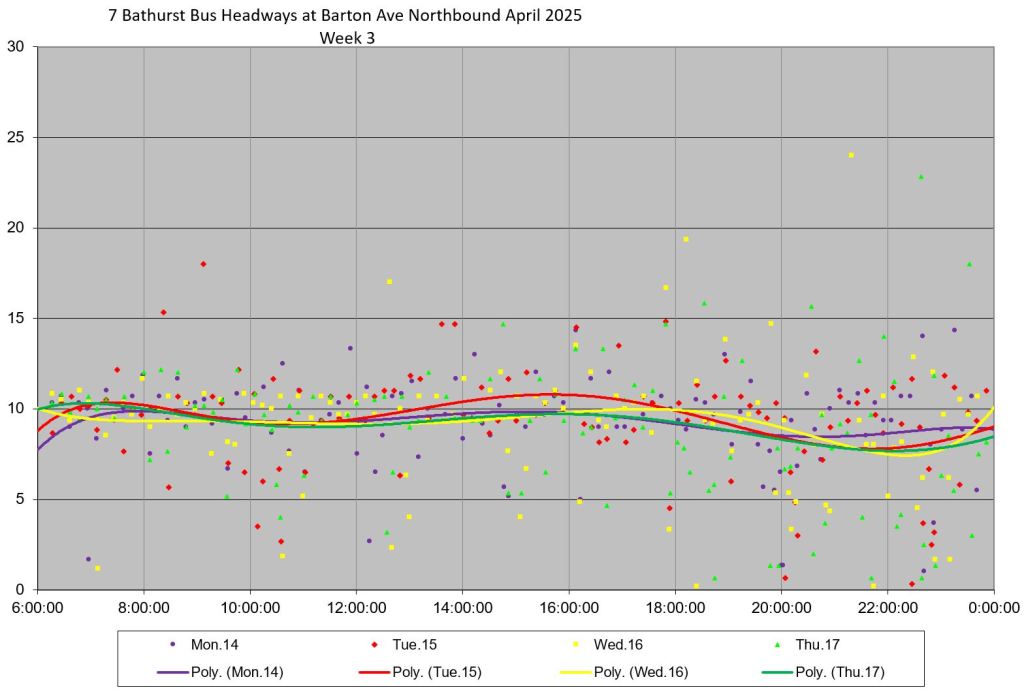
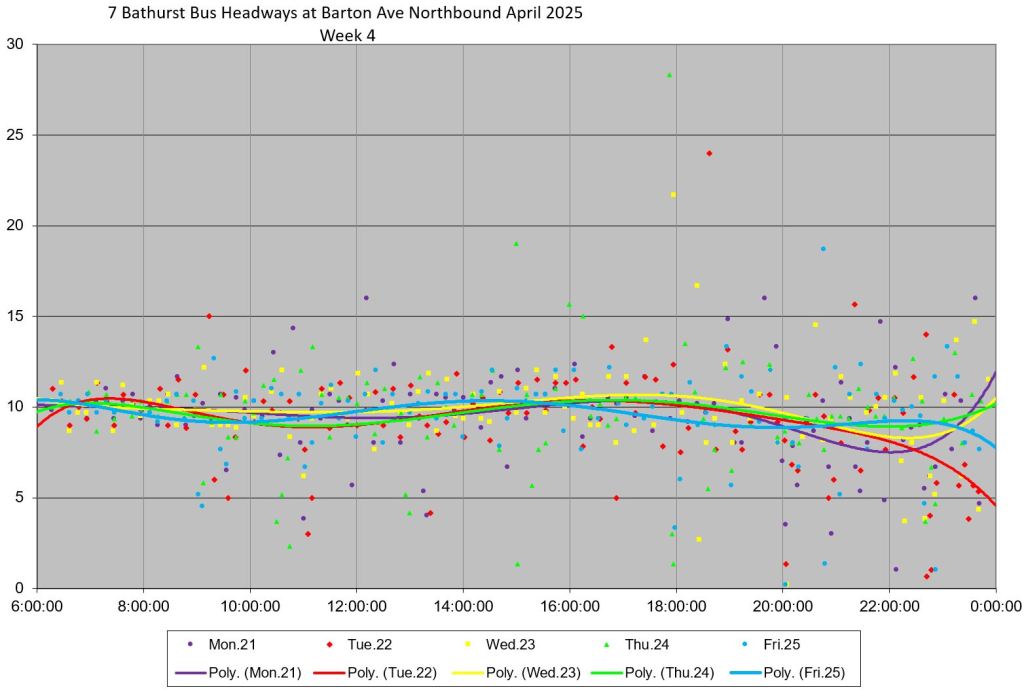
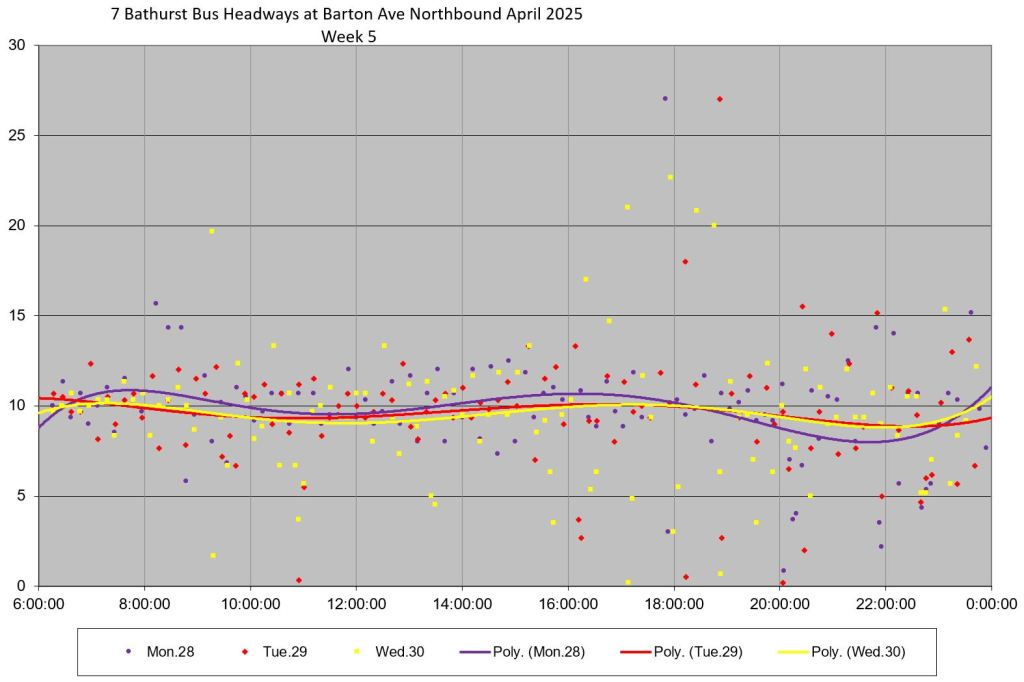
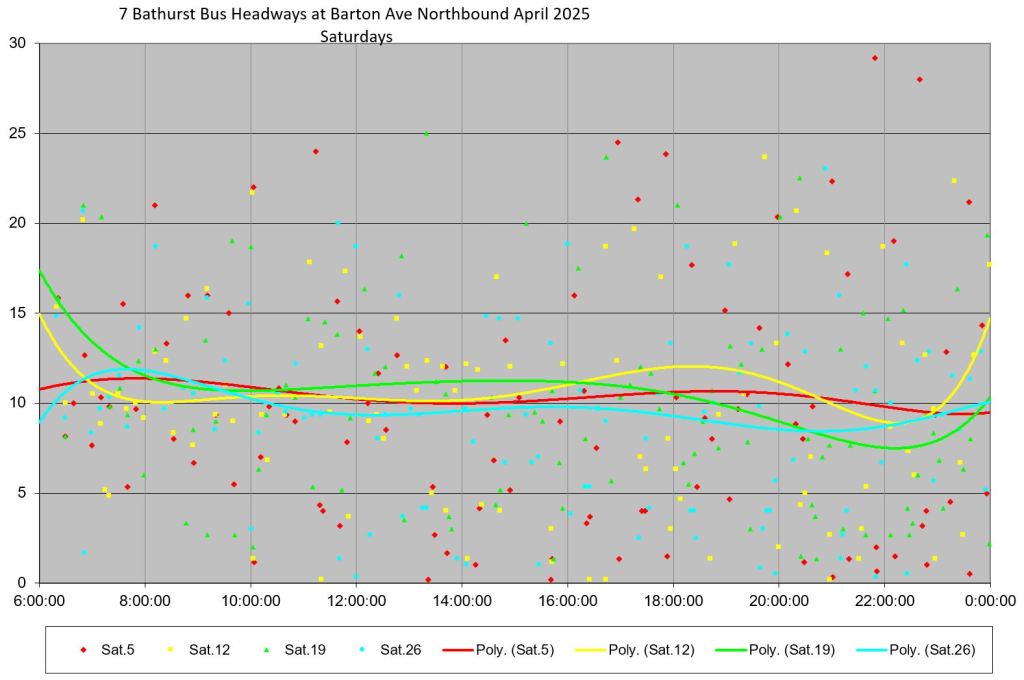
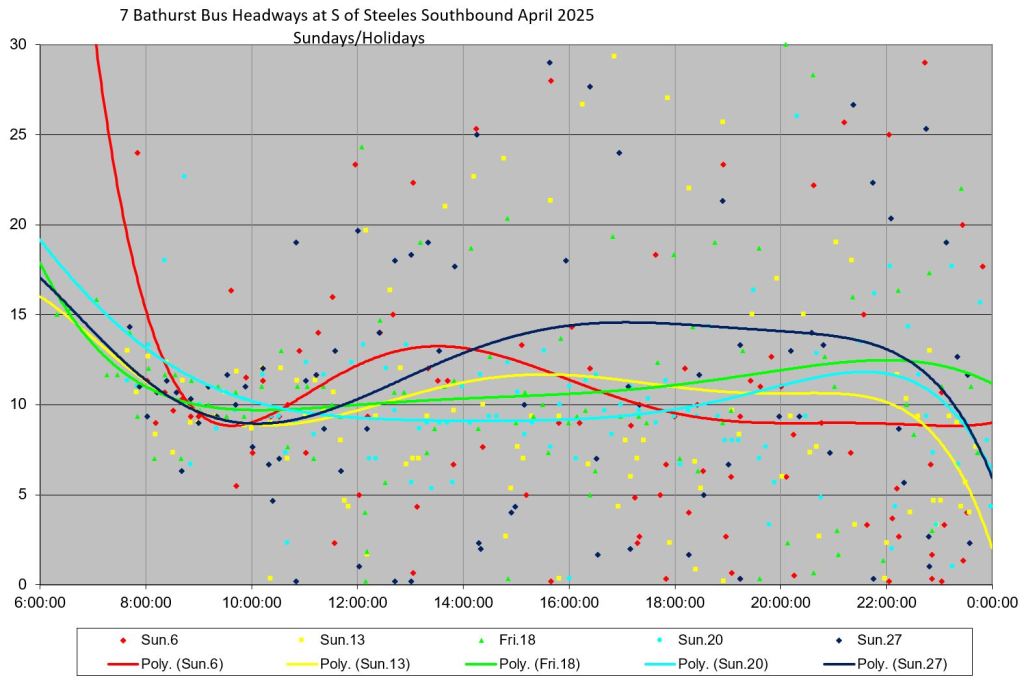
Finally there are five pair of charts showing the details for each week in the month with trend lines tracking the overall patterns of the data. Note that these are not moving averages, but rather best fit lines to show large scale swings in values, if any. (There are a few standouts which I will address individually later in this article. Week 3 has only four days because of Good Friday which is counted as a holiday here.)
These charts show service behaviour at terminals, but as one moves along the route, the situation changes.


Evolution of Headways Enroute
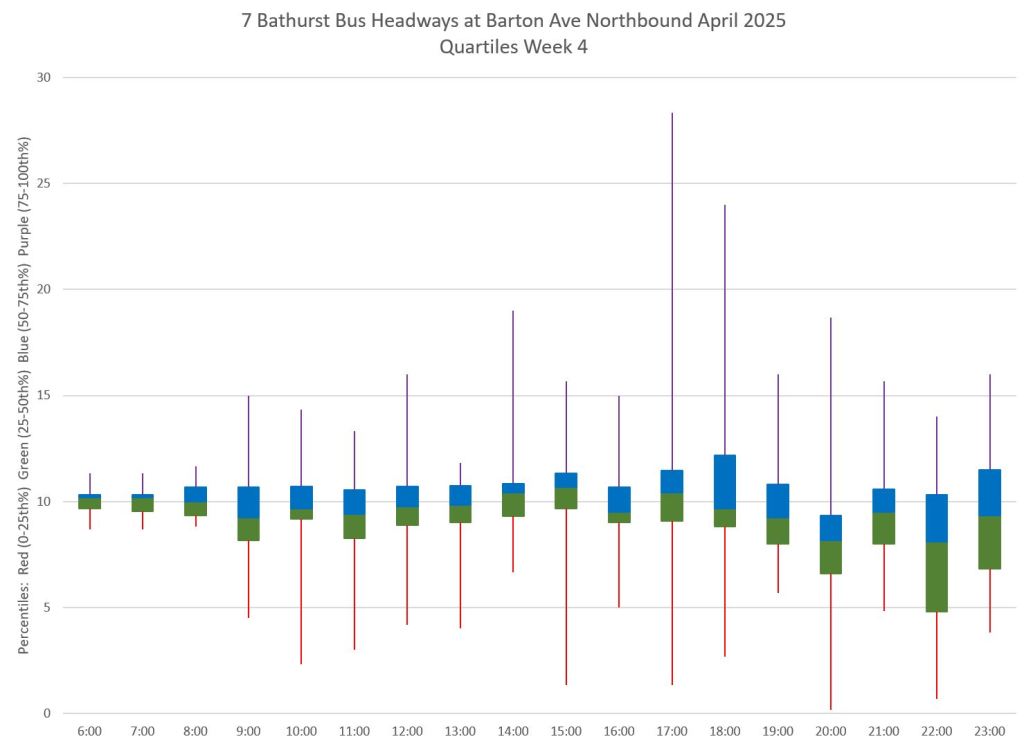
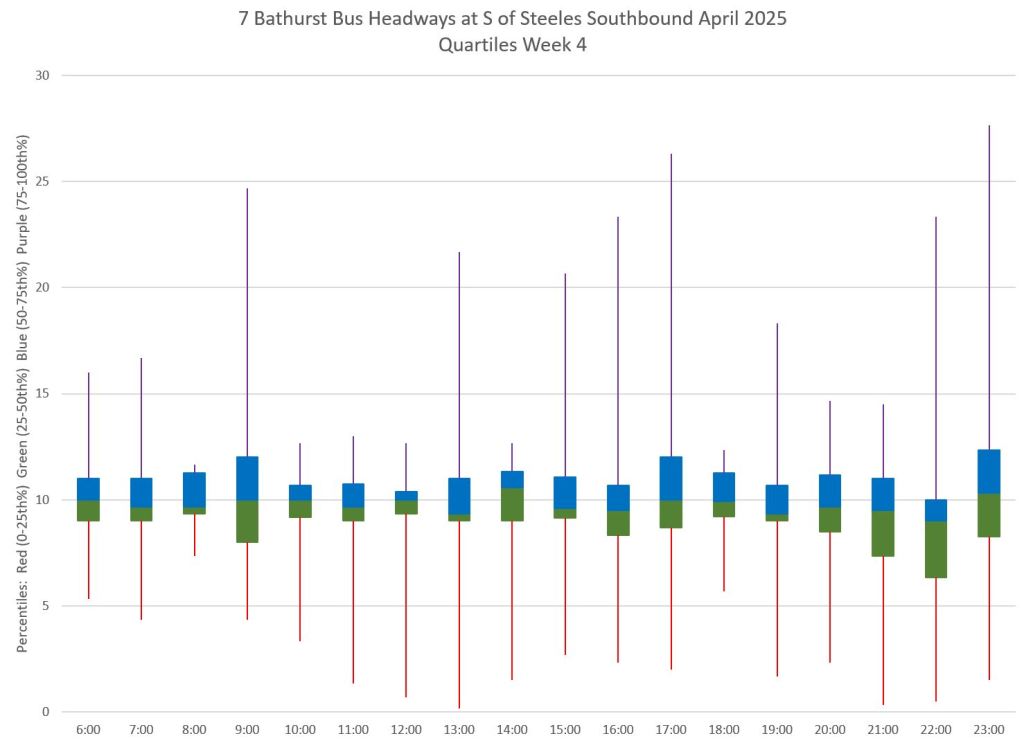
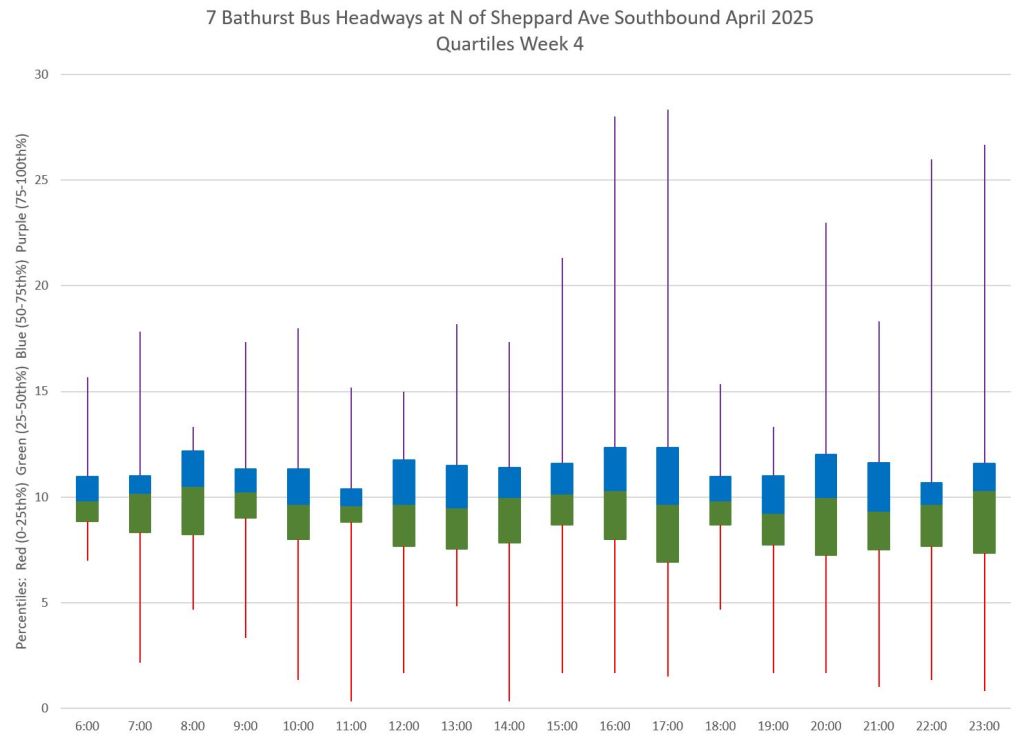
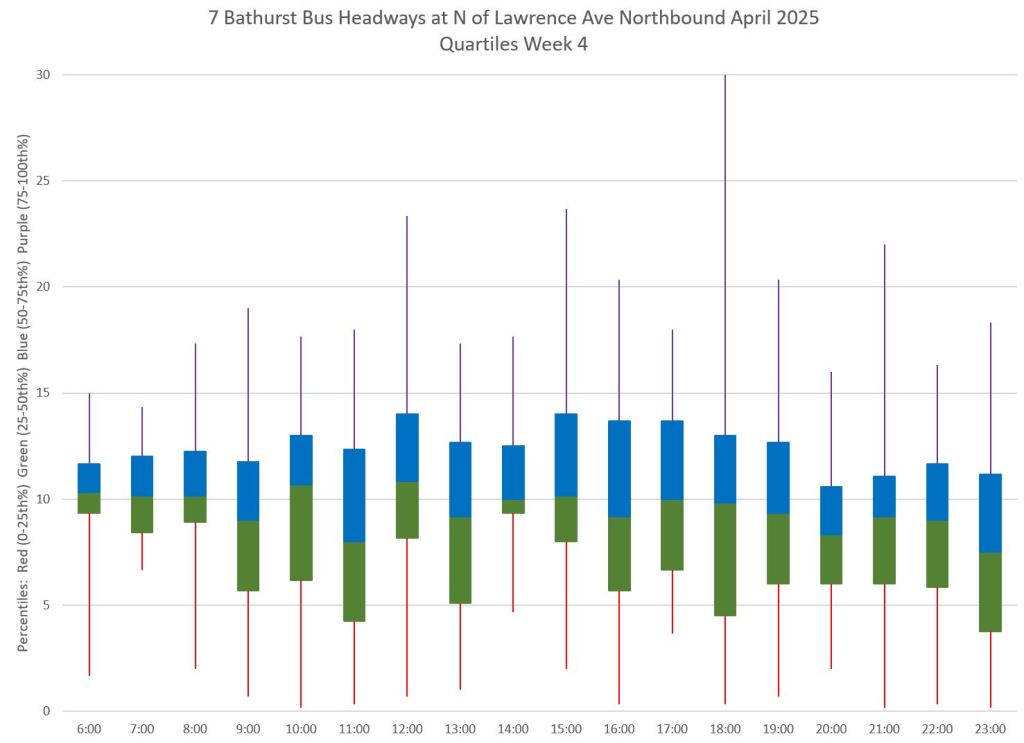
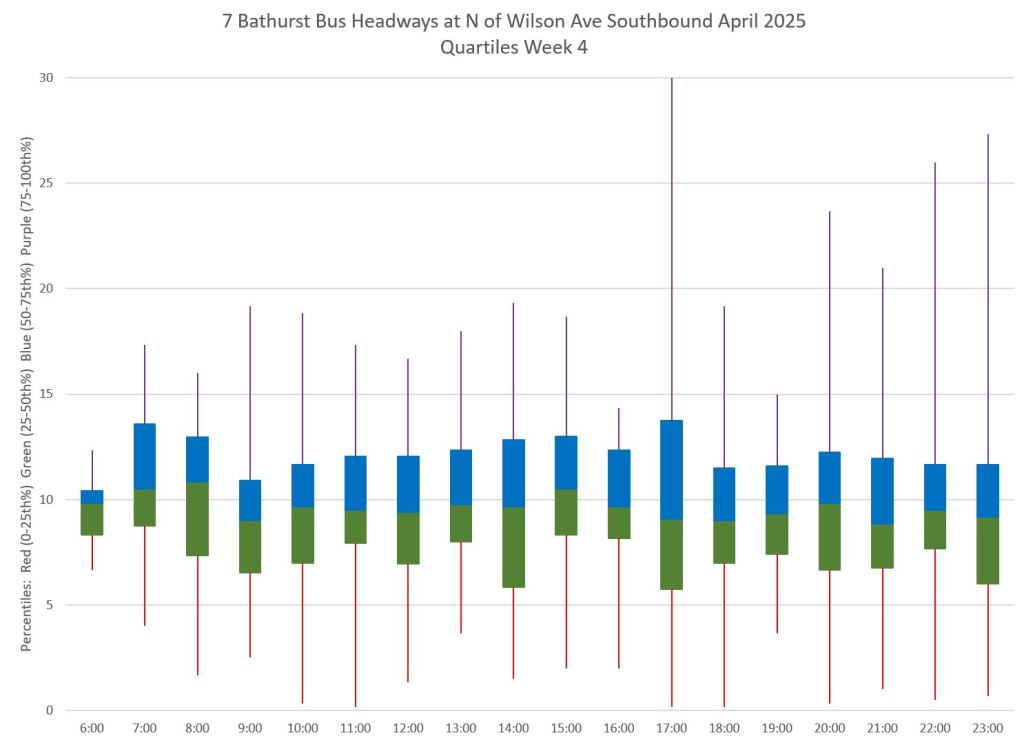
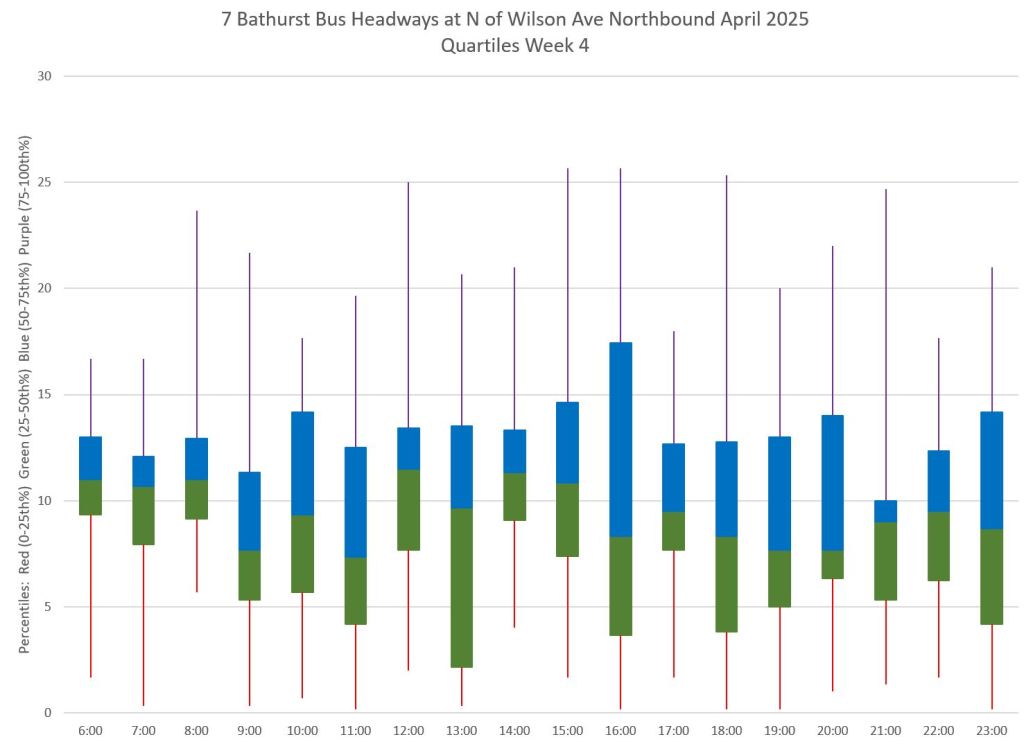
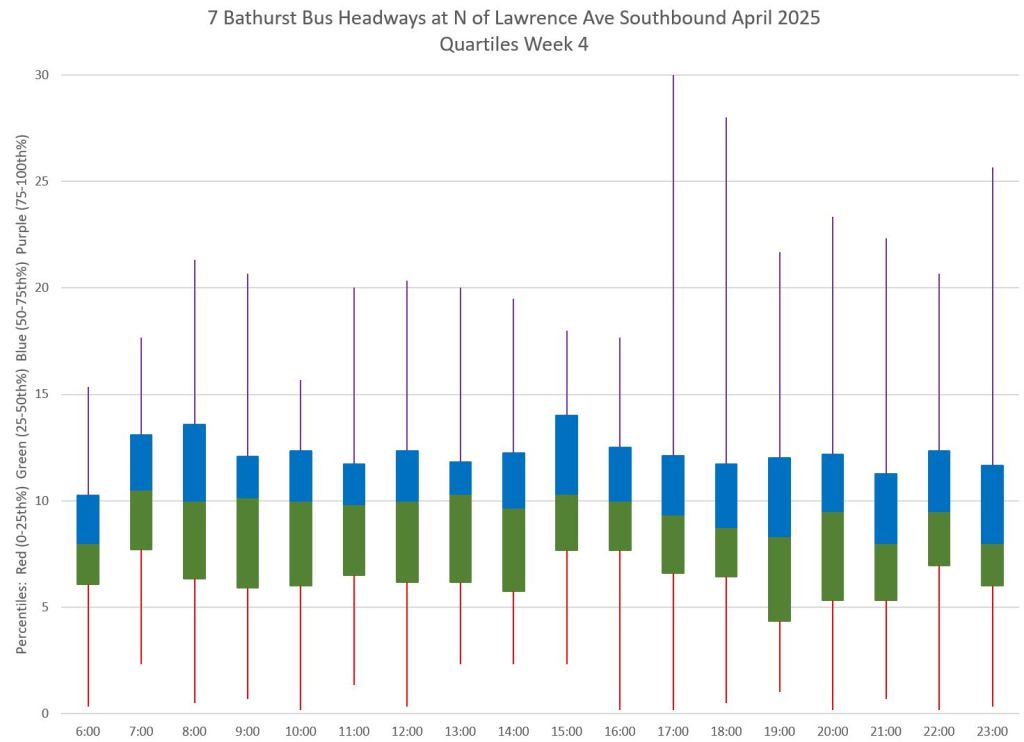
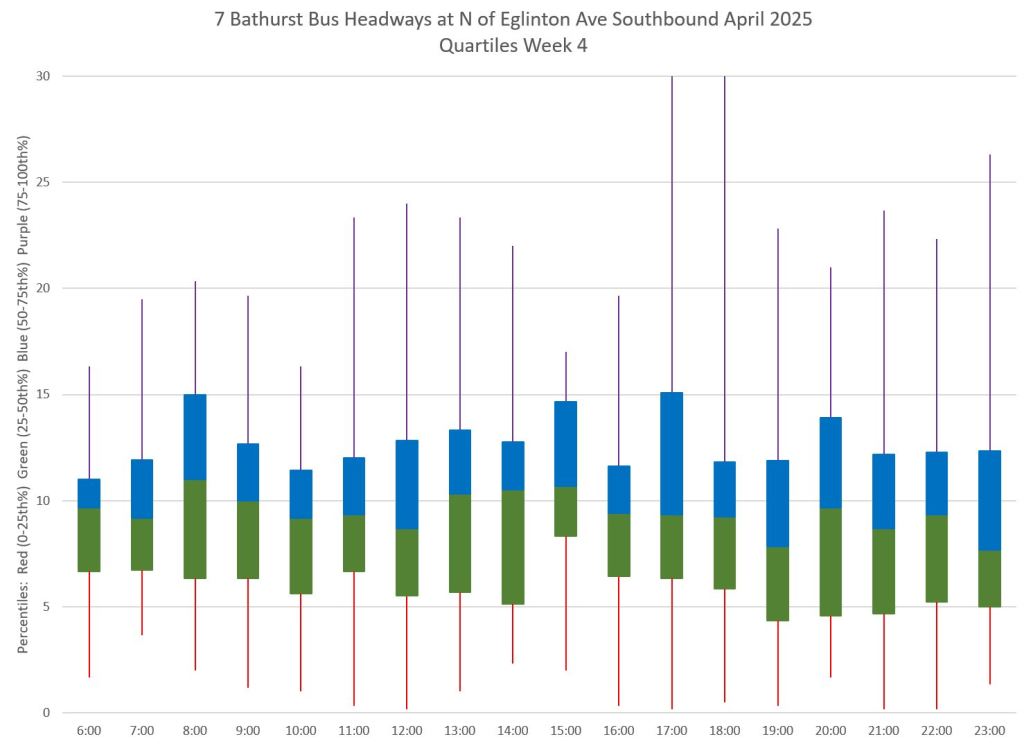
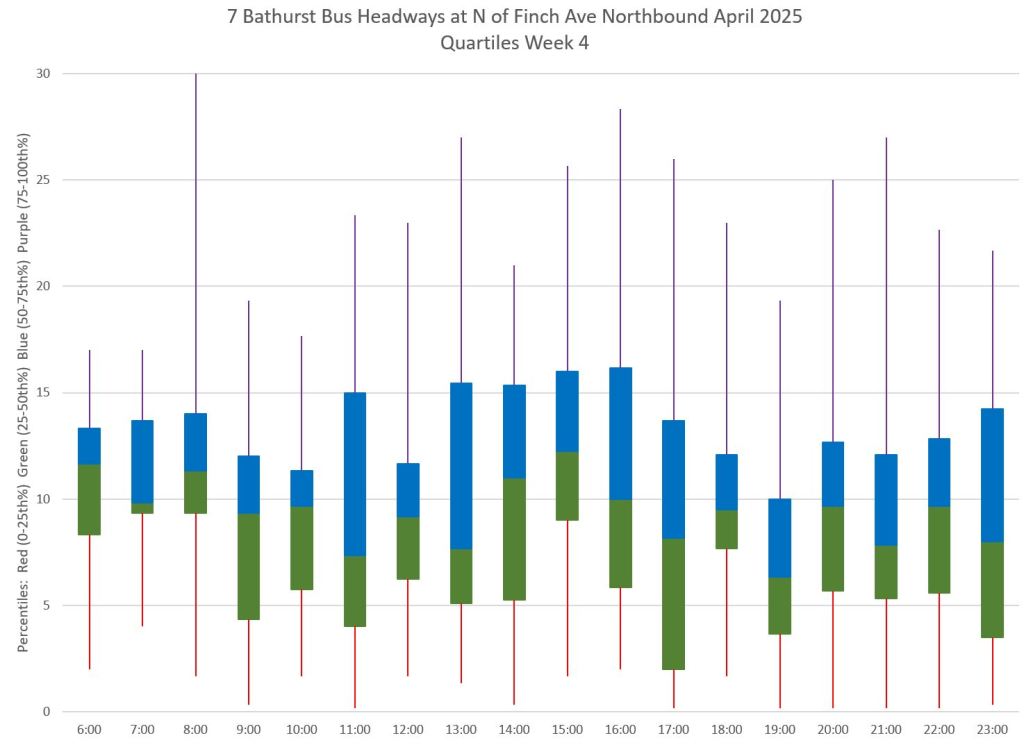
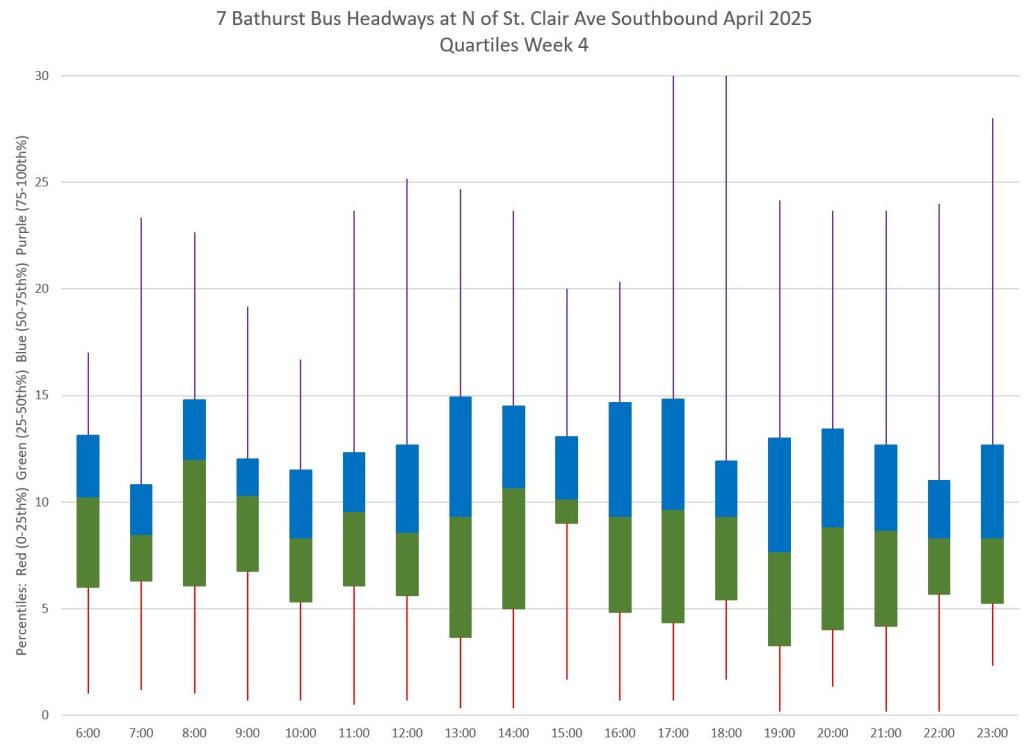
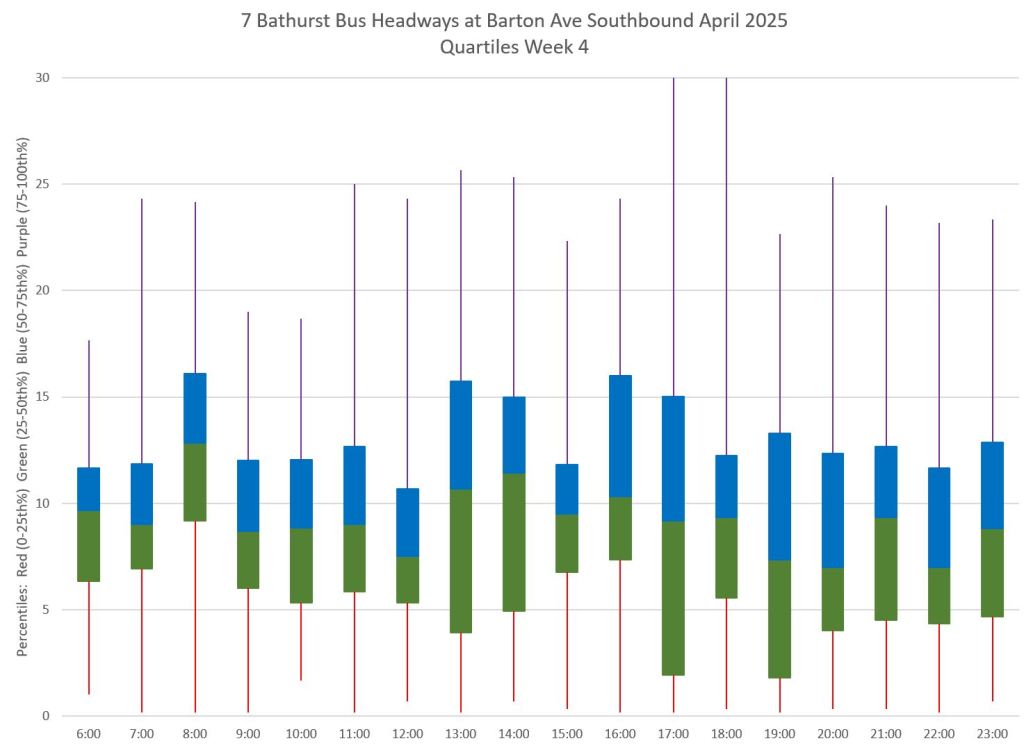
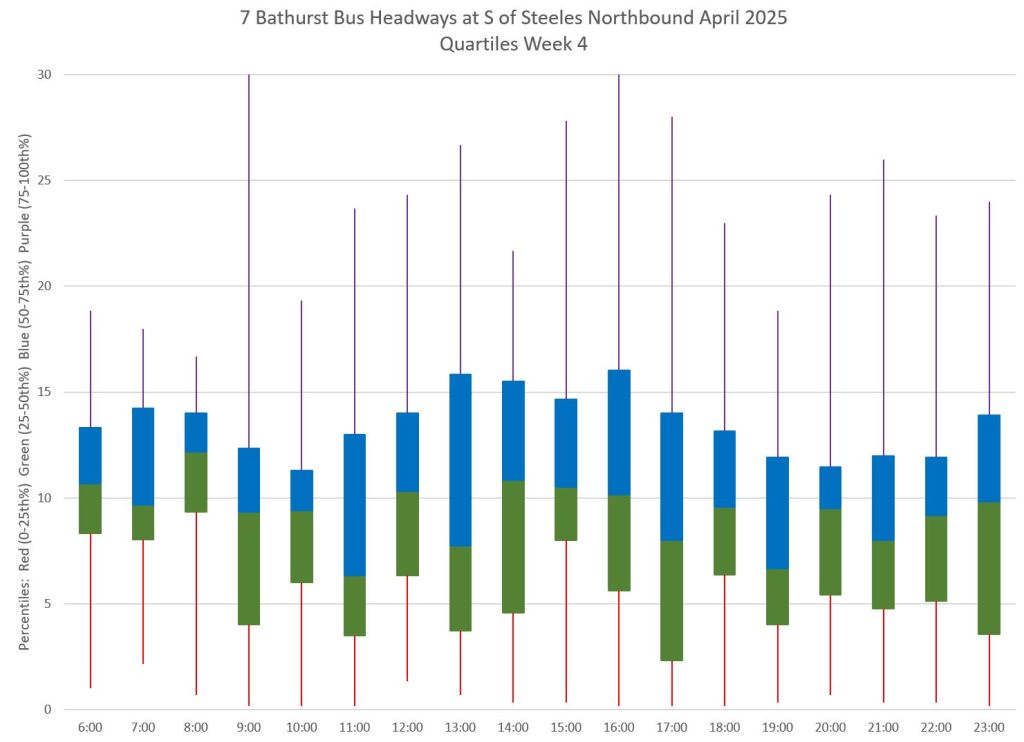
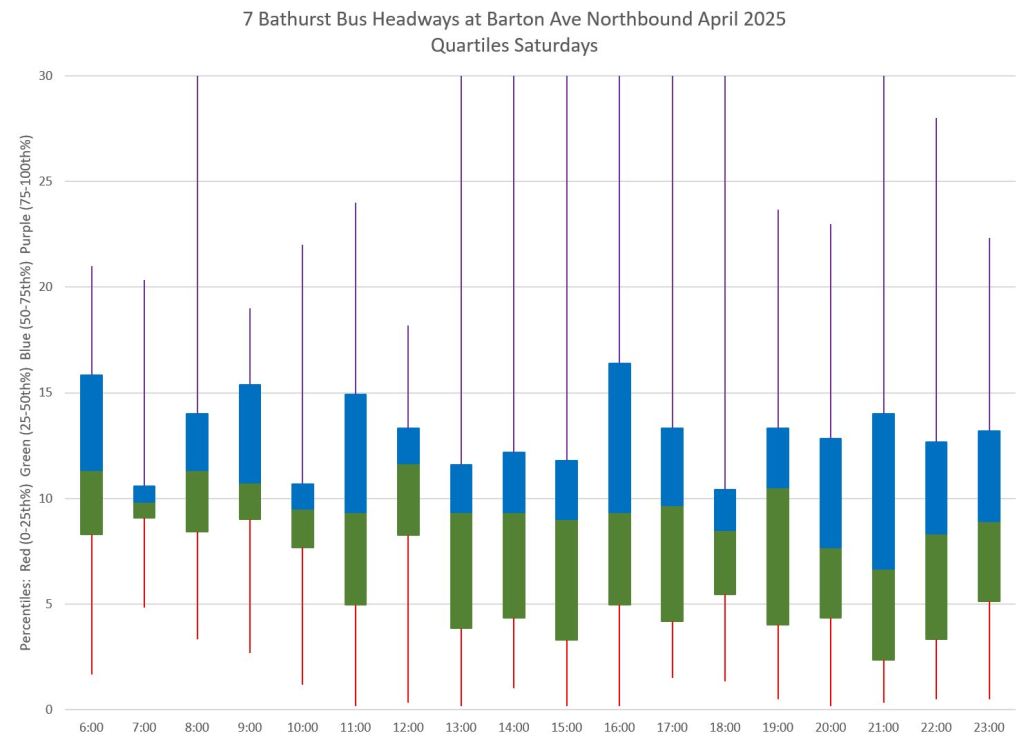
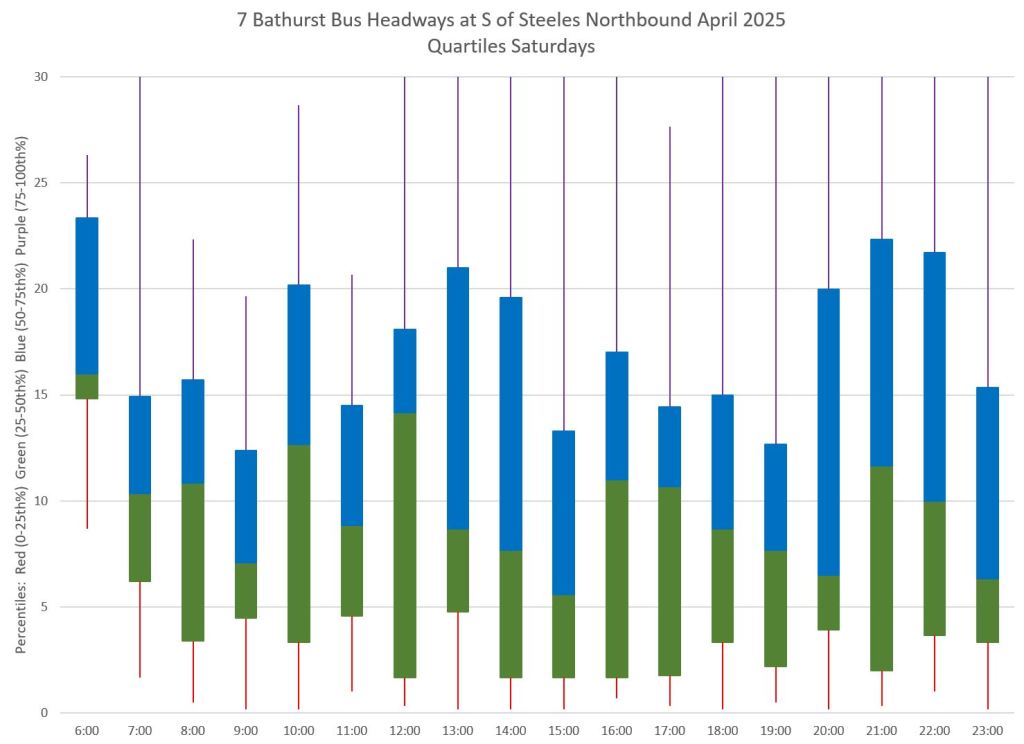
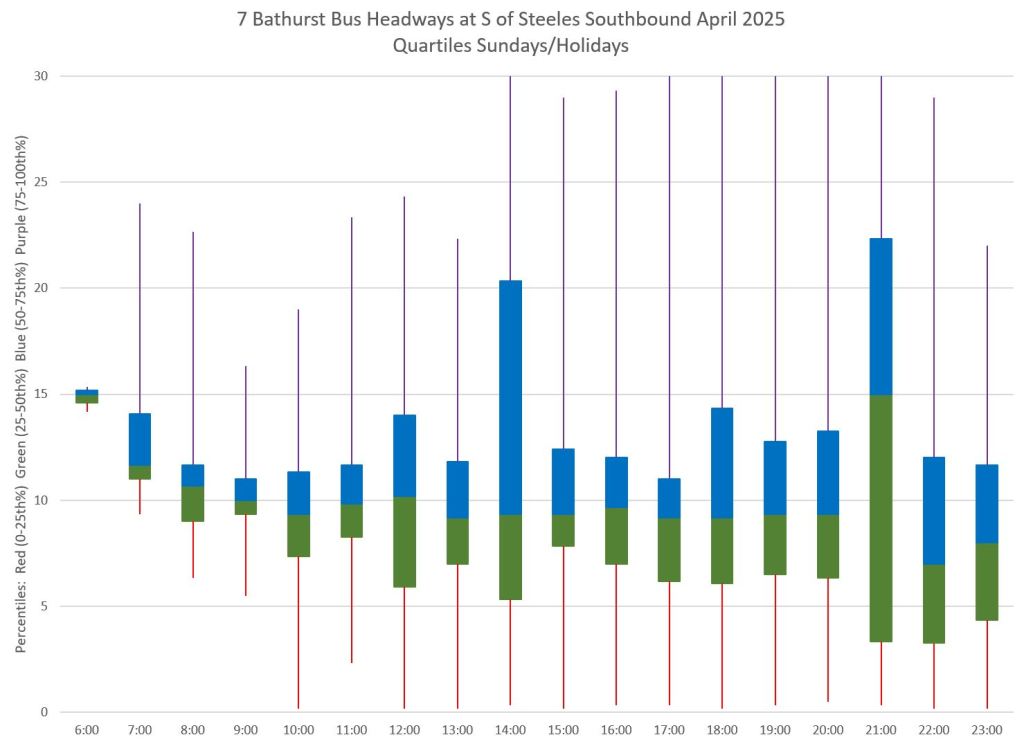
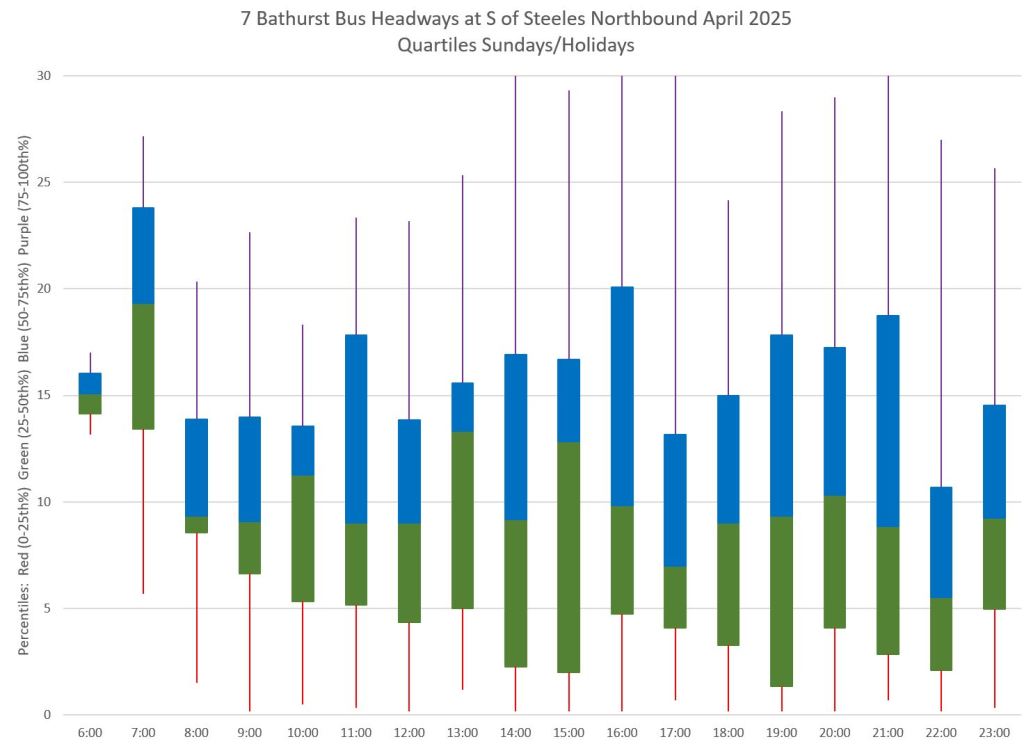
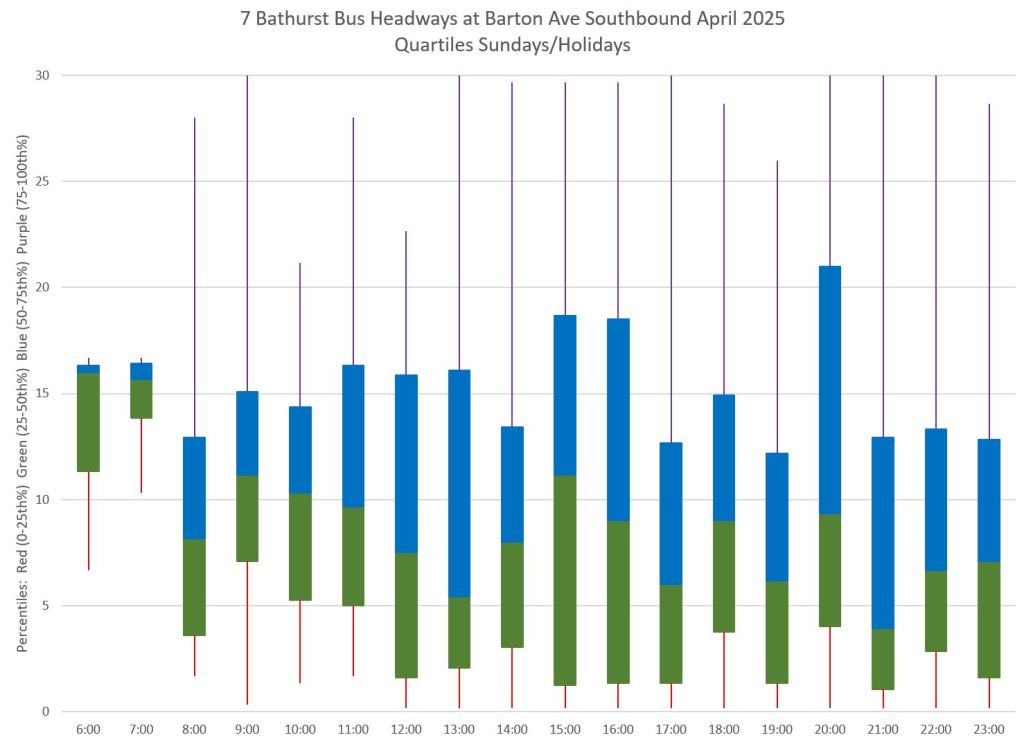
This set of charts shows the distribution of headway values through the month hour-by-hour and at major locations along the route for Week 4 which was chosen as representative. The top row is near the terminals, and corresponds to the Week 4 details shown above.
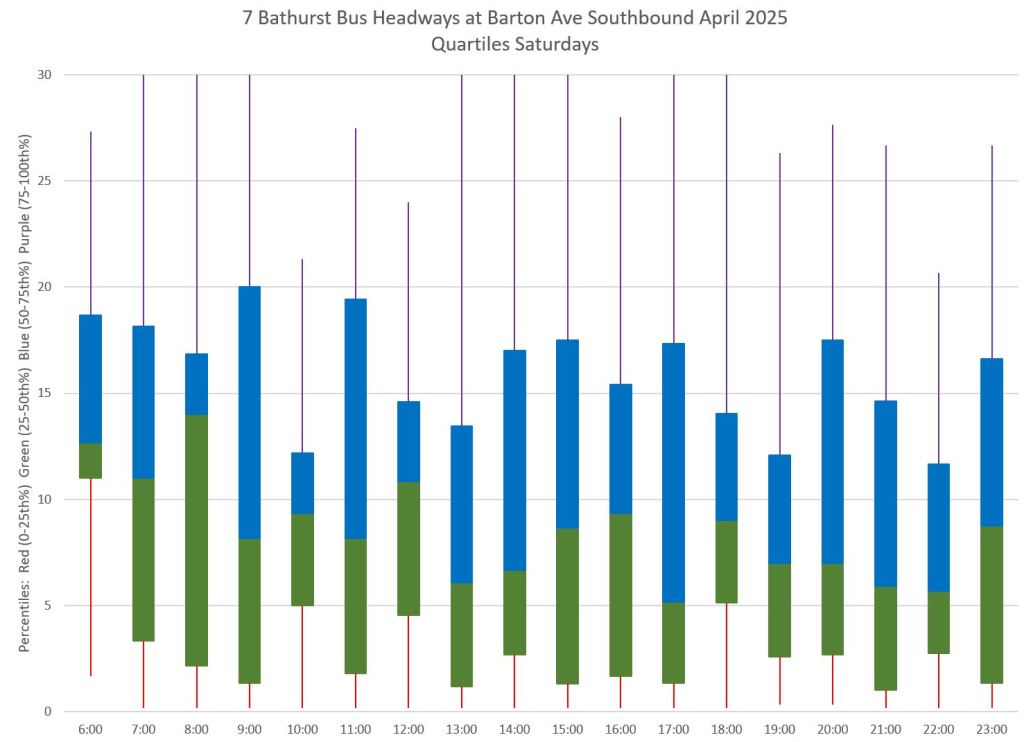
Each hour’s data is summarized by quartiles so that the segments represent one quarter of the headways within each hour. Ideally these should be as compact as possible indicating that most headways lie within a small distance of the median (which in turn tends to sit at 10 minutes, but can be skewed downward by a preponderance of short headways and comparatively few long ones).
- The lower red tail is the quartile holding the shortest headways.
- The green and blue boxes hold the second and third quartiles. Half of the service lies within these boxes, and the median headway value lies at their boundary.
- The upper mauve tail is the quartile holding the longest headways.
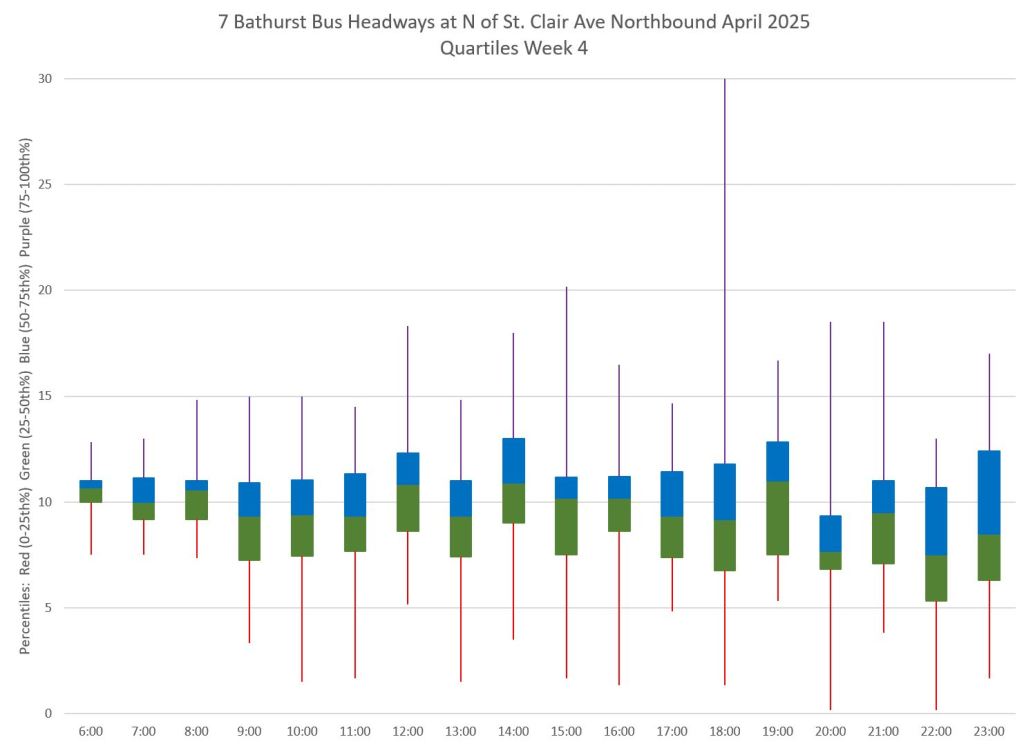
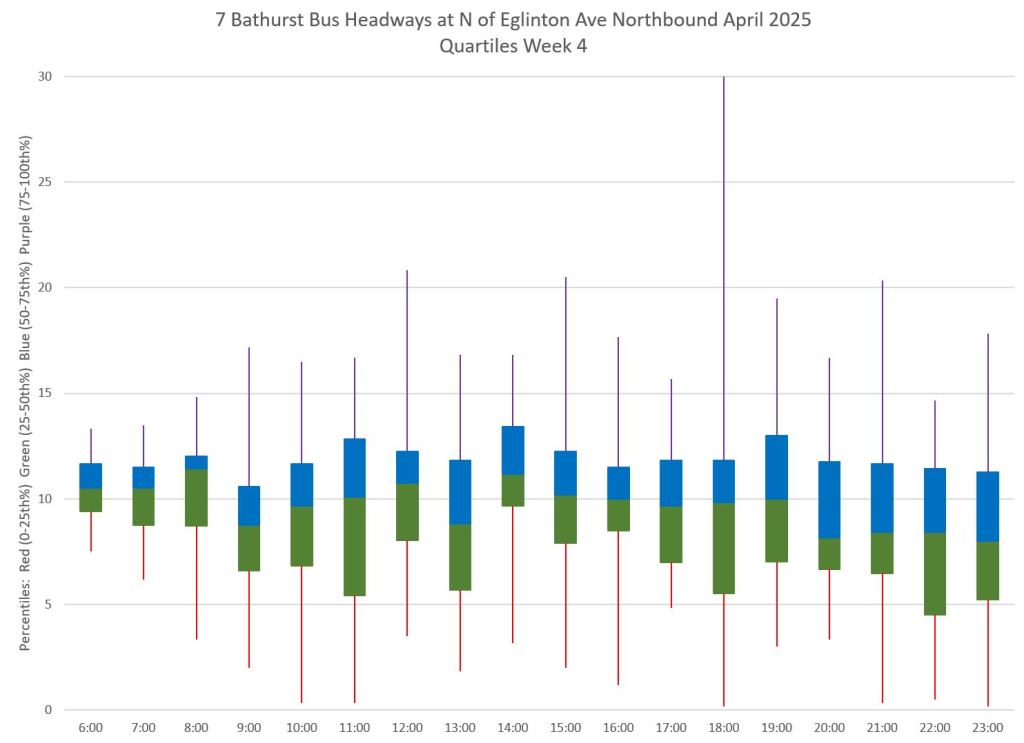
What these charts illustrate is how service that might be only slightly off the target headway can worsen as buses progress along the route. Buses in gaps are more heavily loaded and fall further back, and their followers get ever closer. The result is that the central boxes widen and the tails of very short and very long headways reach further away from the scheduled value.
Mid-route headway control is challenging on two counts. First, riders don’t like sitting while a bus waits for its time, and also there should be somewhere for the vehicle to do this without blocking traffic. This is relatively simple on a route where every vehicle is going to the same place at the same nominal speed, like Bathurst, but not where there are multiple routes and/or express/local branches where an idling bus could interfere with other routes.
That said, the TTC’s reporting of “on time” stats based at terminals hides the way riders at most locations along a route actually experience service.


Saturdays
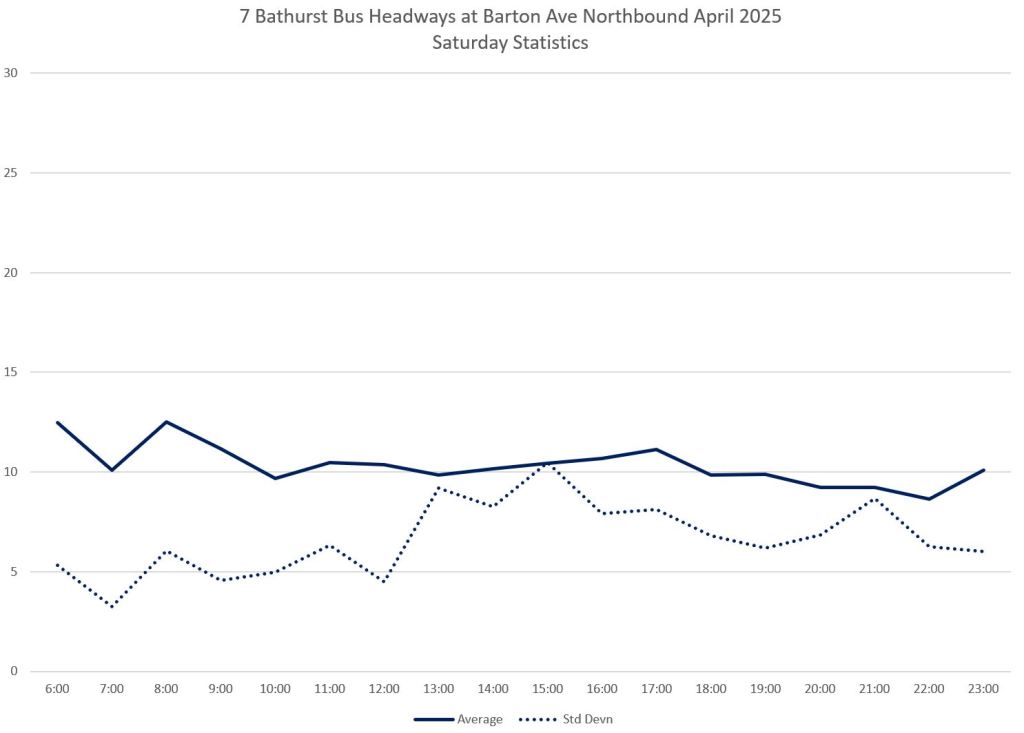
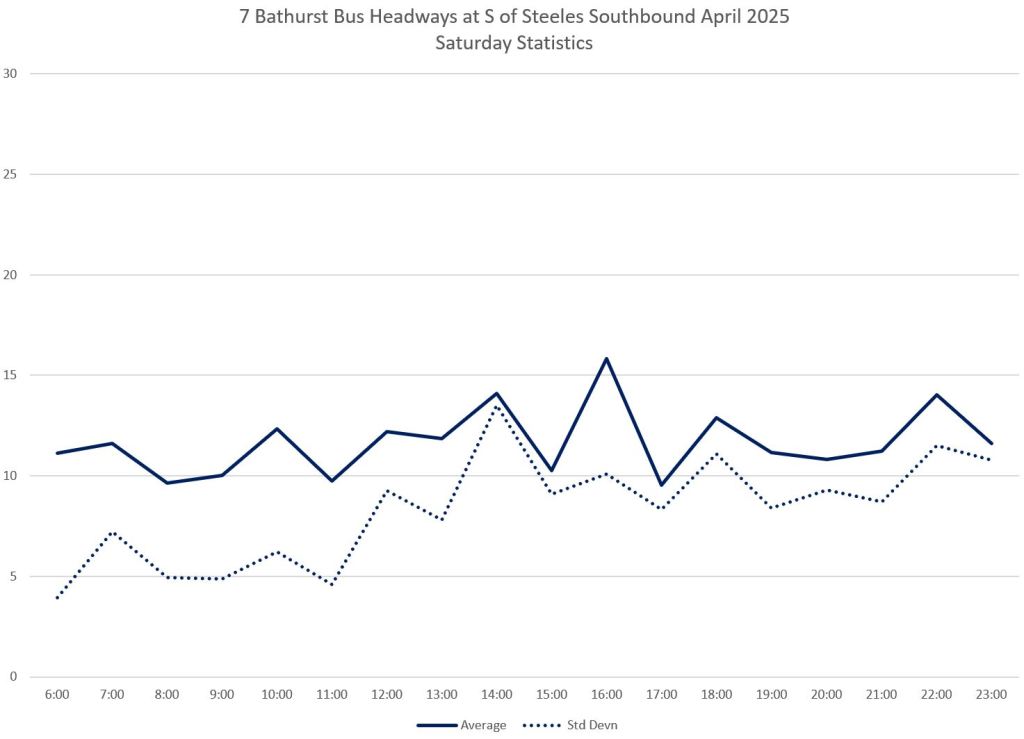
Weekends on Bathurst have far worse service than weekdays, although they have the same scheduled frequency. Average headways do not always sit at 10 minutes, and the standard deviation values are also higher ranging to and beyond ten minutes.
The scatter in data values routinely goes higher than on typical weekdays, and even at terminals the quartile breakdowns show a wide range of headway values. The two sets of quartile charts show how the distribution of headways leaving terminals stretches out as service travels the length of the route.
Note that short red first quartile tails are not a good thing when they reach down to zero. One quarter of the service is operating at headways of only a few minutes by the time buses reach the end of the line, and a substantial chunk of the second quartile also lies well below the target headway.
Details of some weekend days are shown in a separate section later in the article.

Sundays & Holidays
Sundays and holidays are similar to Saturdays but with only a slightly less dispersed set of headway values.

Days With Unusual Data Patterns
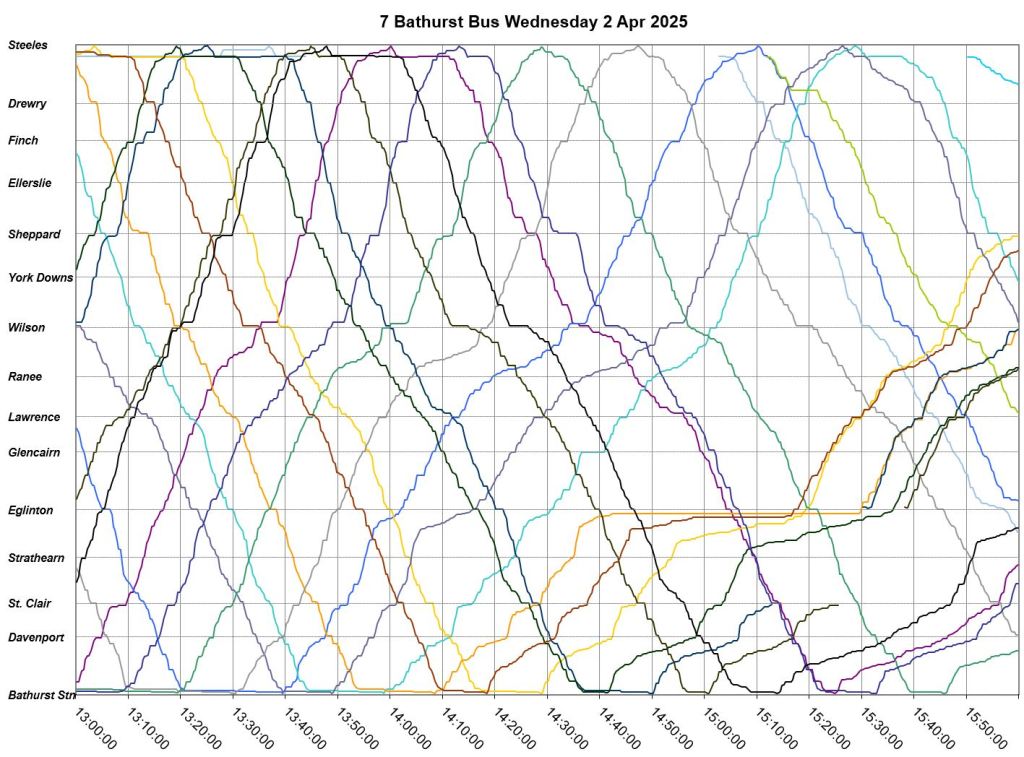
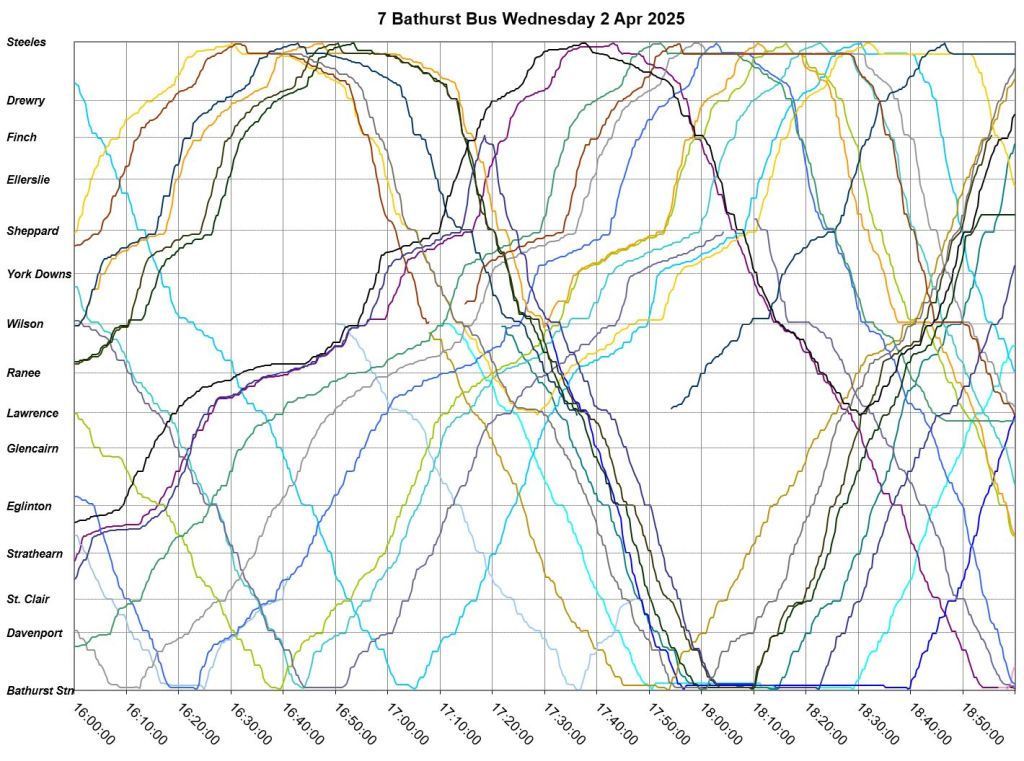
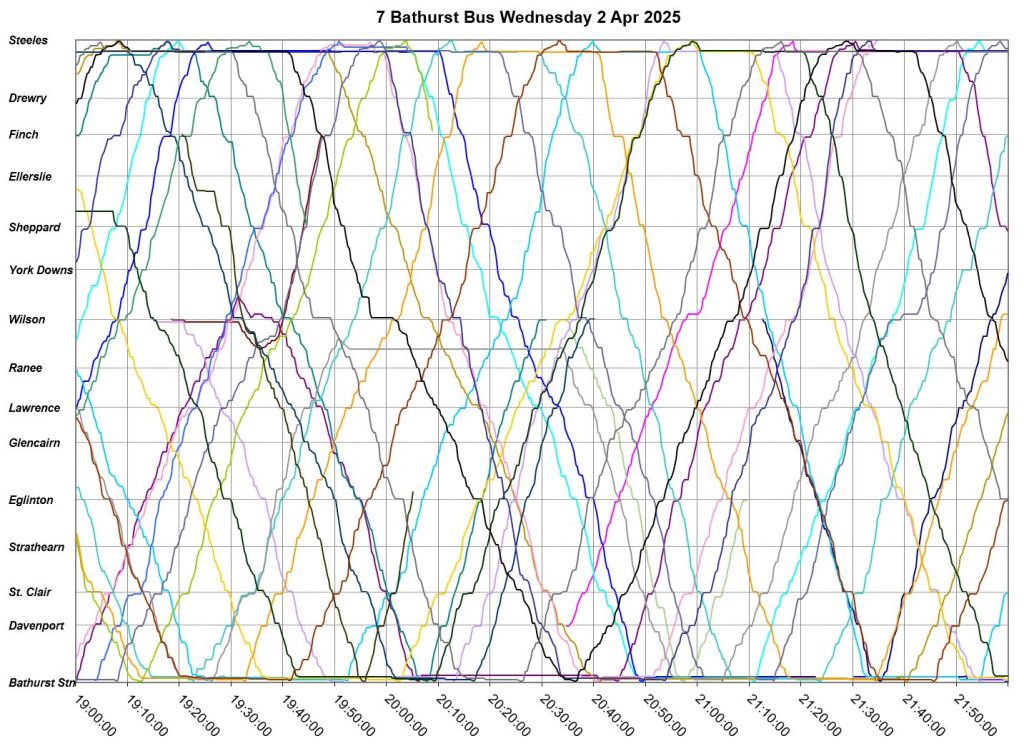
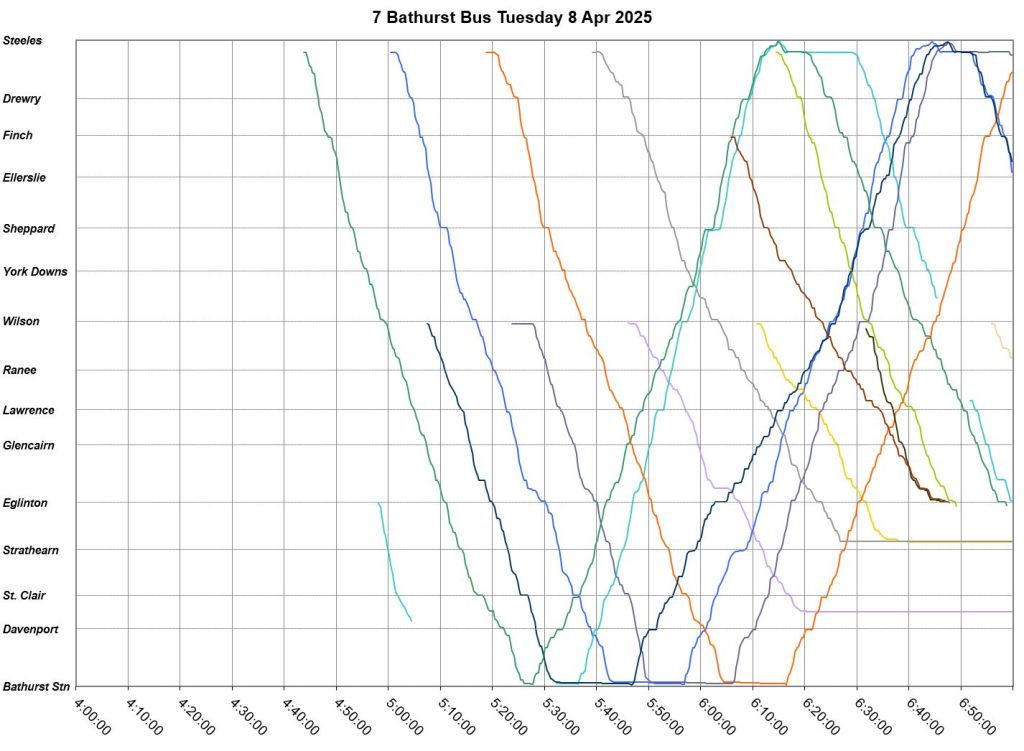
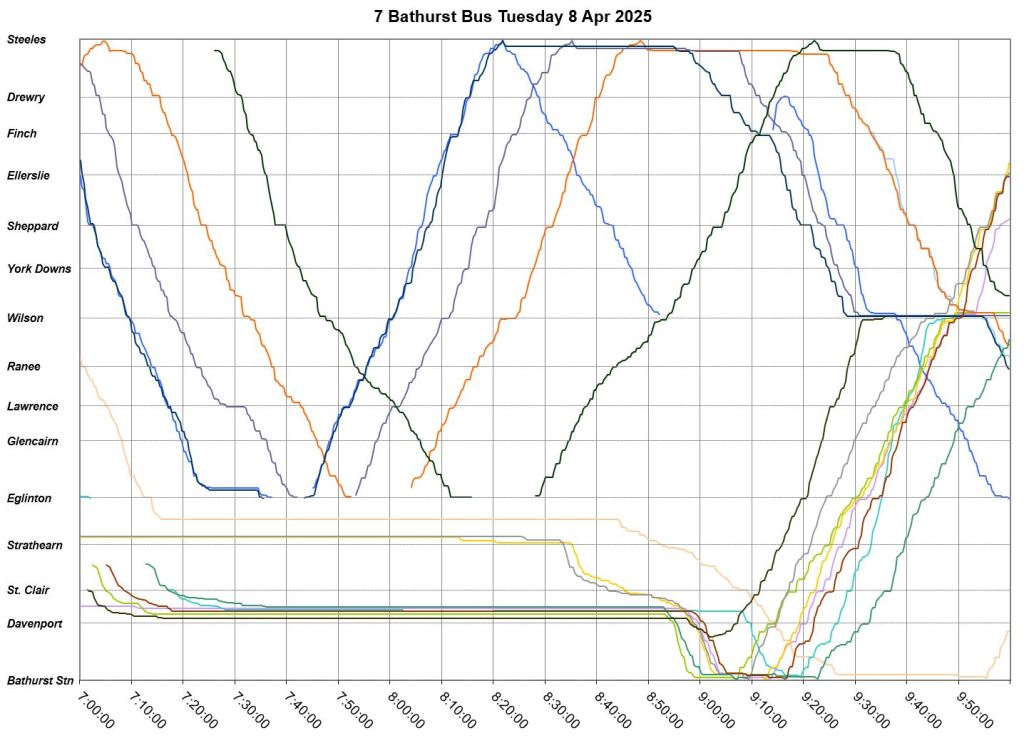
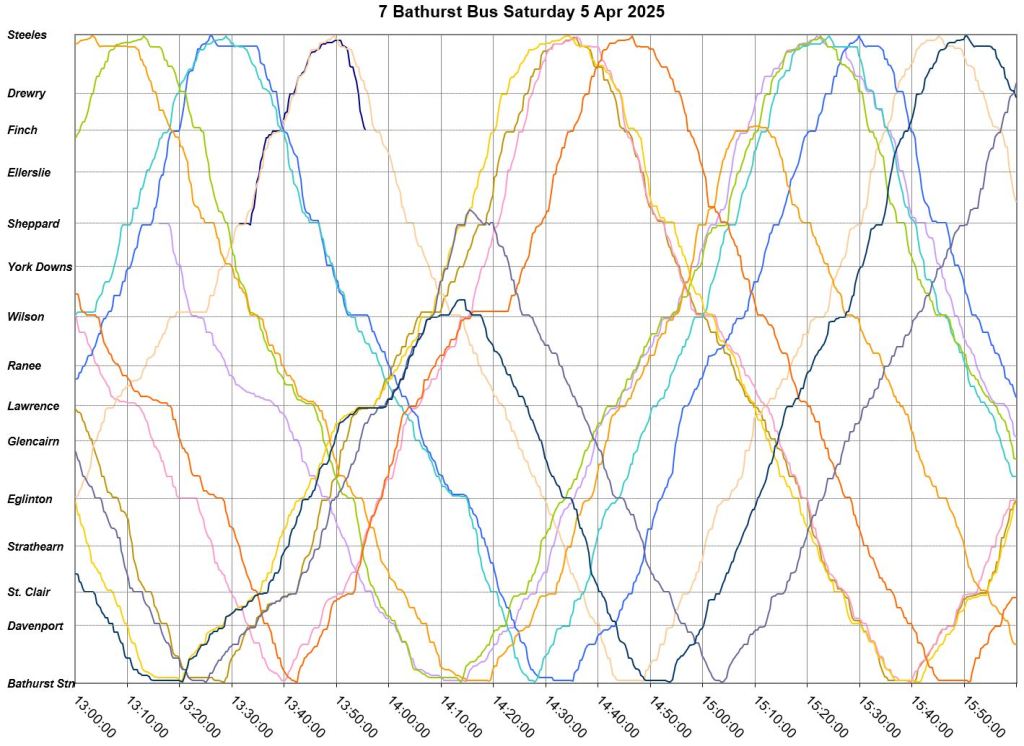
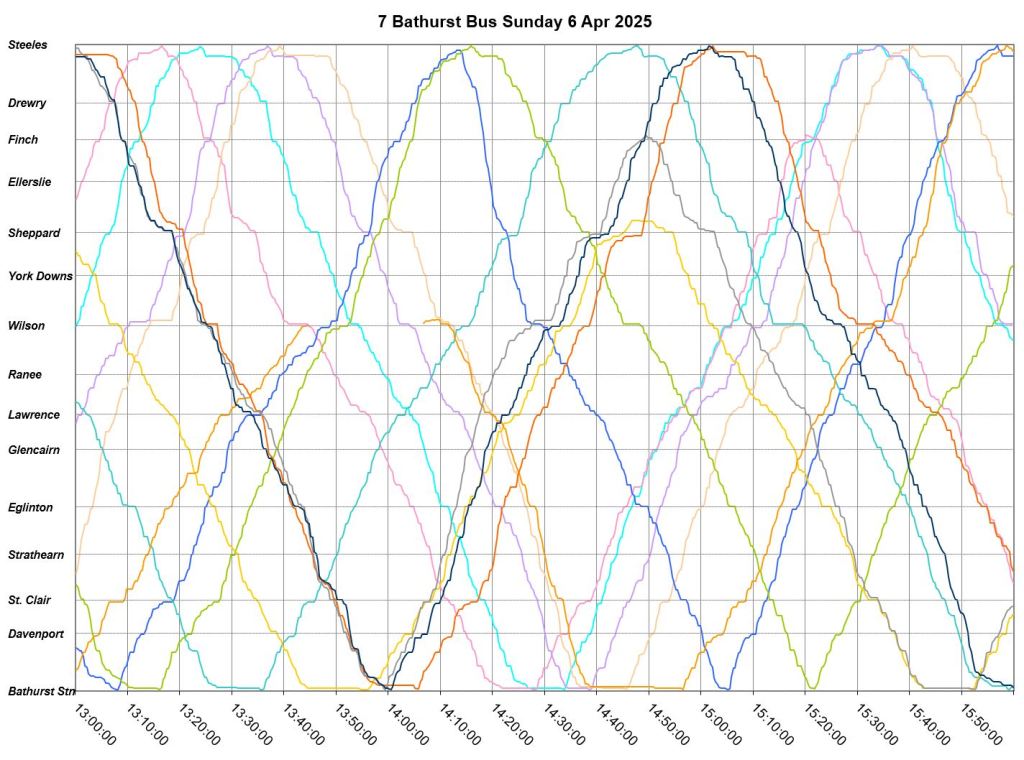
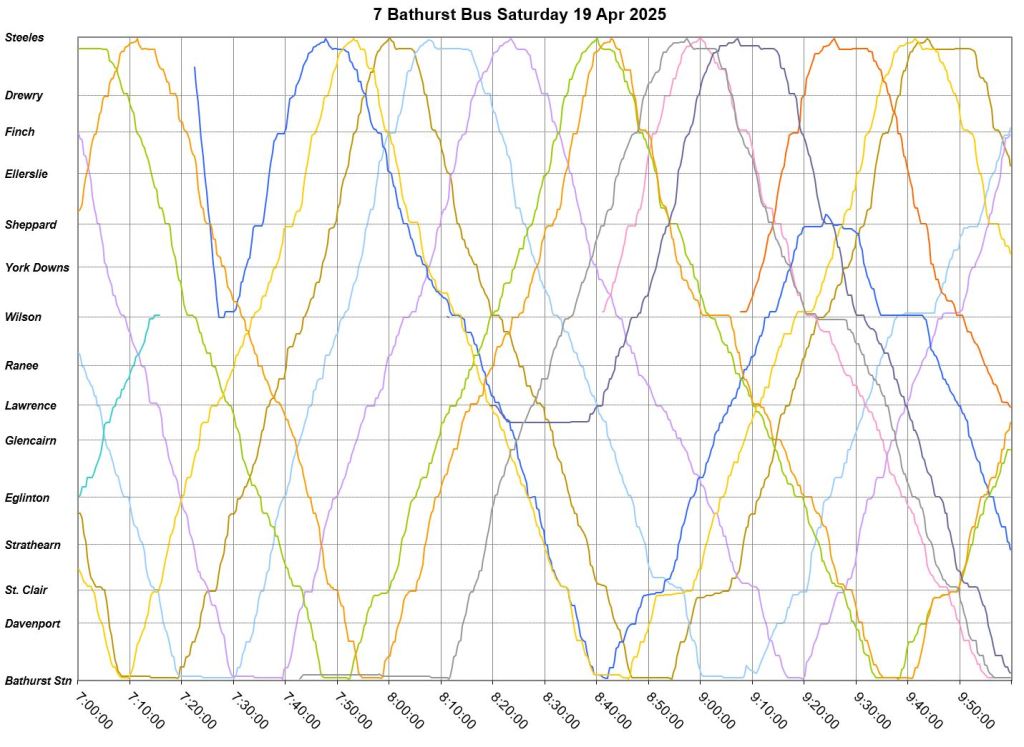
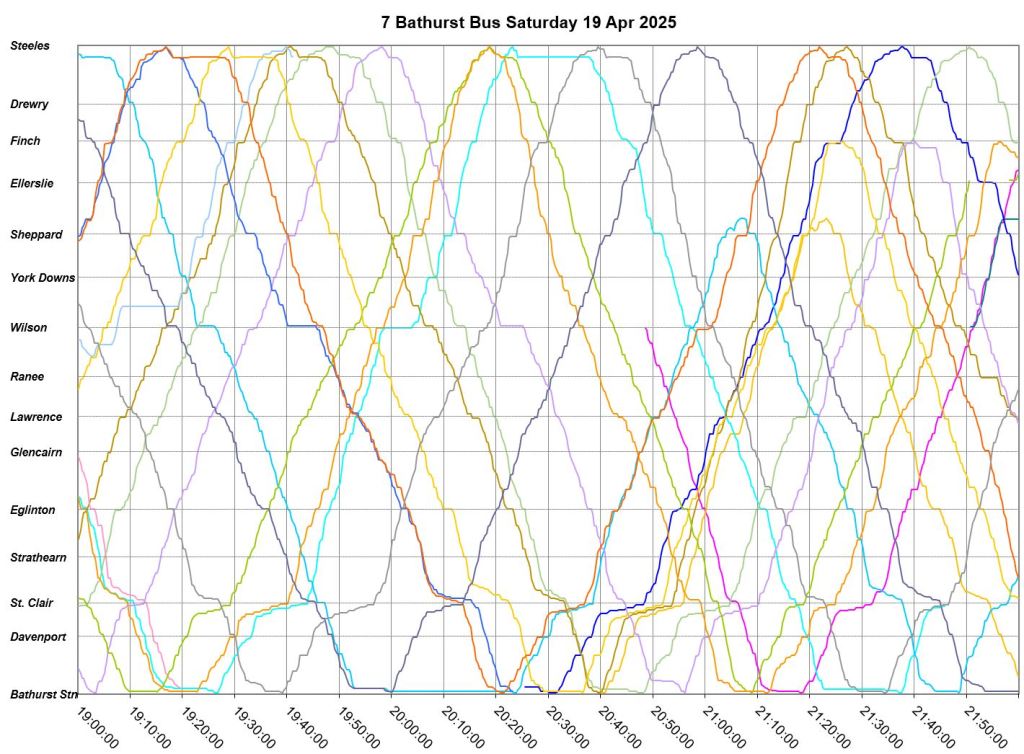
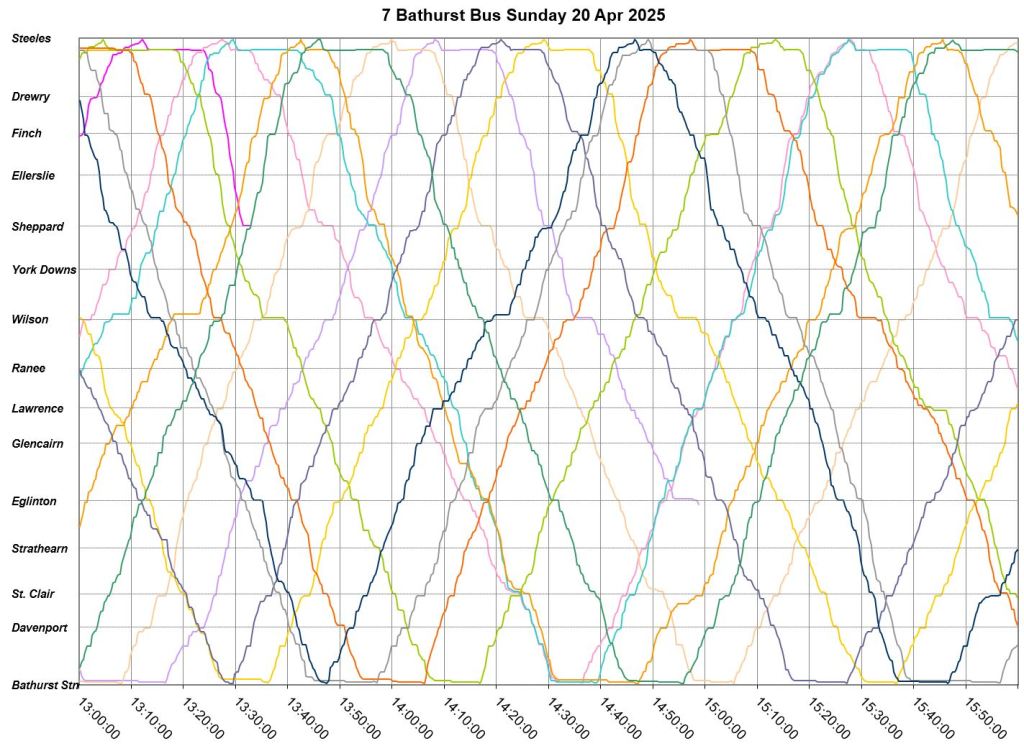
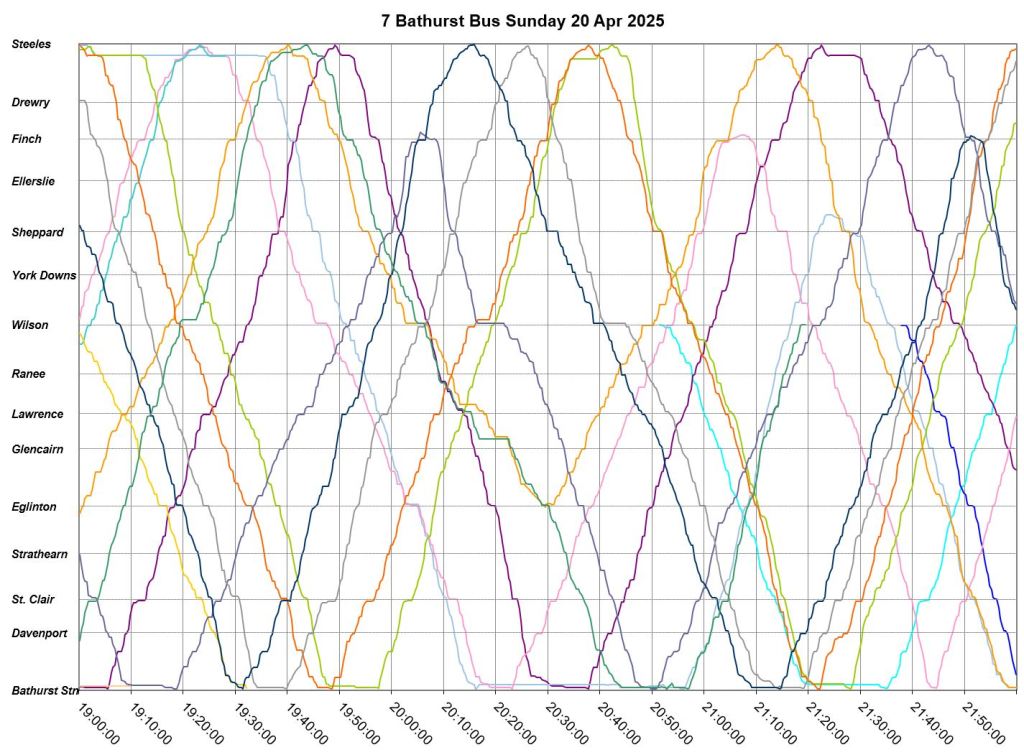
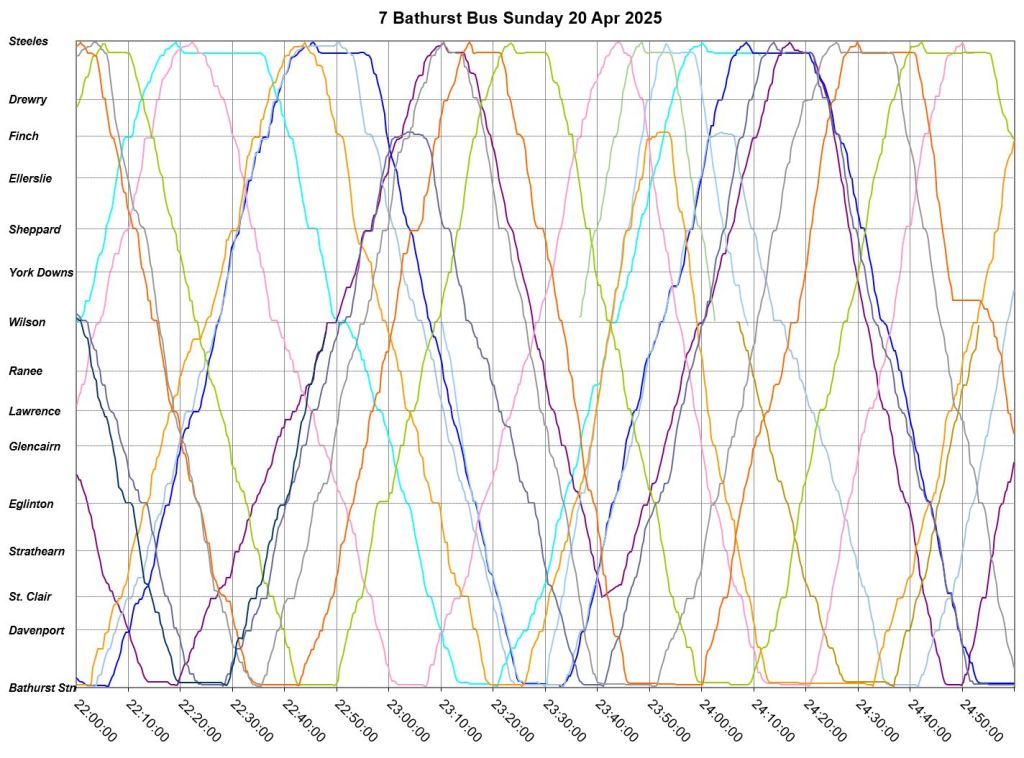
The charts below show the movement of buses back and forth from Bloor (at the bottom) and Steeles (at the top). Time runs left to right. Each line represents one bus. The horizontal lines mark major intersections, and their spacing is proportionate to the distance along the route.
Where the slope of a line is fairly consistent, the bus is moving at a consistent speed. If the line is more horizontal, then the bus has slowed, and areas of congestion are obvious because several buses show similar effects in a group. Where a line is horizontal, the bus is stopped.
Each group of charts can be opened as a gallery and readers can page back and forth from page to page.
Wednesday April 2, 2025
There was major delay at Eglinton at about 2:30pm that was reported in eAlerts as a “blocked road” with no further details. The gap travelled north to Steeles and echoed back south to Bloor. Regular service was restored northbound from Bloor around 6pm. A few buses were diverted enroute northbound but most of the delayed service ran through to Steeles.
Thursday April 3, 2025
There is a gap in TTC’s archival data between 4:30 and 6:10pm.
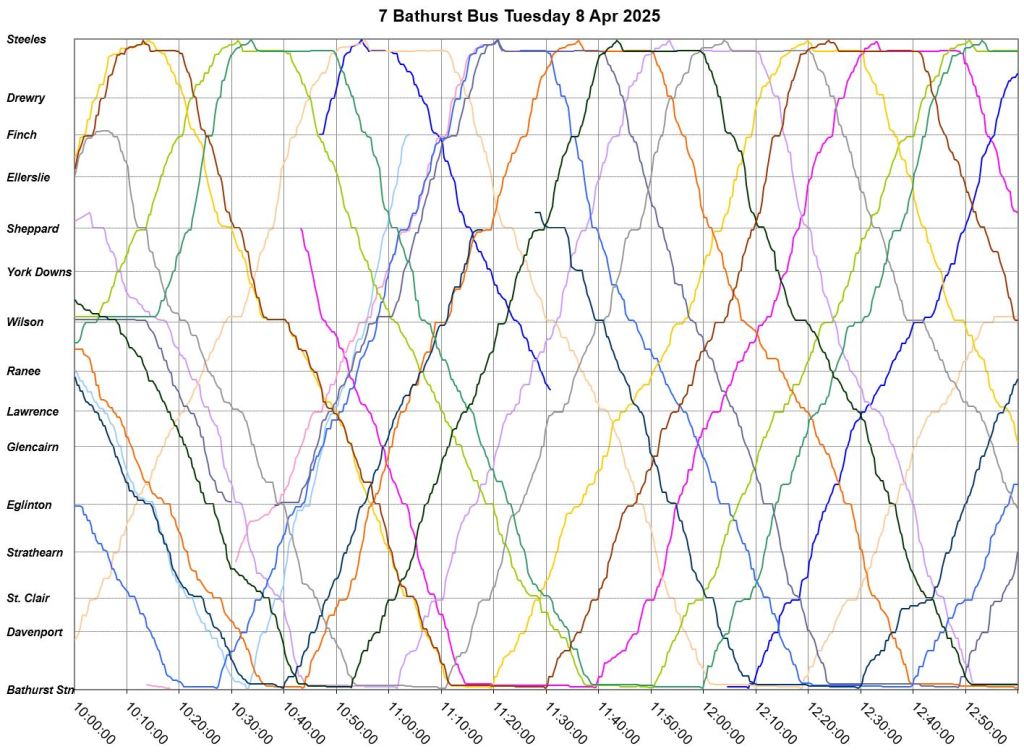
Tuesday April 8, 2025
Service on the Davenport hill was infeasible due to overnight snow. Buses were rerouted and streetcar service on 511 Bathurst was extended north to St. Clair. Normal service resumed after 11am.
Weekends
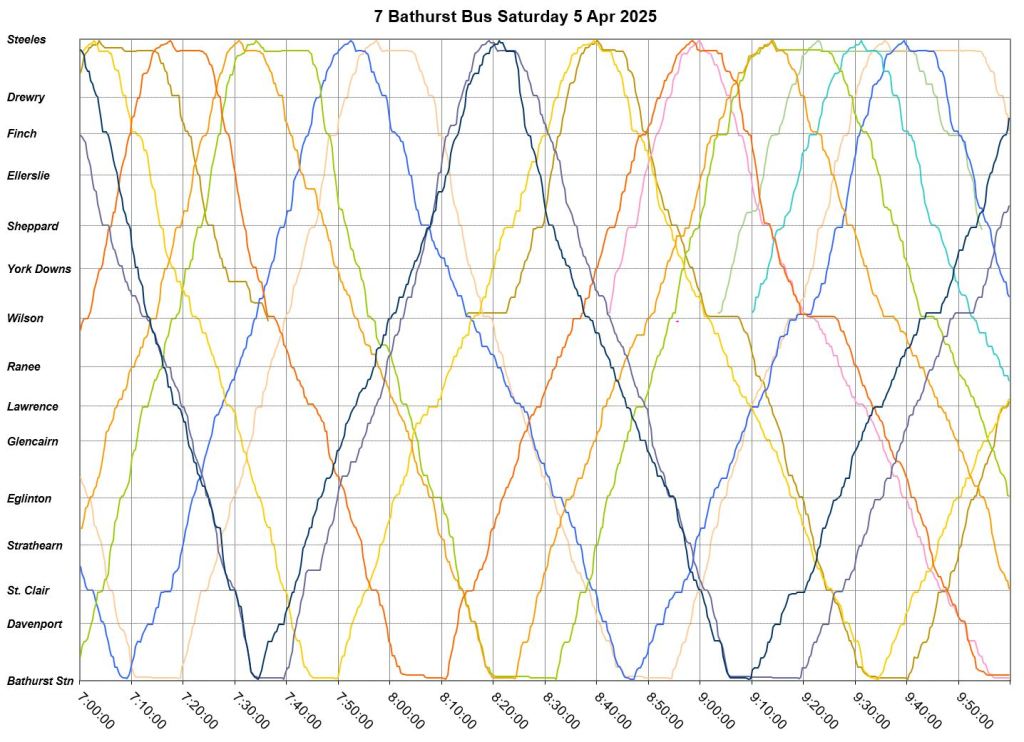
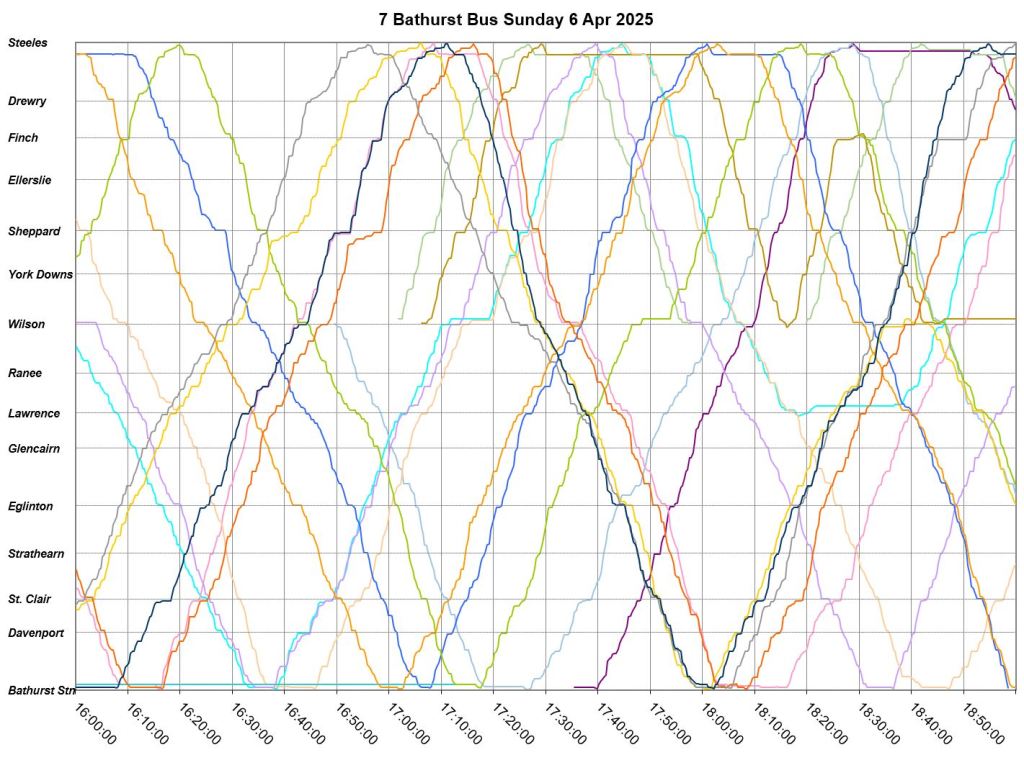
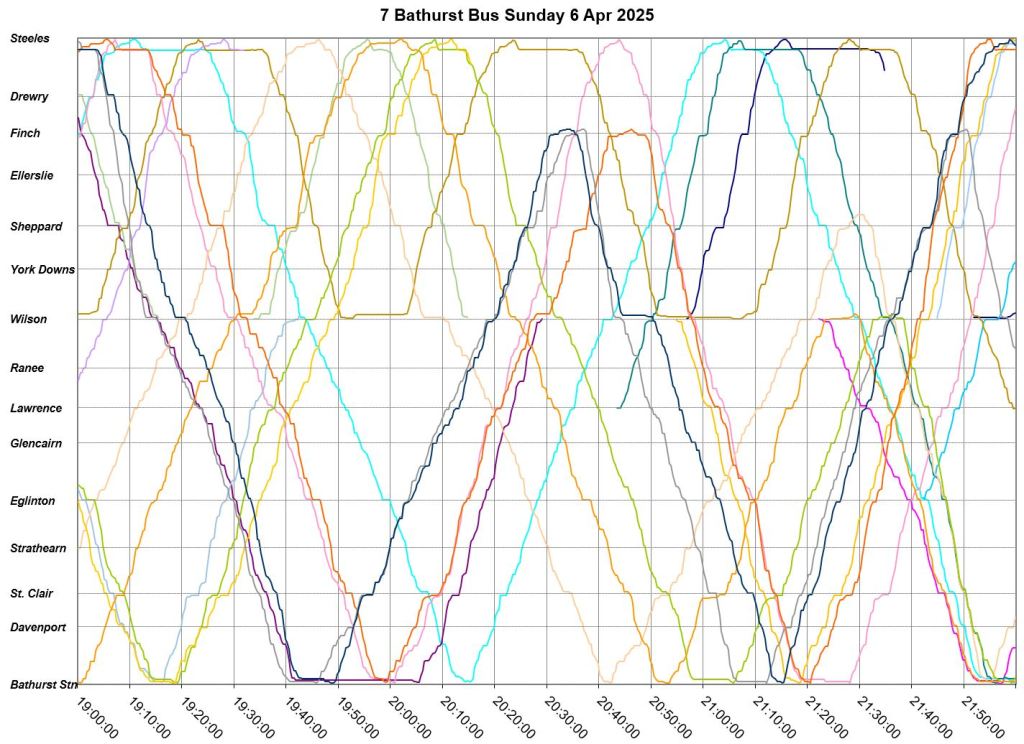
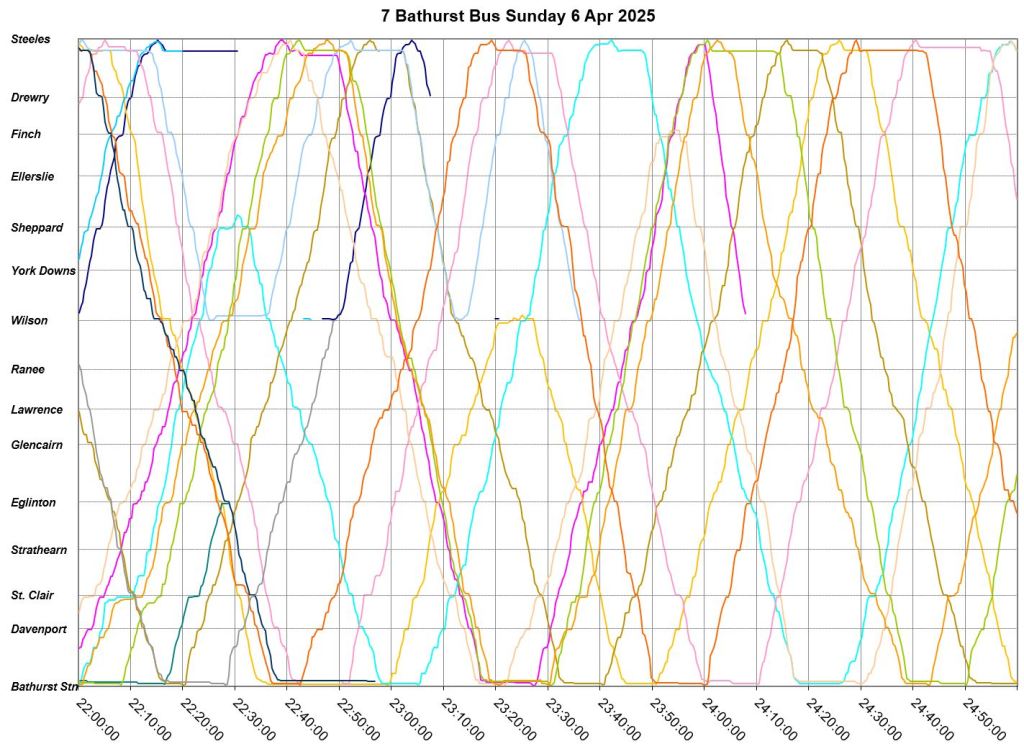
In the charts above note that there are horizontal sections of each vehicle trace at Bloor and at Steeles. This shows that the schedules provided enough time for a layover at both terminals, and there was little need for short turns. The weekend data are much different, and very short terminal times coupled with many short turns are obvious in the charts. This is an example of the need for more generous schedules so that operators get a break on each trip.
That does not eliminate the need for service monitors to ensure even vehicle spacing, but does remove a major factor in the erratic weekend service.
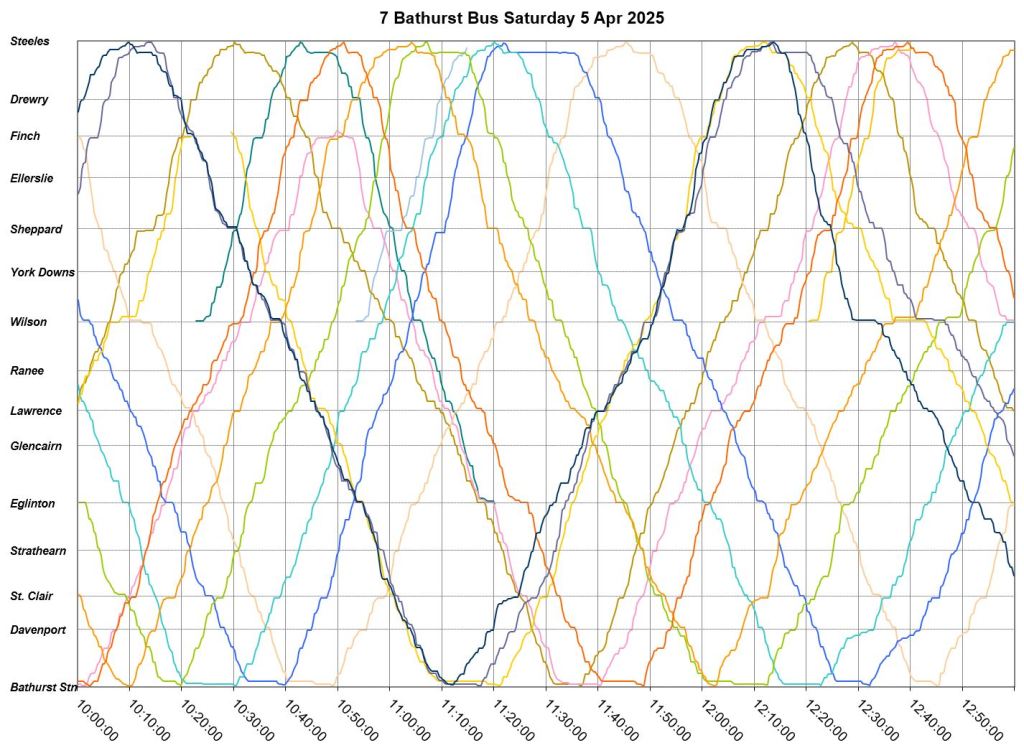
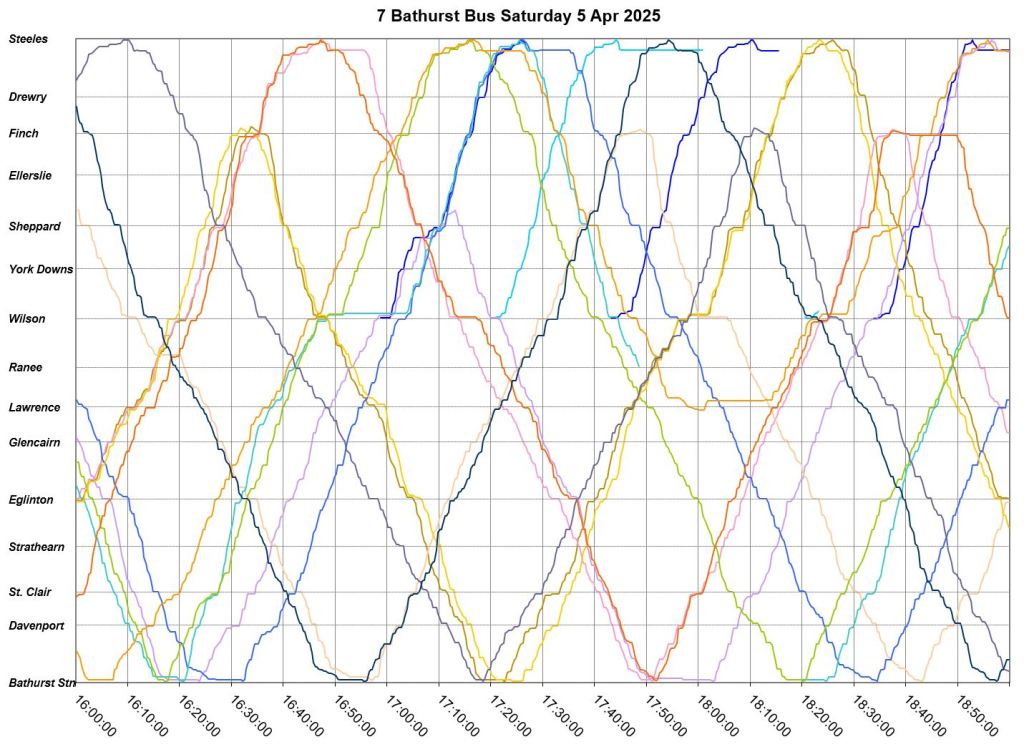
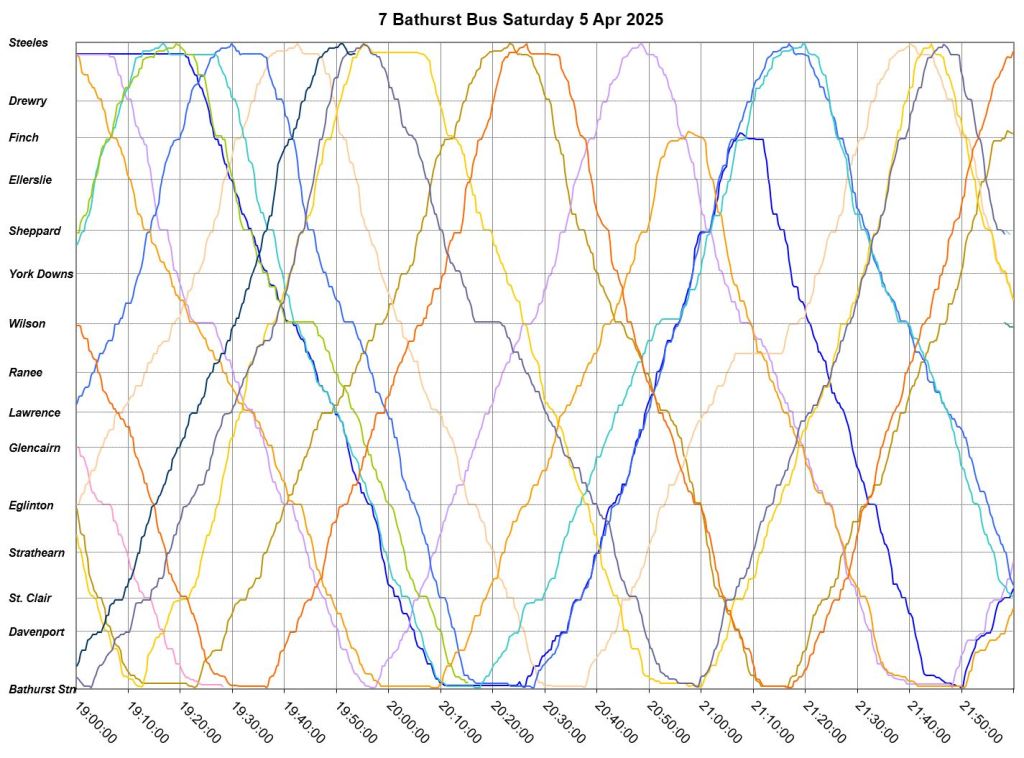
Saturday April 5, 2025
From early in the day buses operate in pairs or worse and layovers at terminals are shorter than on weekdays. Short turning begins after 11am and continues through late evening.

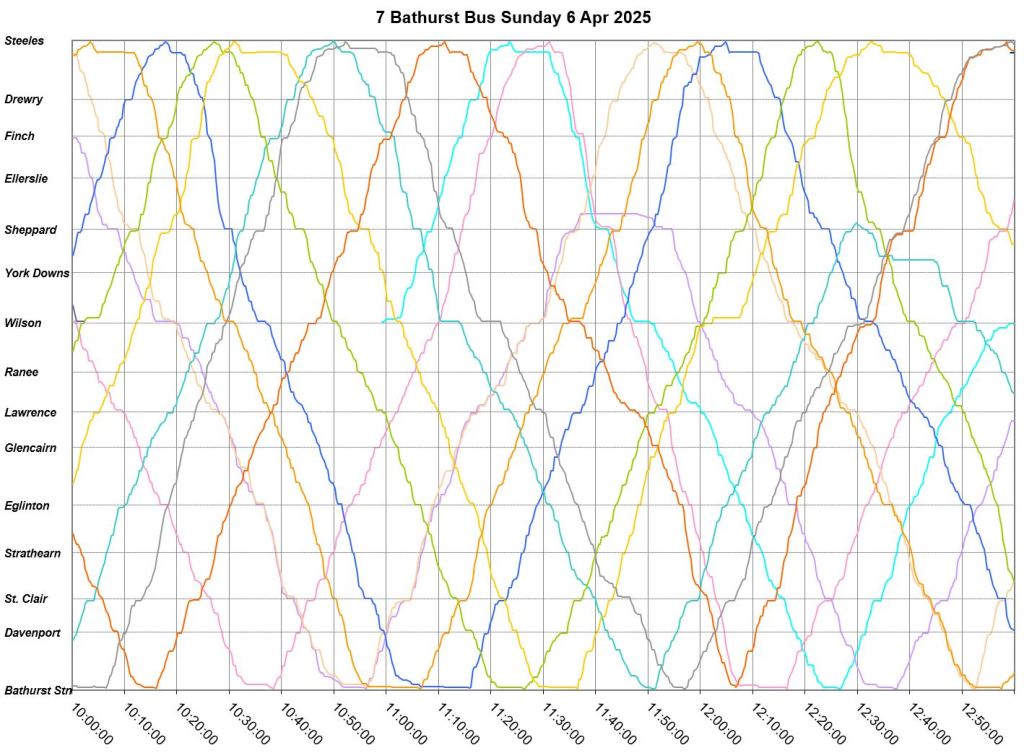
Sunday April 6, 2025
Sunday service behaves similarly to Saturday with irregular service into the evening.

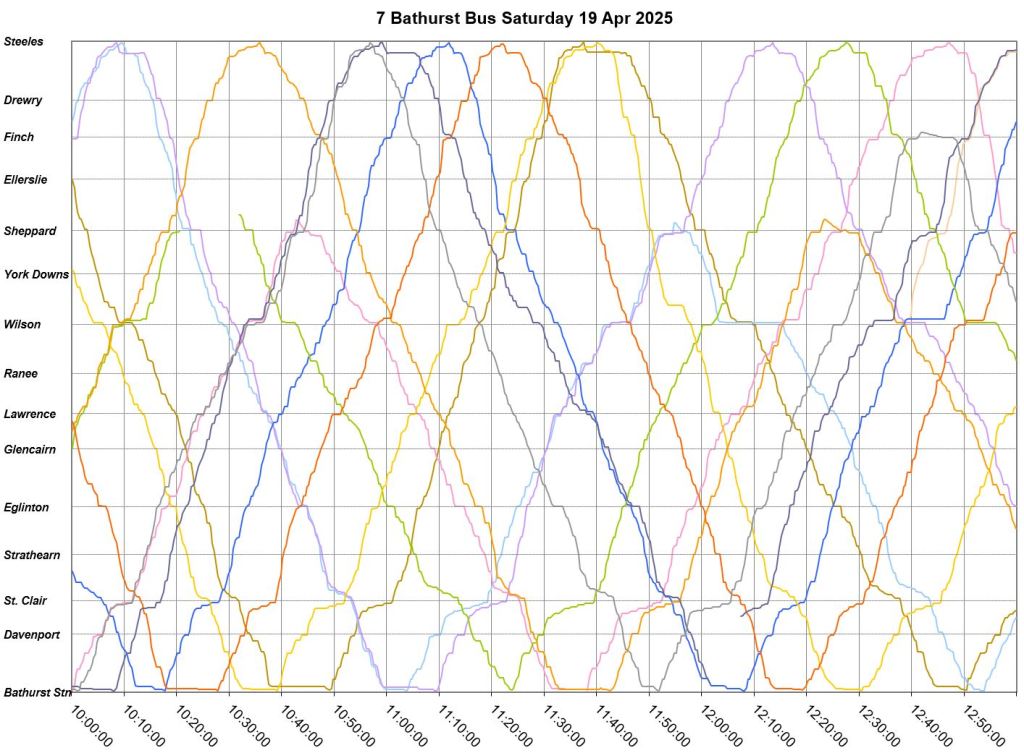
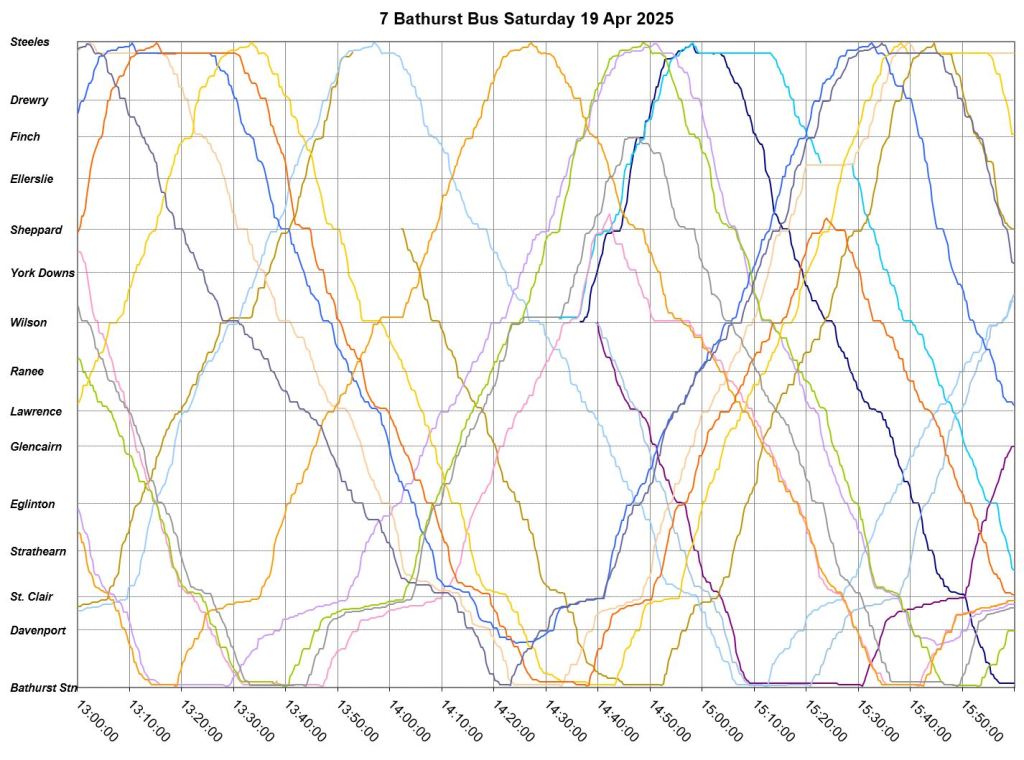
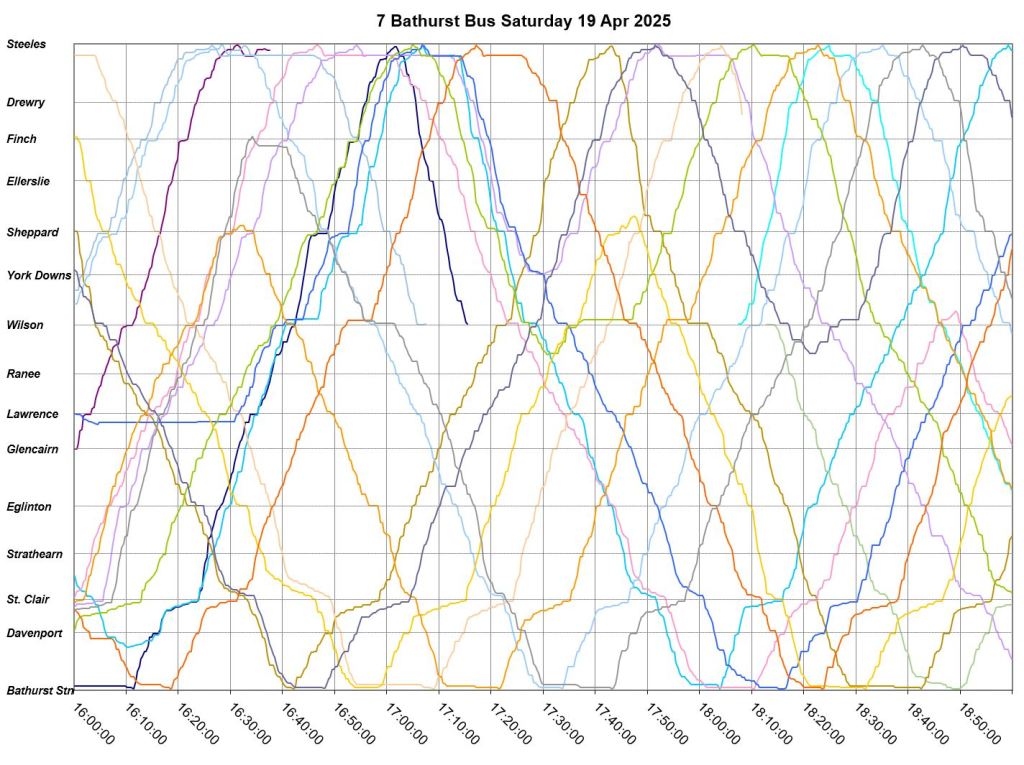
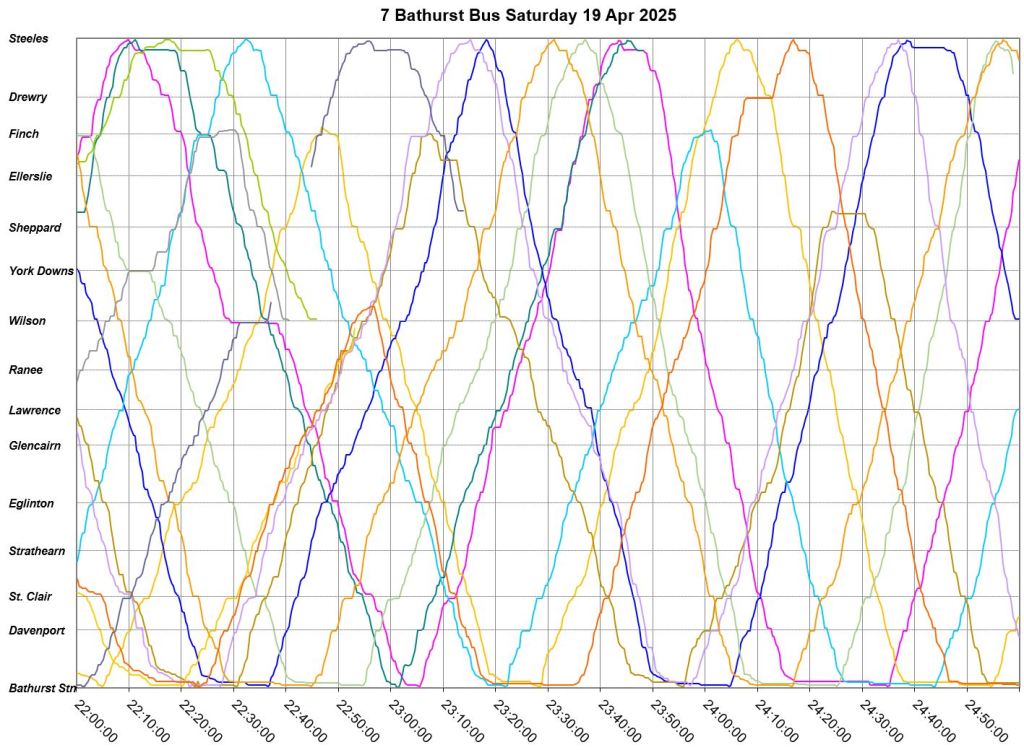
Saturday April 19, 2025
April 19 is the Saturday of Easter weekend. Service reliability was similar to April 5 above. One notable difference was a congestion issue northbound to St. Clair that persisted from early morning until about 10pm. There were wide gaps in the afternoon although this was partly addressed with short turns and vehicle spacing at terminals. However, erratic service persisted into the late evening.
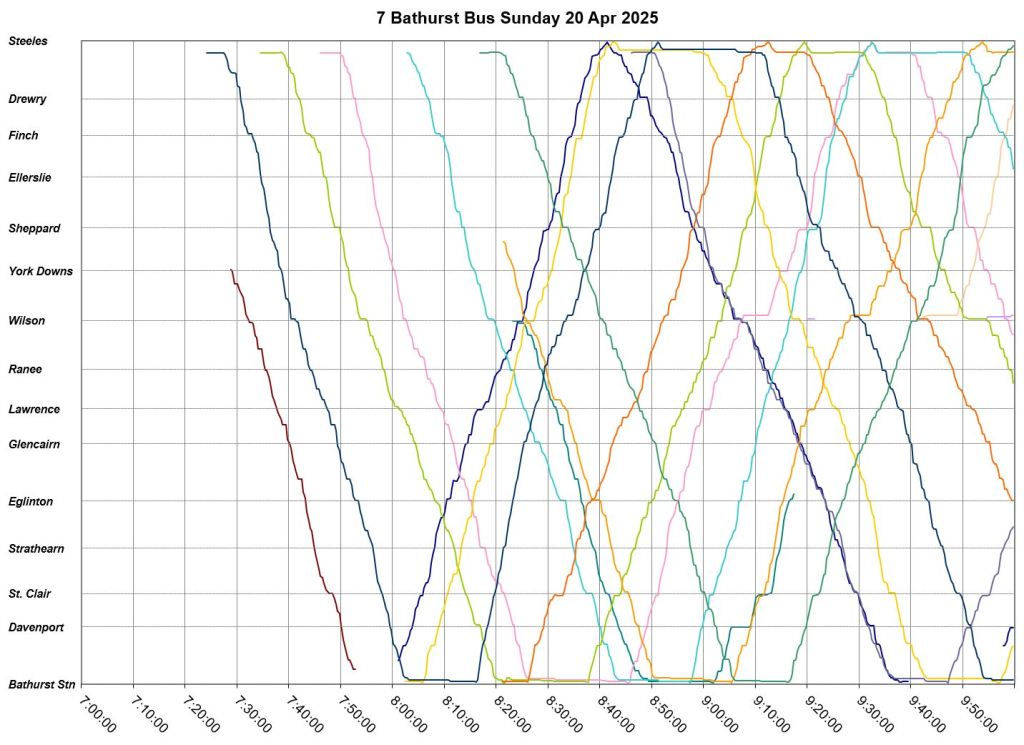
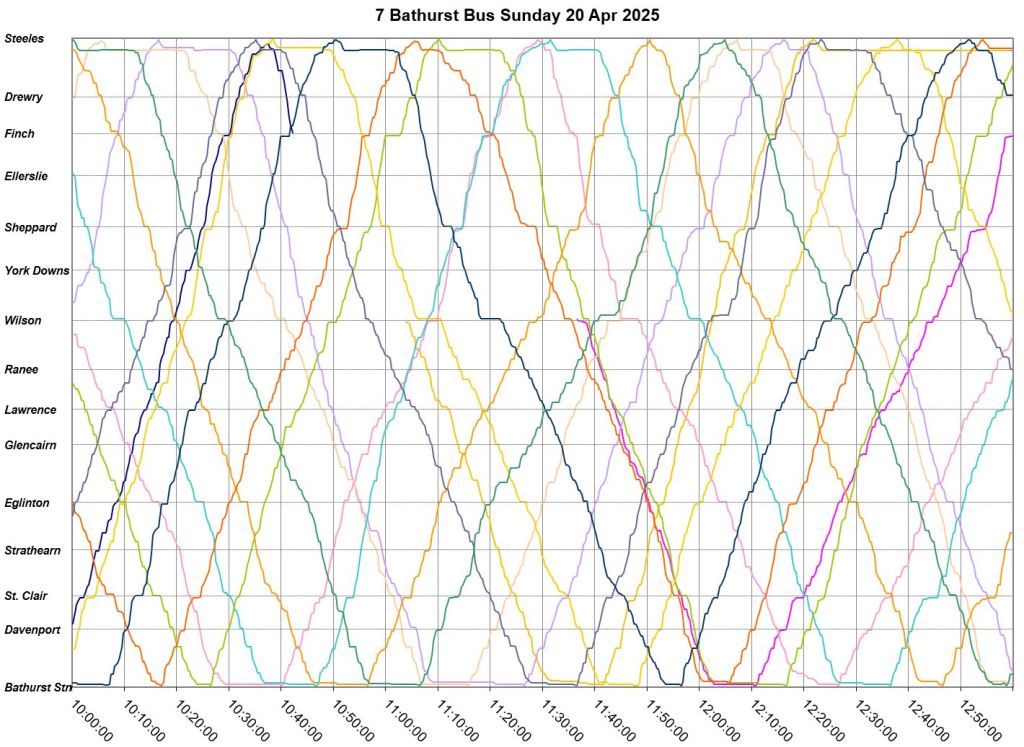
Sunday April 20, 2025 (Easter)
Easter Sunday service was fairly reliable through the day but became more erratic in the evening.


The fact that snow – on a short hill that would make Montrealers chuckle – caused a service change (and always does), may be part of the problem. No charts explain why Trawna, uniquely among cities I have lived in (Berlin, spb, kingston JA, nola, mtl), cannot run a bus up and down one street on time.
LikeLike