
The TTC produces a monthly summary of On Time Performance for its bus and streetcar networks. To call it superficial would be generous, but there are pretty charts.


First and most obvious among the problems is that the TTC never hits their target which is 90% across the system. Streetcars fare worse than buses because proportionately more of that network is affected by construction and diversions.
“On time” is defined as leaving a terminal within a six minute window from 1 minute early to 5 minutes late. In practice, for routes with frequent service, this means that vehicles can run in pairs but be counted as “on time”. A related problem affects branching routes where there is no management nor measurement of the regularity of services merging together on an even spacing.
There is no standard nor measurement of schedule adherence anywhere else on the route. Most riders do not board at terminals, and so service quality is not measured where most riders see it.
The second problem is that the reported numbers aggregate an entire month’s data for every route. There is no indication of problem routes or time periods, or of how this relates to periods when many riders are trying to use the service.
In an attempt to learn the details beyond the summary numbers, TTCRiders recently made a Freedom of Information Request for route and time period “on time” data from September 1 to November 16, 2024.
The charts in this article review the TTC data at increasing levels of detail to show how different that view is from the simplistic summary values published as “key performance indicators” in the CEO’s Report.
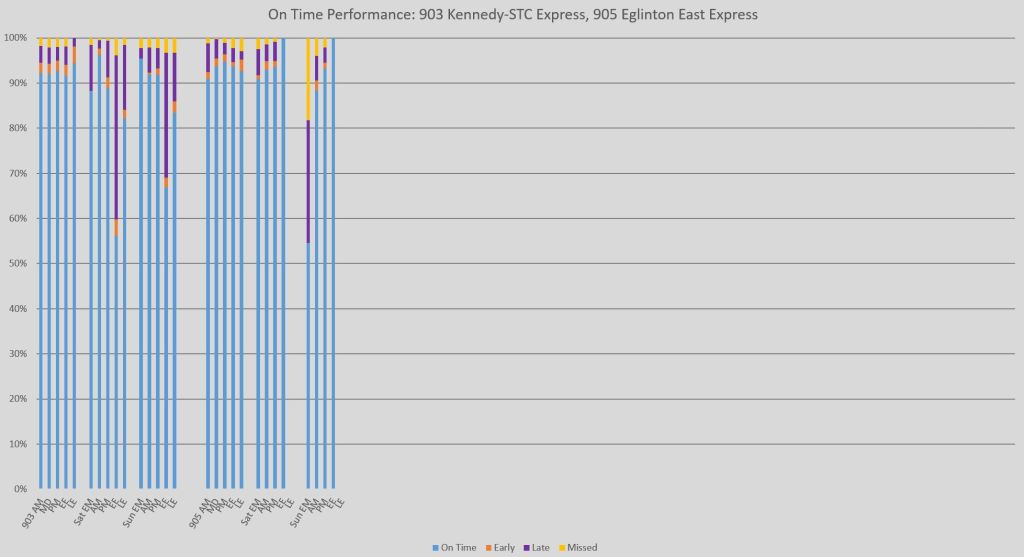
First, here is a breakdown by mode. The roughly echoes the values reported by the TTC with bus service achieving just over 80% “on time” trips and streetcars about 70%. Broken out here are the Express Bus routes (900 series) and the Blue Night routes (300 series). Note that night services which should have no problems with traffic congestion do not fare well.

When the status for each mode is subdivided by time of day, things are not quite as rosy. In the charts below, there are four sets of columns corresponding to weekdays, Saturdays, Sundays and Holidays. Within these are six time periods.
- Weekdays: AM Peak, Midday, PM Peak, Early Evening, Late Evening, Overnight
- Others: Early Morning, Late Morning, Afternoon, Early Evening, Late Evening, Overnight

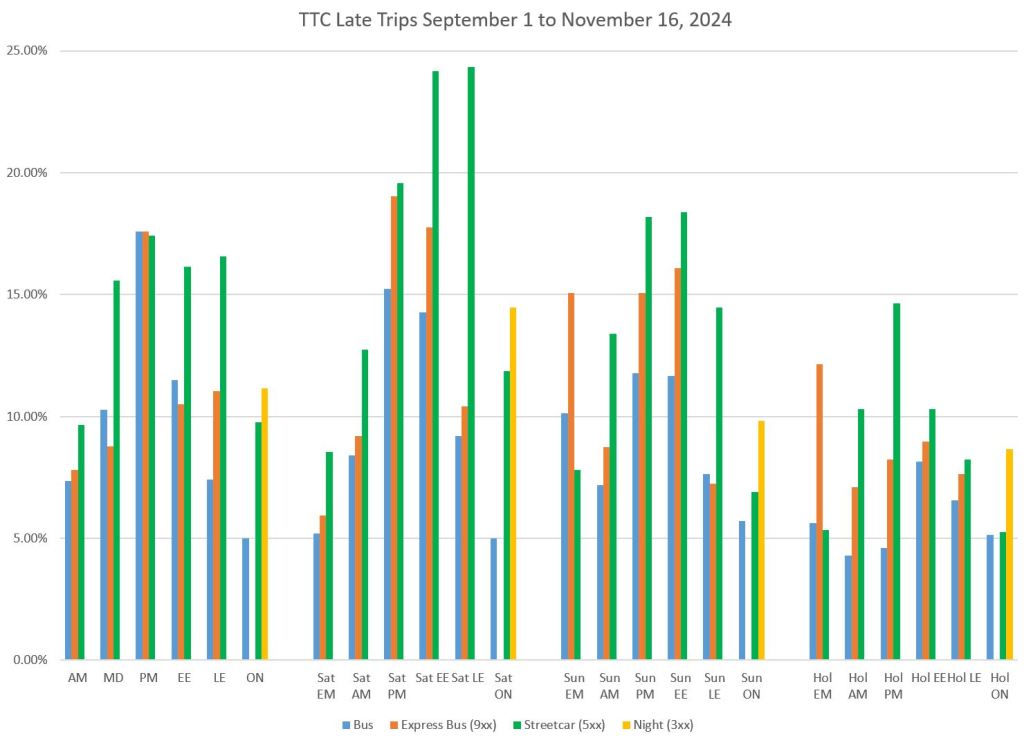

Note that “on time” performance for streetcars (green) falls in the evenings and especially on weekends. Nowhere in the official KPIs does the TTC admit to only hitting 50% “on time” on part of its network.
The upper right chart shows the proportion of late trips (more than 5 minutes after a scheduled departure). The percentages are high in the PM peak and evenings, with Saturday being particularly bad.
The lower left chart shows the proportion of early trips (more than 59 seconds before a scheduled departure). Streetcars run early at terminals much more than buses. This might be related to the idea of getting a “head start” on a trip where delays are anticipated on busy downtown routes.
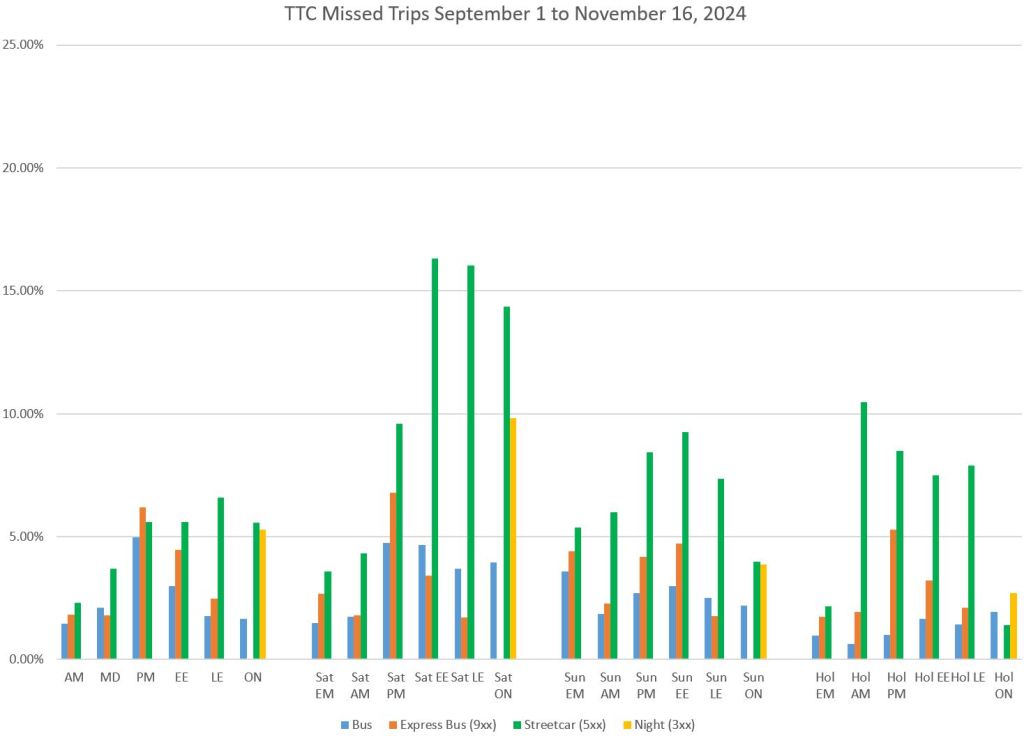
The lower right chart shows missed trips. These are defined as trips that are over 20 minutes late or just do not show up at the terminal. This can occur due to short turns, operator or vehicle shortages, or severe schedule disruption. Note that on Saturday evenings about 1/6 of the streetcar service never reaches its terminus.
The yellow bars (night service) only appear on the rightmost of the six columns because that is when 300-series routes are in service. About 20% of the service is late or early, and on Saturdays [actually Sunday morning] about 10% of service is missing at terminals. Reliability is quite poor on a service riders depend on for safe travel to and from shift work.
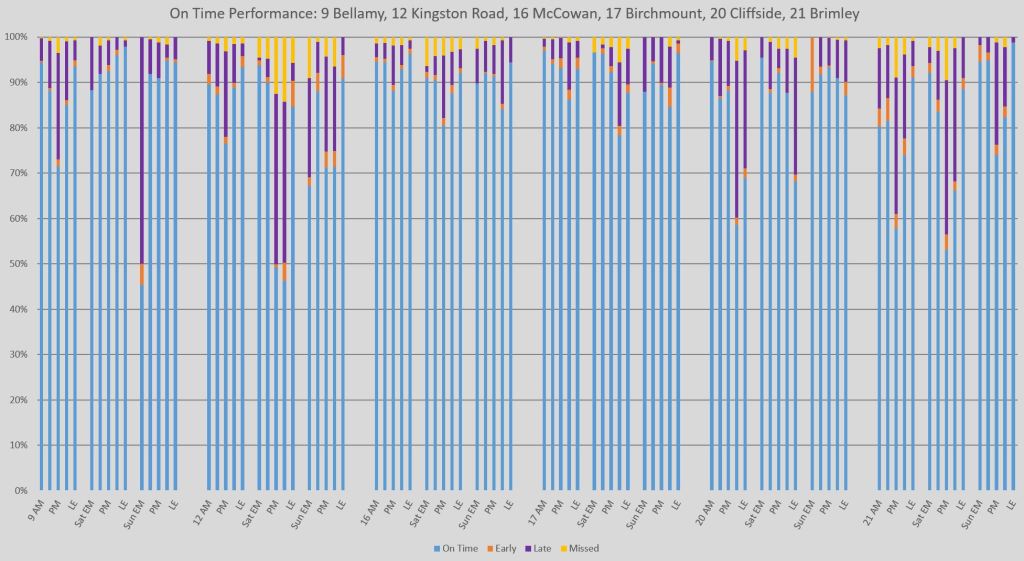
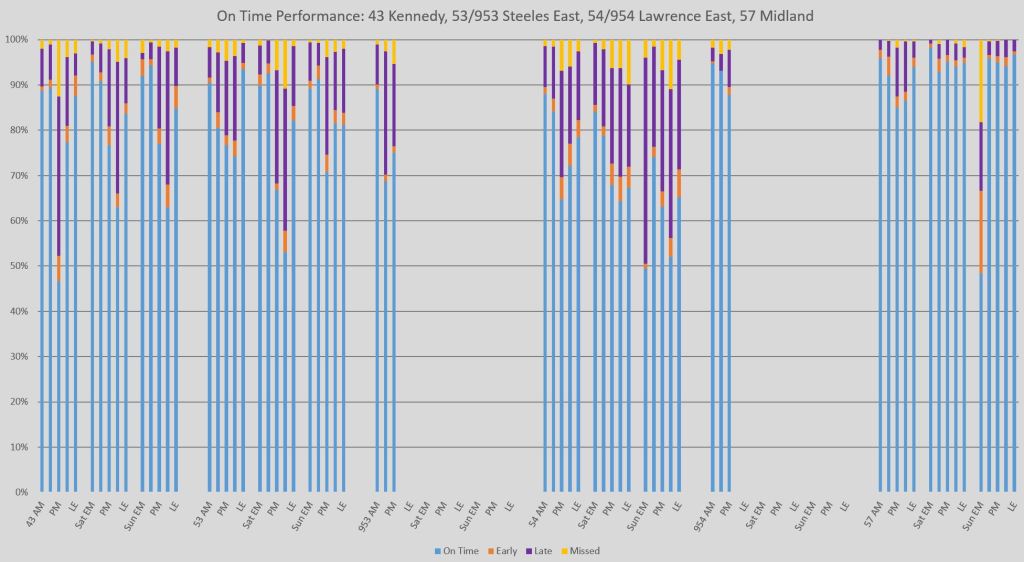
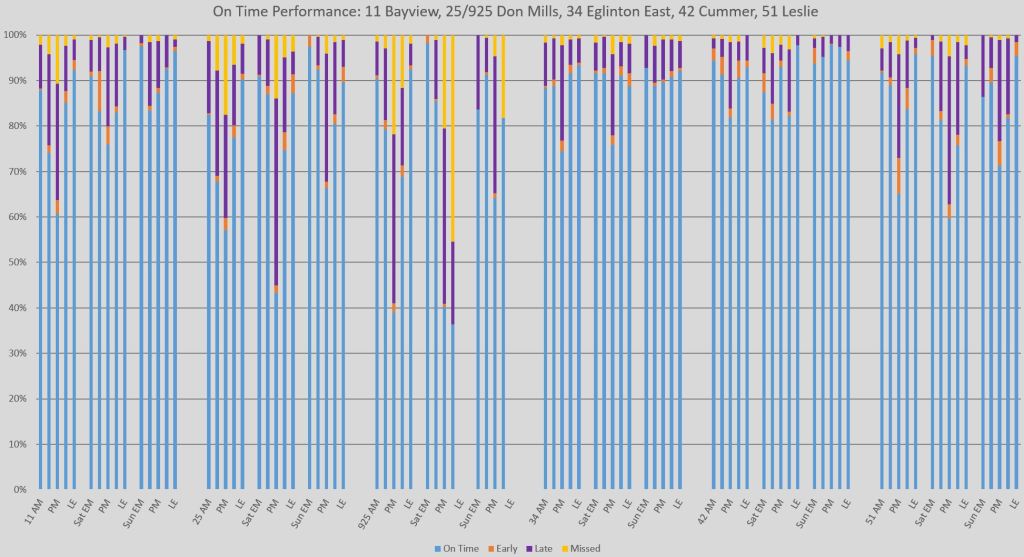
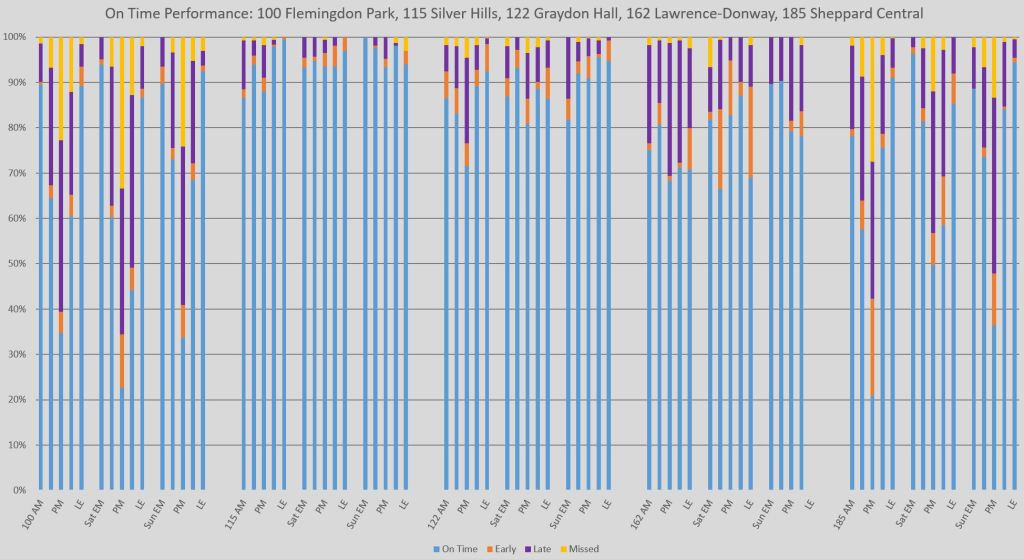
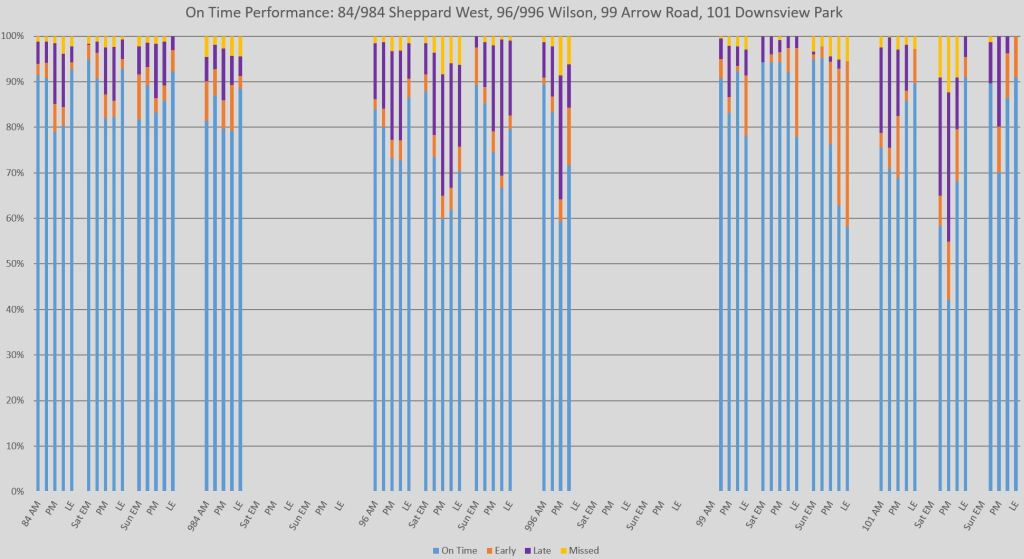
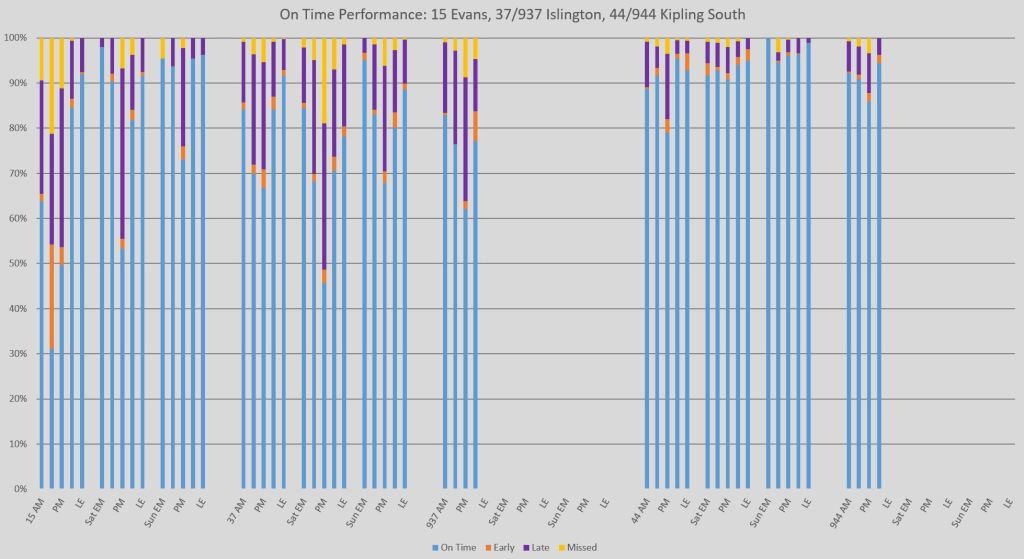
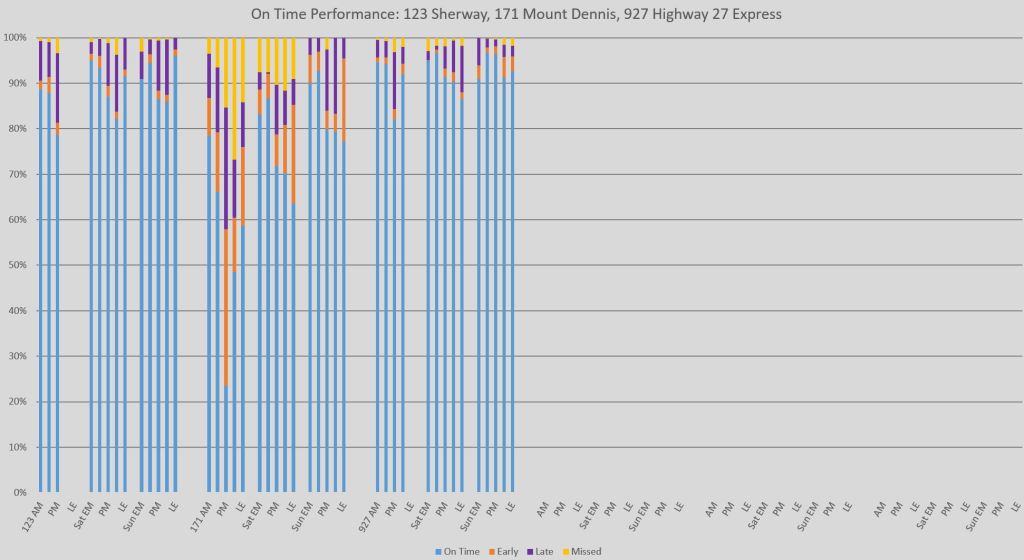
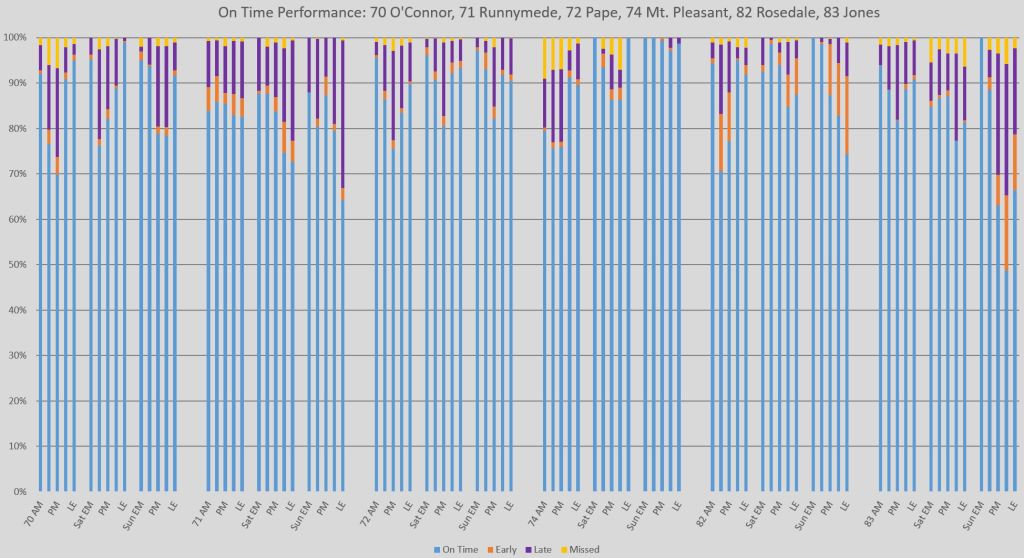
In the following section, charts provide a route-by-route view of performance. They illustrate the wide variation by route and time period that is completely lost in overall averages. Many routes achieve 90% “on time” status much of the time and these pull up the system averages. However, some routes perform quite poorly. This problem did not just develop in the past few months. Consolidated reporting masks the problem routes and times, and hence the need for management to address service reliability.
Buses: East
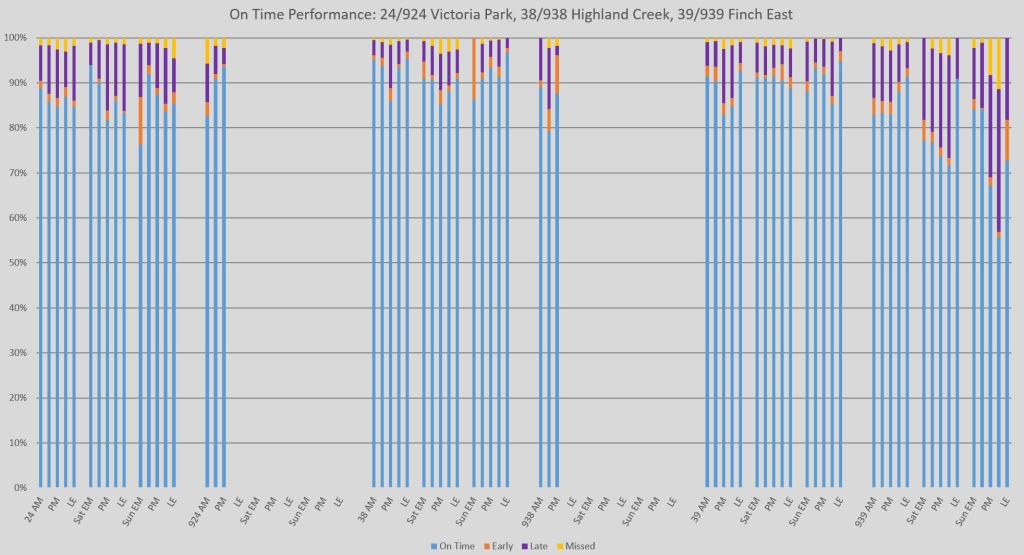
The charts here show data for bus routes from Victoria Park eastward arranged numerically with related express and local services side by side. There are three columns for each route: weekday, Saturday, Sunday with Holidays omitted as there were only two (Labour Day and Thanksgiving). The five time periods cover routes from early morning to late evening. Also included here are major east-west routes running from Yonge to Scarborough.
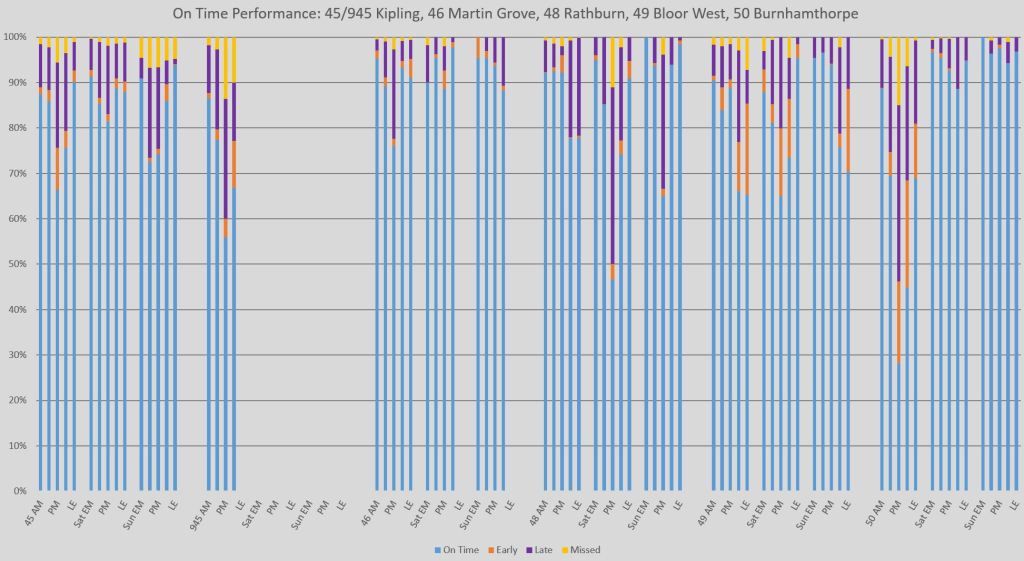
The blue bars show the “on time” values, and these sit at a high level for many route. Early and late trips are in orange and purple, and missed trips in yellow. When these colours press down into the blue area, we know that a route is in trouble. Note how some routes show poorer behaviour on weekends.
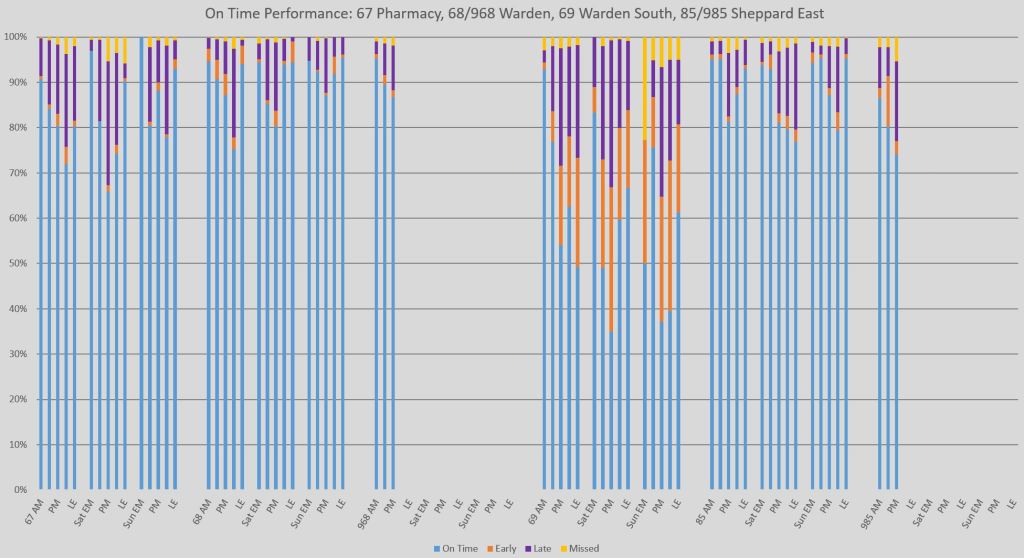
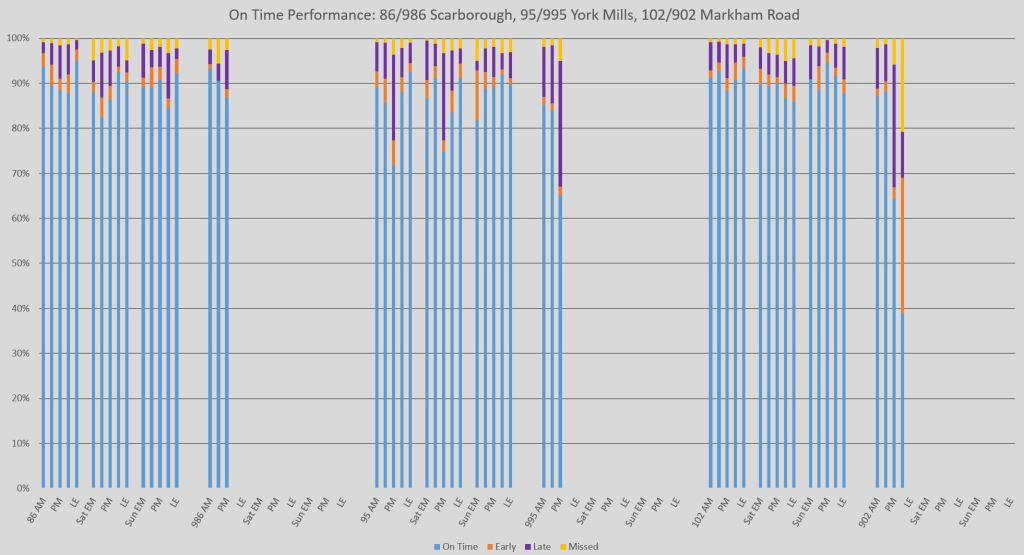
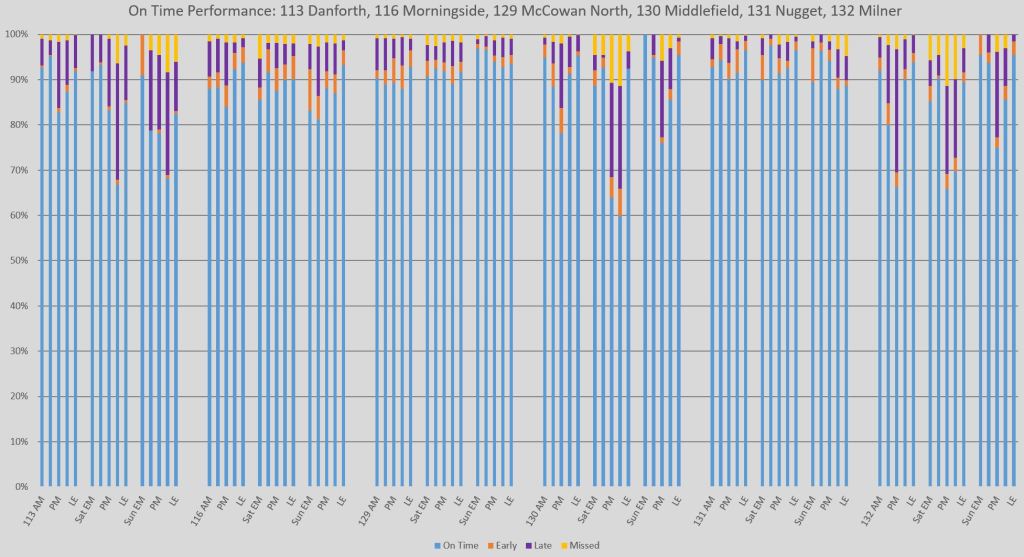
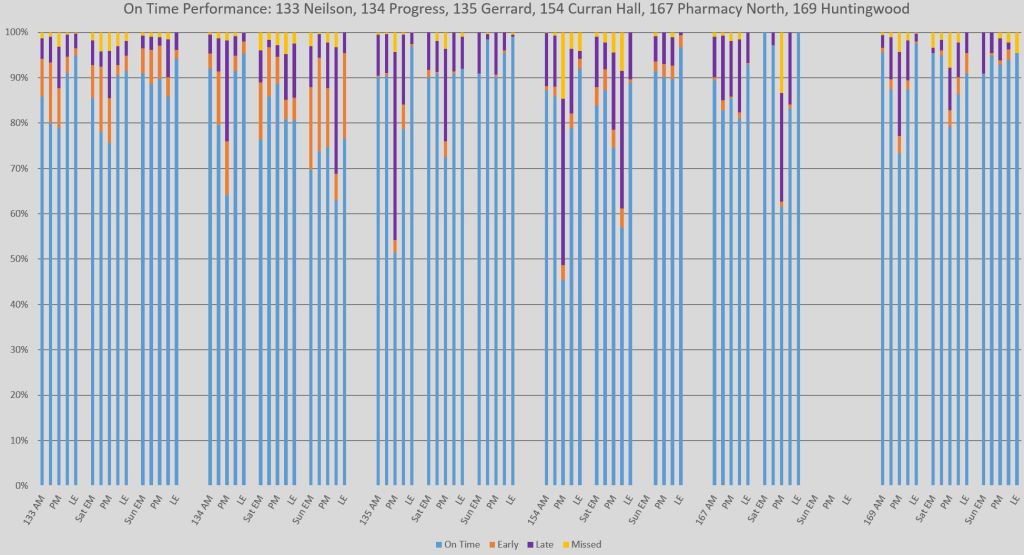
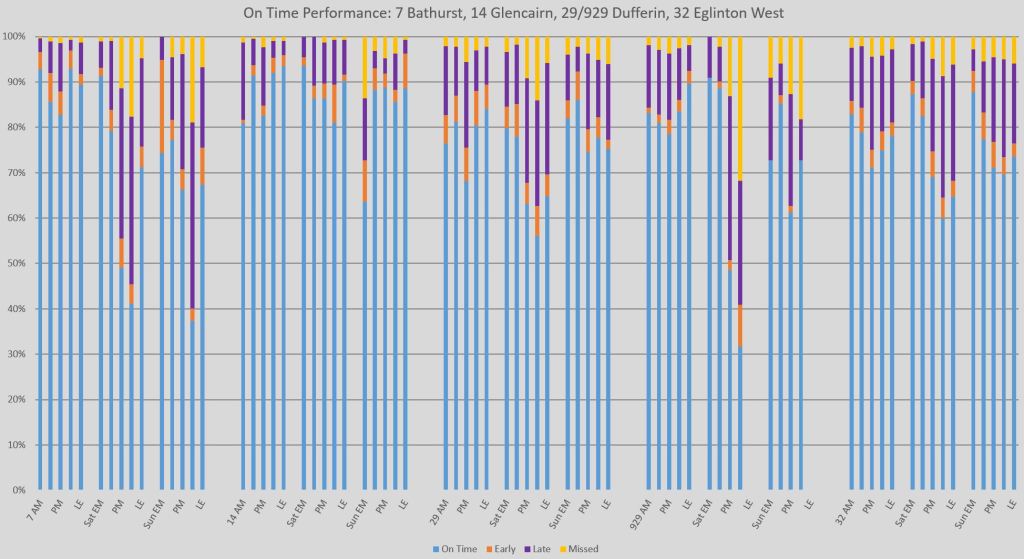
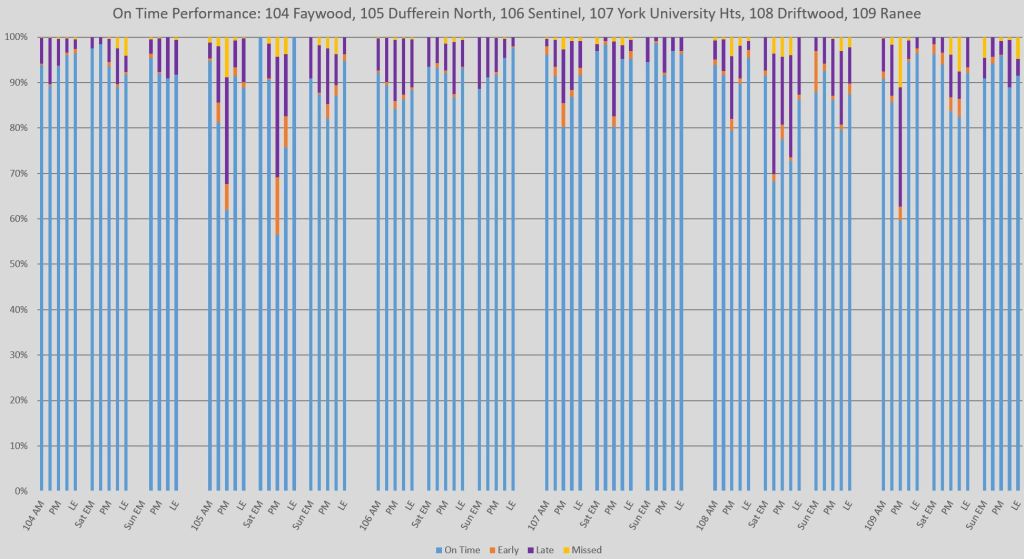
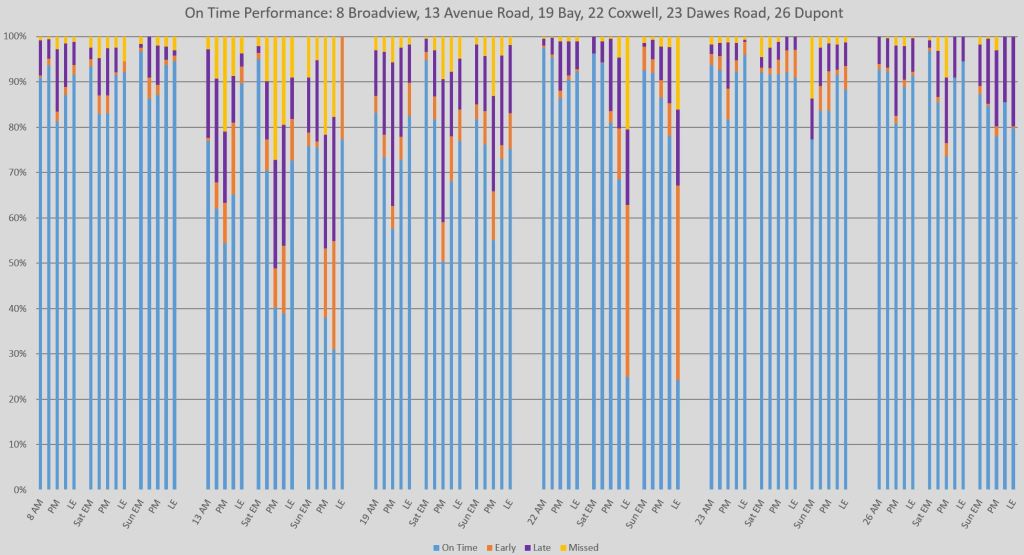
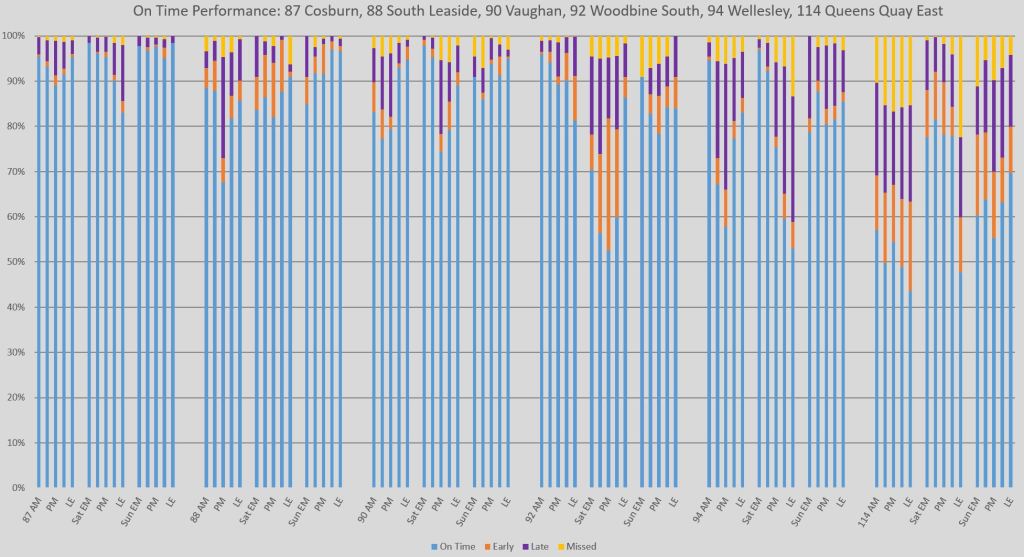
Buses: Northeast
These charts contain data for routes between Yonge and Victoria Park. (For the major east-west routes, see the “East” section above.)
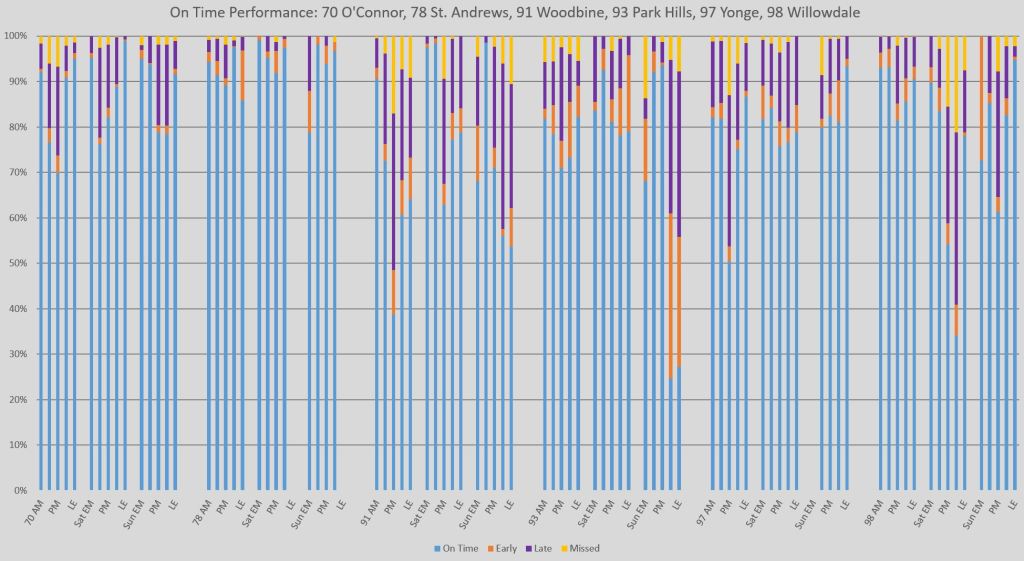
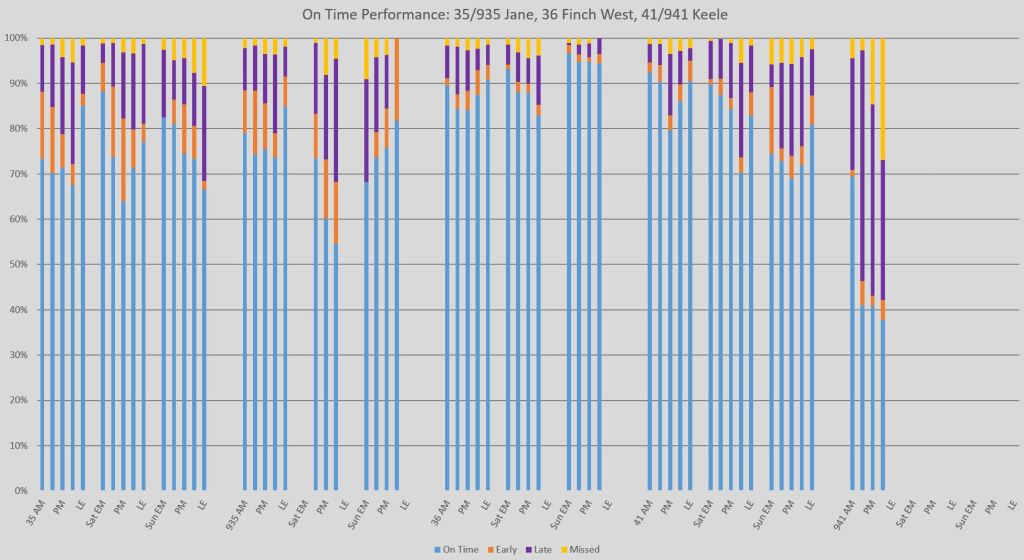
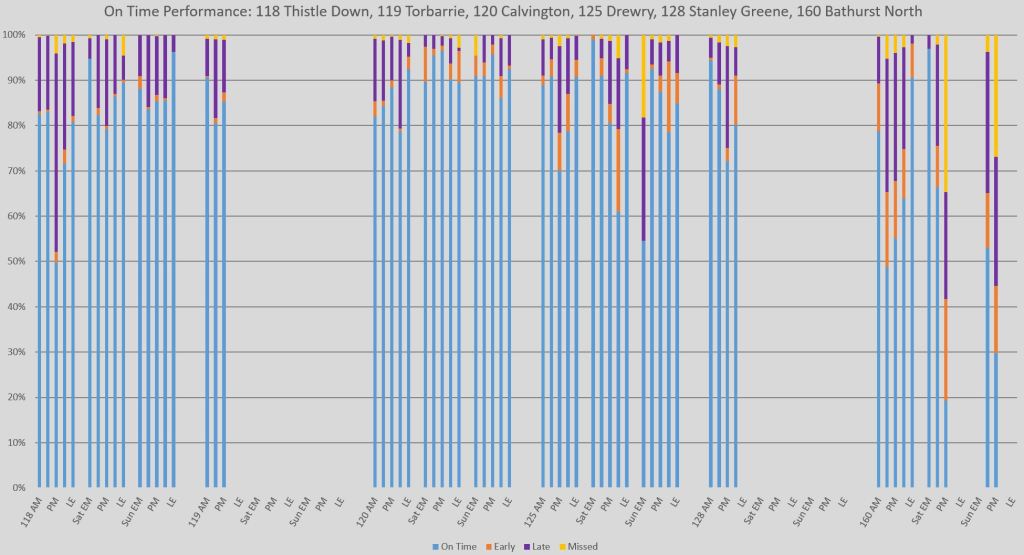
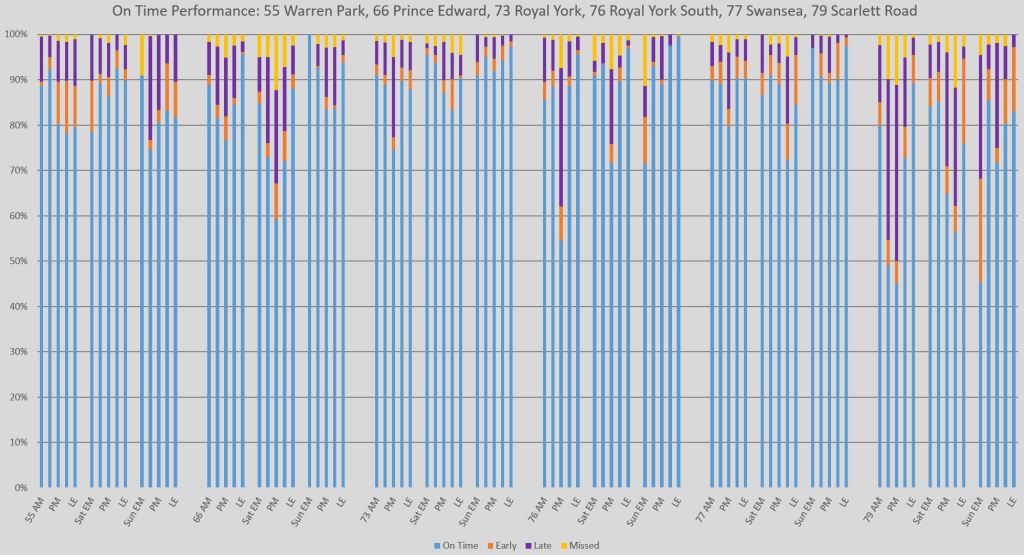
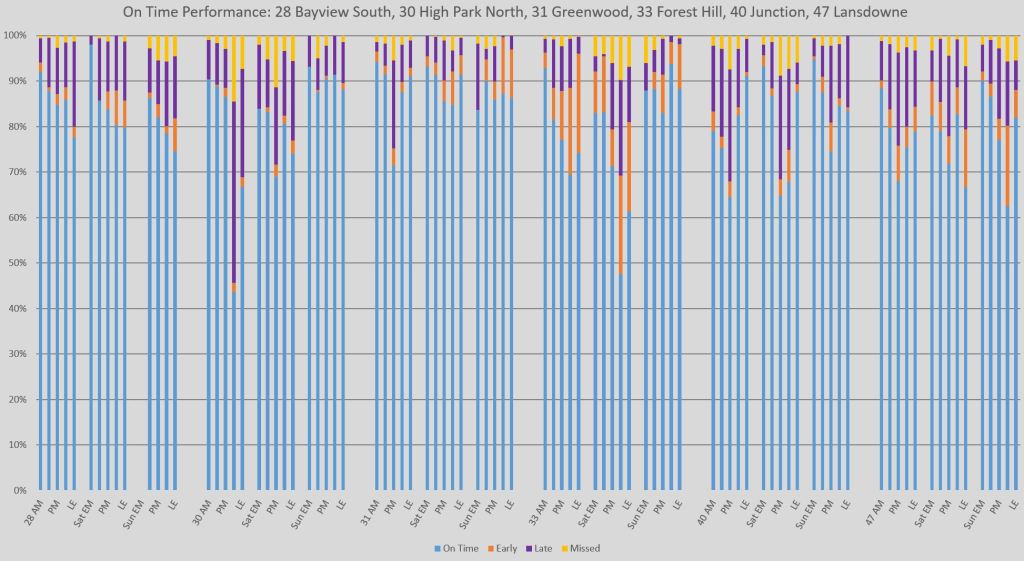
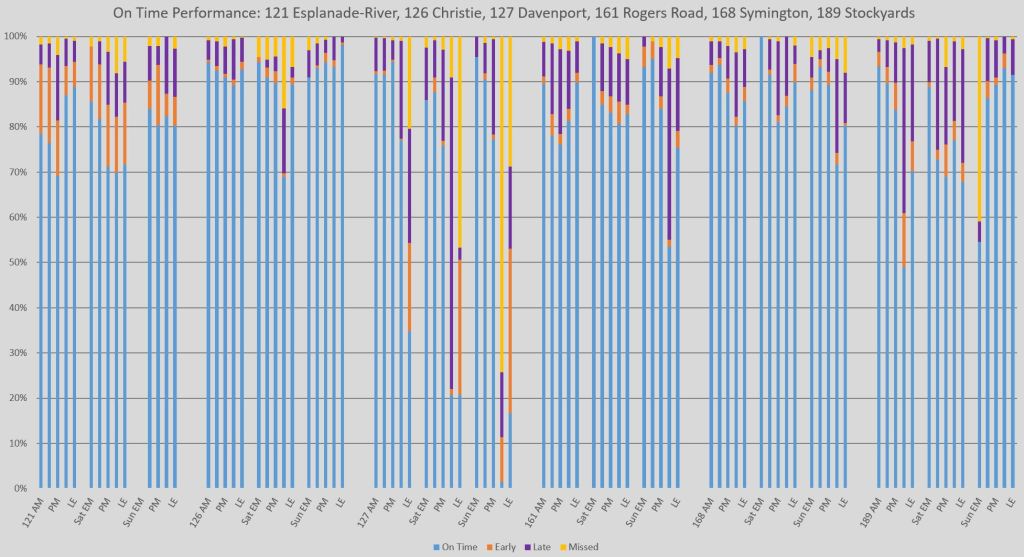
Buses: Northwest
These charts contain data for routes between Yonge and, roughly, the Humber River.
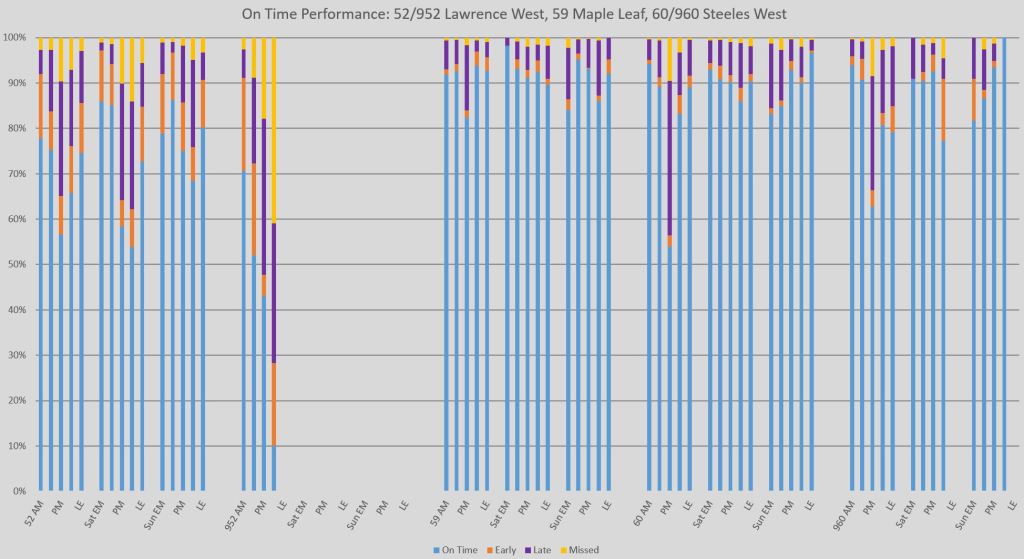
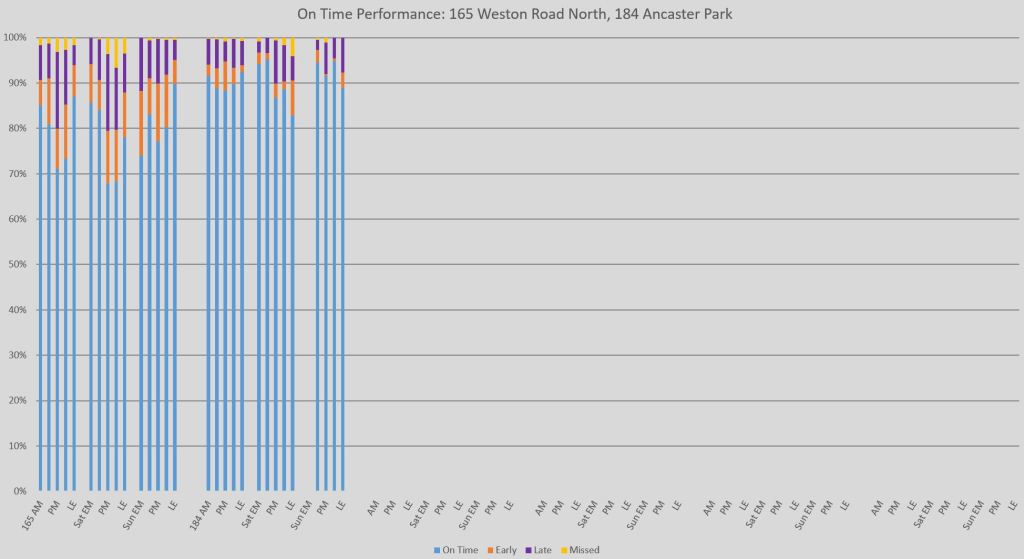
Buses: West
These charts contain data for routes generally west of the Humber River.
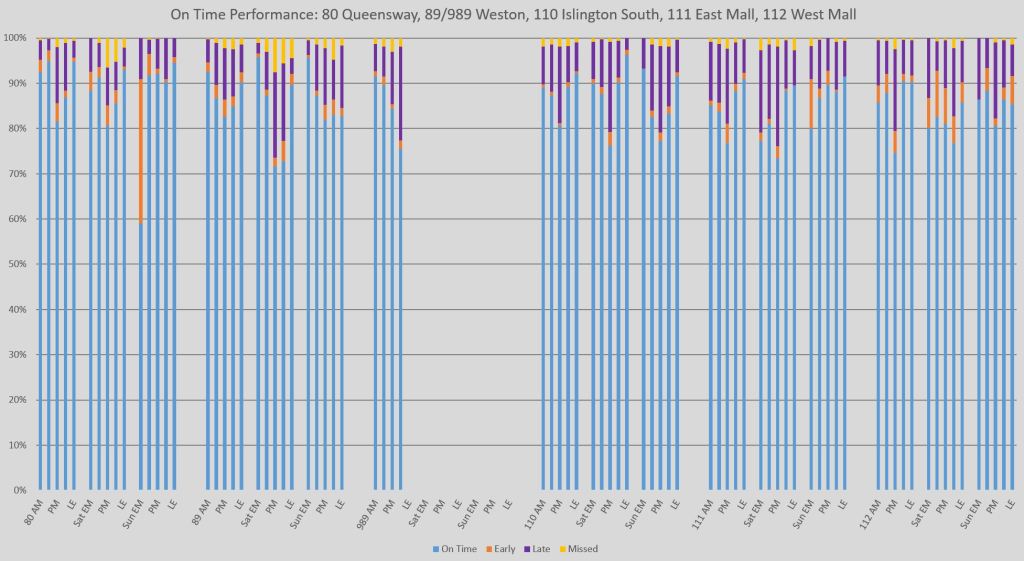
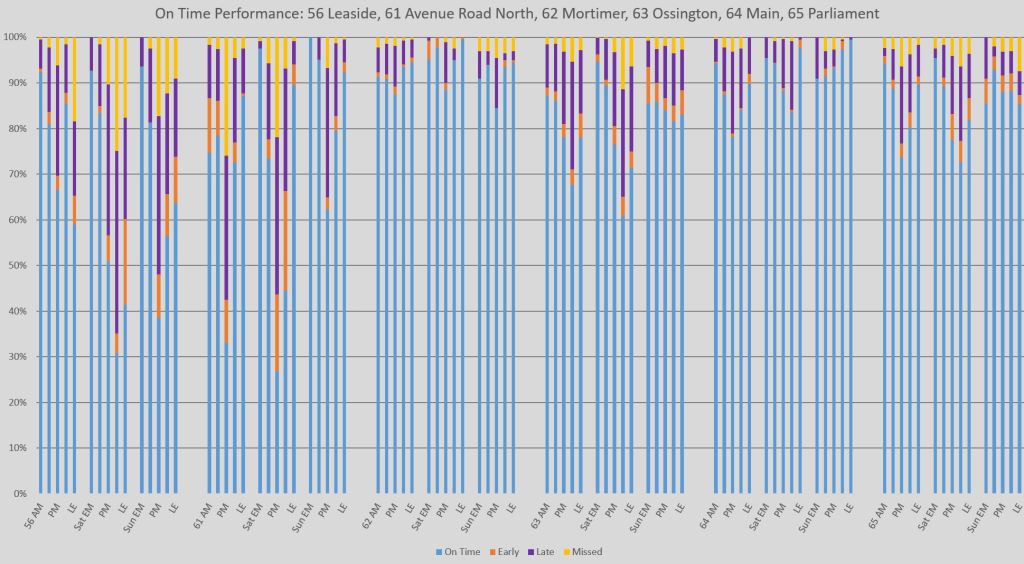
Buses: Central
These charts contain data for routes mainly in the old City of Toronto, East York and York.
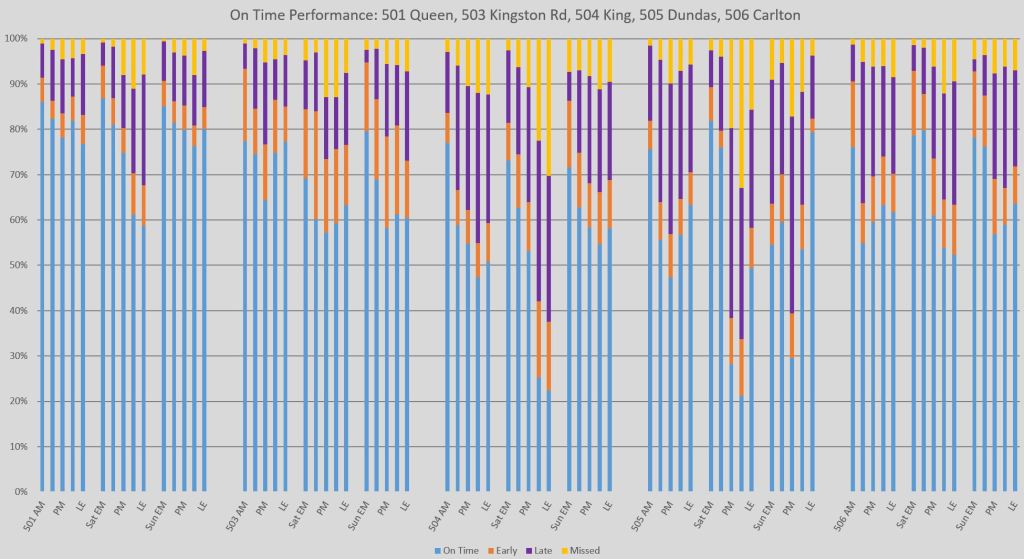
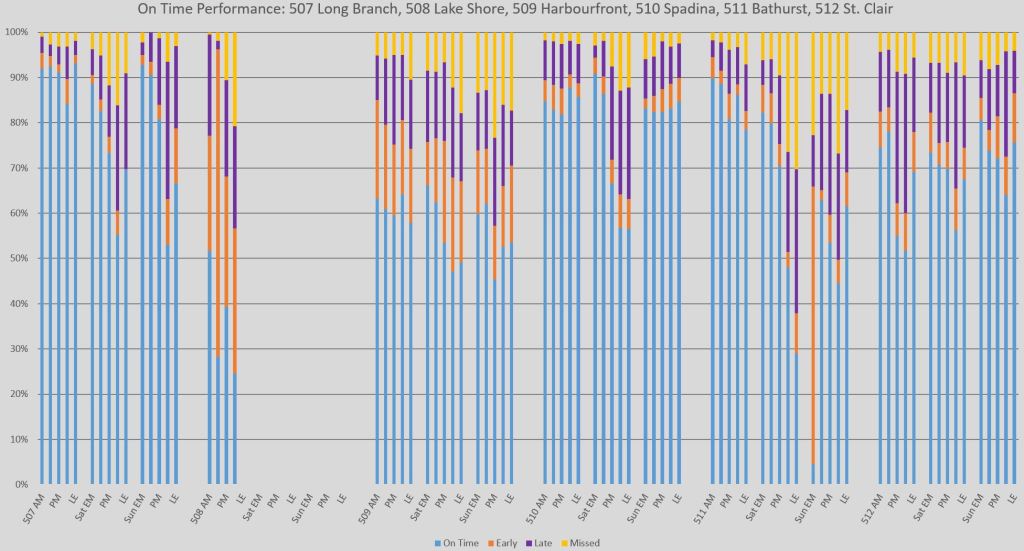
Streetcars
These charts hold the data for the streetcar routes downtown. Note that 509 Harbourfront and 510 Spadina were actually operating with buses during this period.
504 King and 505 Dundas have particularly bad performance on Saturdays. The 507 Long Branch car performs quite well on weekdays, but weekends are quite another matter.
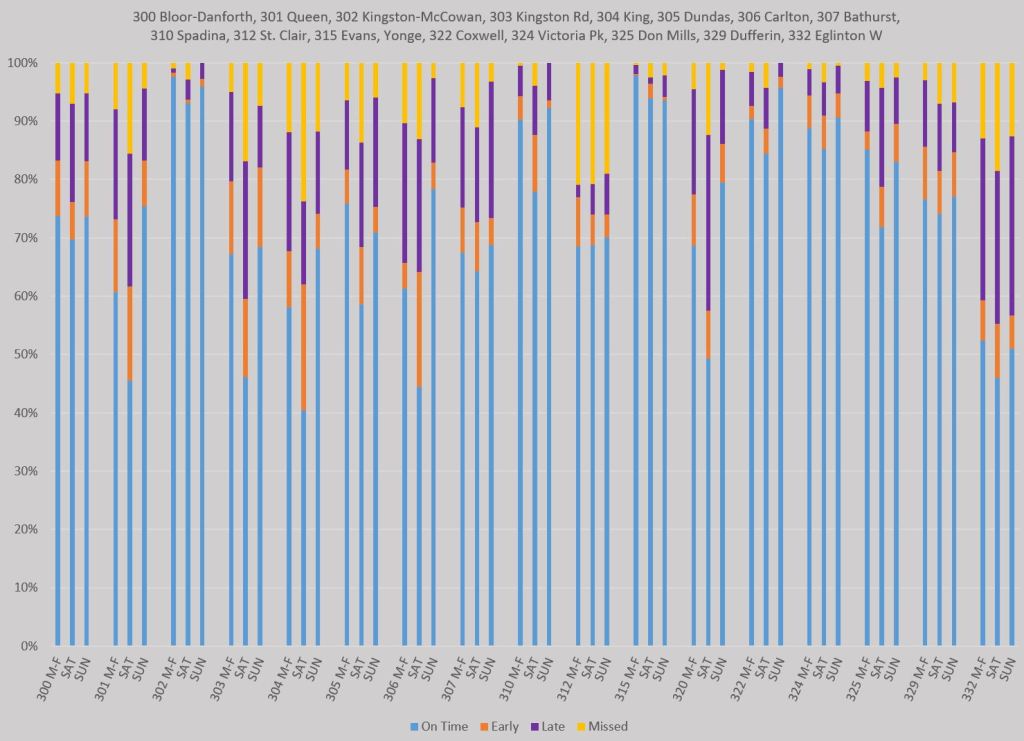
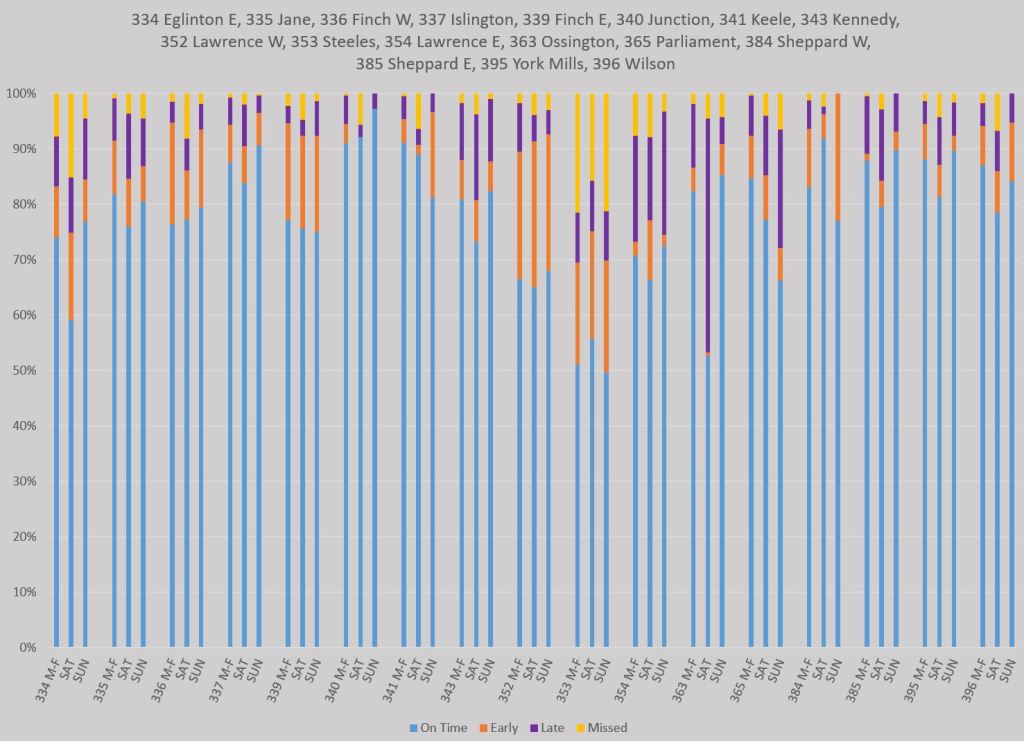
Night Services
The charts for night service are in a different format from the charts above because there is only one operating period. Each group of three columns shows the data for one route on weekdays, Saturdays and Sundays. (Note that “Saturday” service operates early on Sunday, and “Sunday” service early on Monday.)
There is a widespread problem with poor on-time performance on the night routes. The classic excuse of “traffic congestion” simply does not apply here. This is a direct result of problems with schedules and service management. I will address details of individual routes in a future article.

Those 512 St. Clair numbers don’t line up with my personal experience, which is that it’s been running in pairs at all times of day since service resumed, with no attempt to maintain headways.
Steve: Yes, this is an example of the mismatch between the TTC’s reported data and standards with real life. With an 8 minute scheduled headway, but a leeway of 6 minutes (-1 to +5), cars can be 2 minutes apart leaving Keele or Yonge Street and be “on time” according to the TTC. It doesn’t take long for that 2 minutes to collapse into a pair of cars running together. The vehicle tracking data confirms this.
Our purpose in publishing this analysis was to show that even by their own standards, TTC falls well short of their target on many routes.
LikeLiked by 1 person
There should be ZERO TOLERANCE for leaving not just terminals but any stop early. The TTC needs to impose VIVA busses type system where drivers are hit with high fines for leaving any stop early.
Steve: There is a problem with many schedules, regularly flagged by ATU 113, that the scheduled travel times between time points do not always match real conditions. Moreover, conditions will vary from day to day. That’s why managing to a headway on frequent routes is important.
LikeLike
10 years ago, 90 percent of Bloor Danforth had speed limits of 50k or higher. Today 80 percent of Bloor Danforth has speed limits of 40k. How many timing points changed? Zero. This largely explains the night bus difficulty.
LikeLike
The 61 is always late. It will always pull into Eglinton station on time. Then go out of service for about twenty minutes. I just use the temp route Lawrence bus the 52. The 61 is never on time. Sometimes we will just sit at the station for fifteen minutes for ‘spacing’
LikeLike
There is a saying, if you can’t measure it, you can’t manage it. And so, if you don’t want to manage it, you make sure not to measure it! That’s the TTC way . . . other systems monitor on time performance at key points or even every bus stop and station. Nowadays you can do that pretty easily. And you can even “weight” the data to reflect the number of people who might be affected at each stop and on each train and bus. That’s what Transport for London does with its private bus operators. They still get stuck in traffic, but they do try hard to keep evenly spaced.
LikeLiked by 1 person
Wonderfully and succinctly put.
I’ve not worked in transit, but I have worked at several multi-billion dollar corporations. So large bureaucracy with entrenched power structures and careerists galore. And I saw the same behaviour.
Every layer of manager (defined as anyone who has someone report to them and does no productive work – a shop foreman who actually handles a wrench wouldn’t qualify since they do actual work) has, as the sum total of all their knowledge, the reports they get from their subordinates. They base on their decisions on these. More importantly, for those feeding up to them, they also base bonuses, raises, and promotions on those. And they need to feed good news up to their managers. It is in nobody’s interest to say that anything is going less than perfect. I’ve seen co-workers who did not understand what was really important to management try to get action on things that were not working properly. This usually caused some kerfuffle for a bit, then things went back to business as usual. After some time had passed, as soon as the troublemaker messed up something, they were demoted or expelled from the company, depending on how much they offended the powers that be.
The mentality around performance stats is that it should be finding problems. If the stats come back all green, they need to be tightened up or new measures added until opportunities for improvement do become clear. But with careerists and politicians in power, they will hide behind “Look at the report! Everything is fine!” even though everyone in the city knows the TTC is broken.
On a related note, there is an idiotic bit of management-think that says “Don’t bring me problems, bring me solutions”. This denigrates those who identify problems as negative and “not team players” because they’re somehow sabotaging things. Instead one is not supposed to mention a problem unless one already has the solution. This, of course, results is quick, knee-jerk “common sense” solutions that, at best do nothing, but more likely make it worse.
LikeLiked by 1 person
Why is Doug Ford calling an election? He already has a majority. This reminds me of Trudeau playing politics to call an election at the height of the pandemic only to end up with an even smaller minority.
LikeLike
Accounting for recent cutbacks on many streetcar routes down to 10 minute headways off-peak, this means passengers near terminals will regularly encounter 20+ minute gaps in service.
LikeLike
What is the procedure for a driver whose vehicle has caught up to the one in front?
Steve: At present, there is none.
LikeLike
TTC service is declining each year. It’s awful for Blue Night buses. Thetes no leadership. You can tell drivers don’t care anymore. Shame on TTC a real mirror for everything that is going downhill in Ontario.
LikeLike
My stop is the at the end of the 501 streetcar route at Neville Park. About 70% of the time, the streetcar sits in the loop until a second and often a third streetcar arrives. People have already been waiting more than 10 mins. for the 1st streetcar, but all 3 continue to sit there. This must affect headways and cause delays along the rest of the route. It’s so frustrating to see them just sitting there with the third one parked on the street since the loop can only fit two.
LikeLike