
The TTC produces a monthly summary of On Time Performance for its bus and streetcar networks. To call it superficial would be generous, but there are pretty charts.


First and most obvious among the problems is that the TTC never hits their target which is 90% across the system. Streetcars fare worse than buses because proportionately more of that network is affected by construction and diversions.
“On time” is defined as leaving a terminal within a six minute window from 1 minute early to 5 minutes late. In practice, for routes with frequent service, this means that vehicles can run in pairs but be counted as “on time”. A related problem affects branching routes where there is no management nor measurement of the regularity of services merging together on an even spacing.
There is no standard nor measurement of schedule adherence anywhere else on the route. Most riders do not board at terminals, and so service quality is not measured where most riders see it.
The second problem is that the reported numbers aggregate an entire month’s data for every route. There is no indication of problem routes or time periods, or of how this relates to periods when many riders are trying to use the service.
In an attempt to learn the details beyond the summary numbers, TTCRiders recently made a Freedom of Information Request for route and time period “on time” data from September 1 to November 16, 2024.
The charts in this article review the TTC data at increasing levels of detail to show how different that view is from the simplistic summary values published as “key performance indicators” in the CEO’s Report.
First, here is a breakdown by mode. The roughly echoes the values reported by the TTC with bus service achieving just over 80% “on time” trips and streetcars about 70%. Broken out here are the Express Bus routes (900 series) and the Blue Night routes (300 series). Note that night services which should have no problems with traffic congestion do not fare well.

When the status for each mode is subdivided by time of day, things are not quite as rosy. In the charts below, there are four sets of columns corresponding to weekdays, Saturdays, Sundays and Holidays. Within these are six time periods.
- Weekdays: AM Peak, Midday, PM Peak, Early Evening, Late Evening, Overnight
- Others: Early Morning, Late Morning, Afternoon, Early Evening, Late Evening, Overnight

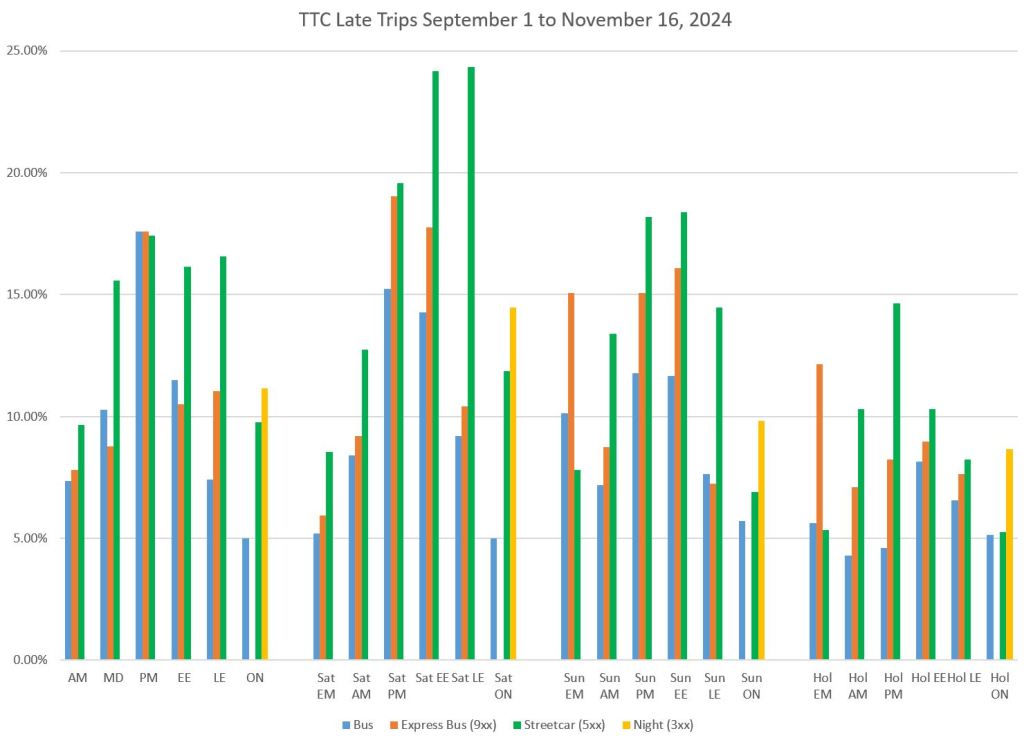

Note that “on time” performance for streetcars (green) falls in the evenings and especially on weekends. Nowhere in the official KPIs does the TTC admit to only hitting 50% “on time” on part of its network.
The upper right chart shows the proportion of late trips (more than 5 minutes after a scheduled departure). The percentages are high in the PM peak and evenings, with Saturday being particularly bad.
The lower left chart shows the proportion of early trips (more than 59 seconds before a scheduled departure). Streetcars run early at terminals much more than buses. This might be related to the idea of getting a “head start” on a trip where delays are anticipated on busy downtown routes.
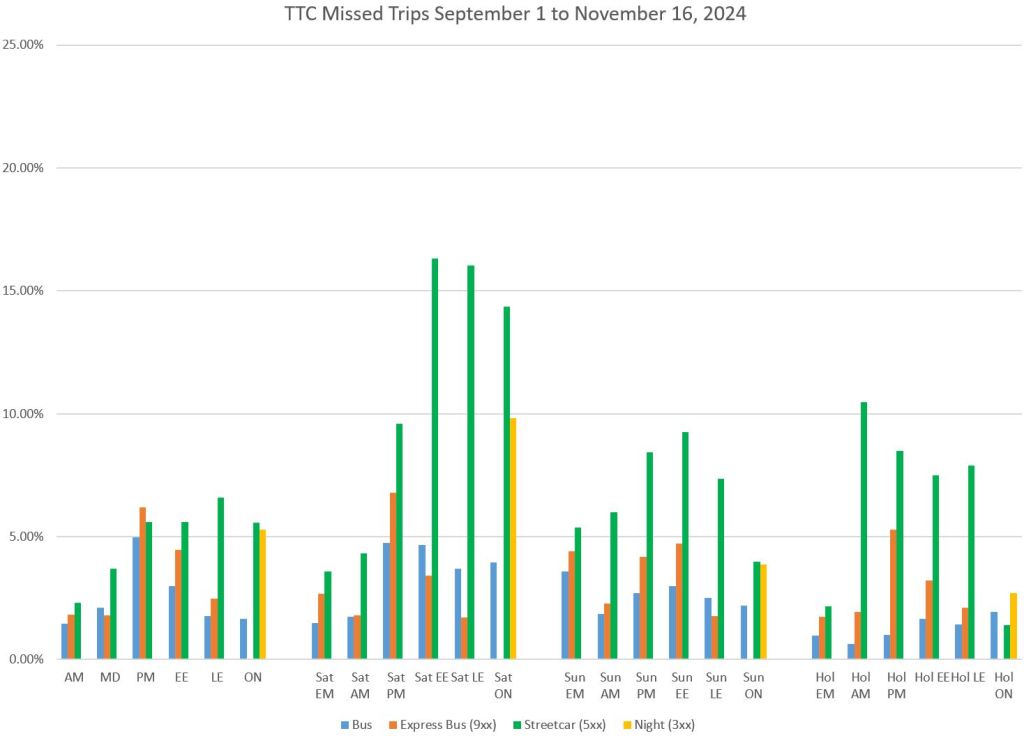
The lower right chart shows missed trips. These are defined as trips that are over 20 minutes late or just do not show up at the terminal. This can occur due to short turns, operator or vehicle shortages, or severe schedule disruption. Note that on Saturday evenings about 1/6 of the streetcar service never reaches its terminus.
The yellow bars (night service) only appear on the rightmost of the six columns because that is when 300-series routes are in service. About 20% of the service is late or early, and on Saturdays [actually Sunday morning] about 10% of service is missing at terminals. Reliability is quite poor on a service riders depend on for safe travel to and from shift work.
In the following section, charts provide a route-by-route view of performance. They illustrate the wide variation by route and time period that is completely lost in overall averages. Many routes achieve 90% “on time” status much of the time and these pull up the system averages. However, some routes perform quite poorly. This problem did not just develop in the past few months. Consolidated reporting masks the problem routes and times, and hence the need for management to address service reliability.
Continue reading