
In the political hoopla surrounding the City budget, and the level of support transit will get, we regularly hear claims from the TTC that its service is close to 100% of the pre-pandemic level. Further improvements are planned for 2025.
This story is echoed by Mayor Chow as one of the “good news” pieces about our city.
There is only one small problem: it isn’t true.
The metric behind the claim is “service hours”. This translates directly to the number of operator hours in the service budget. Yes, other factors affect total costs, but operator hours relate fairly well to expenditures and provide a simple, single variable to track over time.
However, the rider experience comprises three very different factors: frequency, reliability and capacity. Infrequent service is not worth the wait, especially for short-hop trips. Service that shows up in bunches, if at all, following an interminable wait compounds the problem. Inadequate capacity tells riders that comfort is not important in spite of a customer first focus.
Over the years, a service hour has provided less real “service” to riders because buses and streetcars take more time to make the same round trip than they did in past years. This was acknowledged by a chart in the TTC’s 2025 budget presentation deck. Slower buses and streetcars arrive less frequently and provide less capacity.

Another metric, vehicle mileage, does not tell the whole story either. The average speed varies quite substantially from route to route, and the relationship between vehicle hours and kilometres is not the same across the system by route, time of day, or day of the week. Average values system wide can differ greatly from those for individual routes and time periods.
The charts in the main part of this article review service levels in January 2025 and January 2019, before the pandemic with data taken from the TTC’s own Scheduled Service Summaries (archived copies are available on this site).
All streetcar routes and the most heavily travelled bus routes are included. The streetcar comparisons also include January 2013 data from the period before new, larger vehicles were introduced.
There is no question that traffic congestion across the entire city is an issue, and this shows up in longer travel times scheduled for these routes. However, a larger component of the increase lies in terminal time that is provided not just for a bio-break for operators, but as padding to attempt better on time performance. (I will turn to OTP and how well the TTC achieves its own goals in a separate article coming soon.)
When Rick Leary was CEO, his stock approach to improved route performance was extra time in schedules, coupled with a “no short turns” edict. The result can be seen in clusters of buses and streetcars at terminals thanks to extra time they do not always require. We can argue about the appropriate amount of terminal time, but there is no question that this factor has grown more than the time actually provided for travel along the route. This translates to extra operator hours that only indirectly provide service to riders to the extent that they might provide less erratic service.
The combined effect of traffic conditions and added terminal time is that capacity actually provided on routes has declined and by a far greater percentage than “getting back to 97% of pre-pandemic service” implies.
On streetcar routes, lower capacity combines with larger, less frequent vehicles to produce wider gaps, and to make any irregularity much more pronounced. We have seen the effect of larger vehicles and longer headways before when the 15m CLRVs were replaced by 23m ALRVs on Queen. The wider headways (arising from a combination of vehicle size and slower operation) succeeded in driving away roughly 1/3 of the demand on 501 Queen at a time when other routes were holding their own. This is a major concern with new streetcars that arrive, even if on time, much less frequently than in the era of shorter cars.
By widening the scheduled gap between streetcars and buses (the “headway”), the TTC has avoided increasing its peak vehicle requirements and staffing.
If the capacity of streetcar routes in peak periods were restored to 2019 levels, the TTC would need 40 more cars in service. On the bus network, considering only the routes analysed here, they would require about 150 more buses. (This will be reduced by the opening of Lines 5 and 6 which will eliminate many buses on routes 32 Eglinton West, 34 Eglinton East and 36 Finch West.) This shows how riders are short-changed by a metric that only looks at vehicle hours, not at how vehicles are used and the capacity they provide.
These increases can be accommodated within the existing fleets. The problem is not vehicle availability, but the budgetary headroom to operate the service.
One can argue that ridership has not fully recovered on all routes, and a return to full capacity would waste resources. What we do not know is how many former and potential riders are lost to the decline in service quality especially when the TTC repeatedly claims it is close to 100% of former service.
Route Metrics
The detailed charts include three metrics:
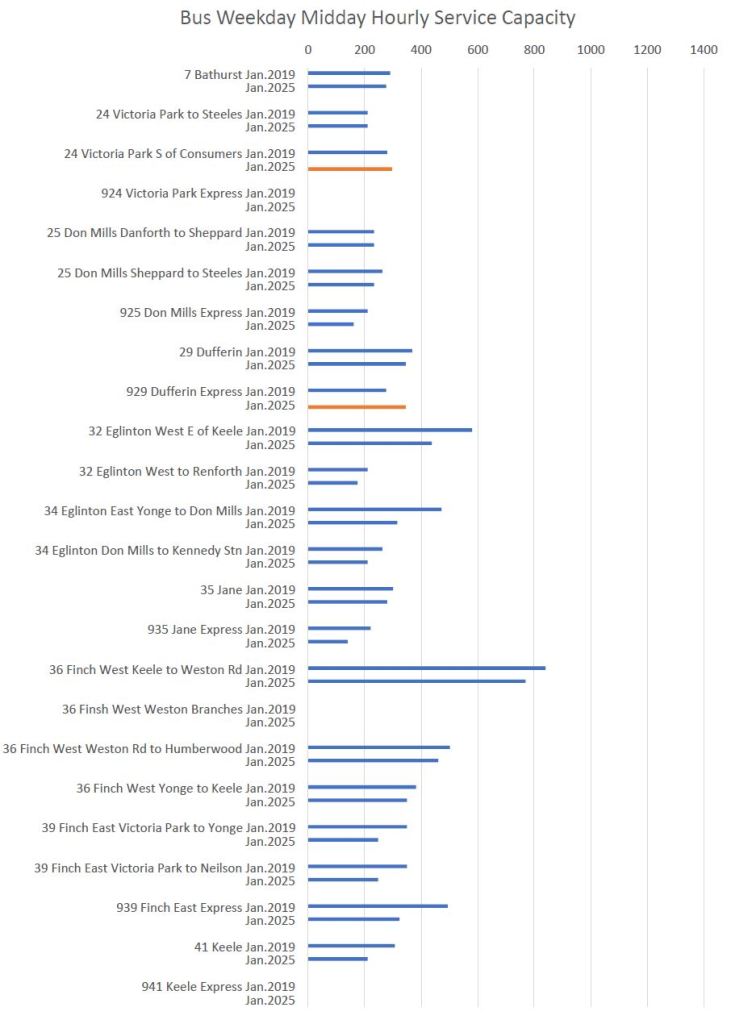
- Route capacity: these numbers are calculated from the scheduled service level and the TTC’s Service Standards for target crowding levels during peak and off-peak periods. This metric directly relates to the quantity of service provided to riders.
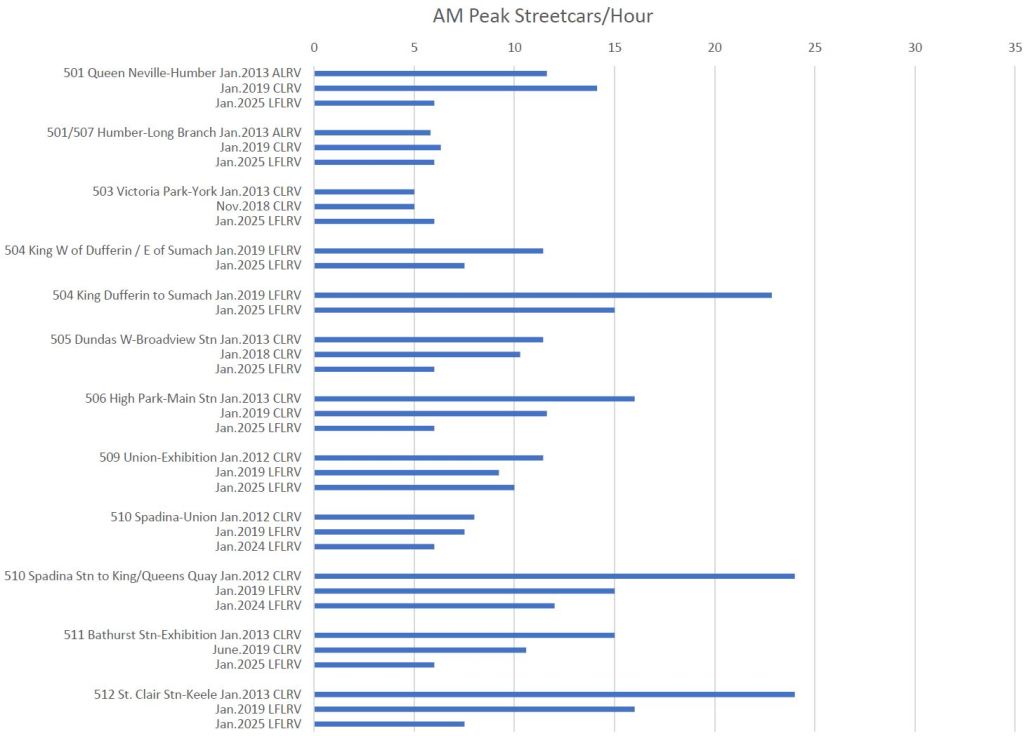
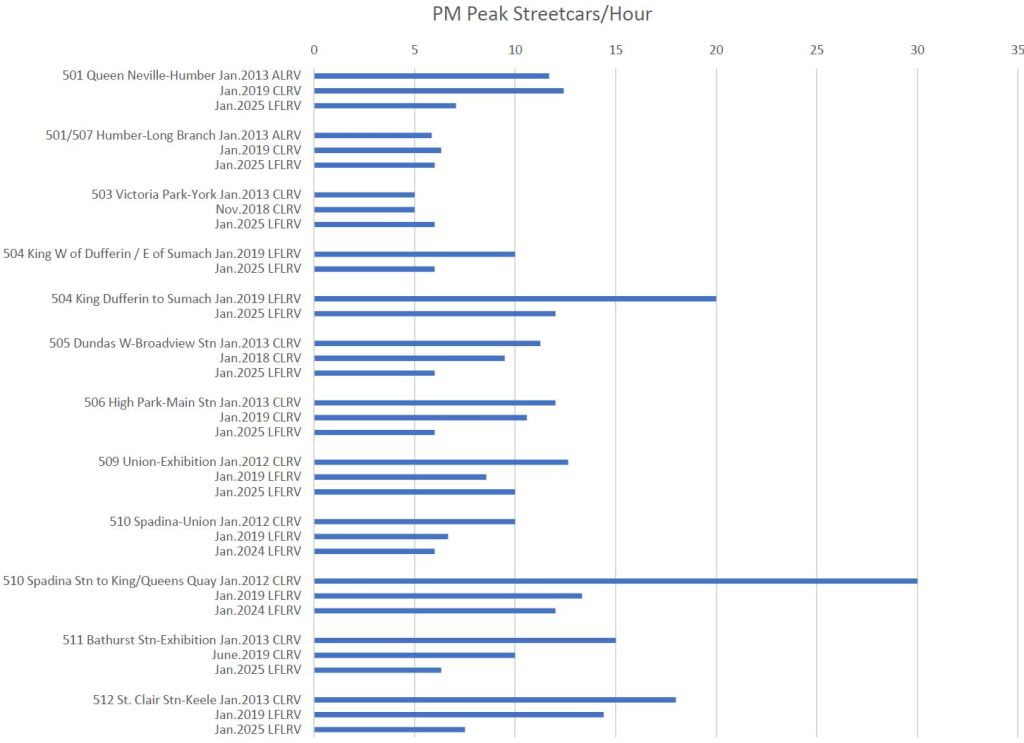
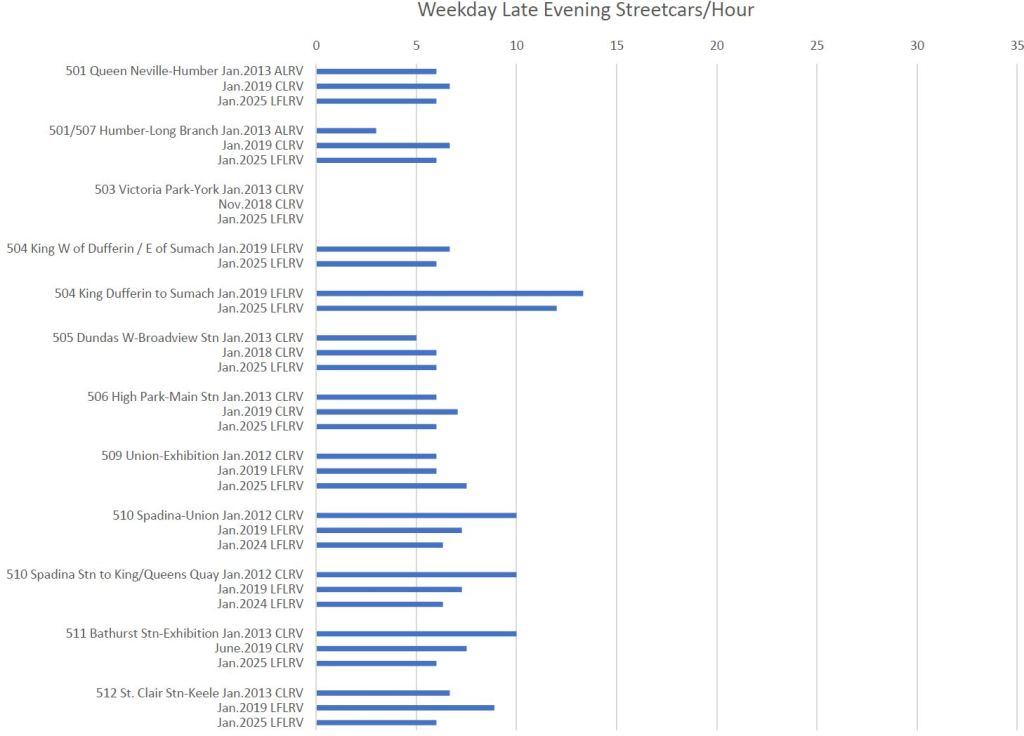
- Vehicles per hour: these numbers show how frequently, or not, vehicles arrive. In almost all cases, service today is less frequent than in 2019 (or for streetcars, also in 2013). This directly affects wait times even if on time performance were not an issue.
- Travel and terminal times: these numbers show how travel and terminal times have grown. The longer the trip, including the terminal layover, the more hours are required to provide equivalent service. In practice, the TTC often stretches headways (the interval between vehicles) to add travel and/or terminal time rather than adding more vehicles to routes.
Streetcar Routes
Charts in this section show the capacity of service operated on the streetcar routes in January 2025, 2019 and 2013. In some cases alternate dates have been used because of diversions or bus replacements that made direct comparisons impossible. The Distillery branch of 504 King did not exist in 2013, and so no comparable data are shown.
The service design capacities, taken from the 2017 version of TTC’s Service Standards, for each vehicle are:
| Vehicle | Length (m) | Peak | Off-Peak |
|---|---|---|---|
| CLRV (standard) | 15 | 74 | 42 |
| ALRV (articulated) | 23 | 108 | 61 |
| LFLRV (low floor) | 30 | 130 | 70 |
In many cases, 2025 route capacity is lower than in former years, particularly on 504 King and 512 St. Clair. At various times, there have been streetcar shortages, even with the new fleet due either to maintenance issues or availability of sufficient operators to cover service. Over time, this combined with the covid riding drop to establish a “new normal”. What is unclear is whether this has permanently altered demand for streetcar routes separate from any work-from-home effects on commuting patterns, not to mention the effect of lengthy bus replacement services for interminable City and TTC infrastructure maintenance.
A few routes, 503 Kingston Road and 507 Long Branch, have higher capacity in 2025 because of the combined effect of larger cars and the 10-minute maximum headway.

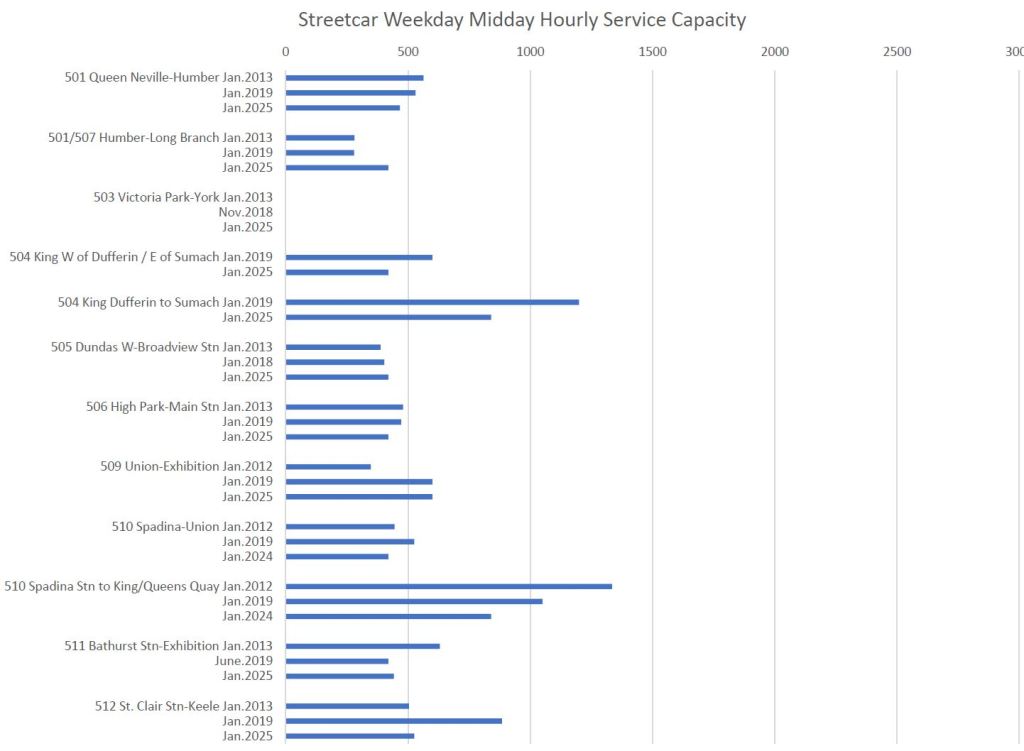


The cars/hour values show the combined effect of changes in vehicle size and the reduction in capacity. 510 Spadina shows the change from CLRVs to the larger Flexity cars between 2012 and 2019. 504 King was already operated with Flexitys in 2019, and the drop in cars/hour by 2025 is due to wider headways and longer travel times.


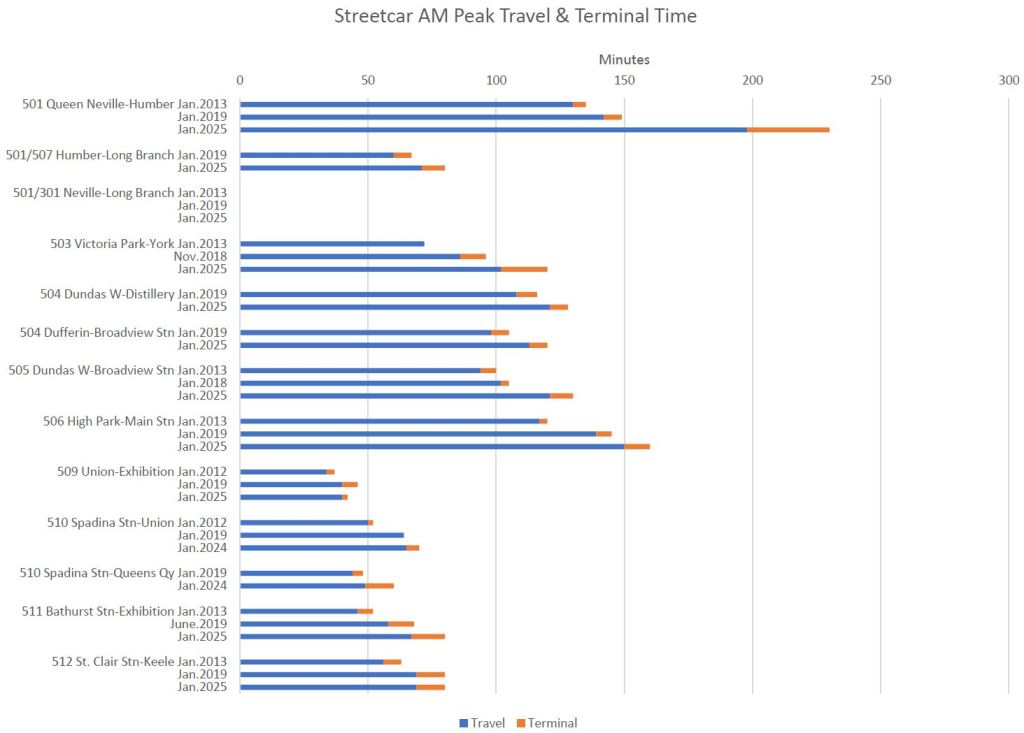
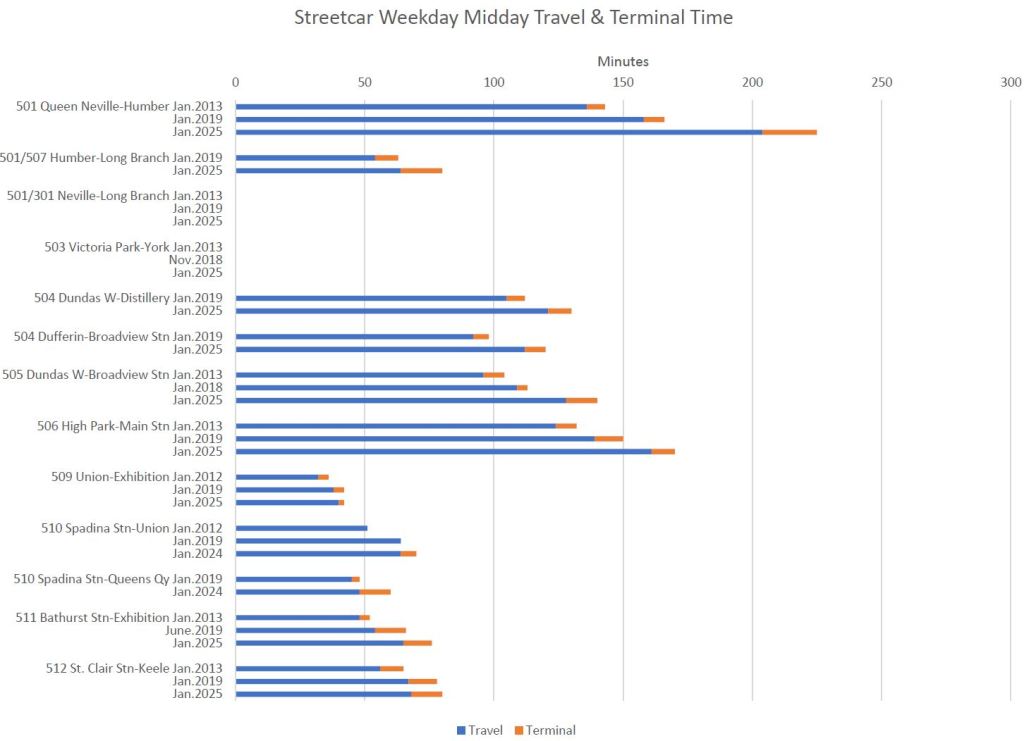
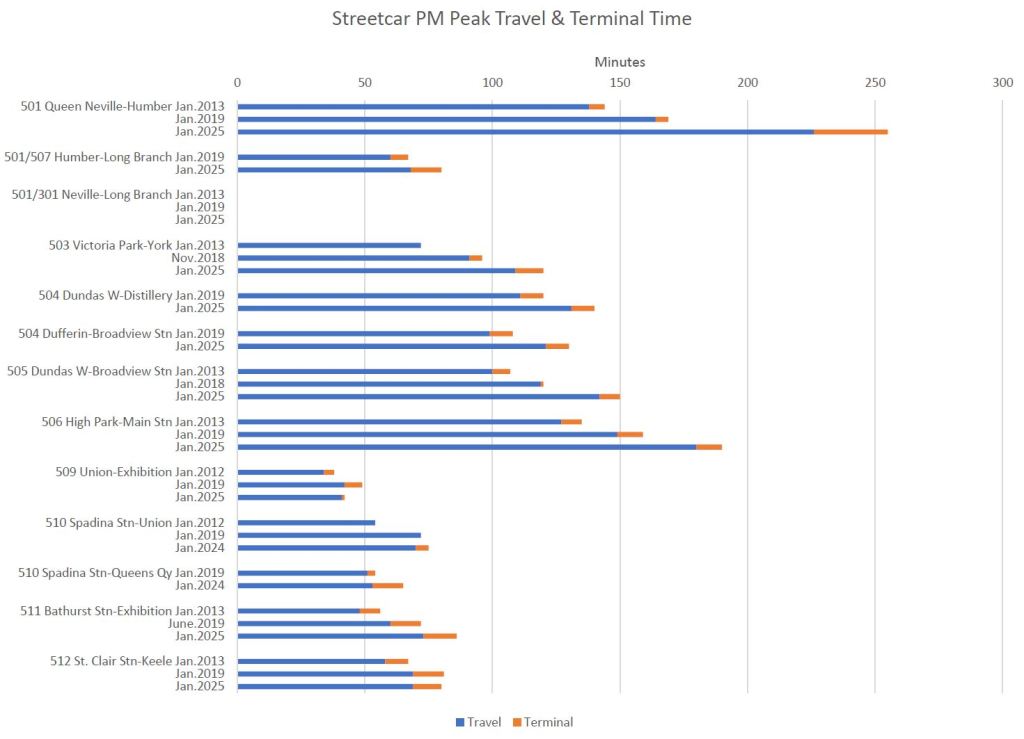
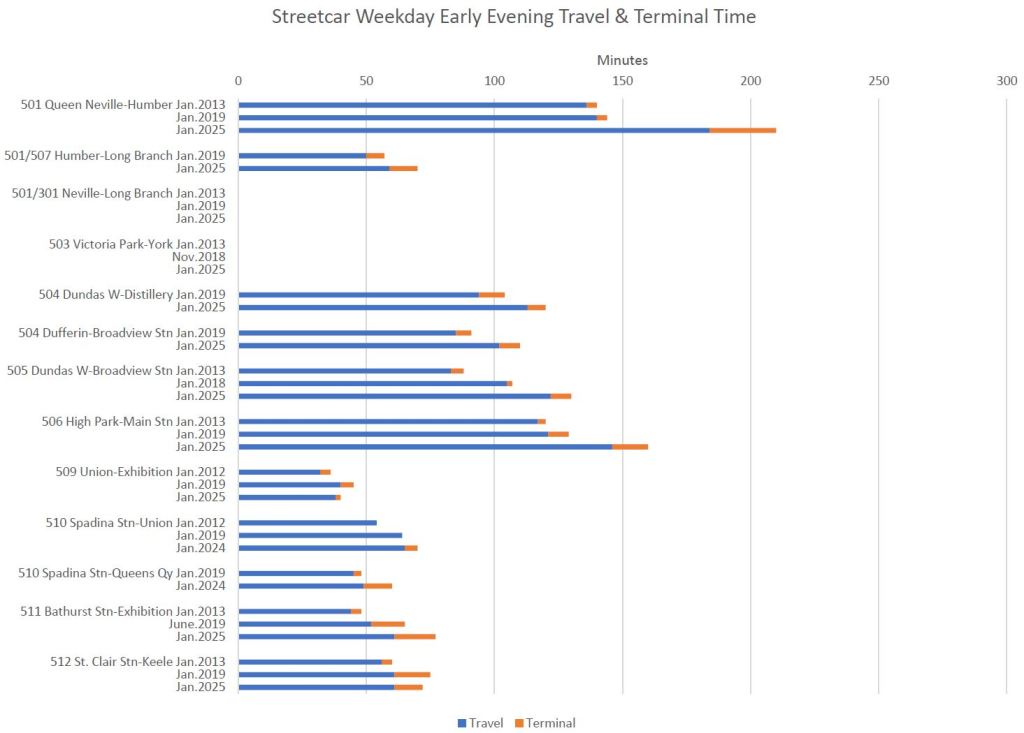
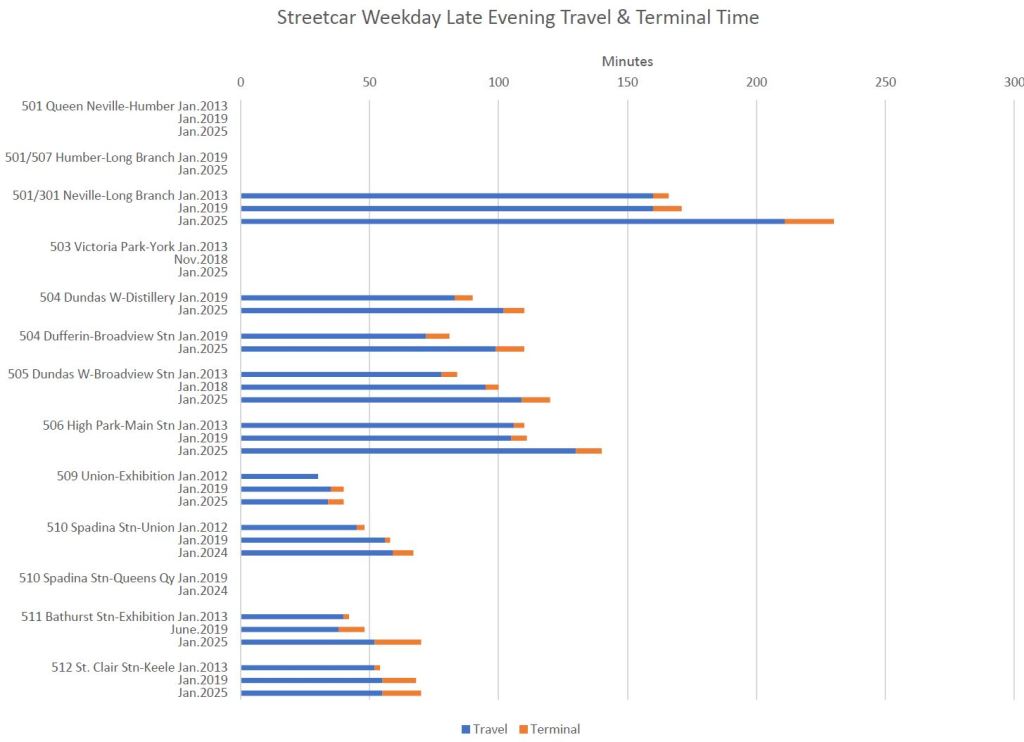
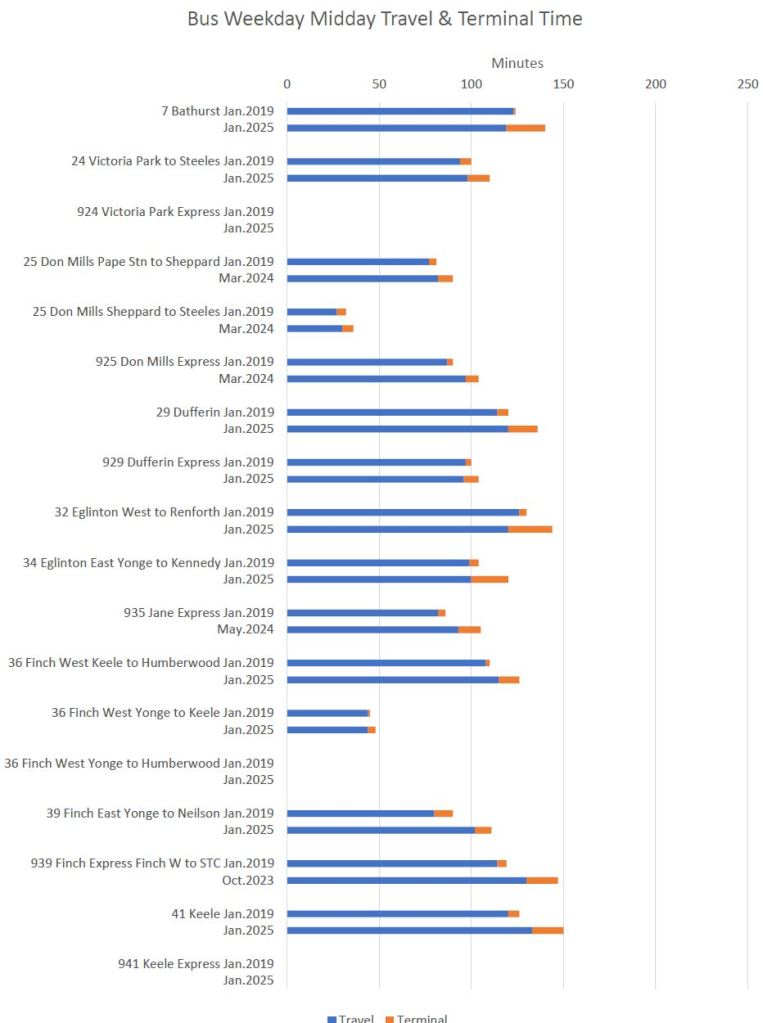
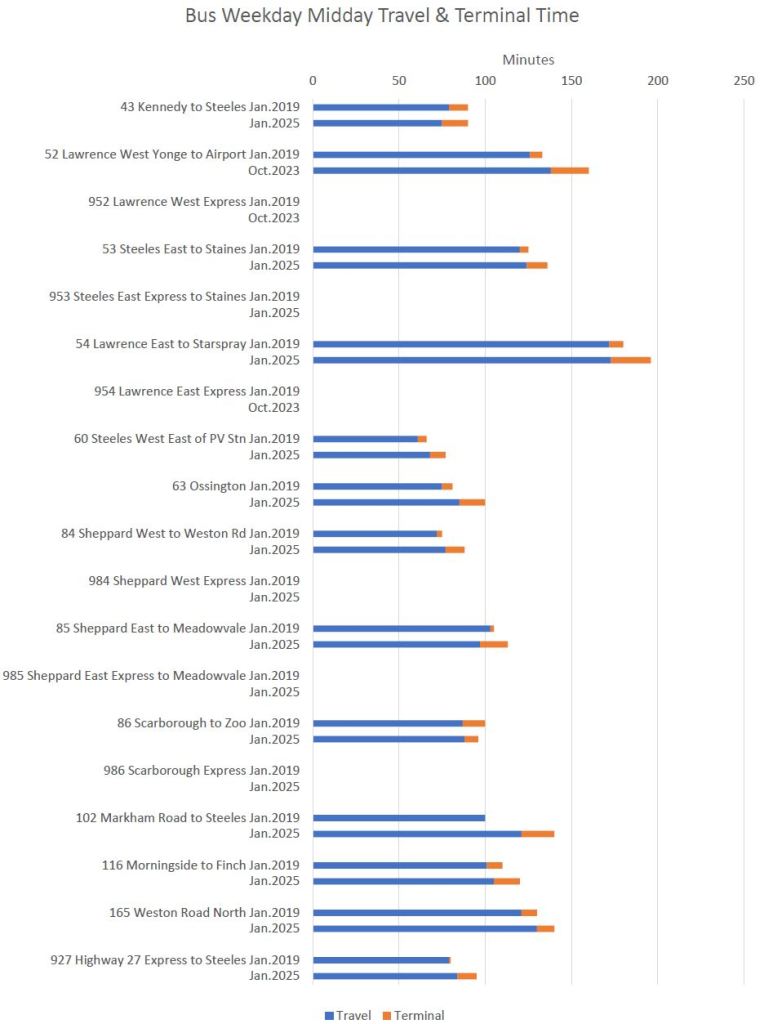
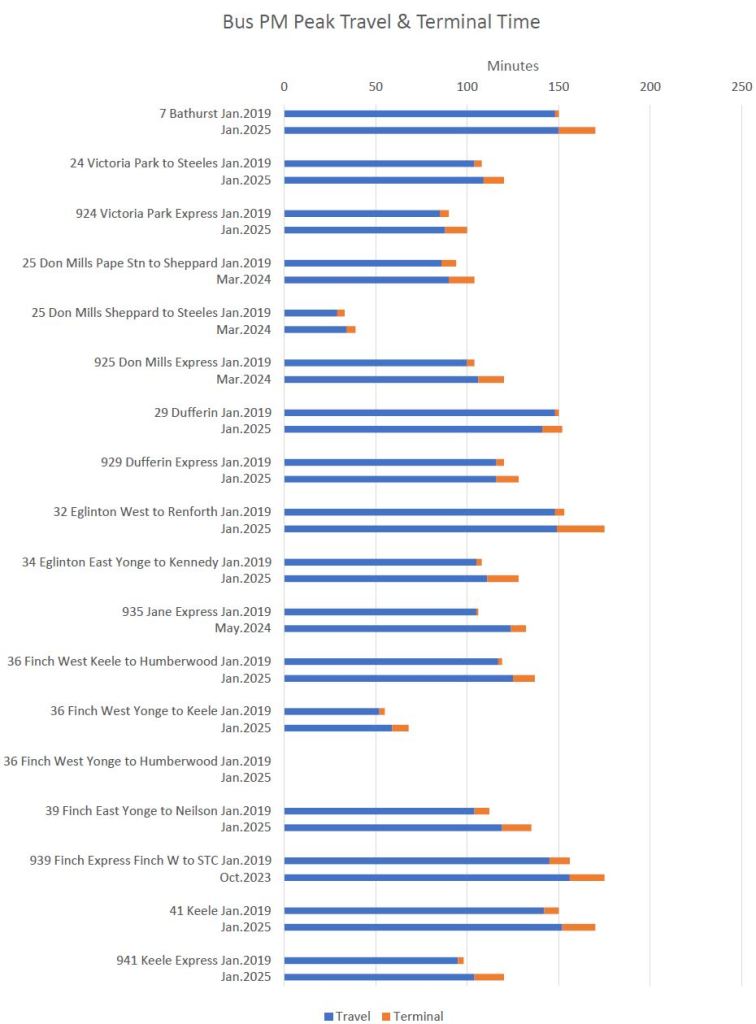
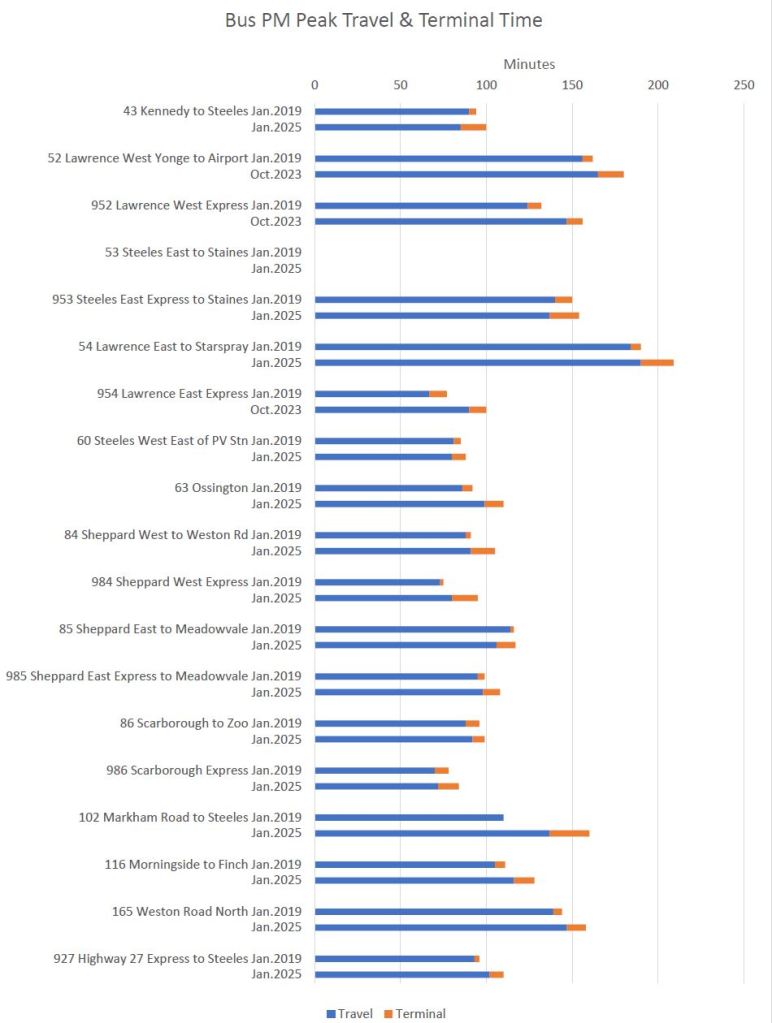
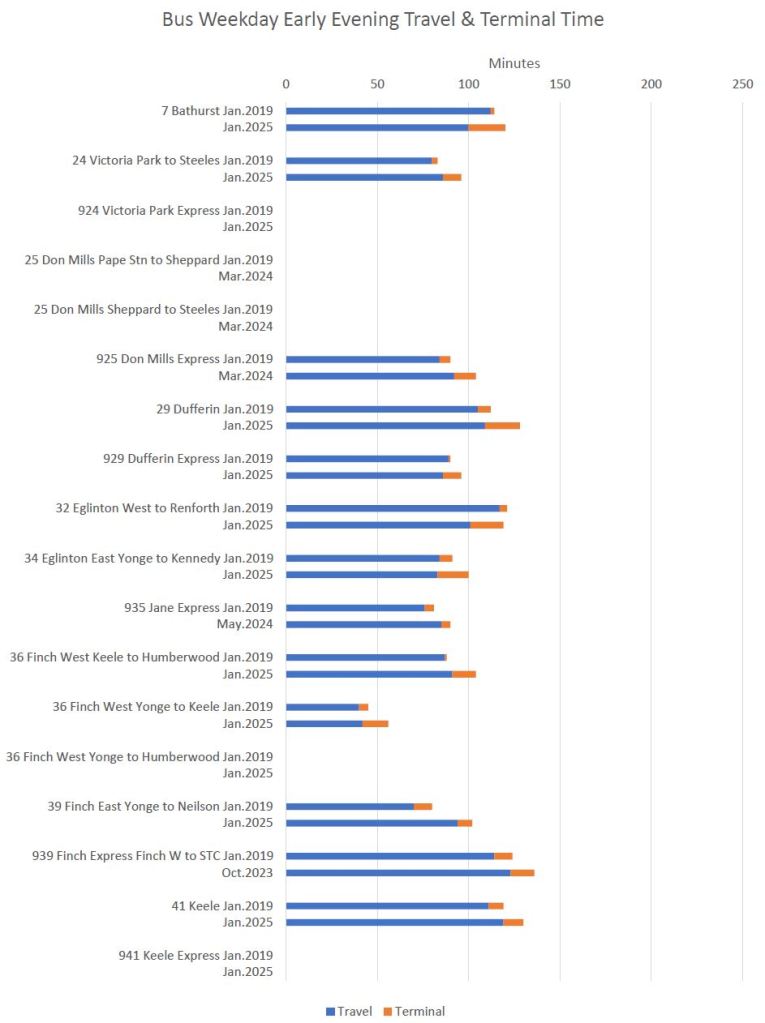
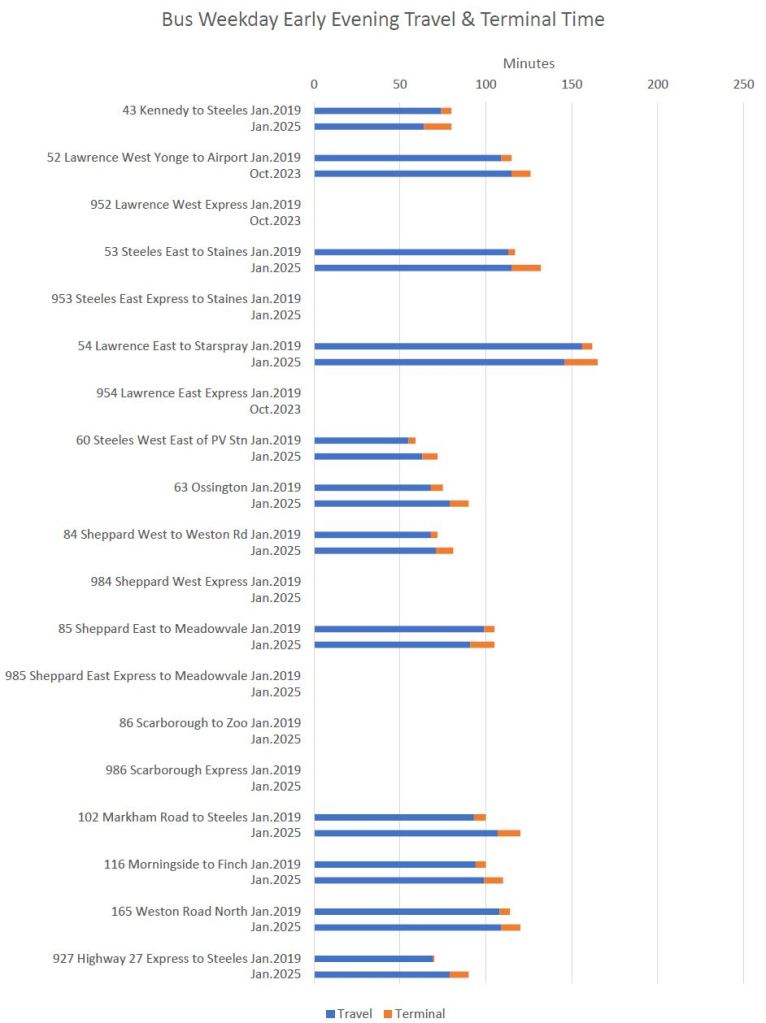
The travel and terminal times shown here are for round trips. Driving time is shown in blue, and terminal time in orange.
The combined effect of increases is particularly evident on 501 Queen for trips between Neville and Humber Loops. Note the substantial growth in terminal time in 2025.
All of the added time between 2019 and 2025 represents vehicle hours that added nothing to service beyond, in theory, stabilization of service levels. However, the benefit of this change was undone in part by reduction in line capacity and a worsened service quality experienced by riders.
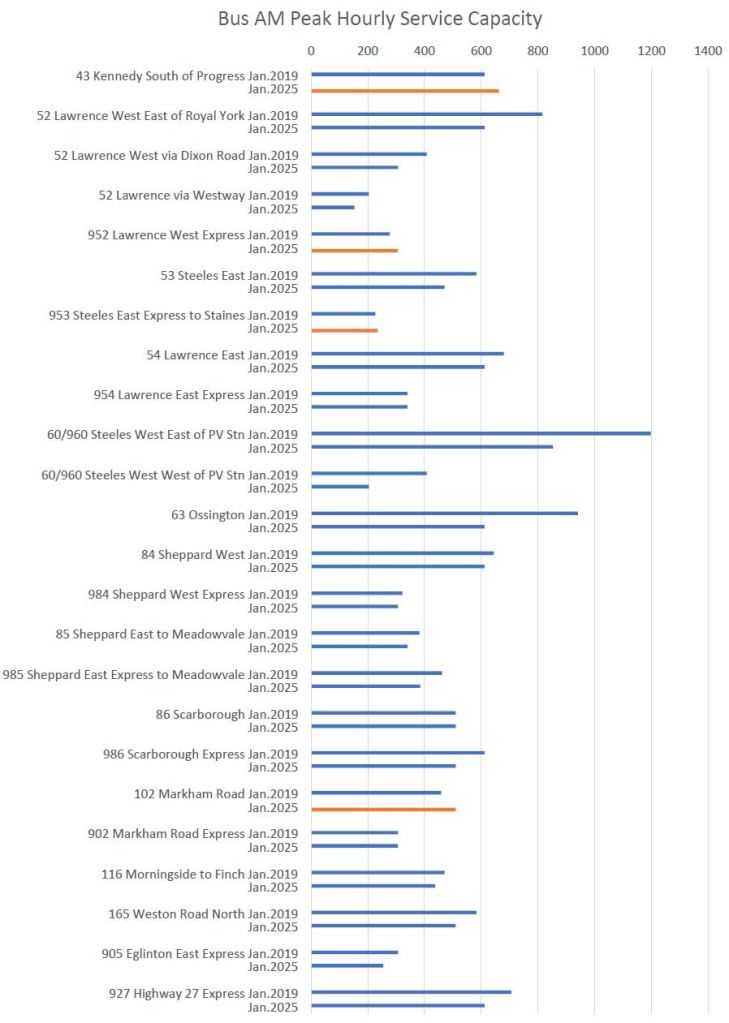
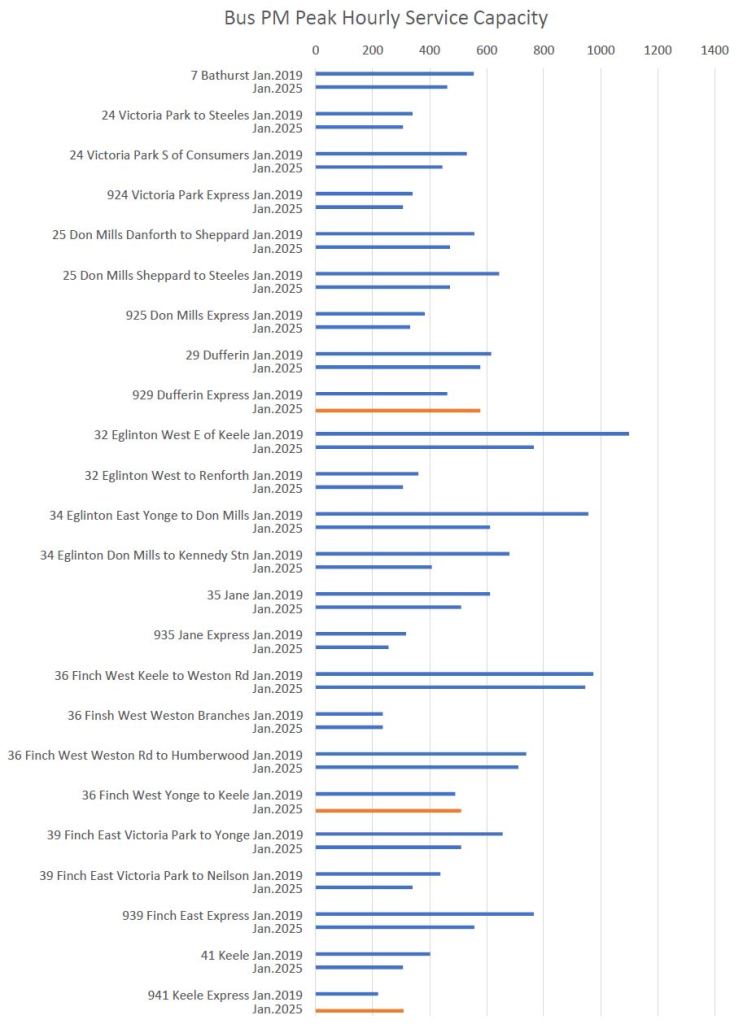
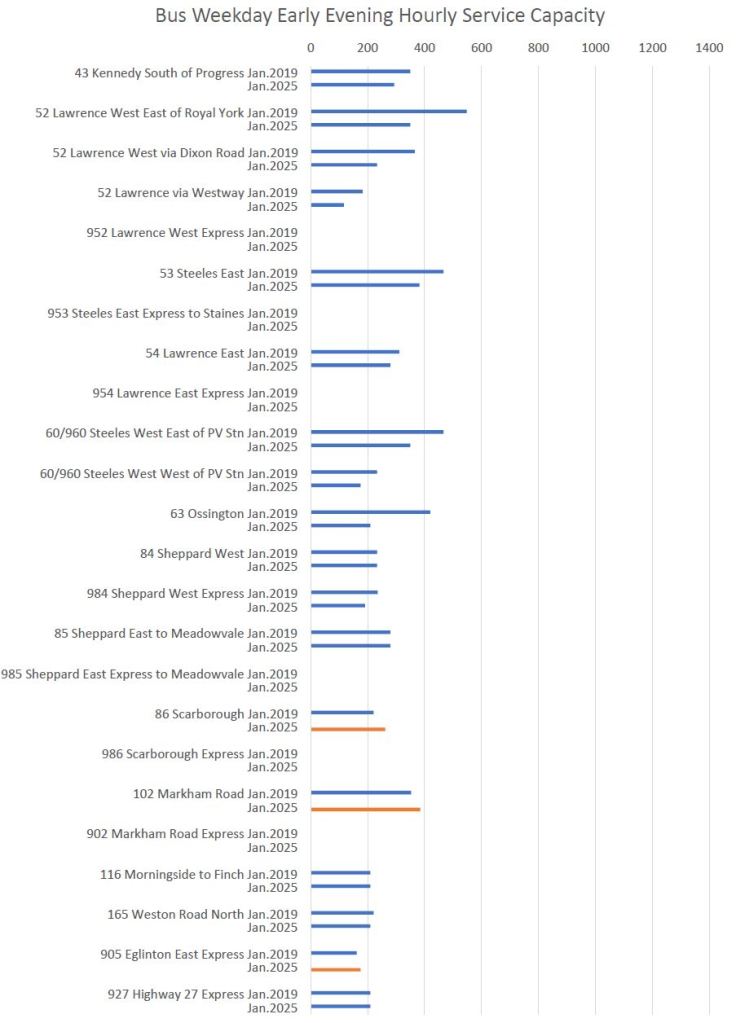
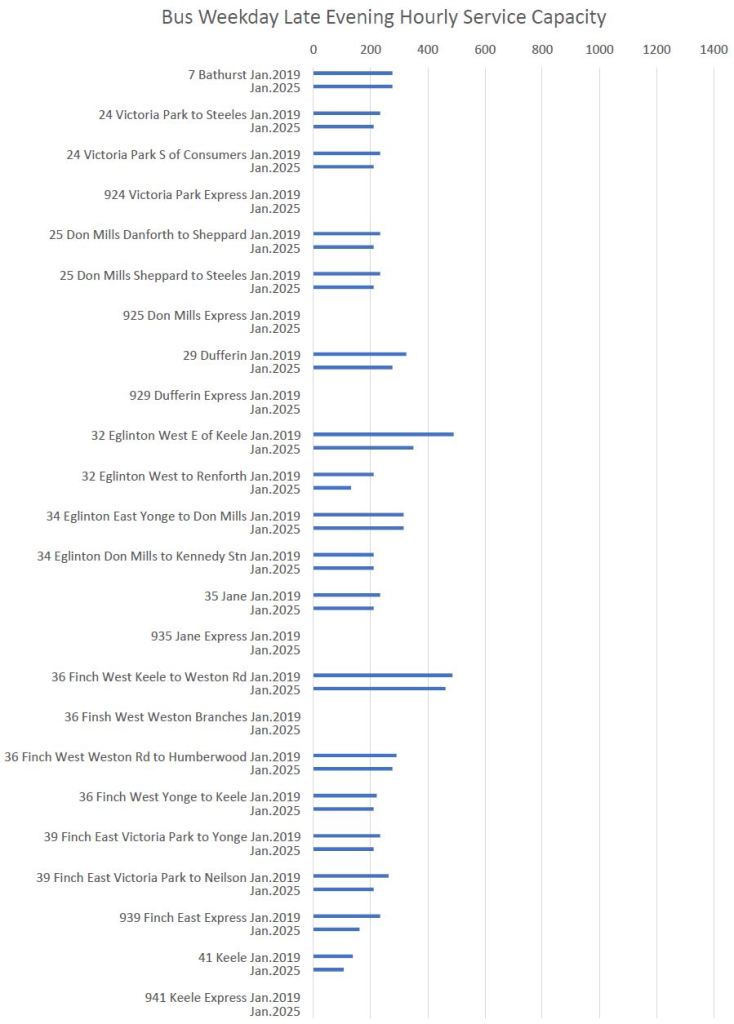
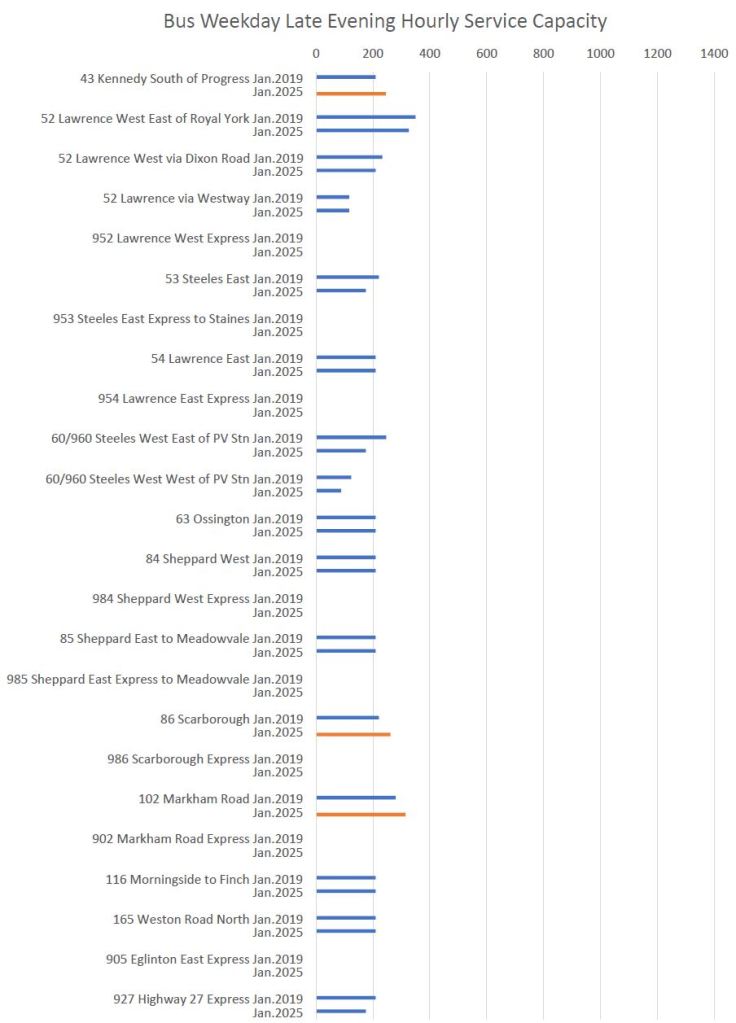
Bus Routes
The charts for bus routes differ from the streetcar charts above in three ways:
- There is no comparable data shown for 2013 as the bus network did not go through a major change in vehicle size during that decade.
- Only routes or corridors with roughly 15,000 daily riders in 2023 are include in the interest of space and the time needed to prepare these charts.
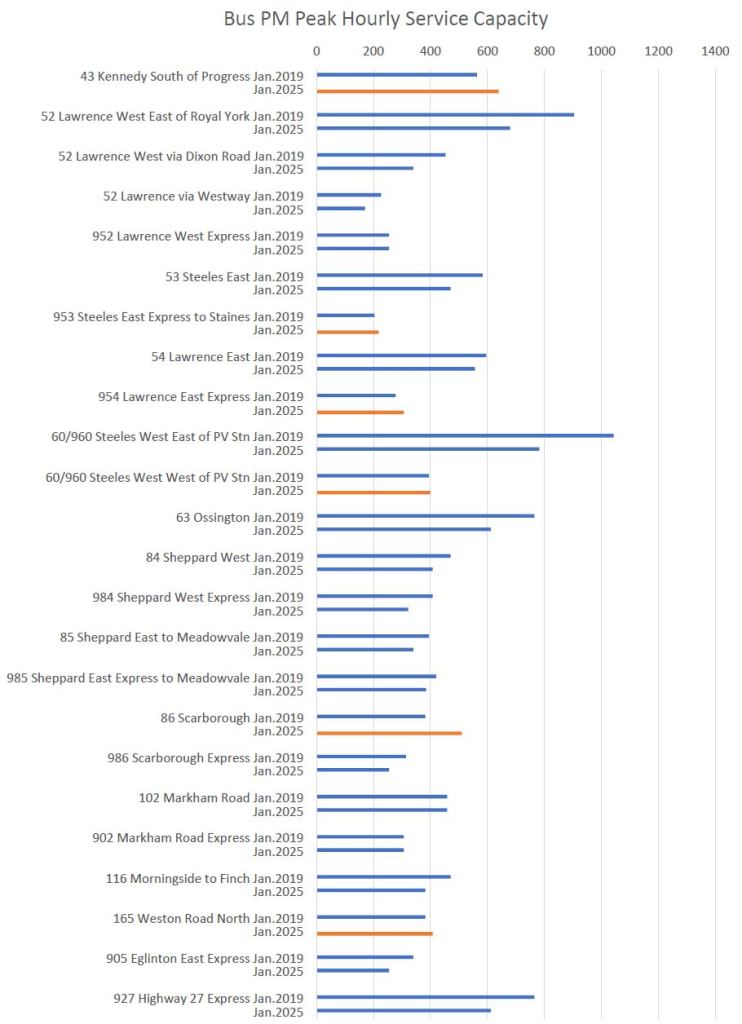
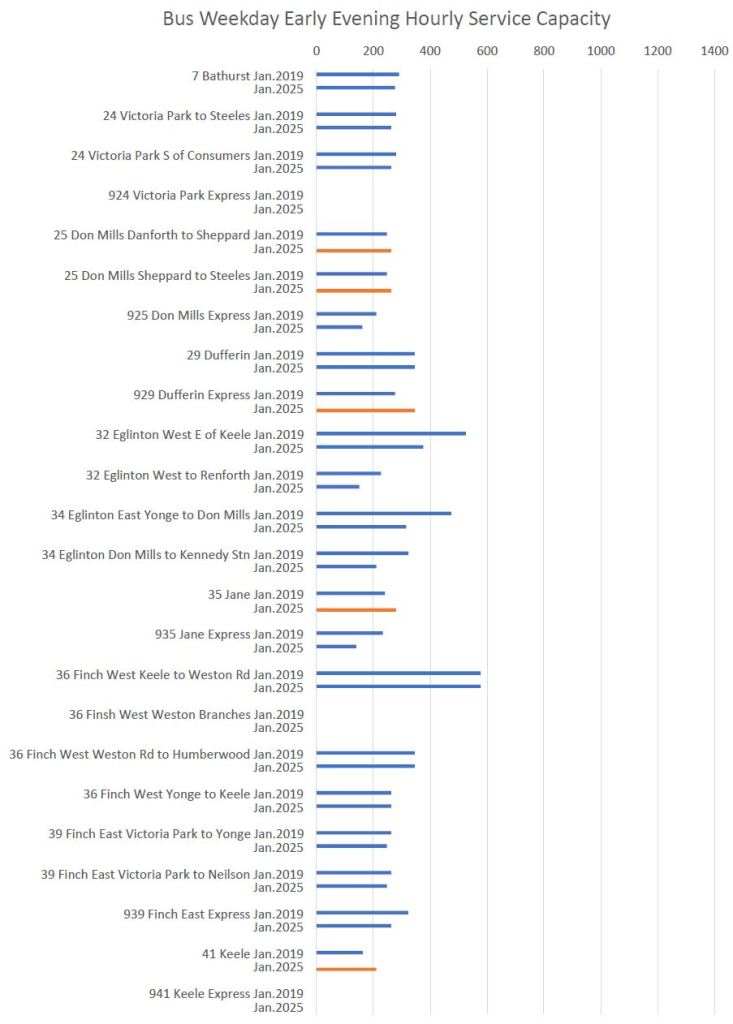
- On the route capacity charts, the handful of cases where 2025 values are above 2019 values are highlighted in orange.
The service design capacities used for the bus routes are, like the streetcars, taken from the May 2017 version of the Service Standards.
| Vehicle | Length (m) | Peak | Off-Peak |
|---|---|---|---|
| Standard Bus | 12 | 51 | 35 |
| Articulated Bus | 18 | 77 | 46 |
Because there are many more routes in these charts, they are spread over two pages for each time period below.
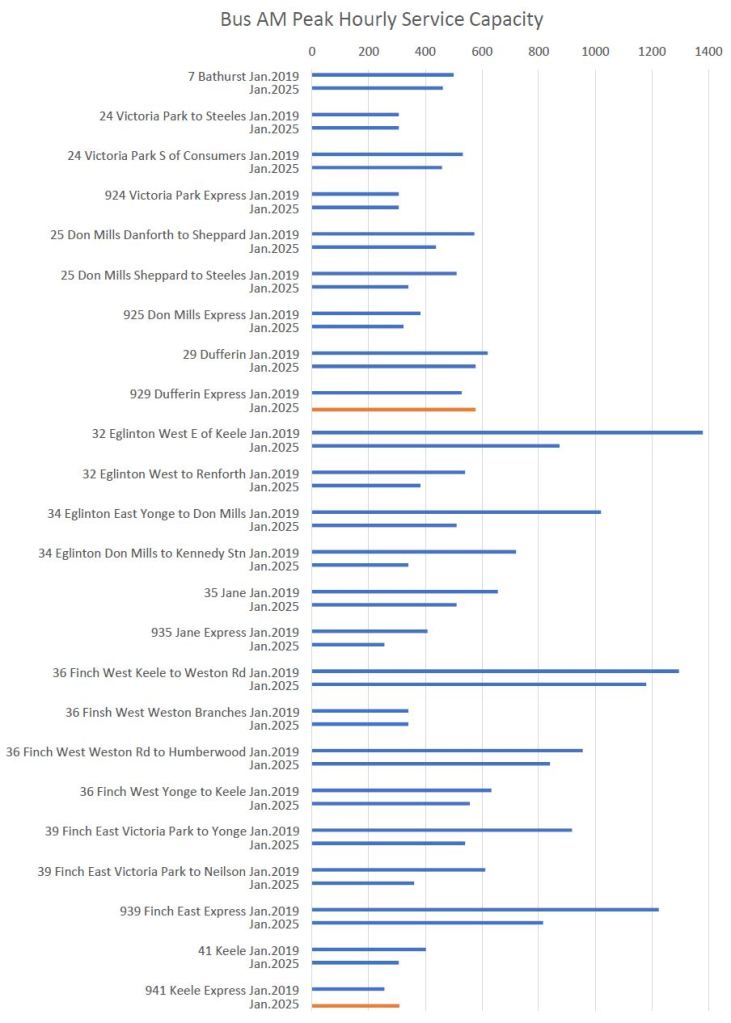
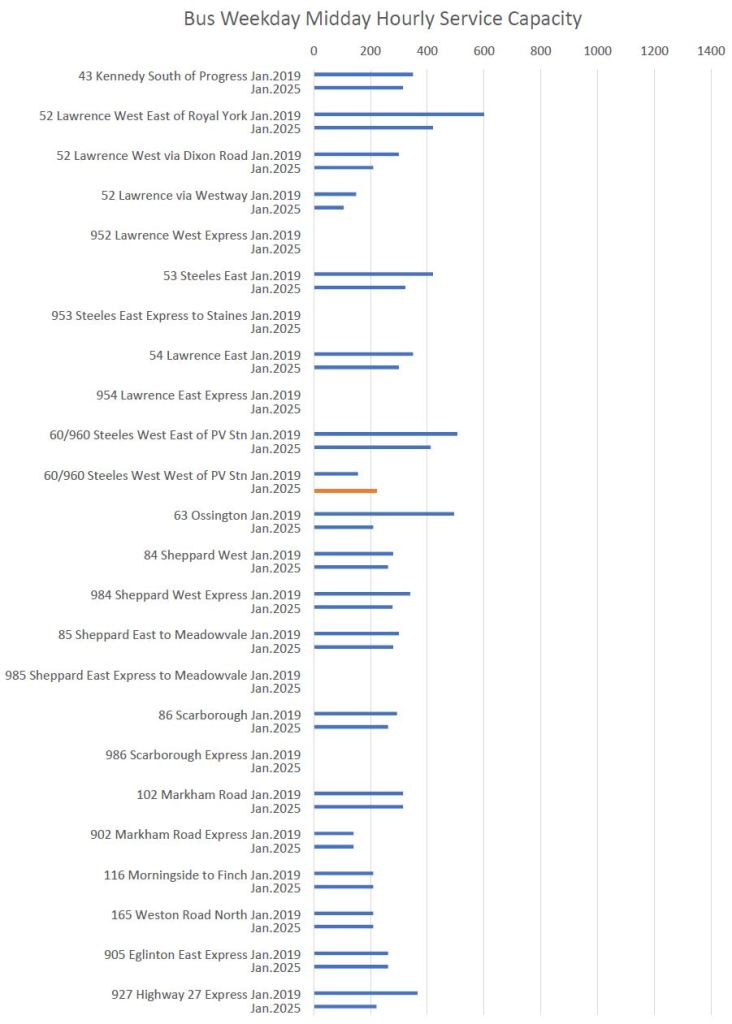
I have not included the vehicles/hour charts for bus routes because they substantially echo the capacity charts as changes in vehicle type were rare. This chart set is available at the end of the article.
The travel and terminal time charts show a similar pattern to the streetcars with longer total times, but with more of the increase going to terminal time rather than to driving time.


Adjusting 2025 Service to 2019 Capacities
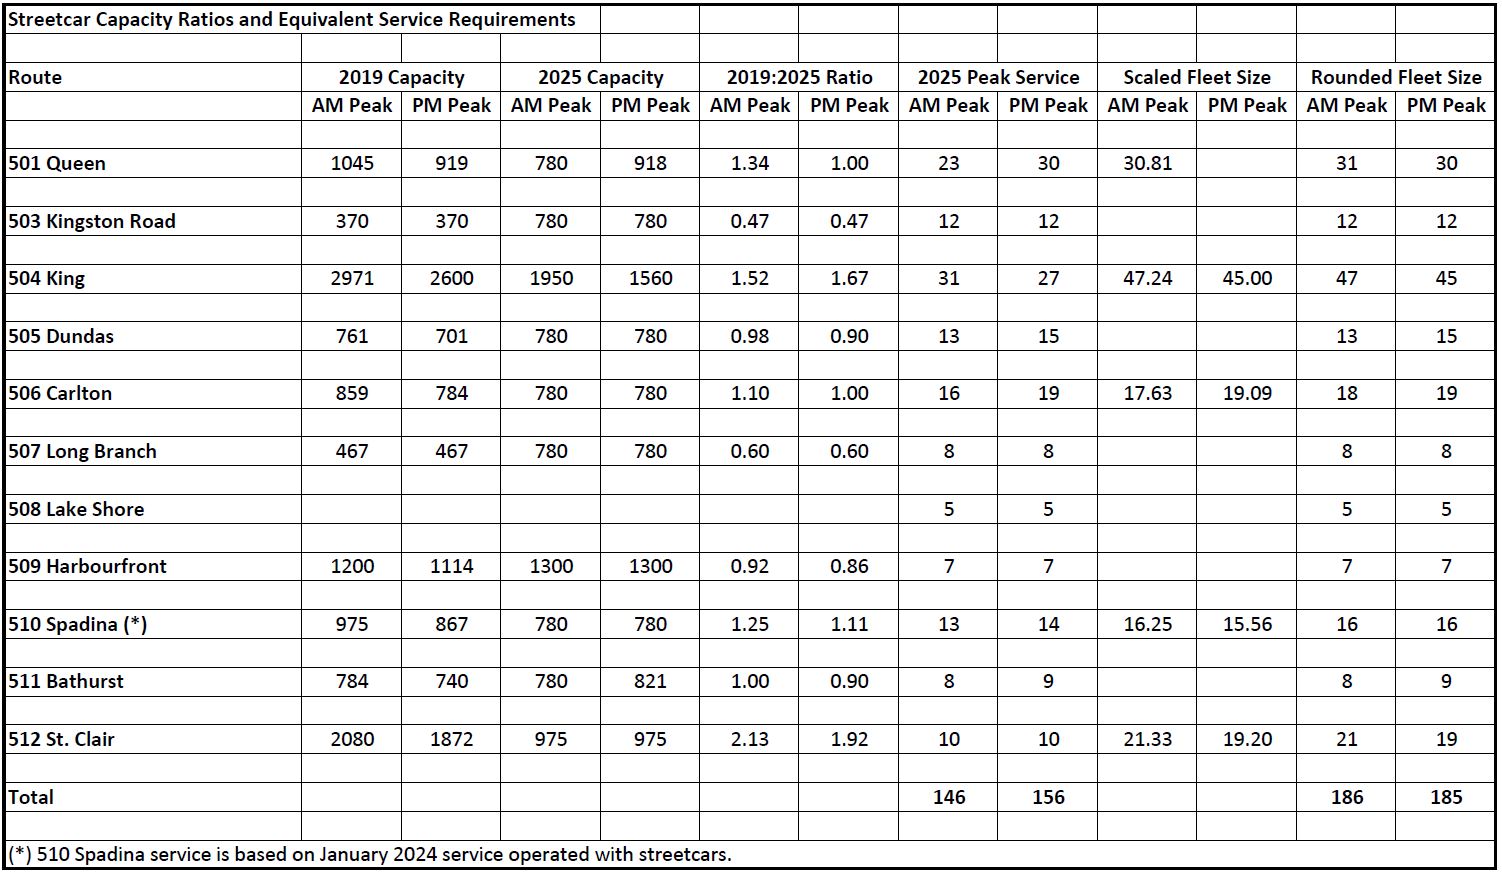
The table below shows the effect on peak service requirements for streetcars based on increasing service on routes where 2019 capacities were higher than 2025 levels. An additional 40 cars would be required in the AM peak, and 29 in the PM peak.
This table assumes that all 500-series routes operate with streetcars at the same time, a condition that has not actually existed for a decade thanks to streetcar shortages and construction projects. Note that a peak requirement for 186 cars can easily be handled by the current fleet of about 230 growing to 264 with deliveries now in progress. The issue is budget headroom to operate service, not vehicle availability.
The following table shows a comparable calculation for the bus routes analysed in this article. About 150 additional buses required in the AM peak, although some major routes (Eglinton East and West, Finch West) will be affected by the openings of Lines 5 and 6 and would not require extra buses. However, this shows how much current service falls short of 100% of 2019 capacity on these routes.
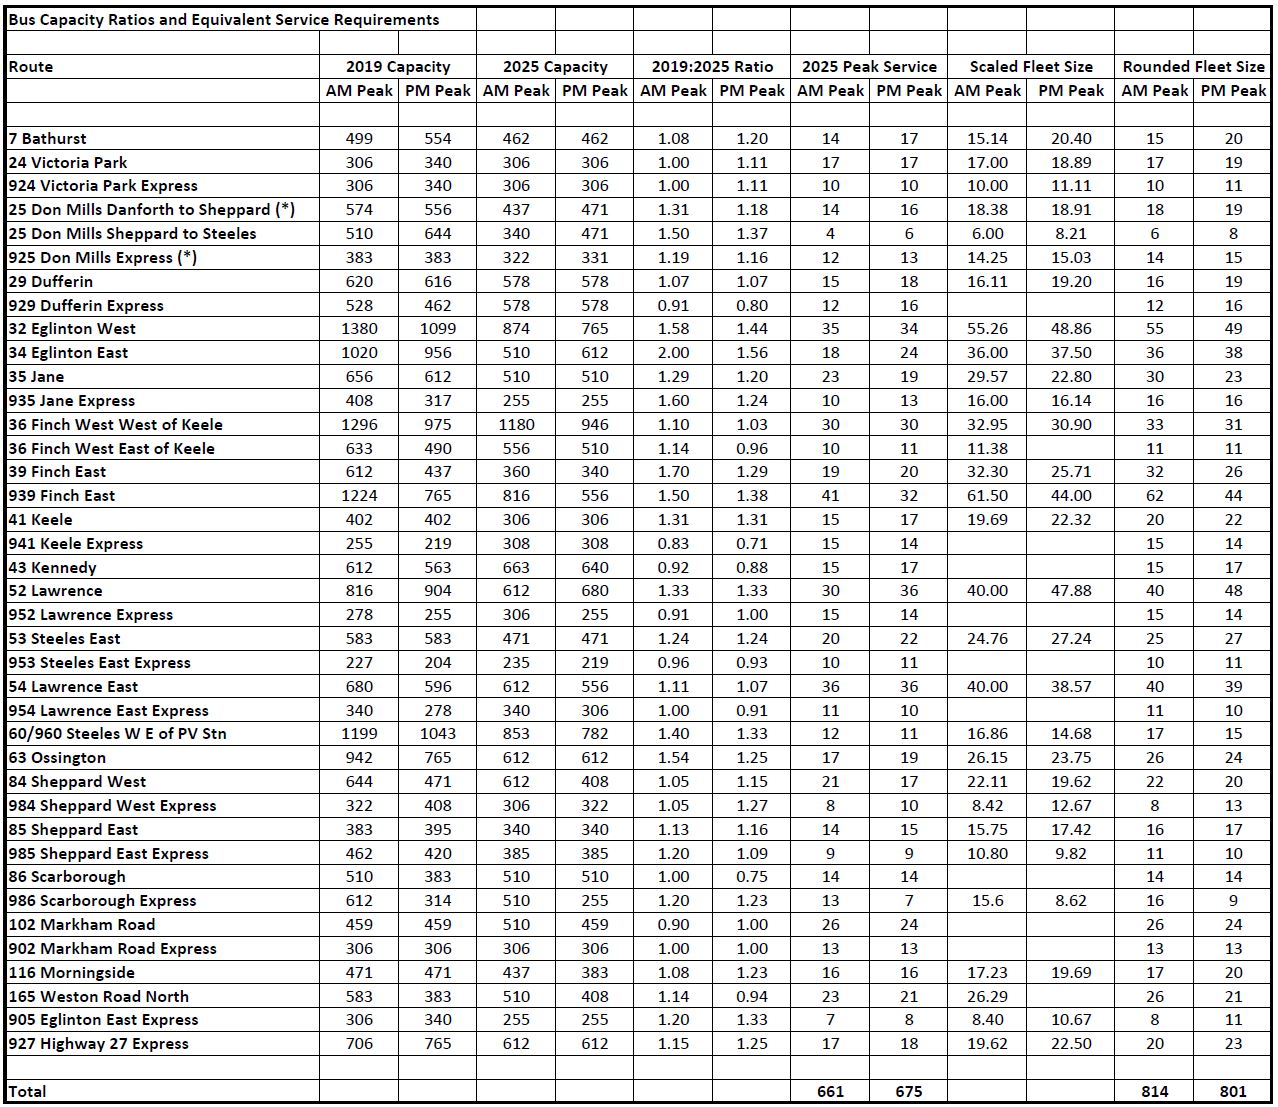
Chart Sets
- Streetcar Routes
- Bus Routes

Absolutely excellent piece Steve. You do much fine work to contribute to the transit discussion in this City, but this is an exceptionally good contribution in so many ways.
Its a clear, easy to understand indictment of service claims made publicly by Commission Management and pols of all stripes over the last many years, that verifies what people have long known, but couldn’t always prove. That the same (or more) money is buying less.
This is something in no way unique to causes that are urban/progressive, but its something uniquely dangerous to causes that seek greater government investment, than the status quo.
A large swath of the public, at any given time, is open to paying a bit more in taxes or re prioritizing some existing dollars. But what they ask is that the money deliver a ‘show me’ result.
When people feel the pinch in their wallet, but transit wait times or capacity improve marginally, not at all, or get worse, they’re less inclined to support the next investment (likewise with Healthcare wait times or those at the Passport Office etc etc.)
Officialdom needs to be held to account that money can’t go into black holes. More investment is required, but so is better use of existing dollars. Terminal times must be ratcheted back down, and some work needs to be done to understand what’s driving longer travel times.
I note with interest the substantial increase in travel time on 510 Spadina, which has seen no increase/decrease in stops, and operates in its own ROW. This would seem to indicate increased dwell time at stops/traffic lights, and I think it would be good to understand why, such that we can get that travel time back down to something more reasonable.
LikeLiked by 1 person
Steve I wish you could show this to council. I think all they hear is that all is fine.
Steve: Many of them read this site, and certainly the Mayor. Stay tuned for more later this week.
LikeLiked by 1 person
Mayor Olivia Chow, “Imagine a city where a commuter … can rely on high quality public WiFi”. She said this right after ending the subway WiFi service that had lasted well over a decade, Olivia Chow is such a HYPOCRITE and this is not limited to the subway WiFi issue.
LikeLike
Perhaps this is underway now, and obviously it’s a complicated issue, but I would love to see the city prepare a report on congestion. No need to invent the wheel, simply look at steps other cities have taken. Traffic wardens, to me, are a helpful step.
Steve: An important issue is that a lot of congestion is not downtown, but all the focus seems to be there. In turn this brings kvetching about streetcars and bike lanes which are not found on most suburban roads.
LikeLiked by 2 people
This reminds me of some graffitti NofBloor on a wall, about TTC = ‘Ford’, as it were, and no, not necessarily Mr. Ford’s fault, but many years of less-good ‘carservative’ mismanagement and relative underfunding. Relative, compared to the myriads of less-transparent subsidies to the private car, which – since it’s budget time – lets refer to the salient fact of merely 1996 (Jan. 10, Globe) where Vancouver found that annual subsidy to be $2700 per car, about 7x more than what was given transit.
One of the external costs is, of course, congestion, where the Globe had a very good editorial yesterday, advocating for road tolls in Toronto and in other large cities, based on the NYC reduction in congestion. No bike lanes were removed, apparently, including ones atop subways.
And yes, a Vehicle Registration Tax is still permitted here, but most of the City seems chicken to poke that bear, somewhat understandable, but it’s unfair to hike property taxes alone, though they’ve been too low for too long, relative to inflation in housing.
LikeLiked by 1 person
Hello Steve:
I read your columns and frequently am moved to “Like” them, but am required to log in to WordPress to do so, which I don’t want to do. So I am writing you this note so you know that you have one more reader who likes your work, and would register her “Like” if she could.
Alice Abbott
Steve: Many thanks.
LikeLike
Further to J. MacMillan’s comment and Steve’s reply: I believe the congestion isn’t the only cause of so much transit woe, but a massive one none-the-less.
New York’s example speaks volumes for Toronto, albeit it may be more difficult to implement in Toronto, for various reasons, but improved transit and congestion control are ying and yang on an improved city commute. And vastly improved neighbourhoods. I immediately think of London UK on that.
Excellent piece Steve.
LikeLiked by 1 person
In Australia, Melborne’s trams run on an average of 15.5 km/h. Toronto’s streetcars run on an average of 10.7km/h. Even if Toronto posted speed limit signs of 30 km/h, Toronto’s streetcars will still be the slowest in the world. It’s not just TTC making all TTC service slow, it’s also the Toronto Transportation Services and the Ministry of Transportation (MTO) rules, regulations, and priorities.
Transportation includes walking, cycling, and public transit. However, both Toronto and Ontario think that transportation is about the single-occupant automobile only. Even traffic signals are set up to give the single-occupant automobile priority over the 200+ inside a streetcar.
LikeLiked by 2 people
Perhaps this is underway now, and obviously it’s a complicated issue, but I would love to see the city prepare a report on congestion. No need to invent the wheel, simply look at steps other cities have taken. Traffic wardens, to me, are a helpful step.
LikeLiked by 1 person
Further to my comment on NYC’s congestion charge, and how transit as well as all traffic is markedly improved as a result: I was just digging on London UK’s, NY and other examples as to how they’re faring, only to read this just up in today’s news feeds:
Obviously the governing/regulatory strata are different, US to Canada, but just like Ford’s chronic interference in Toronto’s affairs (ripping out bike lanes, for instance) the ‘Forces of Chaos’ manifest in remarkably similar ways.
Why London’s tax on driving works—and NYC’s might fail adds even more layers of comparison that are very relevant to Toronto.
LikeLiked by 1 person
Hello from NYC.
Getting Congestion Pricing done here took enormous political will and never-ending attacks from the tabloids (which turned sensible transportation supply-and-demand policy into some left-wing ideology) but man, is it working. It’s working so well you will be hearing about it non-stop later this year.
Congestion pricing is a user fee but a sensible one. Those who pay it get value from faster traffic, and those who don’t benefit from faster buses and Ubers and less honking and gridlock. Plus the city gets a boatload of cash to then spend on transit. Win-win-win.
Toronto can’t do it soon enough. Especially in a city with so much surface transit.
LikeLiked by 2 people
As a current bus operator, Steve, I can tell you that the work we are given to sign hasn’t indicated any improved service. I am still trying to find this improved service they speak of.
Steve: At the Board meeting, there was talk of some changes coming in April, but I suspect the majority of changes will come in the fall to minimize their cost in the 2025 budget year.
Also, no changes would be put into the mill until the budget was passed, just in case the money wasn’t going to be there to pay for them.
LikeLiked by 2 people
Too many commenters are worried about things like traffic wardens, congestion charges, etc.
These were problems in 2019 already and yet we had a faster moving transit system as a whole, even before we had priority lanes on Eglinton for example, and the so-called “TPS” intersections in Downtown for streetcars.
The TTC could fix half the issues they are perpetuating on the public right now by the next board or two if they stopped with all these BS practices that have silently emerged during the pandemic, such as terminal recovery times, slow orders for streetcars, crappy schedules that leave too much/to little times for operators to work on, and the organization’s attempt to normalize permanent subway slow zones in the recent months.
We need to go back to what somewhat worked in the past, instead of looking at pie in the sky solutions like congestion charges that would not fix the organizational rot of policy and operations that runs deep in the TTC.
After Leary, the whole bureaucracy needs to be gutted in my opinion, as many bright minds from the Byford era had cut their ties due to Leary’s toxic workplace culture…
LikeLiked by 1 person
1) Re: the relative capacity on streetcar routes 2013 through 2025.
The Flexitys have a lower “capacity” than CLRVs/ALRVs relative to the length of the car:
CLRV: 74 pax (42 off-peak), 15 m car, 4.9 pax per m of car length (2.8 off-peak)
ALRV: 108 pax (61 off-peak), 23 m car, 4.7 pax per m of car length (2.7 off-peak)
LFLRV: 130 pax (70 off-peak), 30 m car, 4.3 pax per m of car length (2.3 off-peak)
I use “capacity” in quotes because I understand this is a planning or policy-based capacity, not necessarily a physical capacity.
Is this an inherent difference due to the way the interiors of the cars are configured (not possible to fit twice as many riders on a Flexity than a CLRV), or is this a TTC policy decision to accept lower levels of crowding before adding service than they might have in the CLRV era? Maybe recognizing that the CLRV fleet was limited and they had to be more judicious with how cars were allocated than they do now?
If the latter, then “before and after” capacity may not be directly comparable, because it’s no longer about capacity from a practical perspective (how many riders can be transported) — you’re adding another factor (passenger comfort) into the mix.
Steve: The off-peak capacities are based on a seated load. The LFLRVs have a fair amount of standee space in the areas around doorways with provision for mobility devices, bicycles, baby carriages, etc. There is a tension in design and service planning between those who argue for packing in as many people as possible and those who argue for comfort, at least in the off peak. For example, we have been through a few rounds of proposed subway cars with longitudinal bench seating where there would be lots of room, not necessarily comfortable, for standees. The podia over the LFLRV trucks create pinch points for standees and seating areas that are tight for four people.
The CLRV loading standards predate the era when they were short of cars, and so judicious allocation was not the goal. TTC simply cut service to fit the available fleet, and in the end resorted to bus operation. Buses have their own capacity problems because it only takes a few baby carriages or shopping trolleys to completely block circulation within vehicles.
2) For readers that are interested in how service levels have changed, it’s worth looking through the older service summaries that Steve has scanned from his collection (thank you!!). Open one of the service summaries say from the late 80s or early 90s. Look up some of the routes you’re familiar with, and compare the service frequency with what is being run today. Imagine what that older level of service would look like today and how that would shape your experience. (The Carlton car running every 3 minutes in rush hour in 1987!)
LikeLiked by 1 person
The only metric the rider cares about is trip speed. Every other metric contributes to the overall “how long did it take to get to …” If the wait is long, if the vehicle is full, if the vehicle is slow, if the stop is far away – all contribute to that overall metric of “it took me an hour to get from A to B”.
The problem is that no one measures the ability of the system as a whole to provide a user trip. The user trip includes the wait, the speed, the transfer and the walk to and from the system. The lack of a system speed metric is not because it is technically impossible, it’s just inertia of looking at the system the way it’s always been looked at. Ignore the rider’s holistic experience and focus on misplaced micro management.
The conclusion is the measurement system needs a massive re-think and overhaul to provide management with what it looks like from the rider’s perspective. Given those metrics, then management is on the hook to improve the actual experience instead of bs metrics like “service hours”.
LikeLiked by 1 person
Overcrowded buses and lax enforcement of career panhandlers in the TTC. The TTC is fine hassling a college student over a Presto tap error at the fare gates while a career panhandler is right there begging everyone for money who is coming in the station. It seems like the TTC takes a cut of the panhandler’s earnings and grift to make up for the lost tax revenues by not taxing the rich.
LikeLike