
In the monthly CEO’s Report, one of the KPIs (Key Performance Indices) is a measure of the number of short-turned streetcars. This used to be reported as an absolute count, but is now expressed as a percentage of all trips.
Here is the most recent version:
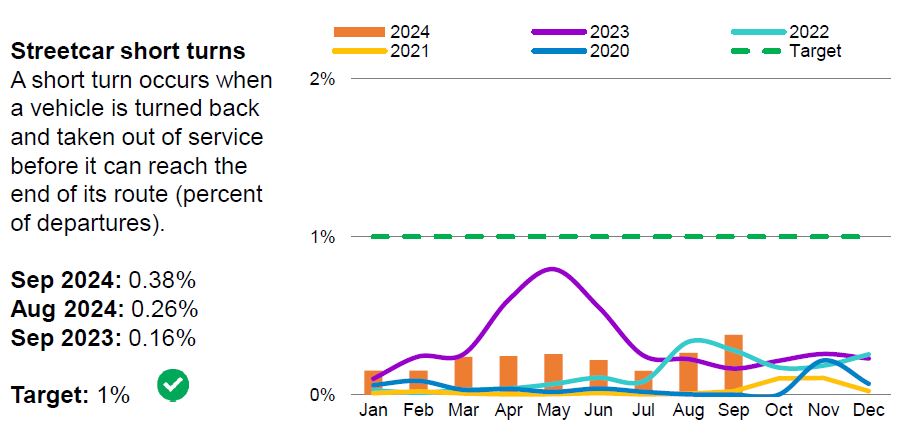
This chart is a fiction born of the Rick Leary era when, in theory, all short turns were banned and the stats were made to fit the objective. Like many KPIs, this suffers from a combination of system-wide consolidation across all routes and time periods, as well as under-reporting of what is really happening.
An easy way to get the true count is to look at tracking data and compare two points on either side of a short-turn location. For example, Woodbine Loop at Queen and Kingston Rd. is a favourite spot for 501 Queen and some 503 Kingston Road cars to turn back. Counting the number of vehicles crossing Coxwell (west of the loop) with the number at Woodbine Avenue (east of the loop) shows how many cars did not travel east of Kingston Road and, therefore, were short-turned.
The TTC claims that they better their 1% target for trips short turned, but it is clear that they rarely achieve this. In some cases, the value rises above 20% indicating that although much service does get to the terminal, there is a good chance that a rider will encounter a short turn. This is separate from frustrations caused by gaps and bunching.
Short turns happen for many reasons including traffic congestion, too-tight schedules, service blockages for collisions, medical problems, parades … it’s a long list. Riders really don’t care. The basic point is that service they expected to receive is not there, and usually with no advance warning.
The table below summarizes the statistics from the vehicle tracking records in November 2024 for the period from 6am to midnight. It is clear that even on an aggregated level, the proportion of short turns is much higher on these routes that the TTC KPIs indicate.
Updated Dec. 6/24 at 1:30pm: Short turn counts for 504 King eastbound, 507 Long Branch and 508 Lake Shore westbound trips added.
Note: The legends on the original charts in this post were misleading. They have been changed to better reflect what the columns and lines on the charts represent..
| Route | Location | Total Trips | Short Turns | % Short Turns |
|---|---|---|---|---|
| 501 Queen | Woodbine Loop EB | 3547 | 198 | 5.6% |
| Roncesvalles WB | 3537 | 247 | 7.0% | |
| 503 Kingston Rd | Woodbine Loop EB | 3252 | 136 | 4.2% |
| 504 King | Spadina WB | 6453 | 256 | 4.0% |
| Roncesvalles WB | 3275 | 364 | 11.1% | |
| Church EB | 6319 | 126 | 2.0% | |
| Parliament EB | 6198 | 204 | 3.3% | |
| Dundas EB | 2943 | 71 | 2.4% | |
| 505 Dundas | Parliament EB | 3040 | 212 | 7.0% |
| Lansdowne WB | 3062 | 397 | 13.0% | |
| 506 Carlton | Coxwell EB | 3031 | 293 | 9.7% |
| Lansdowne WB | 3256 | 572 | 17.6% | |
| 507 Long Branch | Kipling WB | 2074 | 88 | 3.0% |
| 508 Lake Shore | Kipling WB | 193 | 19 | 9.8% |
| 512 St. Clair (*) | Lansdowne WB | 2068 | 249 | 12.0% |
| Oakwood WB | 2113 | 122 | 5.8% |
(*) For 512 St. Clair, only data from November 14 onwards when streetcar service was restored are included.
Continue reading