
Back in September, I wrote about the gap between the TTC’s claims of service coming back to pre-pandemic levels and the actual service riders face in their daily travels. See:
I will not repeat all of the information in that post, but we are coming into budget season and the most current info should be available for debate.
When the 2025 budget comes out, we will hear much about service recovery including the obligatory photo op with the Mayor, TTC Chair and other worthies. This will be a sham because actual service today has not been restored to early 2020 levels.
The fundamental problem with TTC claims is that they measure “service” by hours for the simple reason that the primary driver of costs is the labour associated with driving vehicles. Some costs don’t actually vary with driving time, but these are generally a smaller component of the total. (For example, some costs vary with mileage, and others such as garaging are per vehicle.) For budget purposes, the variable that counts is hours.
When comparing pre- to post-pandemic service levels, one hour of vehicle operation does not necessarily provide the same amount of service as in the past. The primary reasons for this are:
- Buses and streetcars run more slowly today than in early 2020 due to a combination of traffic congestion and operating practices (notably the pervasive slow orders on the streetcar system).
- More recovery time is included in schedules to reduce short turning. The premise is that if there is enough padding, vehicles will rarely be late enough that they must turn back before reaching their terminals.
The combined effect is that more vehicles (and hence vehicle hours) are required to provide the same service on many routes today compared with early 2020.
I have tracked the changes in operating speed on various routes in past articles, and will return to that subject to refresh the charts in coming months.
A related problem for riders is that thanks to uneven service (gaps and bunching), the average wait for a transit vehicle can be considerably higher than the advertised headway. TTC reports “on time performance” only at terminals where service tends to be (but is not necessarily) close to schedule. The information is averaged over many routes and all hours of the day, and bears little relevance to a rider at a specific bus stop at a specific time.
I will turn to the problem of experienced vs advertised wait times in a separate article now in preparation.
The remainder of this piece updates the September charts with planned service hours by mode to the end of 2024, and a comparison of service levels by route and time of day in January 2020 versus November 2024. PDF versions of the chart sets are provided at the end.
Service Hours
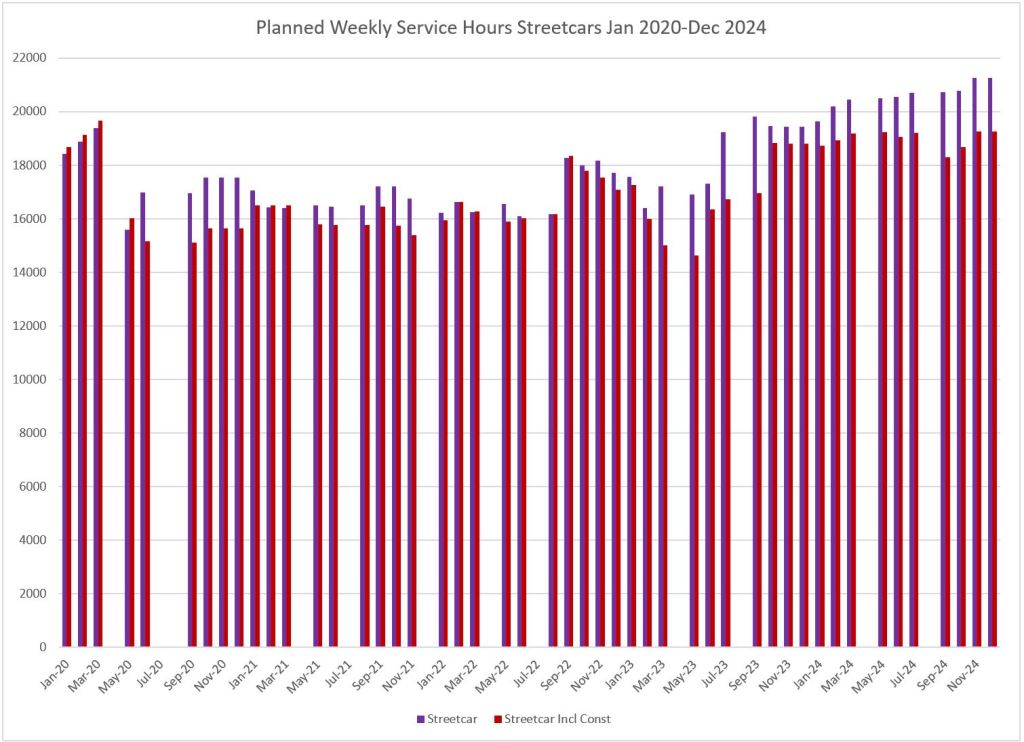
The charts below show the planned service hours per week for the three TTC modes: bus, streetcar and rapid transit. Several points of note:
- For buses and streetcars, values are shown without and with the effects of construction. Bus values tend to go up, in part because of replacement service on streetcar routes. Streetcars tend to go down when construction is included because service from the streetcar barns is lower than it would be if all routes operated normally.
- Bus hours dominate the total of all service sitting at about 140-150k/week compared with 18-19k for streetcars and 14k for subway.
- There is a decline in bus service in 2020 corresponding to the pandemic shutdowns, a rebound in a period of false hope in early 2021 that the worst was over, and then slow growth to late 2024.
- Streetcars show a similar pattern of cutbacks and recovery. Bus replacements and diversions have bedeviled the streetcar network for much of the past five years.
- On the rapid transit chart, the demise of the SRT appears in September 2023 although the line actually closed in late July. The service into September was planned, but never operated.
- The yellow bars show combined service hours for Lines 1 and 4 as they share carhouses and their hours are reported together.
- The yellow bars drop in fall 2022 corresponding to the implementation of OPTO (One Person Train Operation) on Line 1. Line 4 was already running on this basis in early 2020.
- Weekly hours on both Lines 1/4 and 2 remain below early 2020 levels.

The table below compares January 2020 and November 2024 weekly values by mode. Surface modes are above 100% of January 2020 values. The subway is at 90% when compared on an equal footing allowing for the change to one-person operation on Line 1 in 2022. These numbers look rosy, but the actual service provided is another story.
| Mode | Jan 2020 | Nov 2024 | Ratio |
|---|---|---|---|
| Bus | 145,090 | 150,462 | 104.9% |
| Bus incl construction | 151,935 | 160,309 | 106.7% |
| Streetcar | 18418 | 21,250 | 115.4% |
| Streetcar incl construction | 18672 | 19,268 | 103.2% |
| Lines 1/4 subway (Unadjusted) | 13,307 | 6,054 | 45.5% |
| Line 2 subway | 8,375 | 7,493 | 89.5% |
| Subway total (Unadjusted) | 21,682 | 13,547 | 62.5% |
| Line 1/4 adjusted for OPTO | 6,654 | 6,054 | 91.0% |
| Subway total adjusted for OPTO | 15,029 | 13,547 | 90.1% |
Source: TTC Board Period Memos (not available online)
Scheduled Headway Comparisons
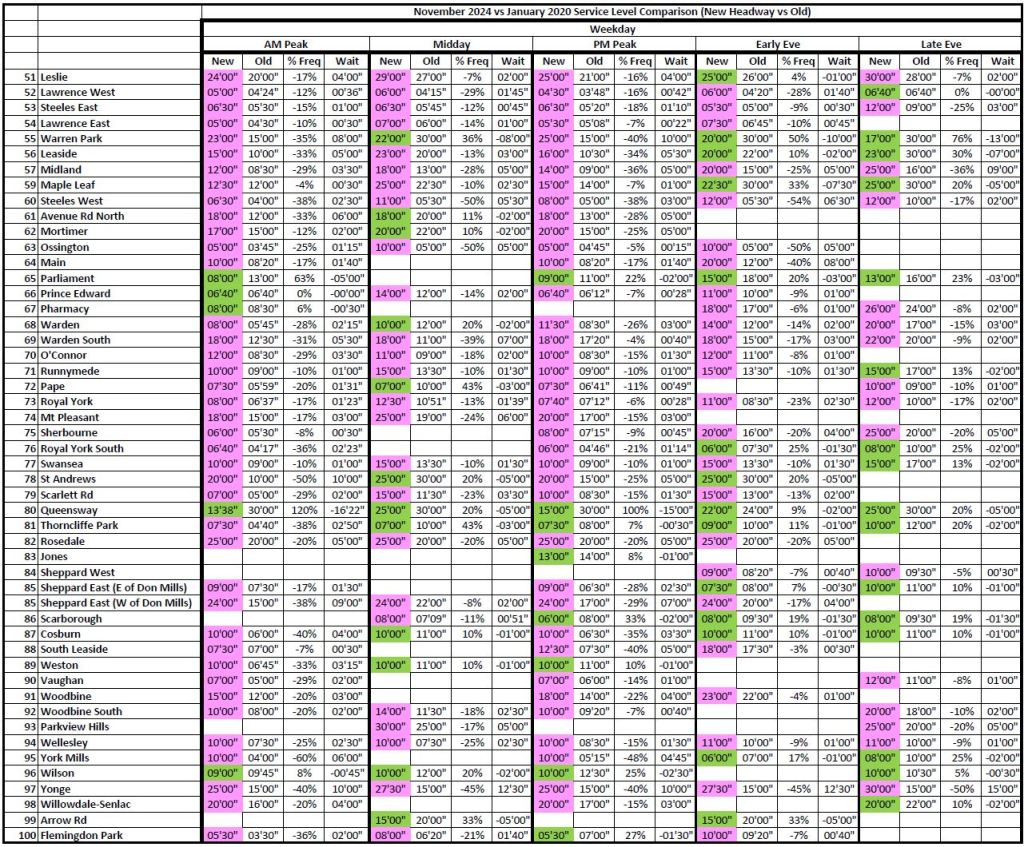
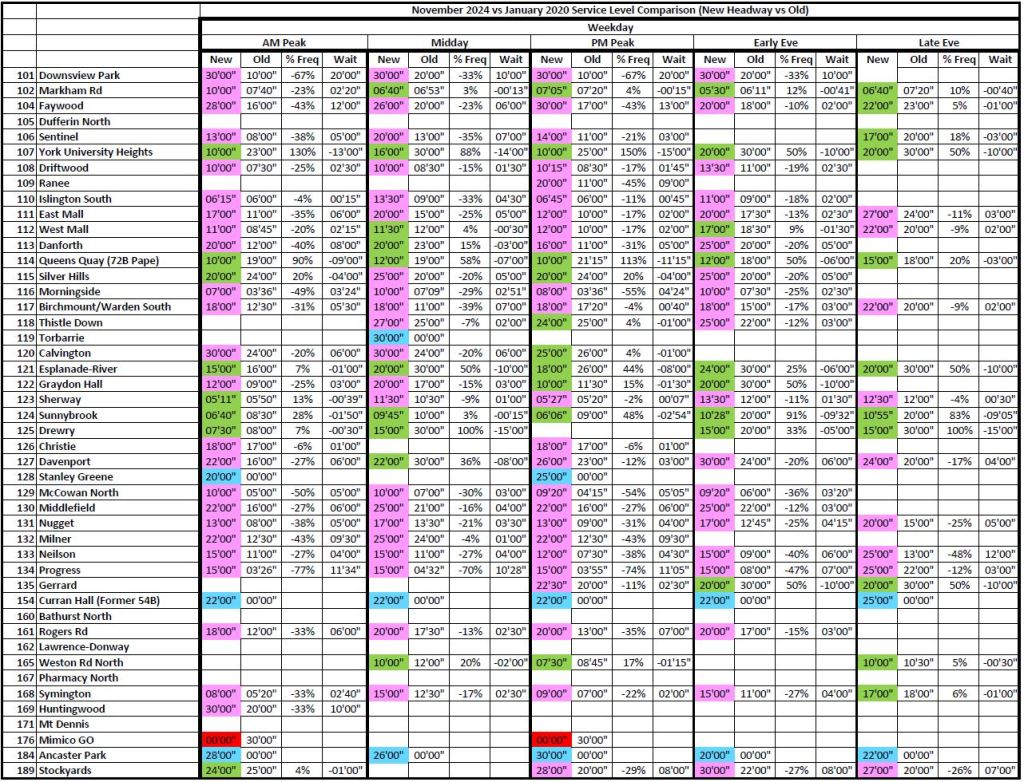
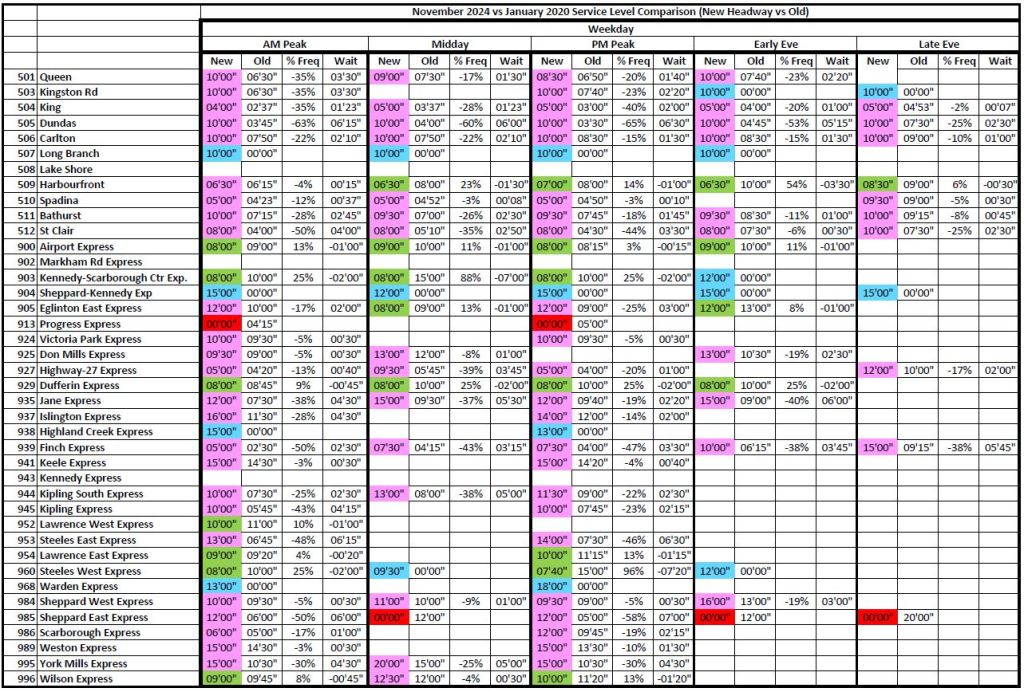
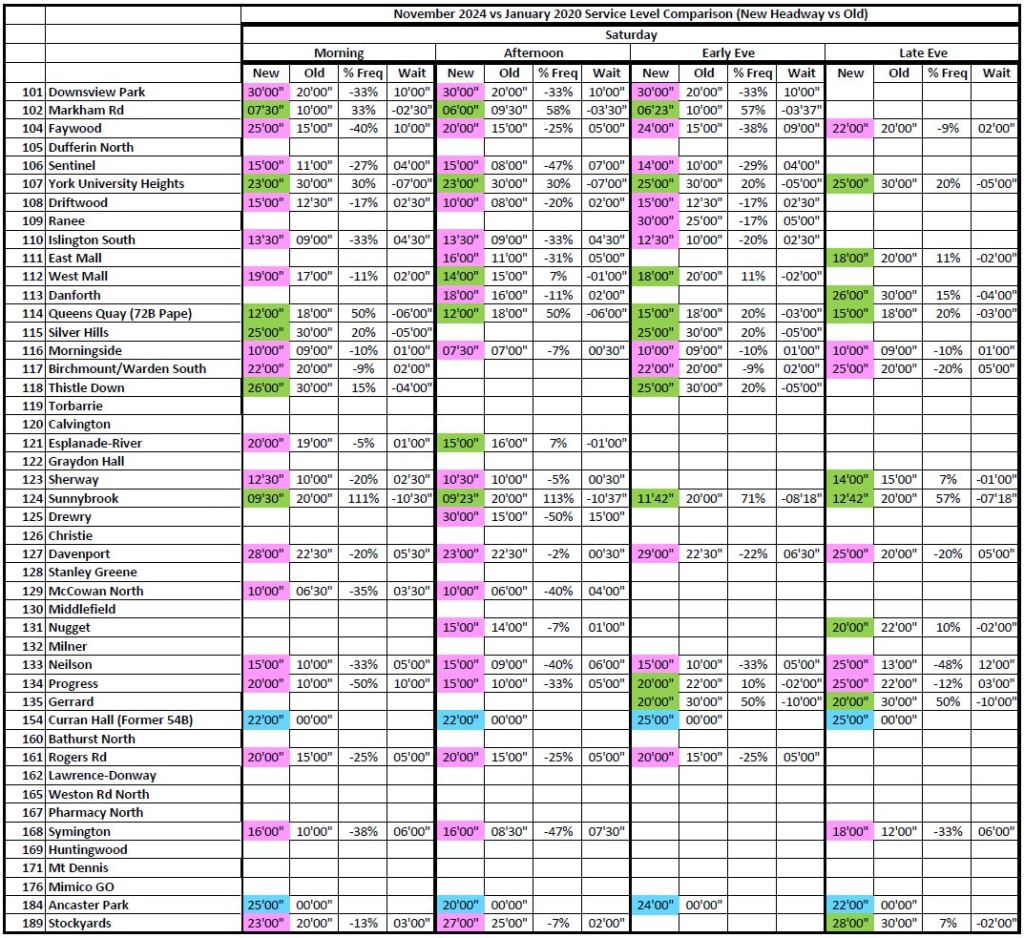
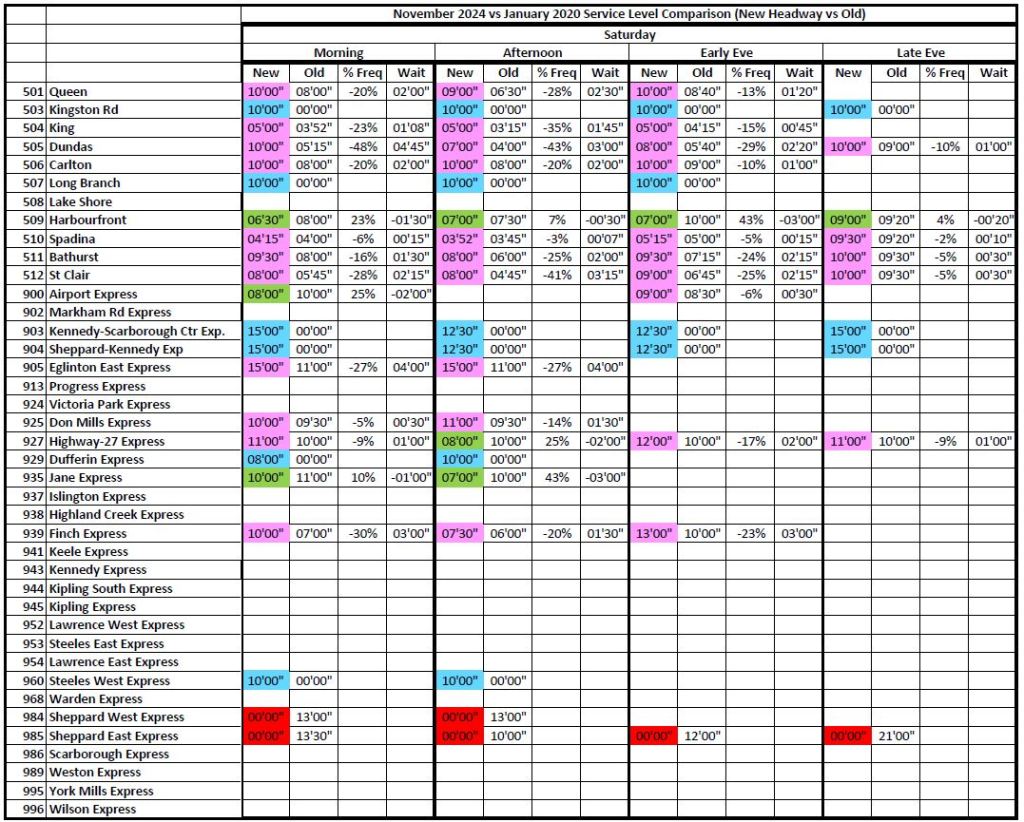
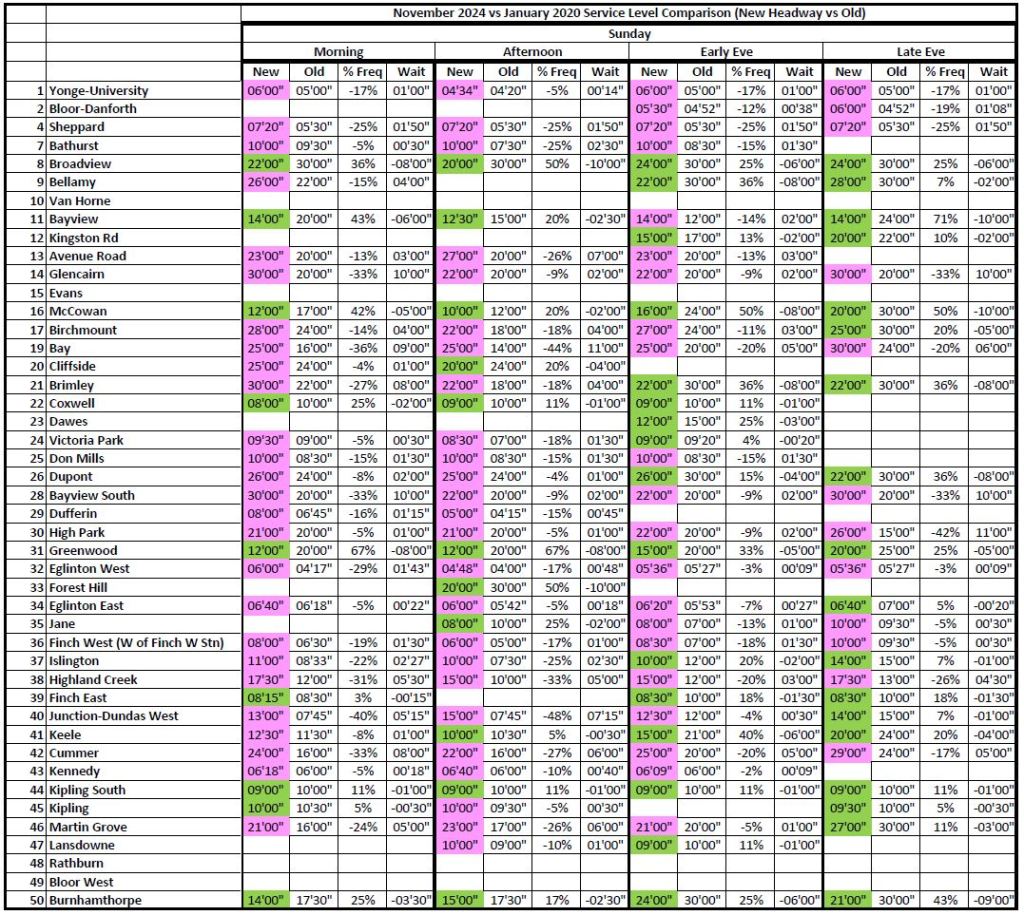
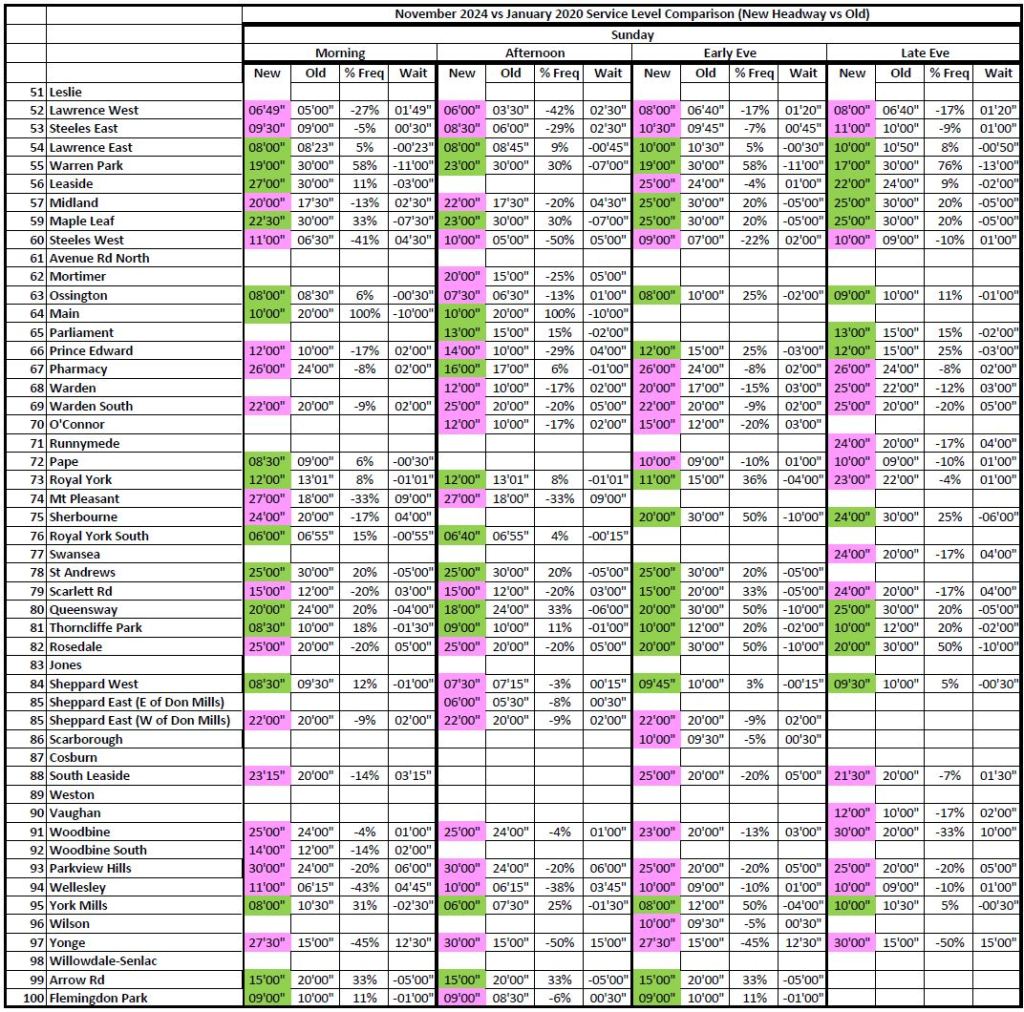
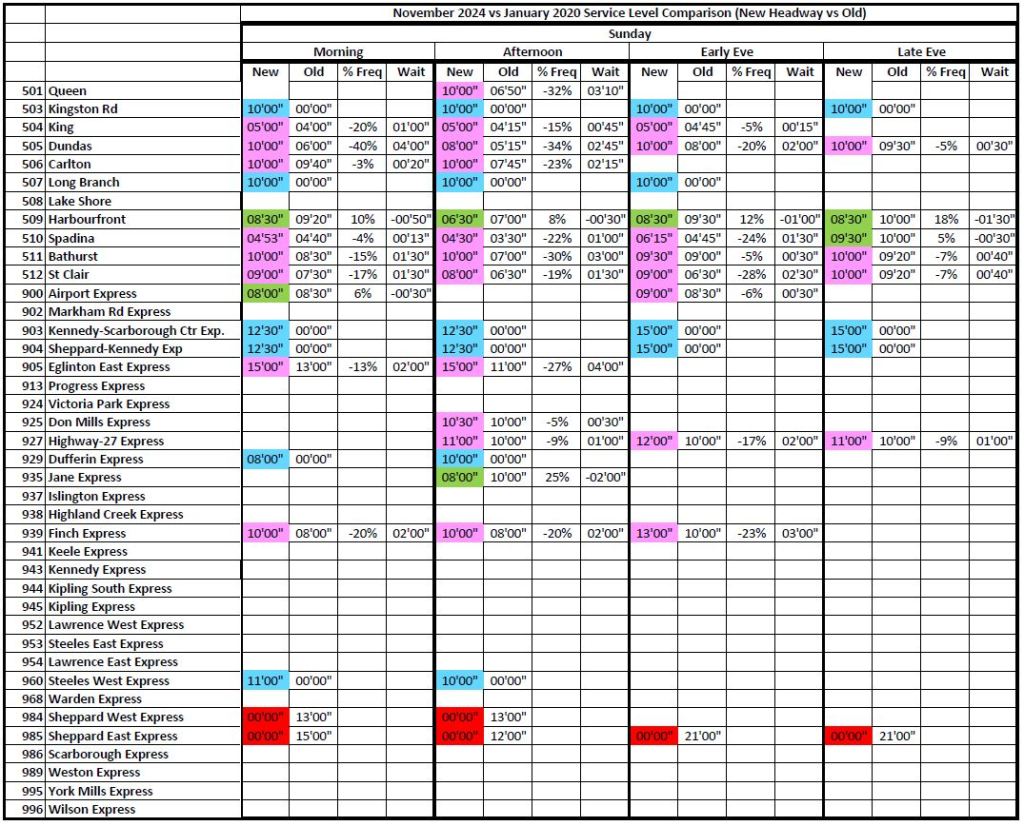
From a rider’s point of view, it is the time they must wait for bus, streetcars and trains to arrive that matters, not the budgeted hours. The tables below compare scheduled service levels in January 2020 with those that went into effect on November 17, 2024.
- Colour scheme:
- Green: Service has improved
- Pink: Service has been reduced
- Blue: New service with no 2020 equivalent
- Red: Service discontinued
- Blank: Service unchanged (values for these cells are not displayed to reduce clutter.
- In some cases, service is provided by a different route in 2024 than in 2020. The appropriate data are used for comparisons (e.g. 72 Pape now covers the former 81 Thorncliffe Park route).
- In January 2020, service on 505 Dundas and 503 Kingston Road was provided by buses. The relative frequency, especially on Dundas, reflects a change to a much larger vehicle in the 2024 streetcar operation.
- The service level for 510 Spadina is shown as of April 2024 before the route converted to bus operation for construction.
There is a lot of pink on these charts showing the locations and time periods when less service operates today than in 2020. This is a very different picture from the comparison of scheduled hours.
Click on any image to open the gallery full screen.


Source: TTC Scheduled Service Summaries (Available on this site)

Is there a way to subtract terminal time and recovery time from service hours? So as to get actual on-the-road hours. I suspect that will be difficult if the TTC provides only aggregate service hours, in which case the math would have to figure out how many runs there are and how often each does terminal/recovery time?
I suppose the headway comparison pretty much says it all. There’s so much more pink than green, it’s hard to come up with some kind of excuse such as “yes, all the pink-marked routes have increased their headway by a mere minute, while each of the green-marked routes have tripled service.”
Steve: That’s possible but very difficult. The recovery times are shown explicitly on the Scheduled Service Summaries, but the time bands when each service design operates varies from route to route. Also some routes have more time bands than are shown on the SSS. It would be possible to extract this info from the GTFS schedules, again with a lot of programming work to compare terminal arrival and departure times.
That only covers the time officially allocated to terminals, not the padded scheduling intended to minimize short turns. From the tracking data, I occasionally calculate terminal dwell times but doing this system wide would be a big job. A related problem is that thanks to queuing at terminals, one must also consider time spent just waiting to reach the line’s end point.
LikeLike
There’s two subway stations where there will be major construction projects, such as new bus bays.
Recently, work began on the excavation for the new bus terminal at Islington subway station on that station’s old parking lot. It’s expected to be complete sometime in 2026, and will be fully accessible.
There’s a similar development at Warden subway station. A new bus terminal is about to be built and it will also be fully accessible, when completed sometime in 2027.
These two subway stations were at the terminus of the subway when it was extended in 1968 and have similar architecture and tile work.
LikeLike