
With the arrival of an Interim CEO, Greg Percy, at the TTC, the CEO’s Report has been somewhat reformatted, although the overall content has not changed much. All of the performance metrics and associated commentary have moved to a separate file on the TTC’s CEO Report page.
The covering report is signed by Josh Colle, recently appointed as Chief – Strategy and Customer Experience Officer and by Percy. Further changes to format and content are in the works “to align with the new 2024-2028 Corporate Plan”.
In his introductory remarks, Greg Percy announces that there will be an open house and guided tour of the Hillcrest complex on Saturday, September 28. Details are available here.
Ridership Update
In the ridership update, the report notes that weekday boardings reached 2.6 million per day during the week ending September 7, a post-pandemic high since March. Note that this count is not the same as “rides” which are linked trips, in planning terms, from one point to another. “Boardings” are unlinked trips which count each transfer separately. Most ridership numbers cited by TTC, certainly from pre-pandemic times refer to daily trips, not boardings. Here is a sample trip:
- Bus–Subway–Streetcar
That trip counts as one ride but as three boardings. When the fare structure was simpler, rides and fares tended to be the same thing because one fare bought one ride. However, with the arrival of passes and now with the two-hour fare, the distinction is much more vague. It is not clear how the TTC reconciles historical “riding” counts with the new fare structure.
This distinction has been misreported in the press where the terms are used interchangeably:
During the first week of September, the Toronto Transit Commission told CTV News Toronto that 2.66 million riders boarded local transit each day—a post-pandemic high since the last week of March 2024.
[…]
Out of all modes of public transportation, the TTC said weekday boardings were highest across its bus routes, with 1.30 million commuters per day. Comparatively, the streetcar saw 230,000 and the subway had 1.13 million riders.
Source: CP24
This misinformation has been repeated elsewhere.
Pre-pandemic, the TTC typically carried 1.6 million rides per day, with two record days being 2 million (Papal visit) and 2.7 million (Raptors win). The TTC is doing better in 2024 than past covid-era years, but it is most definitely not close to 100% ridership recovery across the board.
Bus, streetcar and subway demand are up 3%, 10% and 9% respectively compared to a year ago. The higher increase for the rail modes implies that the downtown area is starting to see a return of peak riding that had already bounced back in the areas served mainly by buses.
Boardings vary greatly depending on the mode and day of the week. Numbers in the metrics are from July which has typically lower demand due to vacations and the absence of student traffic. However, numbers in the main report are cited from early September. This can lead to confusion when monthly numbers are compared from the two sections.
Ridership and boardings are reported in detail in the metrics. Revenue rides to July 27 are reported as 237.6 million, 0.8 million above budget, 8% above 2023, and 79% of the pre-covid level.
Demand continued to vary across weekdays, with Tuesday to Thursday being the busiest, and Thursdays being 11% busier than Mondays. Compared to pre-pandemic levels, average weekday boardings in July were 84% for bus, 65% for streetcar, and 73% for subway. The busiest weekday, however, was 87% for bus, 68% for streetcar, and 77% for subway.
Weekday peak- and off-peak demand recovered to 67% and 79% of pre-pandemic levels in July, respectively; demand in AM and PM peak periods continue to make up about 52% of all-day weekday demand.
That 52% figure is extremely important. Although there is much focus on commuting travel, this is only slightly more than half of weekday demand. There are more off-peak and weekend hours, and so their demand is less concentrated, but these periods carry a lot of TTC’s riders.
State of Good Repair
In a hint of what we may face with the 2025 budget, the report observes:
Addressing unfunded State of Good Repair (SOGR), service demand, and operational needs continues to be challenging given overall affordability constraints.
An important point not said here is that there are two “SOGR” spending streams. One is in the Capital budget and receives a lot of attention, but the other is for day-to-day work in the Operating budget. This affects things like routine inspections and repairs of vehicles and infrastructure that is not sexy, headline grabbing spending, but is key to avoiding problems with vehicle reliability and unsafe infrastructure.
Further information on SOGR is in the financial update which I will cover in a separate article.
The consultants’ reviews of subway work car hydraulic fluid spills concluded in July, and reports will come to the Board in Q4 this year.
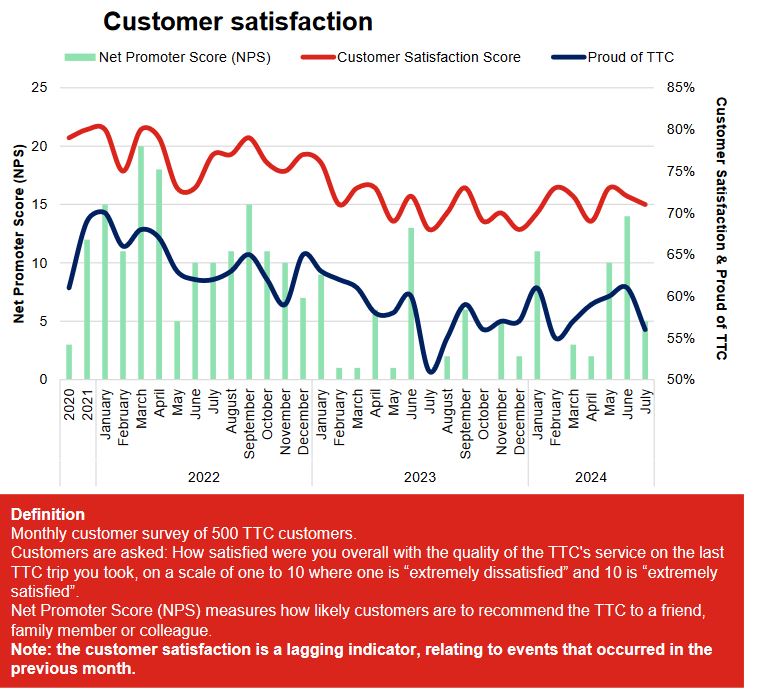
Customer Satisfaction
In the metrics, Customer Satisfaction scores are not improving. They are down for buses and subways, and holding steady for streetcars. These are lagging indicators which reflect rider experience in past months, and so any turnaround will not appear the day after changes. Similarly ridership growth from service improvements takes time to appear as riders rediscover the transit option.
The problem here is that the customer satisfaction scores have, at best, levelled out and show no sign of an upward trend in spite of service restorations of the past year. This implies that what riders experience has not changed enough to alter their opinion of service quality.
Service Changes
The CEO reports that September saw improved service on 14 routes across the city. What he neglected to mention were cases where service now runs less often, or where an expected seasonal service restorations were not implemented. With resource limits in the TTC, these decisions no doubt can be defended, but they should be mentioned in reports so that readers do not have the mistaken impression that the only changes are to make service more frequent.
Work on the SRT Busway plan continues. Early Works to remove the existing infrastructure will be completed by the end of 2024. The TRPAP (Transit Rail Project Assessment Process) is underway in parallel with completion of 100%. Both are expected to conclude in 2024. There is a public meeting on the evening of September 24 between 6:30 and 8:30 p.m. at St. Joan of Arc Catholic Academy, 959 Midland Ave, Scarborough.
Service and Fleet Reliability
The TTC’s service and vehicle performance metrics are in need of an overhaul on several counts:
- Meaningful headway standards
- Measurement of service quality along routes, not only at terminals
- Fleet availability including counts of spares relative to scheduled service
- Fleet reliability reported with uncapped values
- Reporting on vehicle crowding
As things stand, the metrics hide many problems including a granular, route-by-route review of performance and the degree to which service growth is constrained by actual vehicle availability and usable spares, not to mention budgetary caps on staffing for both drivers and maintenance workers.
Subway Metrics
Subway service reliability is reported in a few ways: on-time performance, delivery of scheduled service and vehicle reliability.
On-time performance is measured relative to the scheduled headway. The gap between trains can be no more than 1.5 times the scheduled value. For example, if trains are supposed to arrive every 5 minutes, they can be 7.5 minutes apart and still count as “on time”. There is no penalty for trains running close together. Note also that fewer trains than scheduled could operate on headways within the 1.5x limit, and the line would be “on time”.


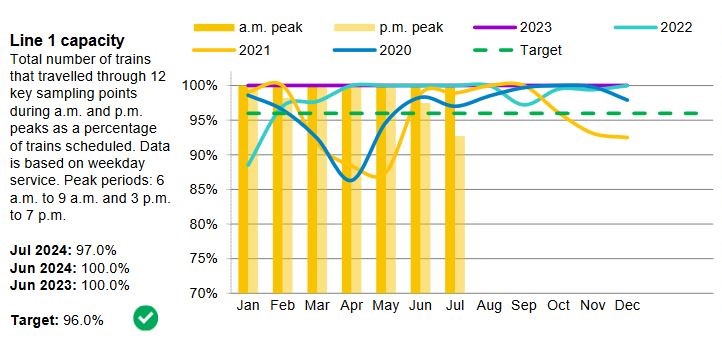
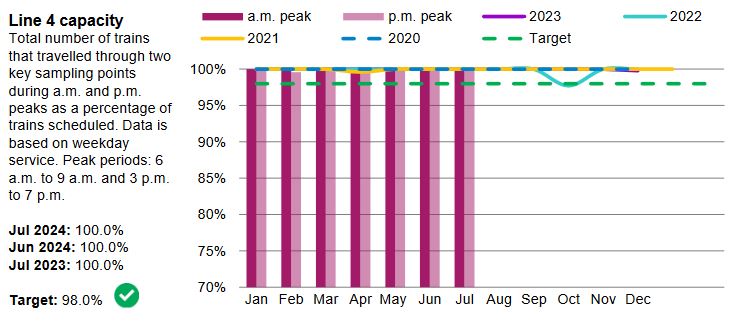
Service delivery measures the proportion of service actually operated during peak periods compared to the scheduled level. The overall availability chart (lower right) shows how many trains were fielded in the AM peak compared to the scheduled level.
There is no indication of the proportion this might be of the total fleet, and how much reserve for additional service exists. When the number of spare trains is high relative to scheduled service, it is easier to hit availability targets but this comes at the cost of a fleet larger than industry norms for spares.


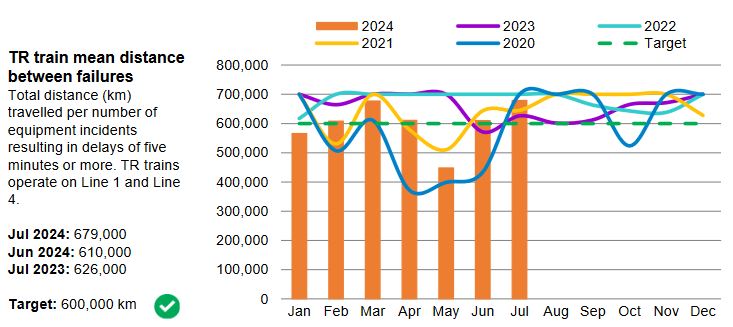
Vehicle reliability is measured as the mean distance to a failure in service that causes a significant delay (5 minutes or more). Failures that do not affect revenue service are not counted.
On the left are values for the TR fleet serving Lines 1 and 4. Note that the vertical scale is higher than for the T1 fleet on the right serving Line 2. The T1s are older trains and are the subject of attempts to get funding for a replacement fleet.
Note that the T1 values top out at 400,000km and appear to be capped rather than showing month-to-month variation.

Bus Metrics
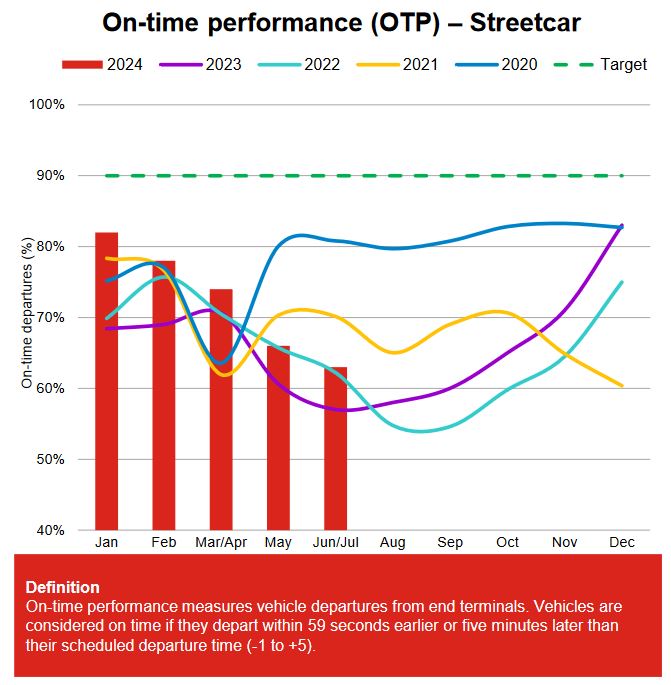
On-time performance for surface routes uses a different metric from the subway. According to the legend under the chart, a bus is “on time” if it departs from a terminal within a range from 1 minute early to 5 minutes late, and the target is to achieve this 90% of the time. That metric covers trips all day and does not break out problem times or routes.
Note that the Service Standards document also includes a headway metric separate from the one used for terminal departures, and this varies depending on scheduled frequency:
- For service scheduled above a 10 minute headway (fewer than 6 buses per hour), the same +1/-5 minute goal used at terminals applies relative to scheduled times.
- For service scheduled between 5 and 10 minutes (6 to 12 buses per hour), the allowed window for “on-time” is 50% of the scheduled headway without reference to the scheduled time.
- This means that a service every 10 minutes can arrive on a headway of 5 to 15 minutes, while a 6 minute service has a window of 3 to 9 minutes.
- For service scheduled more frequently than every 5 minutes (more than 12 buses per hour), the margin is 75%.
- This means that a route on a 4 minute headway could have gaps ranging from 1 to 7 minutes and be “on time”.
In all cases the goal is to hit the headway target 60% of the time, and this allows a large proportion of the service to operate beyond the targets. The TTC does not publish any reports of how well each route achieves these goals, and the metrics leave so much room that erratic service easily fits within the standards.
The middle chart below divides the routes by their performance. This implies that the TTC has route-level stats although they are not published. Note that routes affected by construction account for 29% of ridership, but they are not ranked for on-time performance.
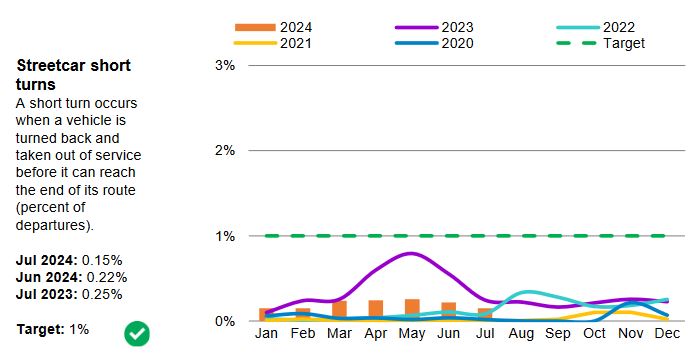
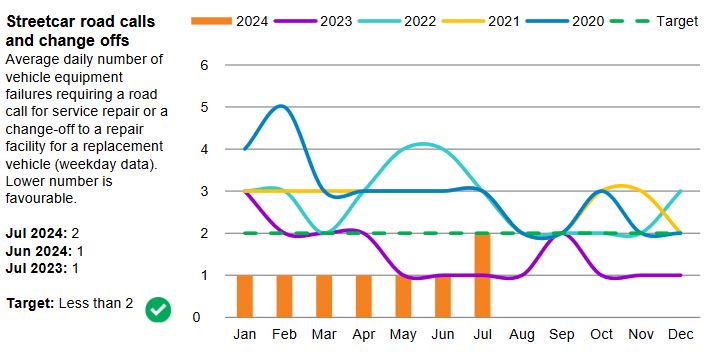
The chart on the right shows the count of short turns. There has been an unwritten rule against them for some time, and these tend to be under-reported as I have shown from vehicle tracking data. Short turns have a valid place in line management to restore regular service after delays, but they should not be required on an ongoing basis.


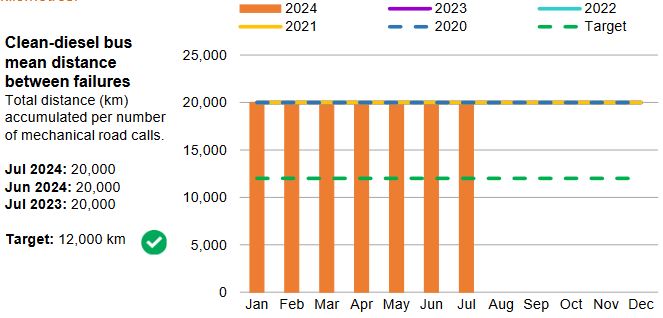
Bus reliability is reported on mean distance between failures, defined as an event requiring a road call. The data reported here are clearly capped at an upper value rather than showing the actual month-to-month variation. This hides the actual performance of each vehicle group in the fleet. We do not see an actual comparison of failure rates for diesels, hybrids and eBuses although the latter (a small demonstration fleet) is clearly doing poorly. [Corrected Sept 22: “not” added to the preceding sentence.]
The footnote about eBus availability notes that fewer service kilometres were operated by this fleet, but that is a separate issue from reliability. Buses that never leave the garage accumulate no mileage nor do they fail in service, and so they make no contribution to the statistics.
The TTC does not report the proportion of its fleet that actually operates on a daily basis, but the scheduled number is substantially lower than what would be possible with an industry-standard 20% allowance for spares. Deliveries of new buses are in progress, but there is no indication that budget headroom will appear to fund their operation. A large fleet allows the TTC to sideline vehicles without affected scheduled service, but this represents a capital cost.


Streetcar Metrics
The metrics for the streetcar network are similar to those used for bus routes. On-time performance, measured by terminal departures, has been falling through the year thanks to construction projects. An obvious question here is whether schedules have made adequate provision for these problems.
Only one route met the “on the cusp” performance level, and it represents only 3% of streetcar ridership. Everything else is either not “on-time” or affected by construction and therefore not ranked.
TTC regards the lower post-pandemic recovery of ridership on streetcars to the effect of work-from-home on downtown commuting, but one must ask whether ridership is simply staying away because service is so unreliable.

The streetcar fleet shows better MDBF values than the buses (above), but the capped bus figures prevent a meaningful comparison.
One important factor looking at failure rates is that some problems are affected more by time than by mileage. For example, a component such as doors cycles at every stop regardless of speed, and so the MDBF value will be lower for slow routes than for fast ones. Similarly braking and propulsion are under different stresses for slow, stop-start routes.

The TTC’s service and vehicle performance metrics are in need of an overhaul on several counts:
- Meaningful headway standards
- Measurement of service quality along routes, not only at terminals
- Fleet availability including counts of spares relative to scheduled service
- Fleet reliability reported with uncapped values

Will the completion of the Finch West LRT be added to the agenda or discussed as part of the CEO report or a “confidential report”?
Steve: This is a Metrolinx project and it is no longer part of the TTC Board’s agenda. I would not be surprised if someone asks, and they will get the usual answer that TTC management still does not have an opening date even though operator training is now in progress.
LikeLike
I would guess that the 507 LONG BRANCH is the one streetcar route that is kind of providing regular service.
LikeLike