
Every few months, the TTC brings the cheery news that service is pushing ever closer to pre-pandemic levels.
Approved as part of the TTC 2024 Operating Budget, service investment will increase to 97% of pre-pandemic levels this fall, from 95% at the end of 2023. The first 1% increase occurred in the spring of 2024 and additional investment of 1% will be made through the fall.
These changes will be implemented alongside continued adjustments and reallocation of service to match capacity to demand. Overall, the changes will increase frequency, improve reliability, and strengthen connections throughout the city.
[CEO’s Report, September 2024, p. 10]
Riders waiting for their bus, streetcar or subway train might beg to differ.
This is an example of the “good news” mentality that overplays the achievement of the TTC and its recently-departed CEO, and contributes to the gap between publicity and day-to-day rider experience.
The basic problem is that the TTC measures “recovery” based on the weekly hours of scheduled service. This is not the same as the service riders see which is most easily expressed in buses/hour or in the scheduled interval between vehicles. (A 6 minute headway of buses is equal to 10 buses/hour.)
Over the years, service hours have grown because of traffic congestion (more buses are needed to provide the same frequency), recovery time (time for breaks at terminals), padding to avoid the need for short turns, and system expansion. None of these contributes more service to existing routes. These changes can inflate total hours needed to operate the network or, conversely, they can spread existing budgeted hours more thinly across routes.
A meaningful comparison looking route-by-route, time period-by-period, shows that in many cases the level of service, measured by frequency, has declined since January 2020, and in some cases the service is substantially worse. Details are shown later in this article.
A compounding factor to service reductions is the unreliability of service. Bad enough that buses and streetcars come less often, but when their spacing is not regular, gaps add considerably to waiting time and to crowding. In theory a route might have a scheduled number of vehicles per hour, but in practice their spacing causes most riders to jam on the first of the duo or trio that shows up. The average rider experience is a packed bus even if the average load over an hour meets standards. Few riders experience the relatively empty second and third buses in a pack. TTC reports crowding based on hourly averages without showing the variation between vehicles.
In brief, it is time for the TTC to start reporting service quality on a basis that corresponds to what riders see day-to-day in their travels. The current scheme may allow feel-good media events, but the contrast with actual experience undercuts the credibility of announcements.
Service Standards
A major problem with TTC Service Standards is that vehicles do not have to arrive regularly spaced.
For services that operate between 5 and 10 minutes, passengers do not rely on printed schedules, but expect vehicles to arrive at prescribed headways. Therefore, on-time performance for frequent service is measured by how well actual headways correlate to scheduled headway intervals. Trips are monitored at a location based on arrival time, without regard to whether the trip that arrived was scheduled for that time slot. The vehicle is considered on-time when the headway deviation is less than 50% of the scheduled headway. For example, a service that operates every 6 minutes is deemed on-time if the headway deviation falls between 3 minutes and 9 minutes. TTC’s goal is to have 60% of all trips operated within ±50% of the scheduled headway over the entire service day. [TTC Service Standards pp 15-16]
For a service of 10 buses per hour (every 6 minutes) buses could actually show up close together with wide gaps and still meet the standards. Moreover, the goal is to have 60% of trips operate within this standard on an all day basis. This leaves a lot of service that could operate even less reliably.
The result is that the TTC can claim high “on time performance” while from a rider’s point of view service is no where near the advertised level.
The standards vary depending on service level, but for frequencies over 10 minutes the standard allows a six-minute window for deviation from the schedule. This is measured only at terminals, and buses that are close together at the beginning of their trip quickly bunch up into a pair travelling across the route.
The TTC has no standard for, nor does it report on, the level of bunches and gaps in its service. It reports on short turns, although as I have previously demonstrated, reported counts are well below actual levels. Short turns are a legitimate tactic to respond to service delays provided that they are not over-used “on spec”.
A further problem is that re-entry of short-turns must be managed to ensure even service rather than pairs of vehicles travelling across a route. The entire point of a short turn is to fill a gap. Simply putting a bus or streetcar back “on time” does not necessarily improve service.
An absolute ban on short turns, as former CEO Leary attempted to impose, can be counterproductive with packs of buses and streetcars running together after very wide gaps.
Crowding standards are intended to give riders some elbow room, especially in off-peak periods. However, these standards were dropped during the pandemic as a budget measure even though this was not approved in advance by the TTC Board.
Management has talked about restoring the standards, but there has been no definite word on this, and it will depend on budget headroom. Moreover, the TTC does not publish a list of routes and service periods which exceed either the official standards or the relaxed ones. There is no way for the Board to know how much of a backlog exists just to restore the standard.
The table below shows the current official standards, but in practice the off-peak period has been relaxed to the peak standard.

Vehicle availability to add service is not an issue because the spare ratio (the number of spare vehicles relative to scheduled requirements) is well above industry norms for all three modes. The problem lies with budget constraints on the number of operators.
These problems with the Service Standards are not new, but the laxity they allow contributes to a rider experience that undermines claims of a return to “100%” of pre-pandemic service before any other factor is considered.
Another important factor is that just about everyone has forgotten that there were problems with reliability and crowding before the pandemic, and simply getting back to “100%”, whatever that is, will not necessarily be an ideal situation.
Overall Vehicle Hours
When the TTC talks about the level of service recovery, they use vehicle hours as the measurement. This does not measure the amount of service on the street because it does not adjust for system growth, nor for changes that make vehicles run more slowly. The metrics riders care about are the headway (interval between vehicles) and crowding (which can be influenced by both inadequate service and by uneven headways).
Vehicle hours are used for service budgeting because the lion’s share of operating cost (except on the subway) comes from driver wages, with a smaller contribution from running maintenance and fuel/power which are driven in part by other variables. (For example, fuel consumption varies not just with hours or kilometres, but with the characteristics of a route including stop frequency, congestion and grades.)
Looking at the system as a whole, the chart below shows the planned weekly service hours from January 2020 (just before the pandemic) to present. There are occasional gaps because schedules do not change in every month. Later in the article, I turn to individual modes, but the important thing about this chart is that bus hours (red) dominate everything else on the system.
Another important factor this chart chows is that overall service did not fall anywhere near as badly as ridership early in the pandemic thanks to continued funding support from all governments.

Looking only at buses we can see that the scheduled service hours (red) in September 2024 are roughly the same as in January 2020. When construction service is included (such as replacing the 510 Spadina car, or provision for extra service to deal with construction-induced congestion), the total of bus hours is higher than in 2020. This does not mean that riders see more service at the individual route level.
Updated: A reader has pointed out that there was an increase in bus hours due to the SRT replacement service. This is counted toward “recovery”, but is for a major new service, not restoration of existing routes. However, reviewing details of service changes in Fall 2023, this added service was offset by a reduction in the 600-Run As Directed buses.

The rail networks have three modes over the period: streetcars, subway (subdivided by type of train) and the SRT. Streetcar scheduled service hours (purple) are higher now than in 2020, but riders on the street would never believe it. I will return to that in more detail below.
Subway lines 1 and 4 (combined as yellow) converted to one person train operation (aka “OPTO”) and that produced a big drop in hours for those lines. This is separate from the frequency of service.
Line 3 (green) remains with two-person crews, and its service level remains below the 2020 level. (An improvement is planned for October 2024, but details have not yet been announced.)
Line 4 (blue) ceased operation in July 2023, but had scheduled hours until September.

Streetcars suffer regularly from the effect of construction projects, and the red bars below (including construction) are often below the purple bars (scheduled) because less service is operated than would otherwise be the case. In theory there is more scheduled service today than in 2020, but the real picture is more complex. Notable problems with streetcar routes before the pandemic included equipment shortages and a budgetary limit on operators. Streetcar service was artificially constrained, and this almost certainly worked against ridership growth on those routes.
Another issue lies in the change of vehicle type to the longer low-floor cars and a concurrent widening of headways. This reduced the weekly hours of service. Capacity was theoretically maintained because of larger cars, but they came much less frequently. Moving from CLRVs to Flexitys cut the number of vehicle hours.
Operating practices have also changed with a combination of lower speeds on streetcar routes and greater recovery time at terminals.
The combined result is wider headways for riders even though the total vehicle hours might stay the same.

Source: Board Period Hours Per Week Per Division, from TTC Board Period Memos (not available online)
Speed and Recovery Time
The number of vehicle hours operated on a route depends on how many vehicles it uses no matter what speed they travel at nor how much provision their schedules have for recovery time. If there are ten buses, then the route consumes ten vehicle-hours per hour of operation. This could be done with various service designs that have different effects from a rider’s point of view.
Assume a route takes one hour for a round trip, and it has ten buses. If there is no recovery time, this means that one bus should appear every six minutes. However, if we slow the route down so that a round trip takes 70 minutes, then the buses will show up every seven minutes. The vehicle hours are the same, but the service is not. If we add another ten minutes recovery time to give the drivers a bio-break at terminals and a chance to stretch their legs, the buses will now come every eight minutes. The vehicle hours are still the same. The vehicle hours are at 100% but the service is now only 7.5 buses/hour rather than 10.
To put it another way, the same number of vehicle hours can generate very different levels of service depending on how they are used. This is the basic fallacy of saying “we’re back to 100%”.
The TTC warned recently that they have spent $30 million over 2023-24 simply to deal with congestion. That is the cost of adding service to maintain headways with longer travel and recovery times. What they do not mention is the degradation of service levels when the available service hours are stretched over routes where more time is needed to complete trips.
Detailed Comparison of January 2020 and September 2024 Service
The tables below show the scheduled service just before the pandemic onset, and today on the street.
Data are grouped horizontally by time period with weekday, Saturday and Sunday levels in each column. For each entry there are four cells:
- Sept 2024 headway in minutes and second
- Jan 2020 headway
- Percent change in service (vehicles/hour)
- Change in scheduled wait time
Colours indicate the nature of the change.
- Where cells are blank, the 2020 and 2024 services are at the same level or, in a few cases, there is no service.
- Pink cells show service reductions.
- Green cells show improvements.
- Red cells are cases where a service no longer operates.
- Blue cells show new services.
In a few cases for ease of comparison, 2020 data have been included under a new route number such as the replacement of 72B Pape to Union Station by 114 Queens Quay.
[Click to expand the tables as a gallery.]


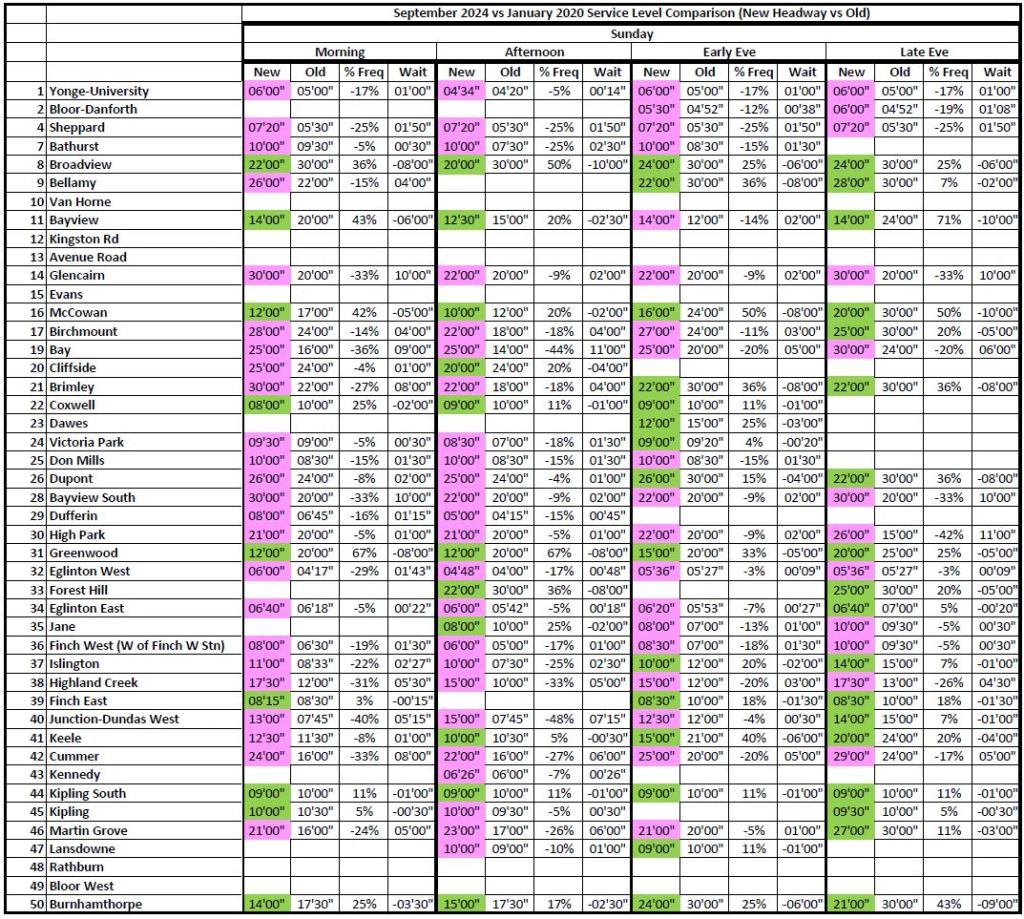


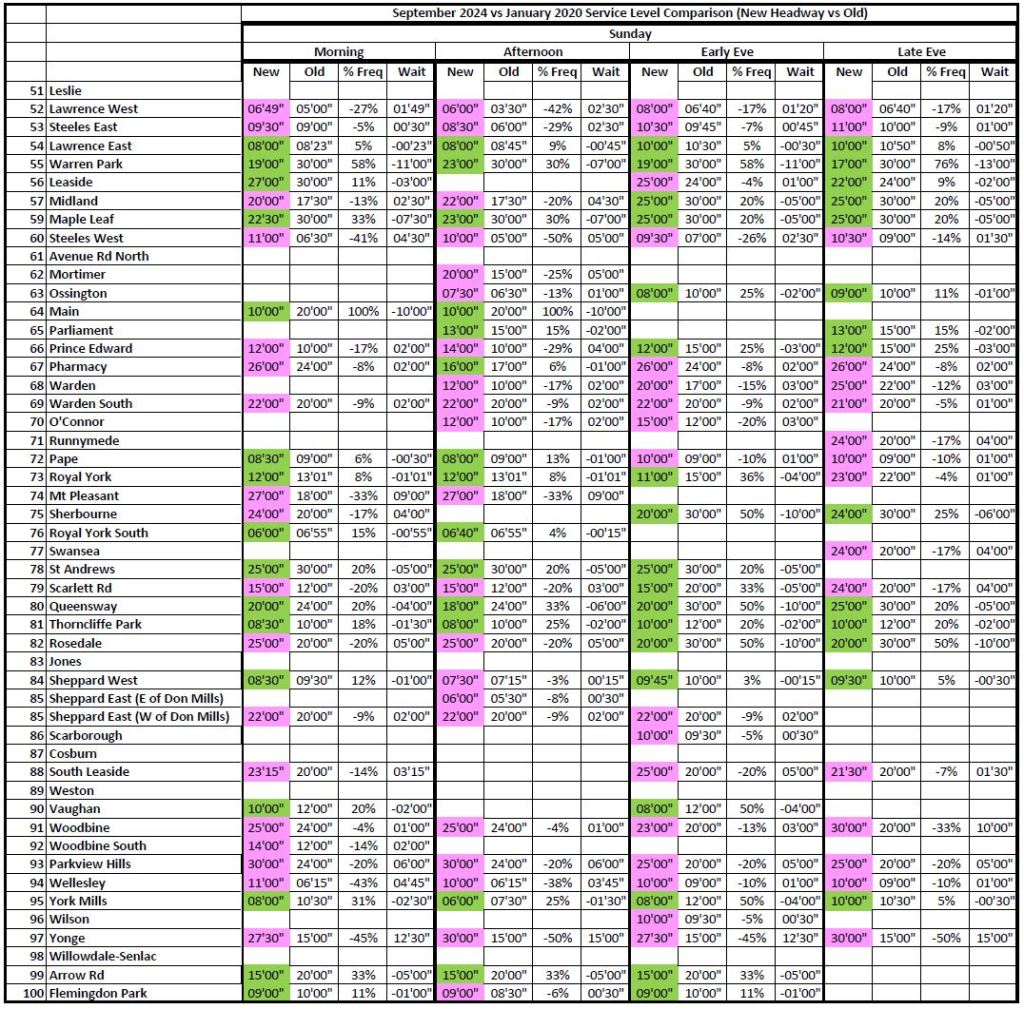
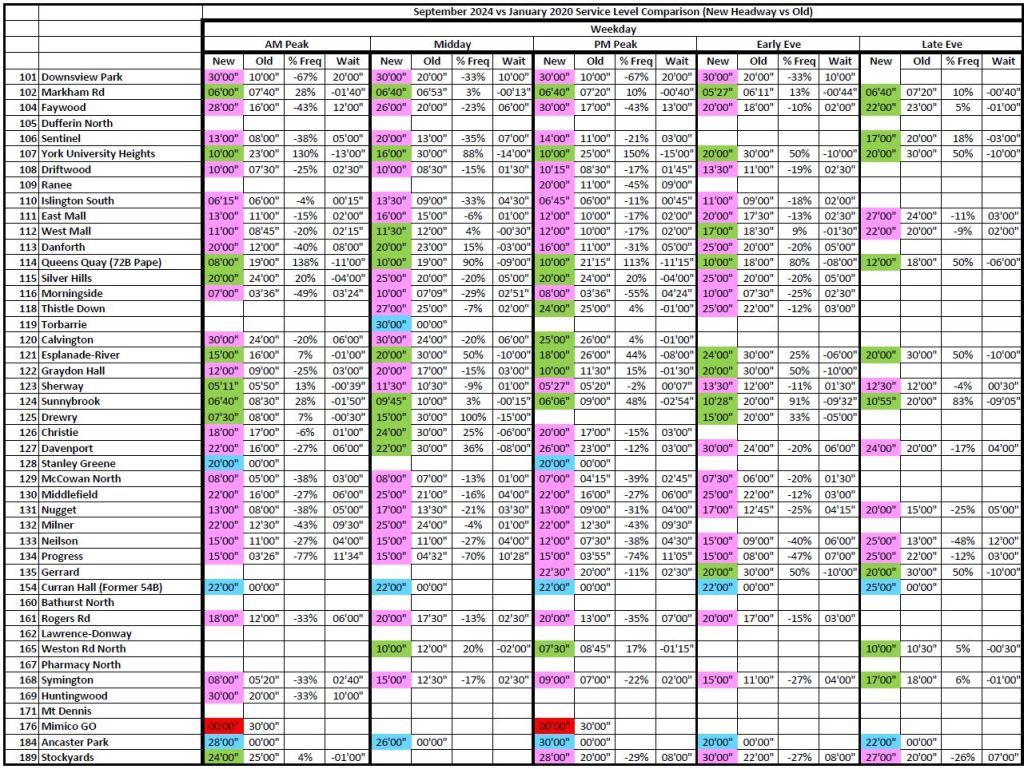


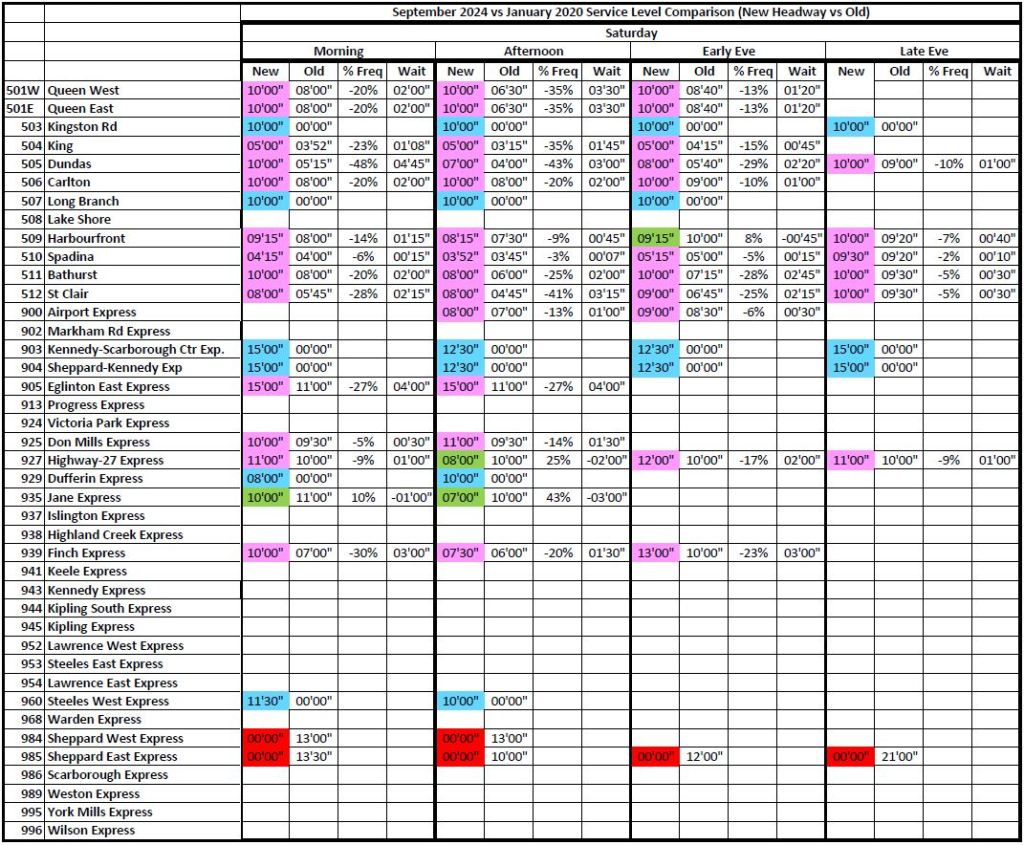

There is a lot of pink on those charts indicating widespread service reductions relative to January 2020, particularly in the left column (weekdays). These are partly offset by improvements in green. The percentages of many reductions are considerably more than a “recovery to 97%” might imply.
Changes in vehicle type will affect vehicle hours. For example, if a route operated with 12m buses in 2020 but now runs with 18m articulated vehicles, these would typically run less frequently to compensate for higher capacity. However, on the bus network, there were few changes over this period.
- Routes operated with 12m buses in 2020, converted to 18m by 2024: 7 Bathurst, 939 Finch Express, 941 Keele Express. [Updated Sept 19 with the addition of route 939.]
- Routes operated with 18m buses in 2020, converted to 12m by 2024: 41 Keele
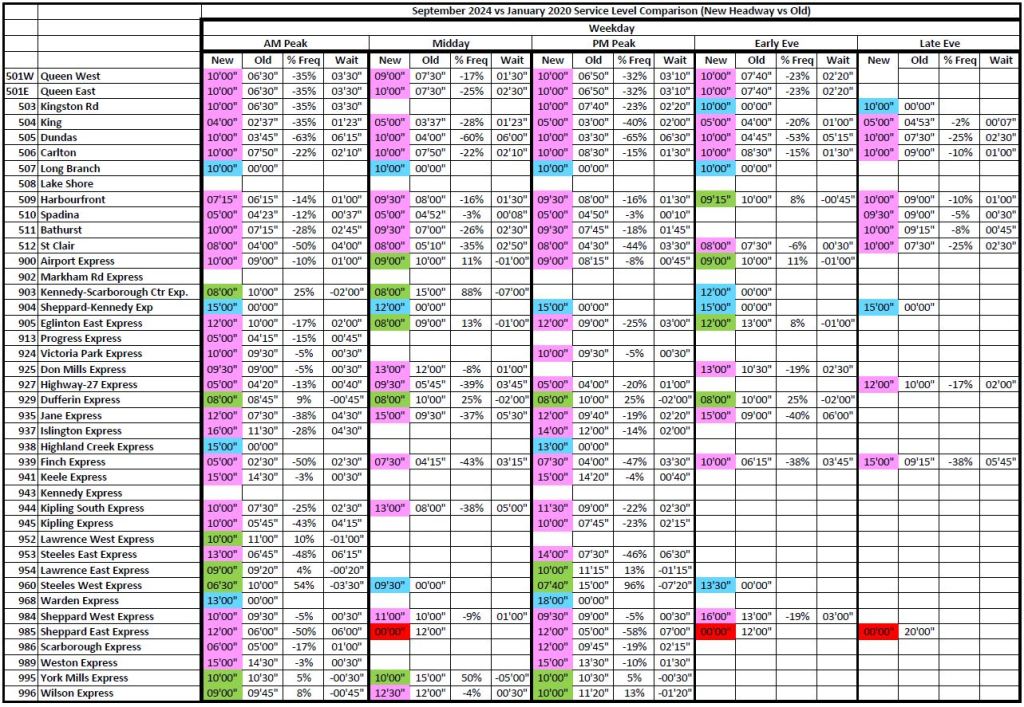
On the streetcar system, the migration to Flexity streetcars was substantially complete in early 2020, but service on some routes was provided by buses due to a shortage of vehicles. This resulted in much wider headways with the return to streetcars (see 503 Kingston Road and 505 Dundas). However, routes that had already converted to Flexitys in 2020 have also seen service reductions (501 Queen, 504 King, 506 Carlton, 511 Bathurst, 512 St. Clair).
The larger cars have an economy of scale from the crewing perspective, but the wider scheduled headways mean that irregular service pushes waits well beyond the line of convenient, reliable service.
In the table above, the 2024 values for 510 Spadina and 509 Harbourfront show the Spring 2024 service level with streetcars before buses were substituted.
Source: Scheduled Service Summaries available on this site.

The TTC increased service level.. but the problem is that they made more increases on the weekends rather than the weekdays so the frequent riders who do commute using the TTC aren’t feeling the impact of the increase.
On your summary chart, there are indeed more greens (better service now compared to pre-pandemic) on the weekends rather than the weekdays..
Some routes indeed have better service on the weekends than the weekdays and I don’t see why since there are lot more people using the TTC on the weekdays (work, schools, etc) than the weekends..
While commuting to work, school creates more consistent riderships, going for errand, personal get together is considered as inconsistent ridership.. and TTC’s equation on those service increase is a complete failure.
Steve: One point about weekends is that there are only two weekend days while there are five weekday days. Weekday cuts need more weekend improvements to balance the effect.
LikeLike
Do the 2024 bus service hours include the SRT replacement buses? I’m wondering how the 2024 vs 2020 bus service hours would compare if the SRT was still operational and there weren’t dozens of buses an hour making the longer trip to Kennedy.
Steve: Yes, the 2024 values include the SRT replacement service which runs up considerably more hours than the handful of operators on the SRT trains.
However, at the point the SRT replacement with several route extensions was implemented, there was a reduction in route 600-Run As Directed buses and, therefore, the SRT replacement service was essentially “paid for” by redirecting buses that would otherwise have been on standby service.
re: short turns and timing them to effectively fill a gap rather than just get “on time”. The TTC should use your Marey charts as a training tool. They are incredibly powerful! You can instantly see cases where there’s a convoy of two buses and a well placed short turn would fill a gap, and see where the bus would need to be turned. The test part of the exercise would be to cover the right side of the chart, which would have the effect of pretending that you’re looking at conditions at a specific time and don’t know what the future will hold. Look for bunches and gaps anywhere on the route at that specific time, identify what operator you would ask to turn (if any) and where/when you would ask them to turn to optimally fill the gap in the other direction.
Steve: It is a little trickier than that because the choice of which vehicle to short turn might also be affected by crewing that makes one vehicle preferable to another. Ideally, if one could see the diagrams evolve in real time, locations where intervention was essential would be obvious. This is available now on the transsee.ca site free of charge for streetcars, and as a paid enhancement for buses. Note that transsee is not my site and I get nothing from referring readers to it.
LikeLike
What appalls me is that people expect 100% of the pre-pandemic service with only 50% of the pre-pandemic ridership. If you want more service with less ridership, then you need to increase fares instead of being a burden on the taxpayers who don’t even use the TTC.
Steve: Ridership as of July was over 80% of pre-pandemic levels, with over 90% on the bus network and particularly on weekends. Growth is expected to be strong through the Fall.
I don’t own a car, and I object to my taxes paying for roads whose purpose is to enrich Doug Ford’s developer pals.
LikeLiked by 1 person
Hi Steve,
I met a friend yesterday. I asked what bus she takes to get to where we meet to go hike in the woods, if she could meet down at Queen instead of up at Kingston. She said that was too far to walk. Walk? Turns out taking a bus from her place to there requires a transfer. And the bus is annual. What? Annual??? She smiled. I guess Victoria Park doesn’t have a regular south bus. And then she would have to take the Queen car from Neville Park, which does run but we know, not frequently. But ANNUAL?! I thought that was a fabulous choice of words!! It describes a bus so infrequent that it’s easier to walk – if you can walk that is.
You do amazing research and put it into human terms. I know how much you love the TTC so this must be very painful for you to be seeing such a disappointing service – talked up like it’s getting better when you know full well that for the riders it’s not. If you can see and afford to wait for the next streetcar or bus……. it’s not crowded.
Thanks for reporting the reality.
Cheers! Nancy
LikeLiked by 1 person
A prime example of constant “bunching” is the 41 Keele. It does NOT matter what day or time it is, there is always buses that travel in “packs” (even at 10am on a Sunday). It has been this way for years. It would seem that route management does NOT exist anymore. When there were Supervisors on the street, you almost never saw this and if you did it was corrected immediately and not allowed to go all day. Using Nextbus, you can visually see the on-going bunching on any route.
LikeLiked by 1 person
Great work! I wonder what the solutions are to the bunching-crowding problem. (I think I read one of your earlier pieces about possible solutions, but I can’t remember what they are, beyond running more buses or slowing down some buses on purpose in order to fill the gaps?). I think what I would need as a bus rider, in order to be convinced to sometimes wait for the later, emptier buses in each bunch, would be a sign informing me that another bus is set to arrive in about x minutes, AND guaranteeing that the next-arriving bus is not crowded like the first one is. Also, nicer bus stops (shade, etc.) that I wouldn’t mind waiting at. That still doesn’t solve the gap problem of course (though nicer bus stops would help make that somewhat more bearable), but it could reduce the crowding problem? What else could be done? Add gap buses parked throughout the route, ready to go when needed? (The gap-bus bus drivers could reach the gap buses quickly by e-bike..?)
LikeLike
One additional bus that changed from 12m to 18m is 939 Finch Express.
Steve: Thanks for catching that. I will update the article.
LikeLike