
In the previous article, I reviewed travel times on 505 Dundas for the month of April 2024. Now, here are charts of the headway data.
Service on this route comes nowhere near meeting the TTC’s own rather lax standards for service quality. The TTC measures On Time Performance (“OTP”) with the assumption that if cars are on time, then regular service will take care of itself. However, there is considerable leeway in the words “on time”.
OTP is measured only at terminals and compares the scheduled trip time to the actual one. If a car leaves no more than 1 minute early or 5 minutes late, it is “on time” for the stats. There is no measurement of OTP along the route, and the spacing from terminals is rarely maintained.
The six minute window this provides allows service to be quite erratic, but still counted as “on time”. For example, on a route like Dundas with a 10 minute headway, cars could alternately be 5 minutes late and 1 minute early. This would produce the following departure pattern:
| Scheduled | 12:00 | 12:10 | 12:20 | 12:30 | 12:40 | 12:50 | 1:00 |
| Actual | 12:05 | 12:09 | 12:25 | 12:29 | 12:45 | 12:49 | 1:05 |
| Headway | 4′ | 16′ | 4′ | 16′ | 4′ | 16′ |
The cars on short headways would inevitably catch up with the cars on wide headways, and pairs 20′ apart would travel across the route. There is nothing in TTC standards to measure this. and reports will blissfully say that service is “on time”. In fact, the TTC does not even achieve its own lax standard.
There is also no metric for missed trips caused by absent cars. Conversely, a trip at a terminal can legitimately be missing if a car was short-turned to restore regular service. The TTC’s focus on OTP stats to the exclusion of any other metric is one reason for the no short-turn policy. This can do much damage by blocking legitimate service management techniques. In the article on travel times, there are many examples of short turns to preserve service on the central part of the route rather than letting vehicles pile up at terminals.
This article shows how service leaving the terminals of 505 Dundas is disorganized from the outset, and how this evolves along the route. For an organization that hopes to win back riders, this is not an ideal example of what service should look like.
Overview
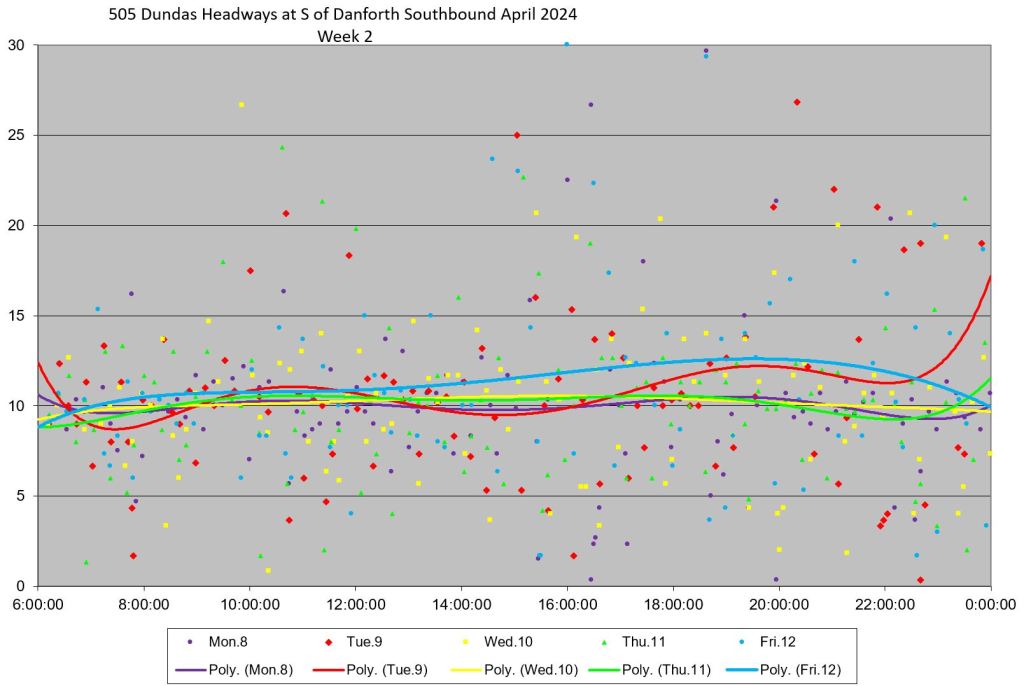
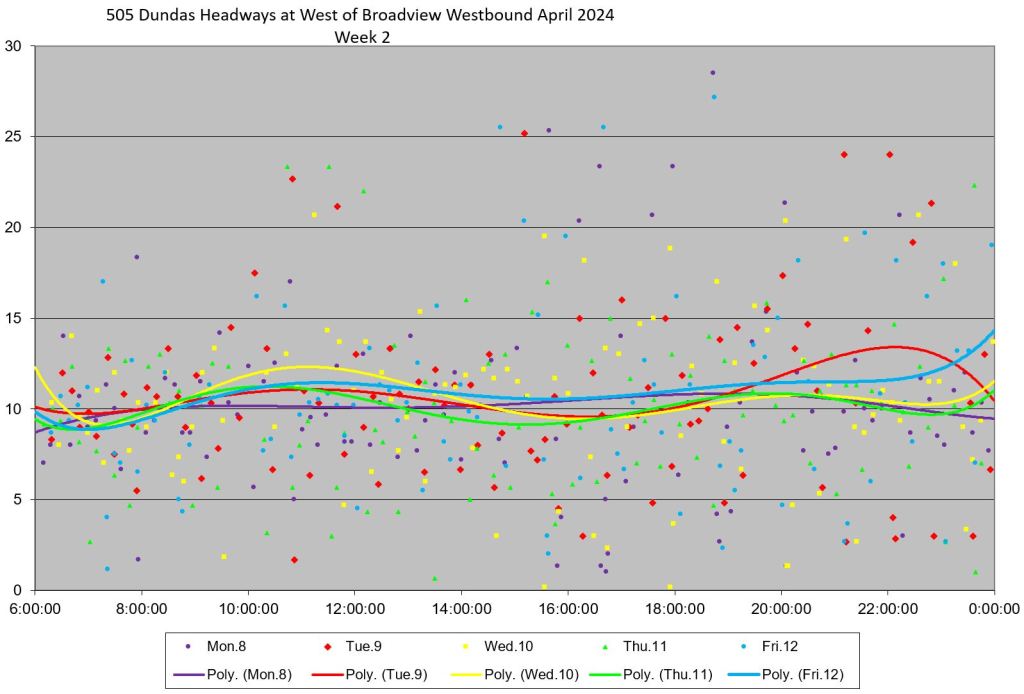
In the charts below, data are presented at three locations for each direction: leaving the terminus, at a point where typical short turns are included, and at Yonge Street. Each column contains data for one location.
- The first row shows the statistics (averages and standard deviations) for weekdays grouped by week.
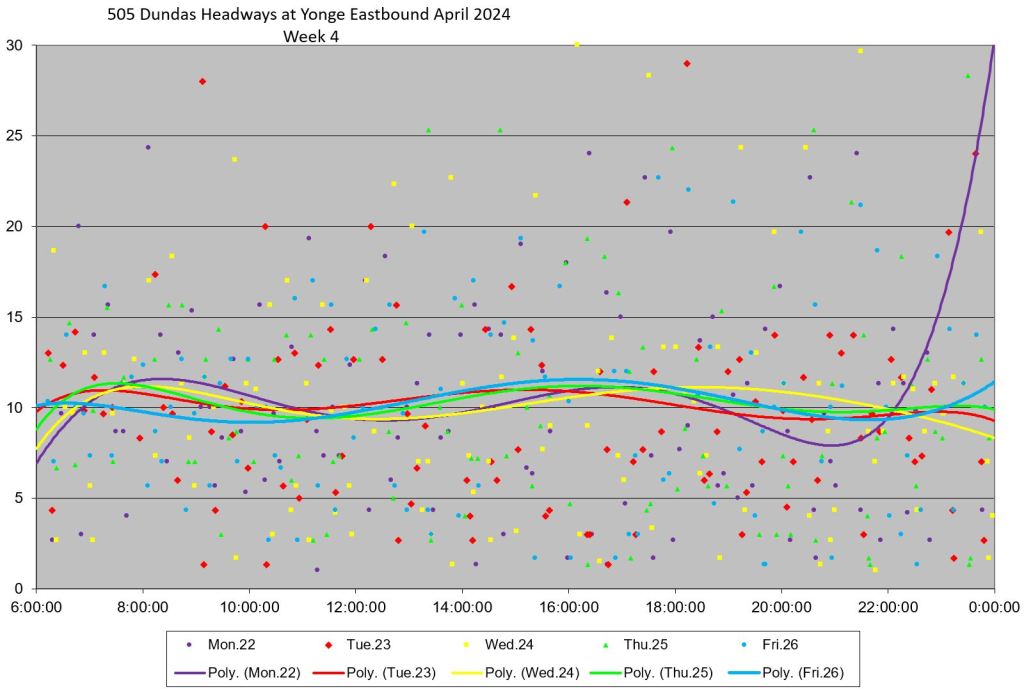
- Rows 2-6 chart individual days within each week. Each dot represents one car with the vertical position showing its headway (the gap to the preceding vehicle). The lines are not averages, but are “best fit” trend lines through the data to show the overall pattern.
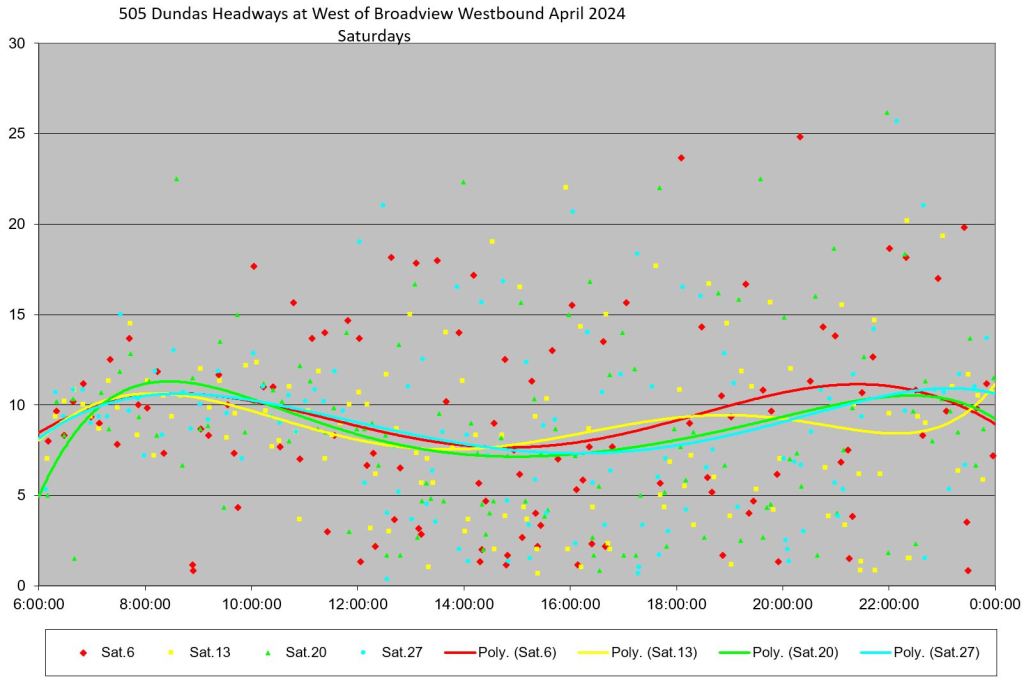
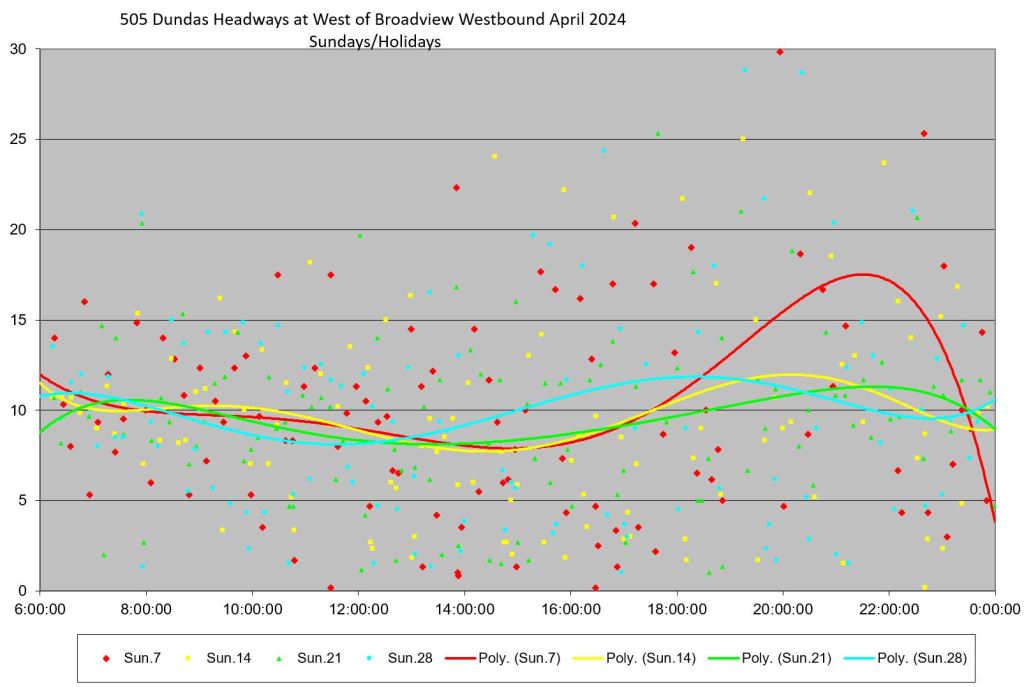
- Rows 7-8 are in the same format as 2-6, but group all Saturdays and all Sundays together.
- Row 9 (only shown eastbound) is a scatter diagram of all headways. Note that the y-axis for this chart is 60 minutes so that all of the data will fit. On the earlier charts, the 30 minute maximum omits the worst of the data, but gives the majority of the data “elbow room”.
Here is the service summary for schedules in effect during April 2024.

Westbound from Broadview Station to Yonge Street
The data for Broadview/Danforth bounce around a bit more than values at Broadview/Dundas because short turned cars do not reach Danforth and wider gaps occur there. The standard deviations (a measure of the scatter in data values) routinely line between 5 and 10 minutes indicating that the majority of the headways are spread over a wide range (typically twice the SD value). SD values at Yonge are higher than at Broadview/Dundas showing how spacing deteriorates as one moves along the line.
Note that the averages generally lie along the ten-minute line at Broadview/Dundas and at Yonge showing that all cars are present (10′ is the scheduled headway), but the SD values show that actual spacing is quite irregular.
In the weekly charts, Week 4 at Broadview/Danforth shows wider headways. This corresponds to the longer travel times and higher number of short turns during this period as shown in the previous article.
The weekend charts show that service fares no better then. Problems with service reliability on Dundas exist during all periods and days of operation. Waits of 15-30 minutes are common.


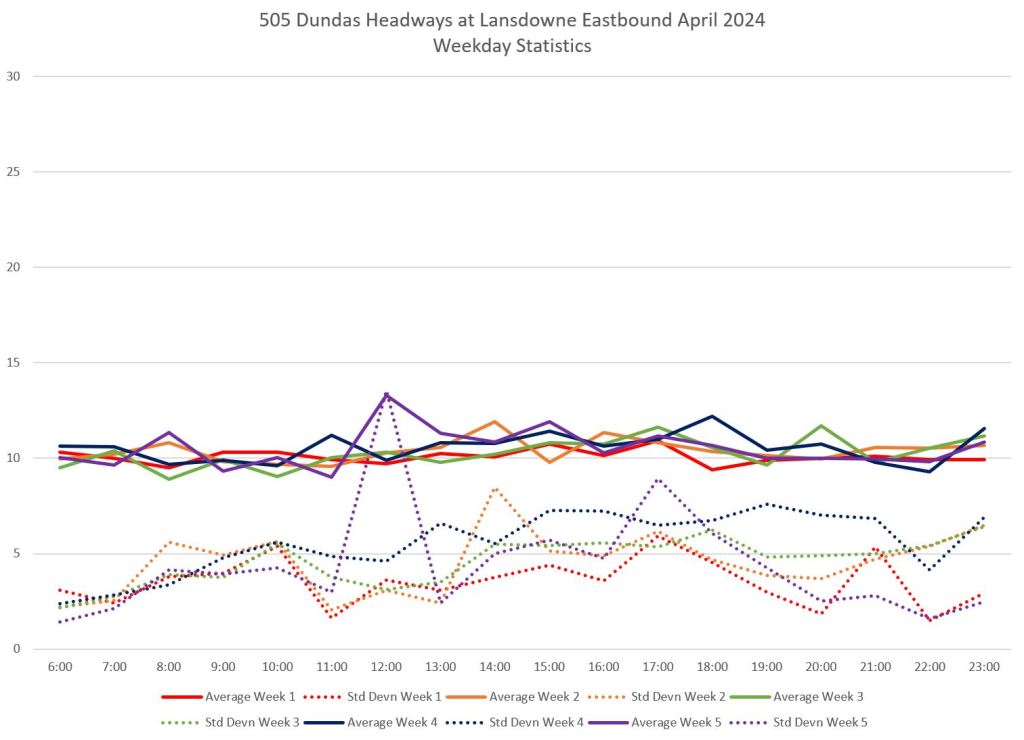
Eastbound from Dundas West Station to Yonge Street
The west end of the route is longer than the east, and there are more locations where service encounters delays as shown in the previous article. There are far more short turns at Lansdowne than at Parliament, and their effect on headways inbound from the terminus, Dundas West Station, is more severe. This shows up clearly in the weekday statistics where the averages lie above 10 minutes and reach 15 in Week 4. The standard deviation values are also very high especially in the afternoon and evening.
At Lansdowne, the short turns are included, and the average headways are closer to the scheduled 10 minute value. By the time the service reaches Yonge Street, the average headways have not changed much, but the SD values are higher.
The trend lines for Dundas West data routinely drift above 10 minutes showing the effect of short turns at Lansdowne. Eastbound from Lansdowne, the trend lines settle at close to the scheduled headway, but the individual values are scattered over a wide range. This continues eastbound at Yonge Street.
The last set of charts show all of the weekday data plotted on one page for each location. The intent is to show the scatter in values with a “cloud” of one month’s data. The maximum value on these charts is 60 minutes so that outliers clipped from the other charts are visible.
The data at Lansdowne have fewer very high values thanks to short turns, but the cloud spreads out more in the Yonge Street plot showing the cumulative effect of bunching and related gaps.


That variance of the headway cannot be accepted. If you are relying on the TTC to commute somewhere and a scheduled 10 minute headway regularly becomes 20 minutes or even more then you must by default plan for it to be 20 minutes to get where you going on time. This sucks another 10 minutes each way out of our already stressed lives.
It also destroys the incentive to make occasional trips on the TTC. It’s not simply choice riders selecting a different travel mode, it’s also the captive riders who will simply not make the trip at all, perhaps by delaying it and rolling it into other trips if possible, or simply choosing not to make the trip at all. That has economic consequences too.
Steve: A further issue is that erratic headways discourage transfers because each of these might encounter a large gap and the effect compounds with each link.
LikeLike
They need monitoring of the actual location and speed of the vehicles like Transport for London does. See the section at 10 minutes of this video.
Steve: Managing to headways rather than schedules, what an amazing concept!
LikeLike
“Lies!, damn lies!!, and statistics!!!” I don’t believe the numbers. On a route I take often enough, not once this year has a mid-day Dundas car arrived quicker than 20 minutes (Sherbourne-McCaul either way). Same goes for the Carlton car (Sherbourne-Elizabeth either way). And then the cars are overcrowded.
I notice on the TTC table generous lay-overs at the termini (the column Term Time min.), example M-F mid-day is 12 minutes.
Check my math – Dundas mid-day – route length 21.71 km; 14 cars on the road; equals one car for every 1.55 km or .64 cars per km. Average speed 10.2 km/hr., = 6.53 cars/hour or one car every 9.2 minutes. Fair enough, the TTC claims one car every 10 minutes headway.
However, as Steve points out, the standard deviation of points on the scatter graph is high.
Would many dots below the 10-minute standard indicate a lot of bunching? On the vehicle use summary 240101-240215 posted recently, we see 60 idle streetcars. If standard headway were reduced (say, to 5 minutes) by putting more cars in service and decreasing standard lay-over time – would that increase reliability, help alleviate overcrowding, and reduce incidences of those crazy long waits on this very busy major route?
Steve: Yes, many dots below the 10-minute line do indicate bunching especially if they are close to zero. Putting more cars on the line would definitely reduce the size of gaps, although proper headway management would still be needed. There is a big problem that tactics that worked just fine when vehicles were half the size and twice as frequent don’t work with large vehicles on wider headways. We saw this decades ago on 501 Queen when the change to the ALRVs coupled with typical line management managed to drive away a lot of riders due to poor service. 504 King held its own during the same period. The less frequent the service, the more important it is that the cars arrive reliably. Riders don’t give a damn about “on time”, but rather about how long they have to wait and whether their bus or streetcar is crowded.
LikeLike
What good is having frequent headways, when the city of Toronto continues to prioritize the single-occupant auto over public transit?
Link to this short 3 minute video at Broadview Station, where a streetcar tries to enter Broadview Avenue…
The 504 King & 505 Dundas streetcars carry more than 100,000 people per day. It should not take them upwards of 3 minutes to leave the loop.
Steve: For the record, the daily ridership on King in fall 2023 as reported by TTC was 54,360 and for Dundas was 32,309.
The idea of putting a traffic signal at Broadview and Erindale has come up before and was rejected because this would put three in a row in close proximity from Danforth to Pretoria, one block north of Erindale. One thing that shows up in the video is traffic backing up across Erindale. Even with a traffic signal, there is no guarantee there would be a clear lane for the streetcar to enter/cross the intersection, but it would be interesting to see. Note also that a transit priority signal triggered by a streetcar’s presence could easily produce unwanted east-west green time while a car served the stop on Erindale.
Please don’t suggest that the “solution” it to get rid of that stop. The TTC loves to make transit less convenient, increase walking distances and indirectly encourage jaywalking by “simplifying” routes with fewer stops forgetting that access time is part of total travel time.
In the video, the clear problem is a motorist blocking the streetcar who is extremely timid. This is not a location for timidity and drivers have to take every opportunity to claim their space.
LikeLike
“In fact, the TTC does not even achieve its own lax standard.” Pretty pathetic, isn’t it? Thanks for this. And of course, the chaos is even worse this month with the 25 and 925 being diverted to Broadview.
Something’s really got to give.
LikeLike
Instead of a traffic signal at Erindale Ave. and Broadview, how about no left turns allowed 7 am to 7 pm (TTC excepted, of course)? I am looking at a map online, and I see a Pretoria Ave. next street up – does it have a traffic signal? It could take traffic off Erindale. There seems to be a laneway south of the subway station, arrows indicating one-way southwest, not sure what that is about. I am not all that familiar with that area, it has been a year since last visit. Steve, you live around there, what do you think?
Steve: Yes, Pretoria has a signal and that sometimes throttles traffic that backs up across Erindale northbound. As for laneways, no hope there. A short one onto Broadview only serves as access to the back of the CIBC branch. There is a long laneway behind the stores fronting on Danforth, but it ends on the east side of the subway station. In any event, it would be too close to the Danforth intersection if it did go through to be an alternate for Erindale traffic.
LikeLike
I have found it very informative to watch the real-time vehicle movements through the day. For example:
https://retro.umoiq.com/googleMap/?a=ttc&r=501&r=503&r=504&r=505&r=508&r=301&r=304
… and you can just edit the numbers in the URL to display different routes.
I have noticed a sudden change in 505 Dundas in the last two weeks (the second half of May 2024) when watching this and from experience on the ground.
In the last two weeks, the spacings between the 505 vehicles have gone haywire. In contrast, it was perfectly workable for several months before that (for someone who checks vehicle status a few minutes before walking to a stop, and taking an alternate route if there happens to be a gap — I enjoy this but shudder to think of the experience of most ordinary passengers who don’t have this data).
But in the last two weeks, the 505 is suffering from extreme bunching, and maddening consistency in huge gaps in service. Perhaps the line management has gone from “casual” to “vacation”? Another possible cause might be the appearance of CafeTO patios in the outside lanes causing cascading effects to traffic?
Steve: I will get the tracking data for May sometime next week and can update the article. I was monitoring the 506 for a while today (May 31) and the cars all seemed to be moving glacially. Not sure what was going on, but the service was bunched as usual.
LikeLike
According to the Vienna Convention on Road Traffic, trams (streetcars) have always the priority in unsignalled intersections. Unfortunately, Ontario does not follow the Vienna Convention.
Unlikely to see changes to MTO, at the current time.
See also Marco Chitti on X.
LikeLike
Steve, I had opportunity to use Broadview station the other day, and although pressed for time, I made special notice of the laneway. Looks like that at one time it was continuous, but the bank has erected a tall fence blocking the lane to create a small parking area. So, the online map was out of date. Quite the busy station, with streetcars and buses coming and going.
Steve, you most likely know of and maybe visited Supernova Coffee, a lovely café exactly two bus stops up from the station, 897 Broadview Avenue at the corner of Browning Avenue. I was there to see an exhibit of paintings by my friend of many years Mara Ravins (http://www.mararavins.com). Her art display ends June 30th.
LikeLike