A year ago, I reviewed the usage of the bus fleet to compare the total size with actual usage. See:
In this round, the data are from January 1 to February 15, 2024. As before, the raw information has been provide by Darwin O’Connor from his TransSee website, for which much thanks.
The amount of service the TTC operates is limited mostly by budget, which in turn dictates how many operators the system can afford, but there is also the question of bus availability and reliability.
Updated May 20, 2024 at 3:10pm: Link to UITP report on in-motion trolleybus charging added at the end of the article.
Reliability
Buses that break down interrupt service and incur greater maintenance. Buses that never leave the garage might show up on the roster, but they are not really available.
For many years, the ratio of spare buses to scheduled service on the TTC has been quite high by industry standards, and this grew during the pandemic thanks to service cuts. Restoring full pre-pandemic service, let alone expanding beyond that level, does not depend on fleet size in the short term. Moreover, many of the elderly vehicles on the system will be replaced with new diesel-hybrids now on delivery, and this should increase the number of buses actually available for service. Opening of Lines 5 and 6 Crosstown and Finch West should also release buses for use elsewhere.
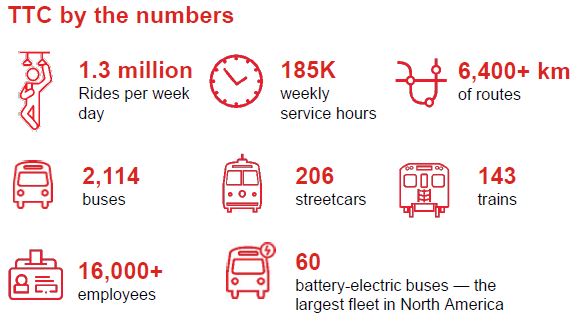
The May 2024 CEO’s Report shows the current official fleet size.
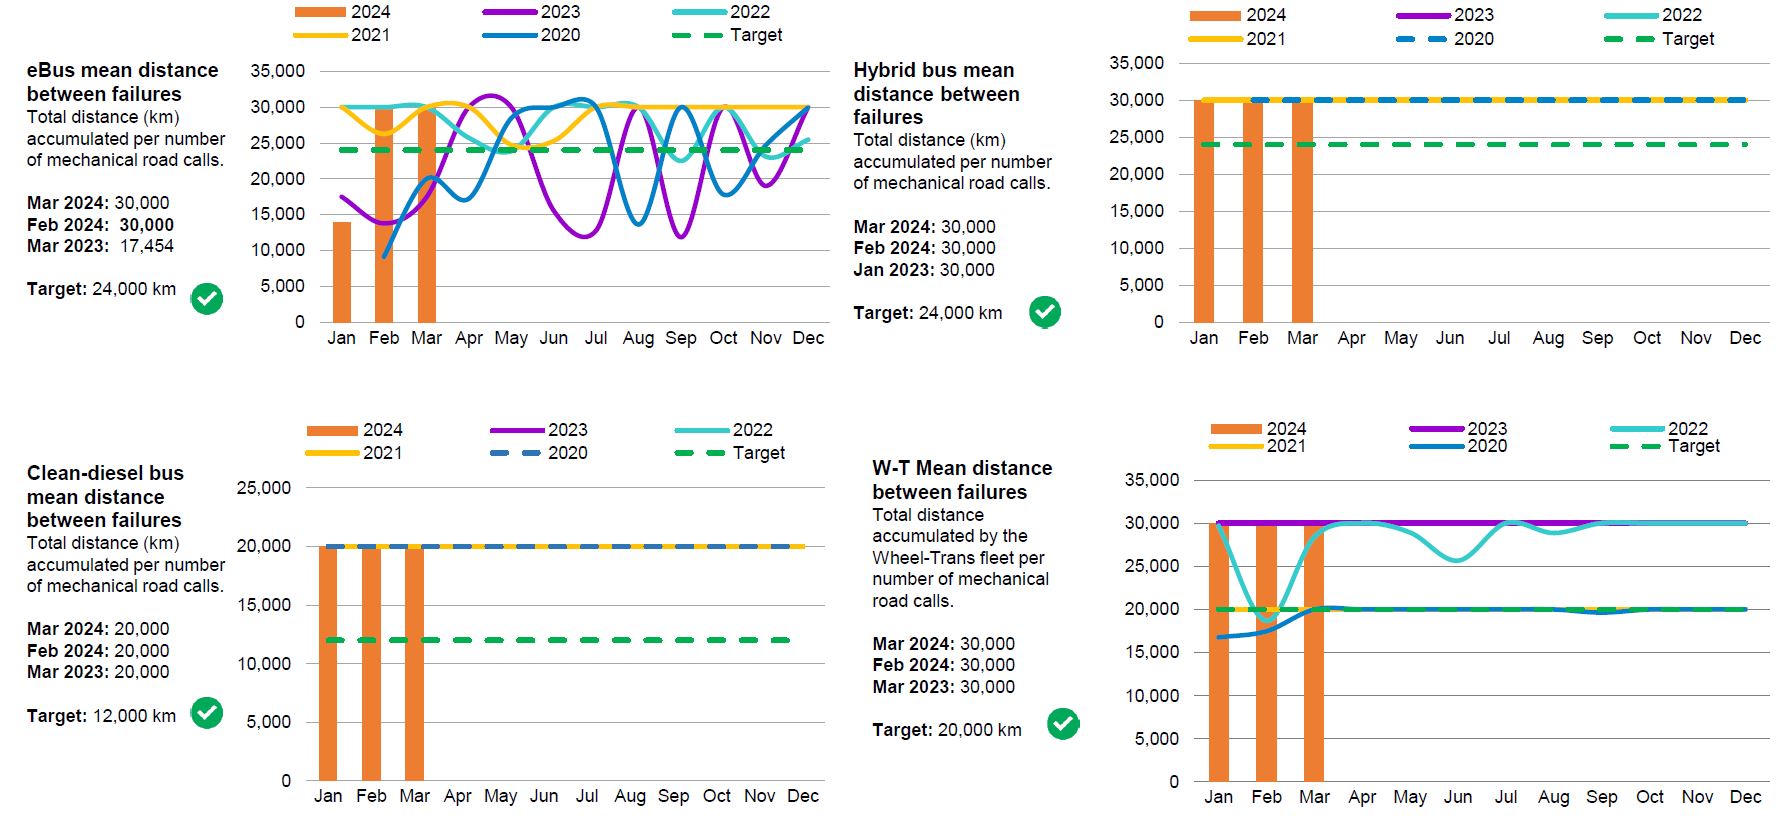
The reliability of buses is reported in an odd way by the CEO. The charts below have capped the reported mean distance to failure at a target value rather than reporting actual values for several years. We know that hybrid buses achieve at least 30K kilometres between failures, and diesel buses achieve 20K, but the actual numbers could be both higher and more variable than the charts show. Meanwhile, some values for battery eBuses are capped and others wander quite a bit. Note that both the target level and y-axis maxima vary from one chart to another.
An important factor here is that buses that never, or rarely, operate in service do not contribute to failure statistics, and this can hide the true reliability of a fleet, or subgroup within the fleet. Unused buses represent capital sitting idle and service that cannot be provided. If budget cuts prevent full usage of the fleet, this is hidden, but there could be an unseen cap on what is possible if budget priorities change.