
When the Scarborough RT closed, it was replaced by a bus shuttle, 903 Kennedy-Scarborough Express, running frequent service over streets paralleling the former SRT route. In previous articles, I reviewed actual travel times to determine how much traffic interference and transit priority contributed to speedy travel. See:
Since mid-November 2023, service between Scarborough Town Centre and Kennedy Station has been provided by many routes with the intention of eliminating transfer delays at STC. The following routes were extended south to Kennedy Station following the same route as the 903 Express. At the same time, service on the 903 was reduced as buses were redeployed to the other routes.
- 38 Highland Creek
- 129 McCowan North
- 131 Nugget
- 133 Neilson
- 938 Highland Creek Express
- 939A/B Finch Express
- 954 Lawrence East Express
- 985A Sheppard East Express
Debate over the planned busway in the former SRT corridor focuses on travel time savings using a private road from Eglinton to Ellesmere, but an important aspect for any rider is the wait time for their bus. The benefit of a faster ride can be undone by an unpredictable wait. This series of articles reviews service reliability on the extended routes as well as the remaining 903 Express operation between mid-November 2023 and the end of February 2024.
With all the focus on the shared route between Scarborough Town Centre and Kennedy Station, there remains the much longer portion of routes that have been extended. While the red lanes, and later the BRT roadway, should minimize further sources of irregularity, this does not change the fact that some of these routes have service issues east and north of STC.
This is part of a more general issue across the bus network that improvements are needed that will not come quickly or easily simply with a few transit priority projects. Moreover, riders need to see improvements now, not in the indefinite future after studies, priority lists and endless debates about who “deserves” better transit.
Included in Part 1 are routes 38, 938, 129, 131 and 133. The remaining express routes are in Part 2.
Updated Mar. 16, 2024: Route map added.
Introduction
The volume of data that I have since the SRT bus replacement service began operating is quite substantial, and I will only publish a subset of it here.
Route 38 Highland Creek is covered in more detail than the others to show the type of information that is available for in depth route analysis.
The routes serving the SRT corridor have at least two natural points where regular headways could be re-established:
- the inner terminal, Kennedy Station
- the outer terminal (e.g. Rouge Hill GO for 38 Highland Creek)
- at STC station
- at UTSC Loop (route 38 only)
There is no sign of buses being dispatched at intermediate points to smooth out headways. Inbound from STC this does not really matter because of the combined express service on many routes, but the situation is different outbound where riders want a specific route for their journey.
Even for riders on the common section, a problem since mid-November is that routes load in separate locations unlike the former single 903 Express bus, and it is not always clear where the next departing bus might be.
38 Highland Creek
The 38A Highland Creek bus operates between Kennedy Station and Rouge Hill GO Station via STC. A 38B short turn runs to the University of Toronto Scarborough Campus (UTSC) weekdays midday and PM peak. The scheduled service is shown in the tables below. There was a change in mid-February with wider headways during some periods.


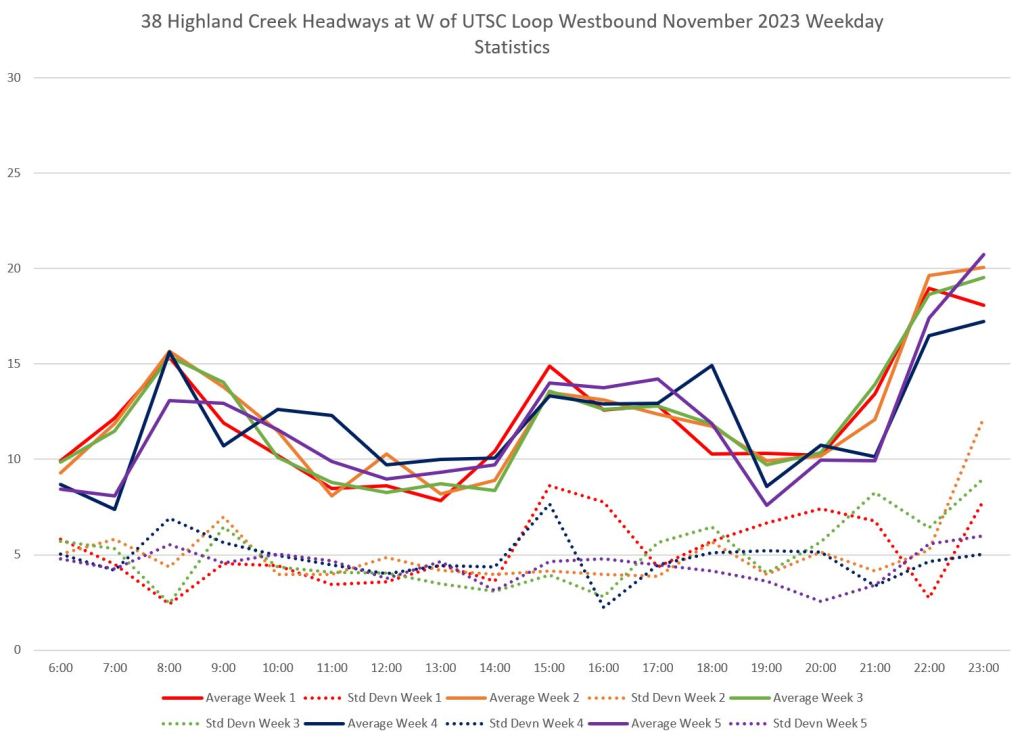
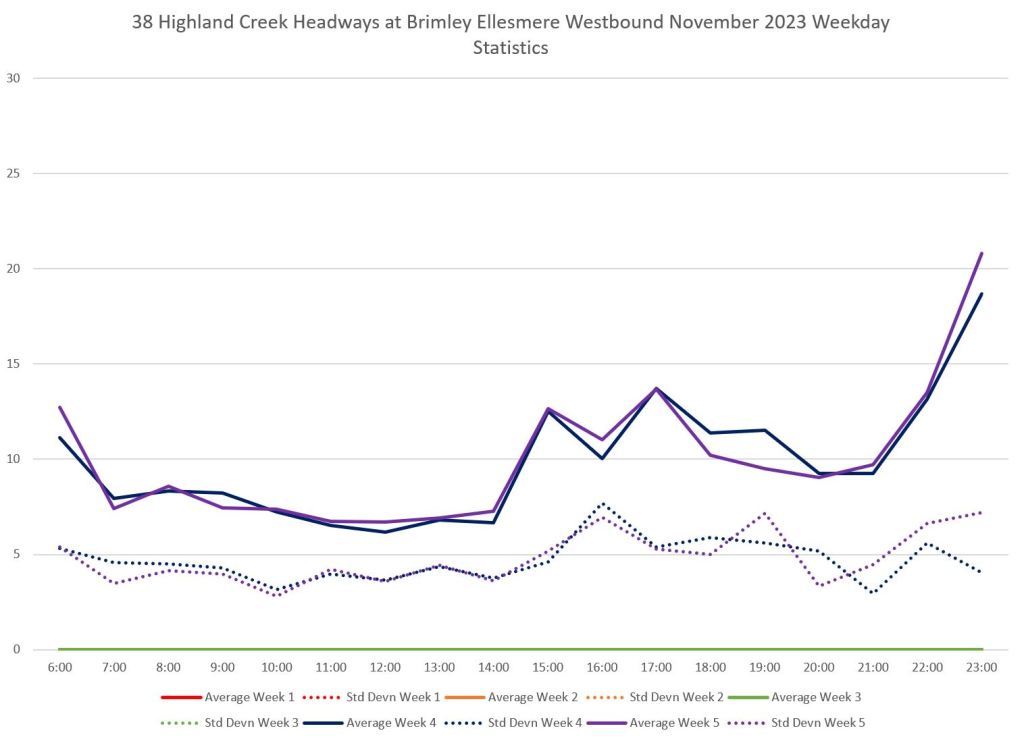
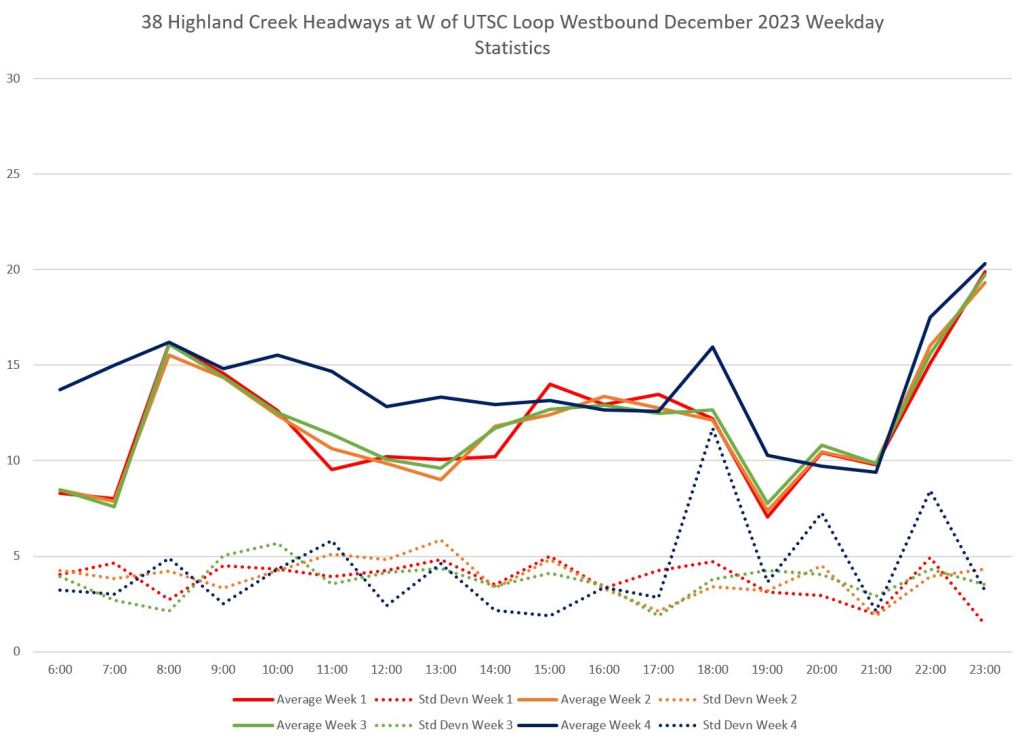
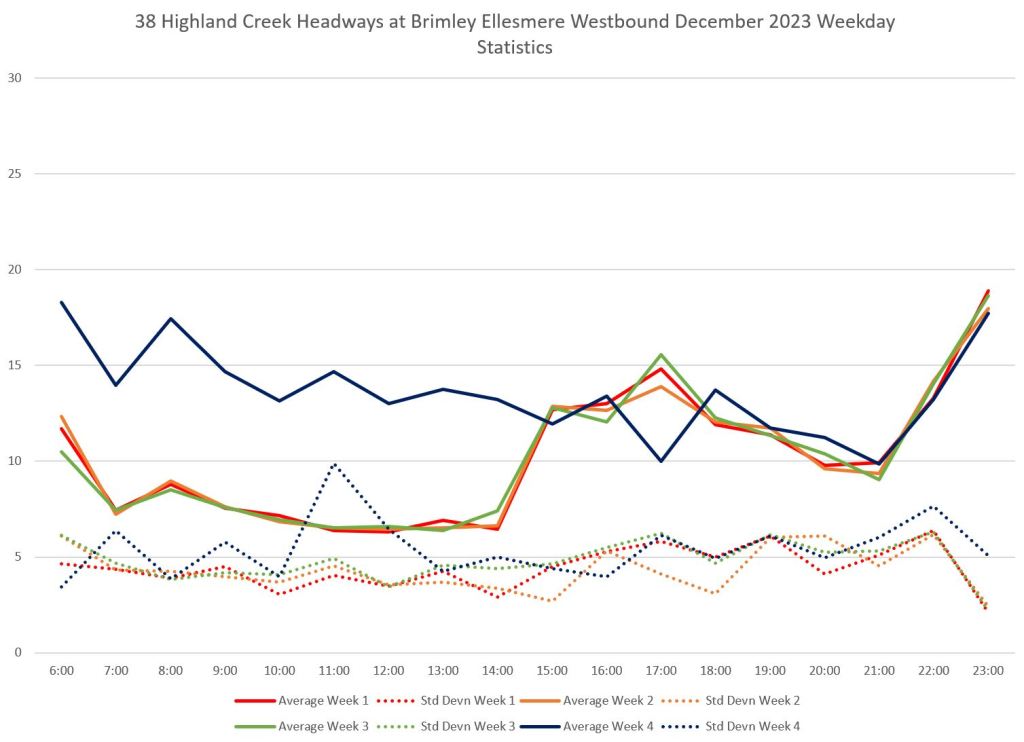
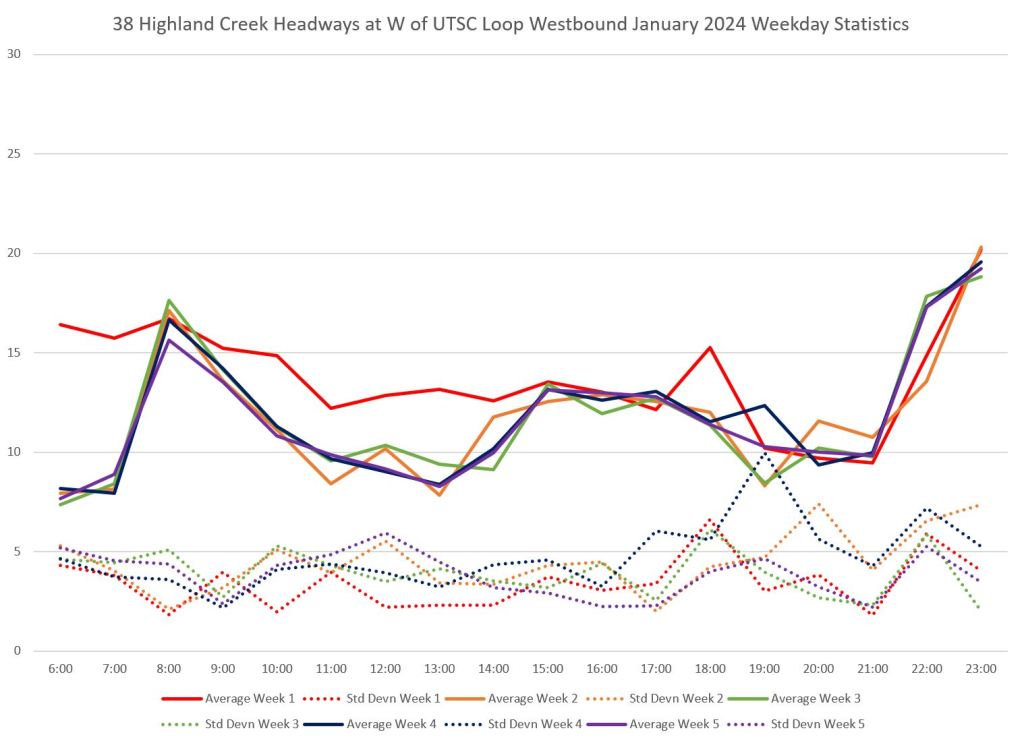
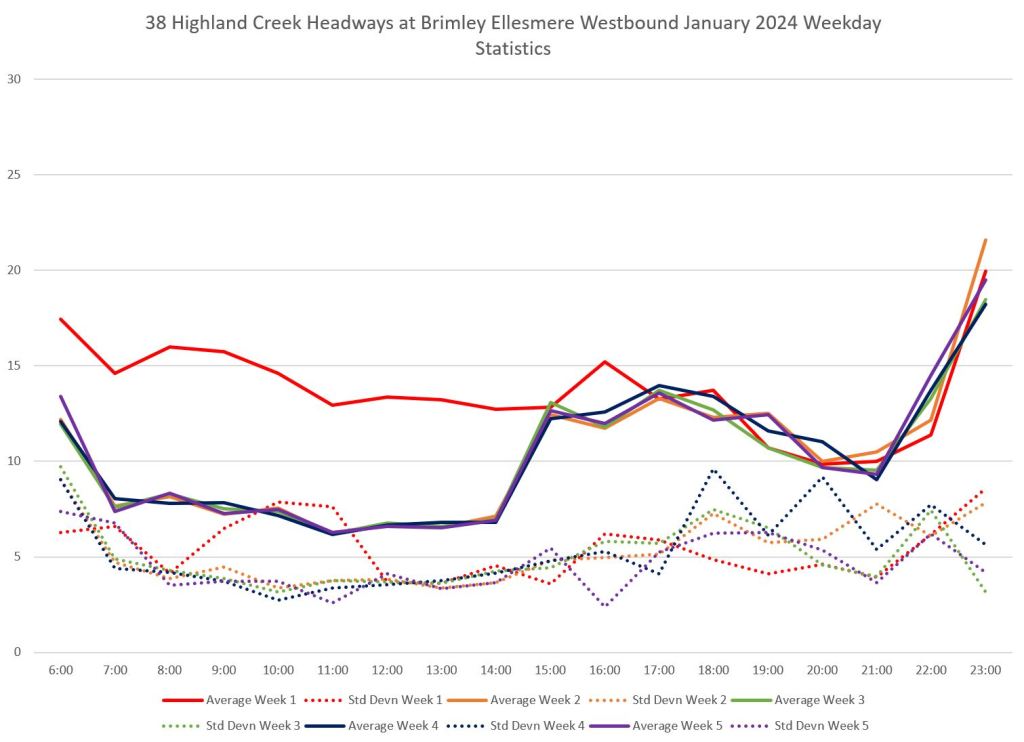
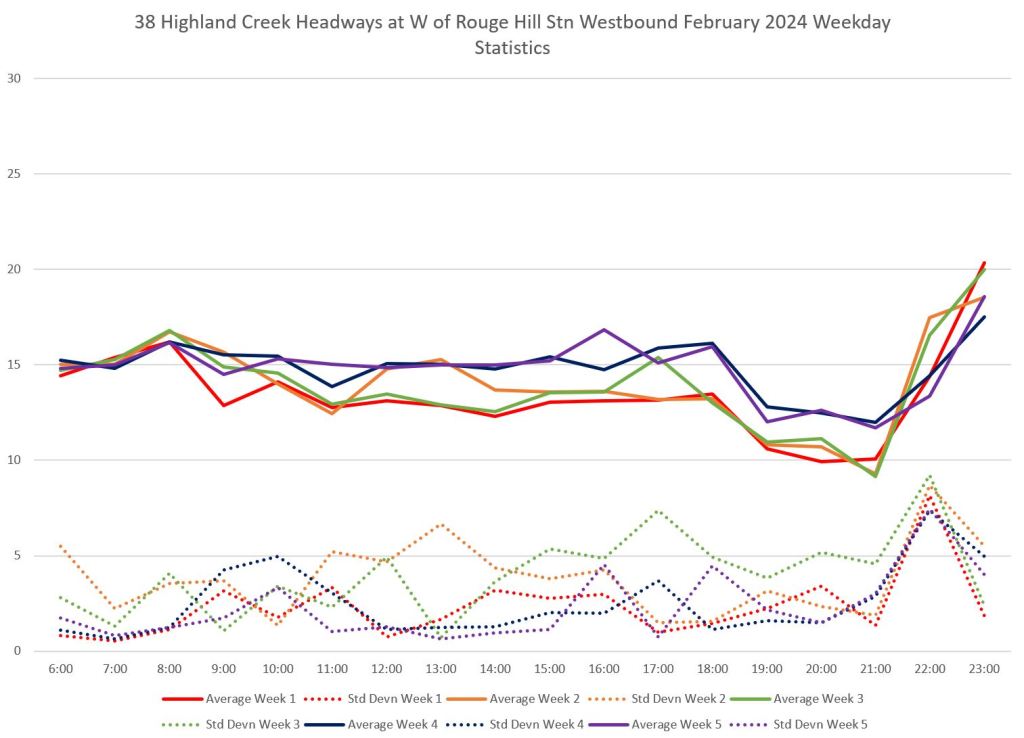
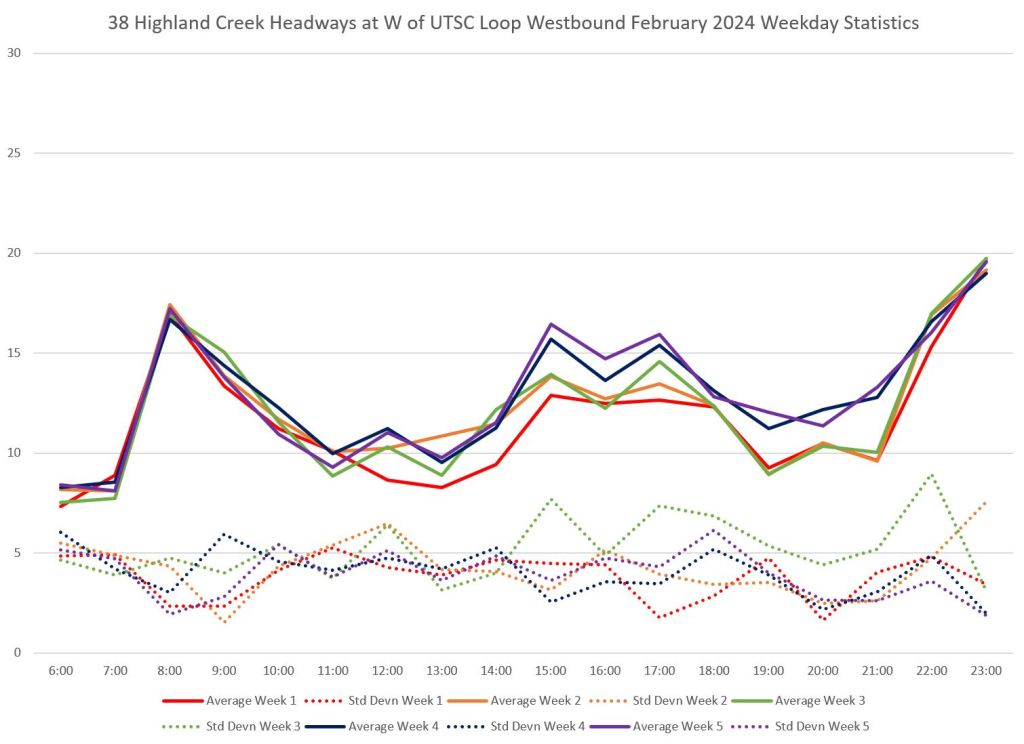
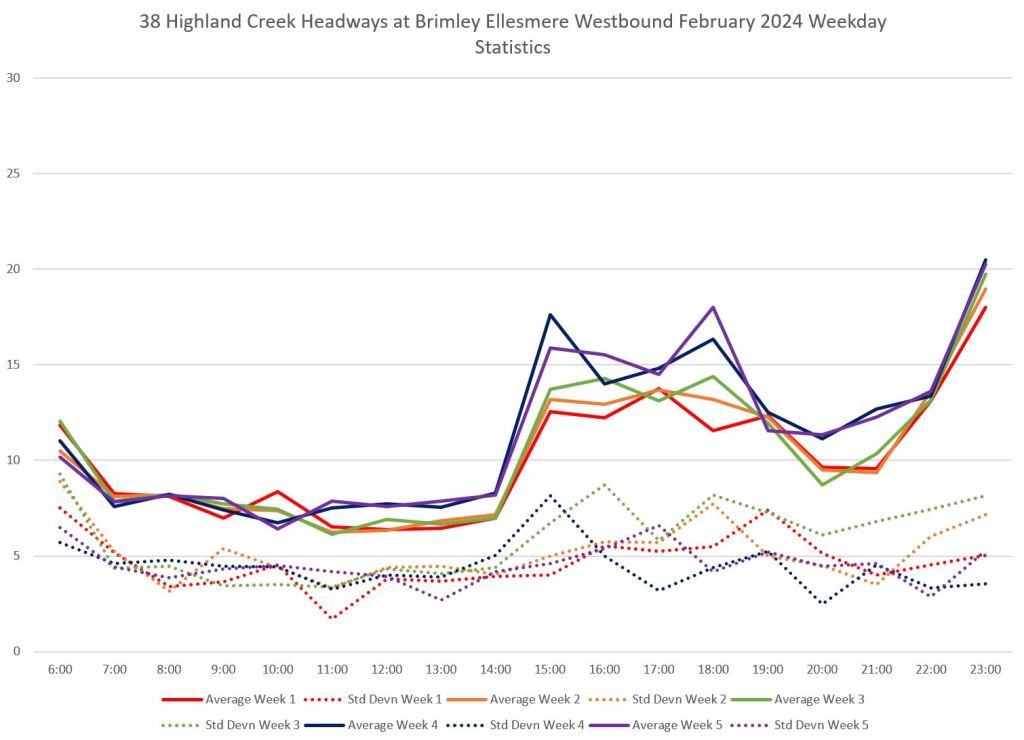
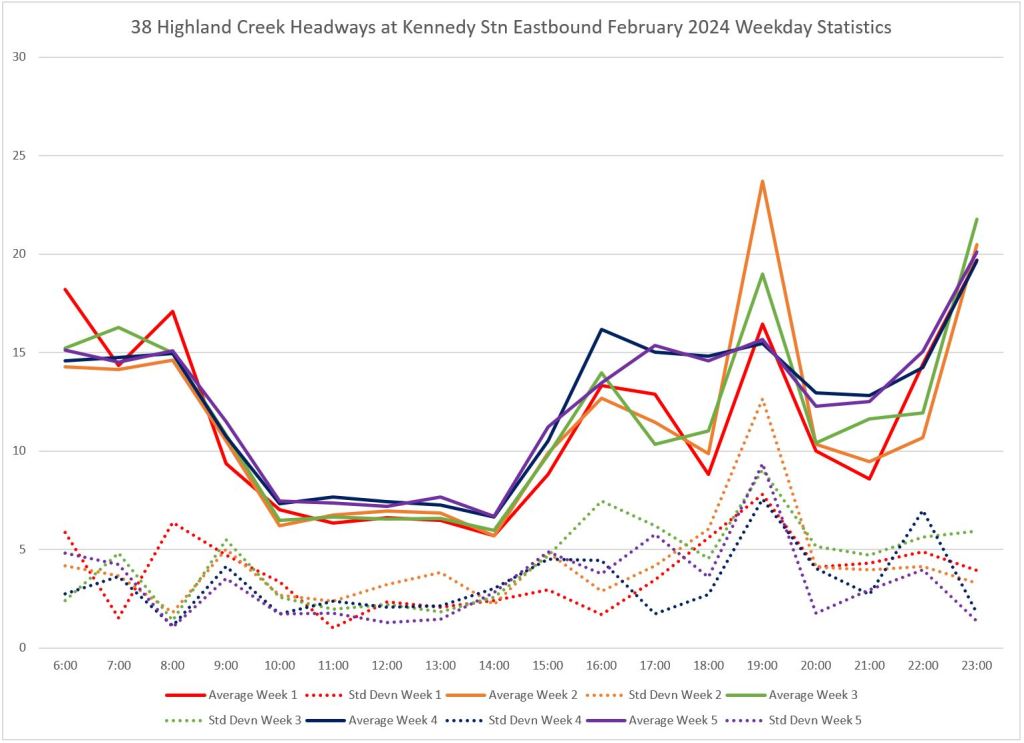
The first three charts below show westbound weekday service statistics as seen leaving Rouge Hill GO, UTSC and STC. Note that headways in the PM peak from UTSC reflect the fact that some trips travel express as 938s and they are not included here.
The point about the statistics really lies in the dotted lines which show the standard deviation in headways for each week hour-by-hour. At Rouge Hill, these values are only a few minutes much of the time indicating that most headways lie in a range of ±3 minutes to the schedule, although not all of them. By the time the service leaves UTSC, the SD values are higher indicating a range of at least 10 minutes, and this continues for service leaving STC.
This is well beyond any reasonable standard for service with a scheduled headway of 10 minutes or more, but the TTC has no standard at all except at the terminals. Riders may suffer, but there is no standard governing service where most of them actually use it, nor any reporting on mid-route service quality.
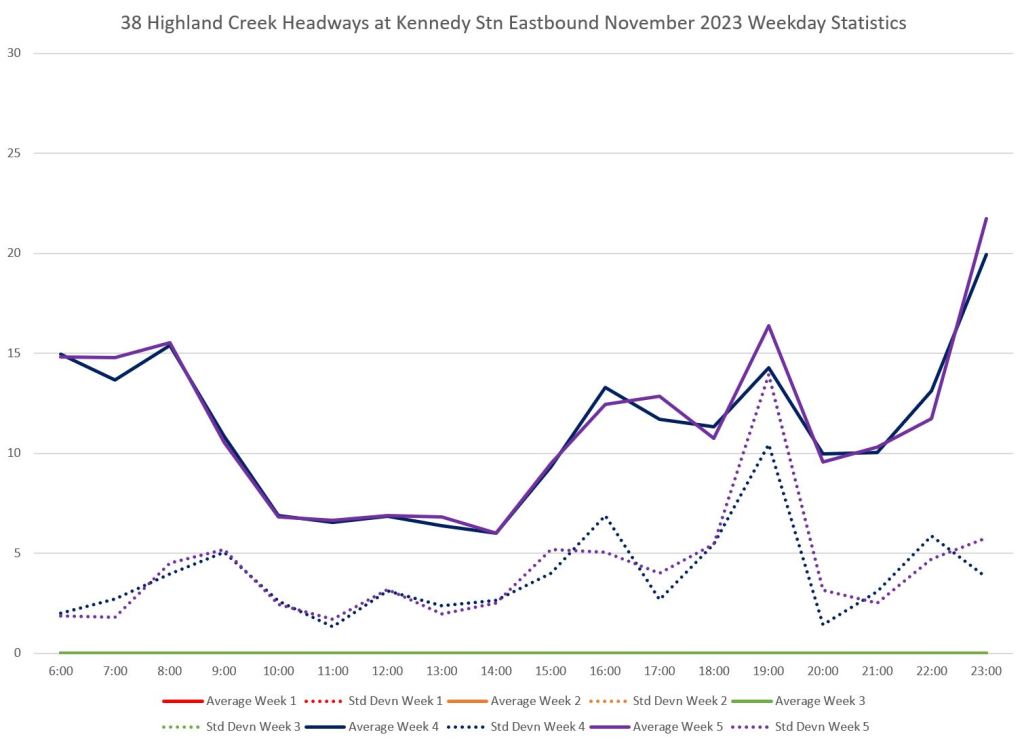
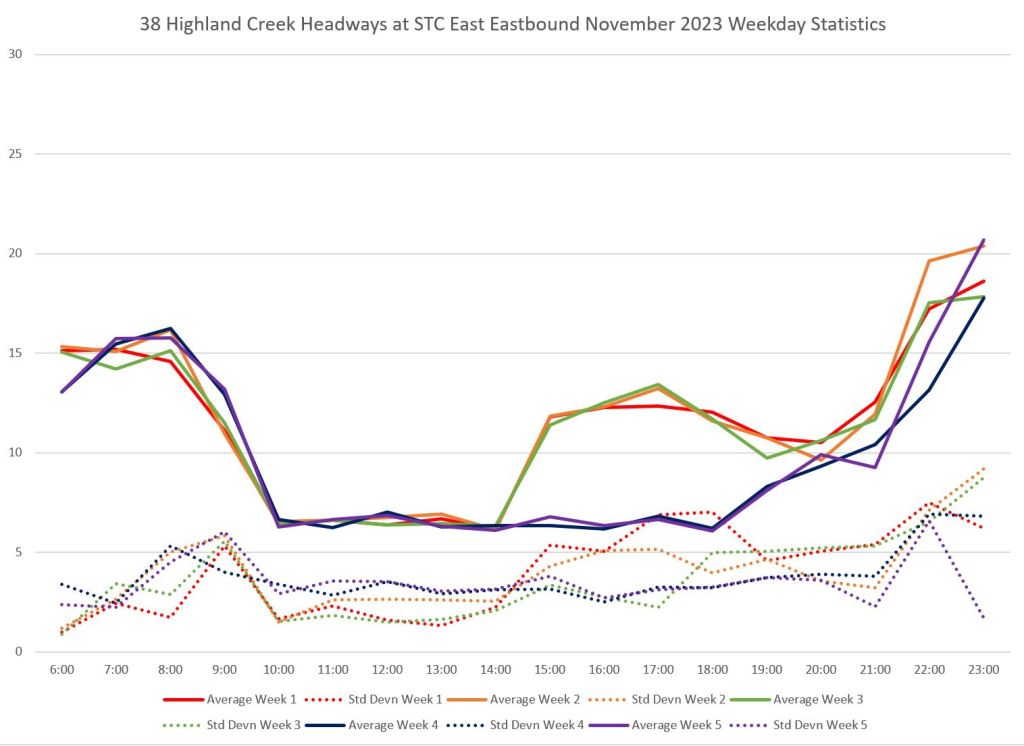
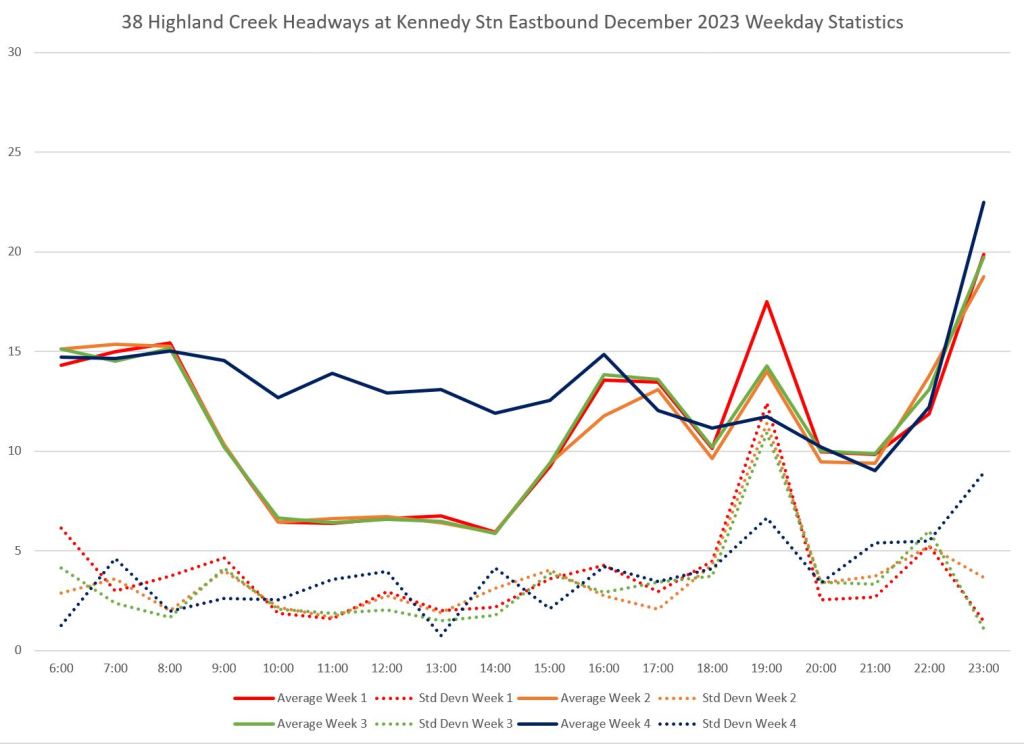
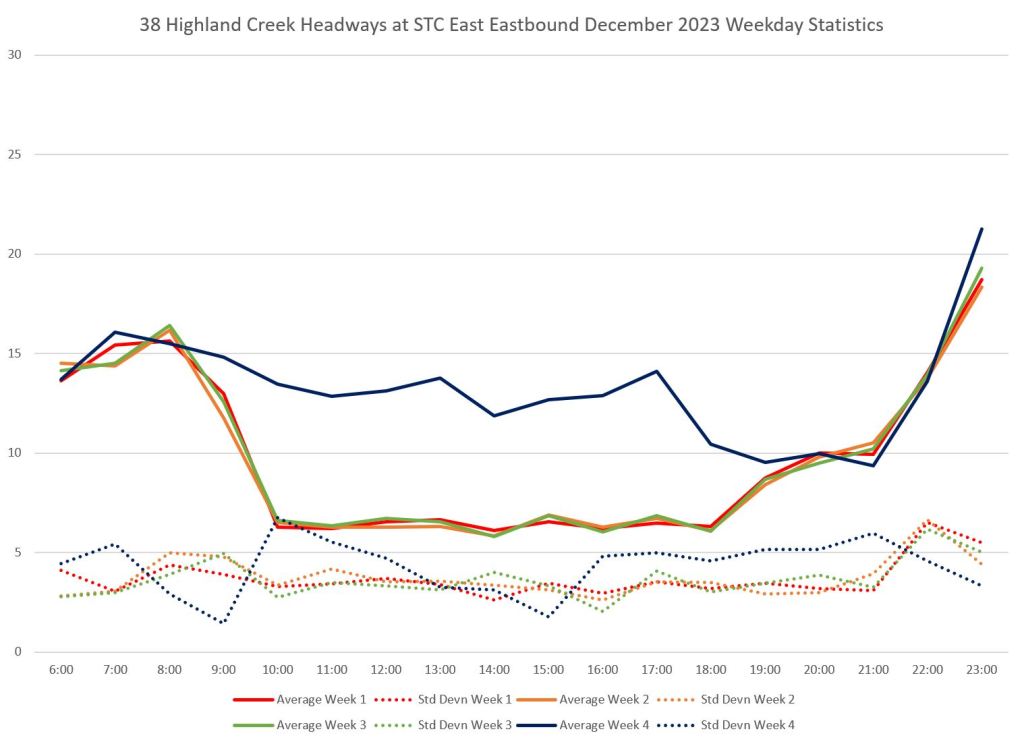
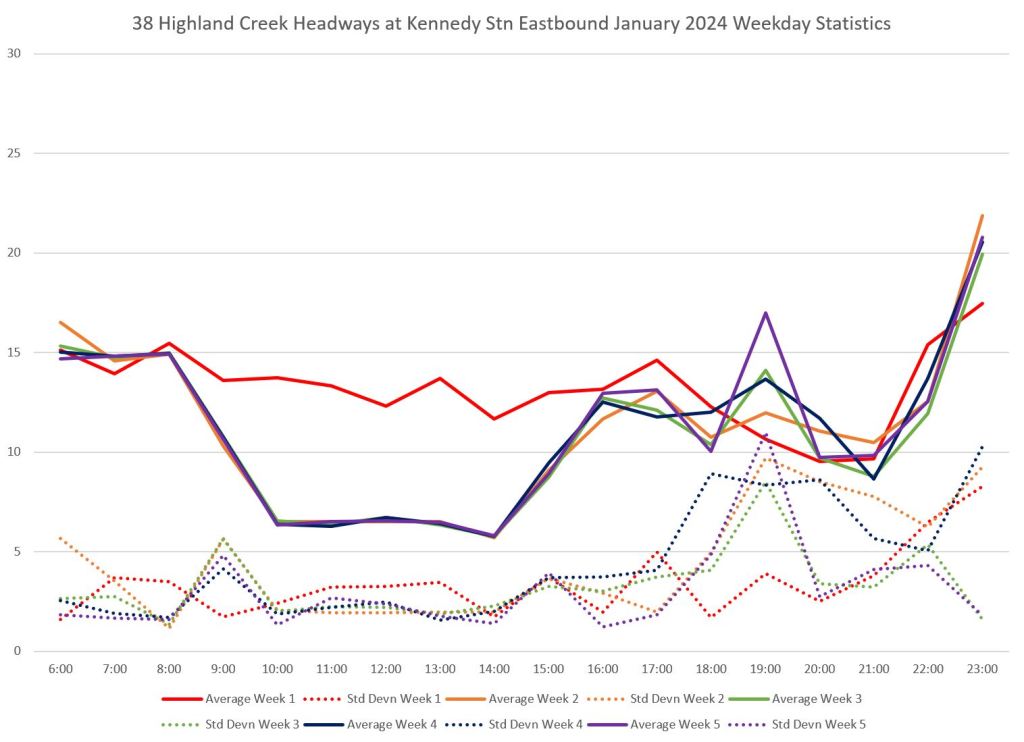
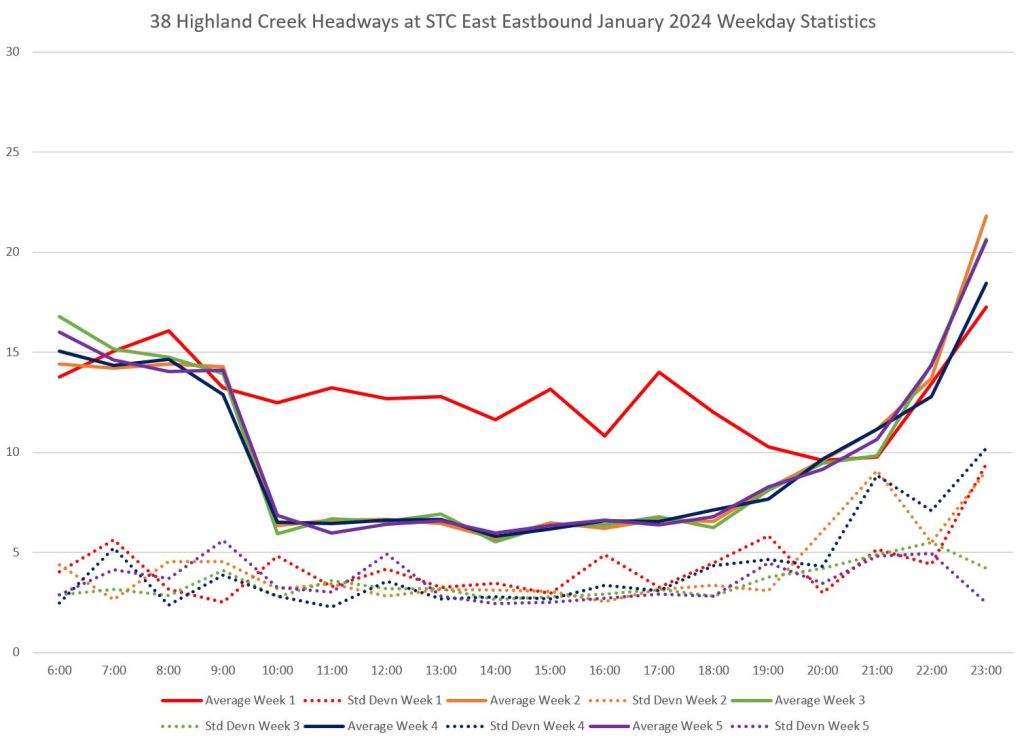
Note that service in early of November (weeks 1-3) did not include the route extension to Kennedy Station, and that service was reduced over the holiday period at year-end (week 5 of December, week 1 of January).


The service leaving Kennedy Station is somewhat reliable through the midday, but headways become more scattered in the PM peak and evening.
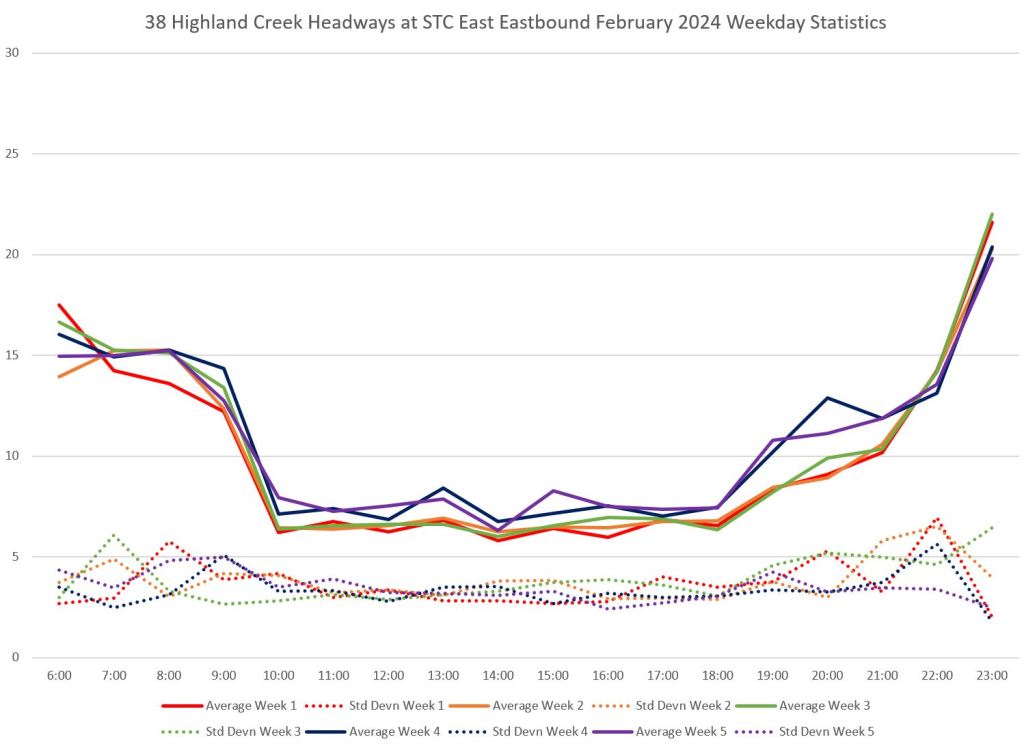
The PM peak jump in values is caused by some buses leaving Kennedy Station still reporting as 938 Express trips thereby throwing off the stats for regular service on 38 Locals at Kennedy Station, but they change to local 38 runs enroute. By the time the service leaves STC eastbound, they all show up in the local service.
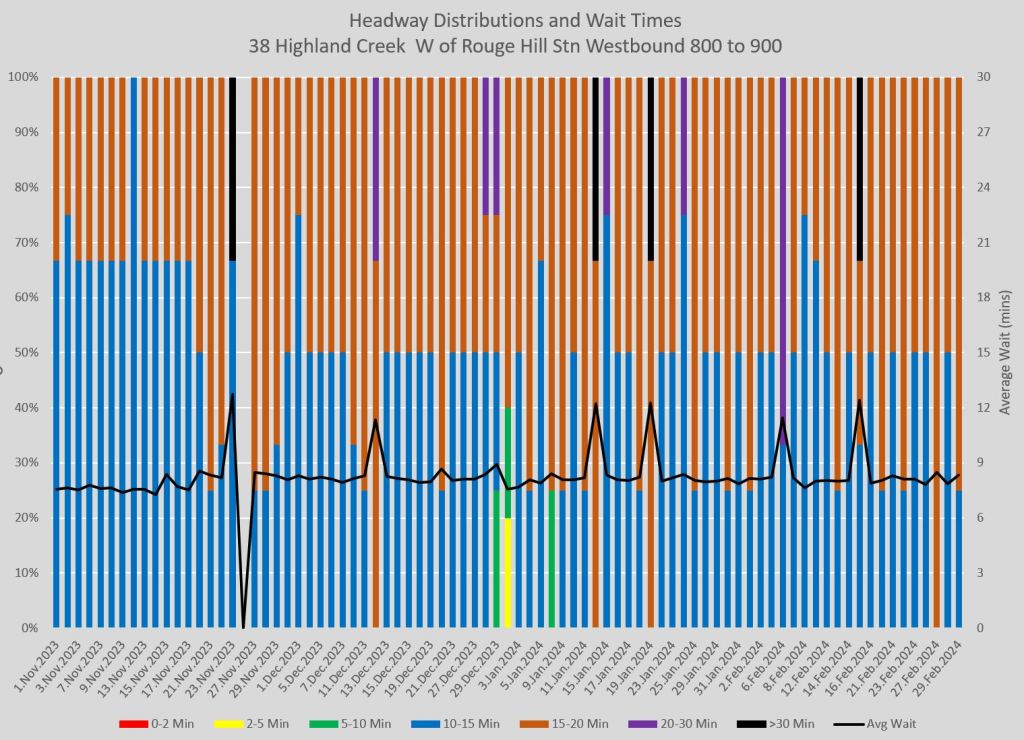
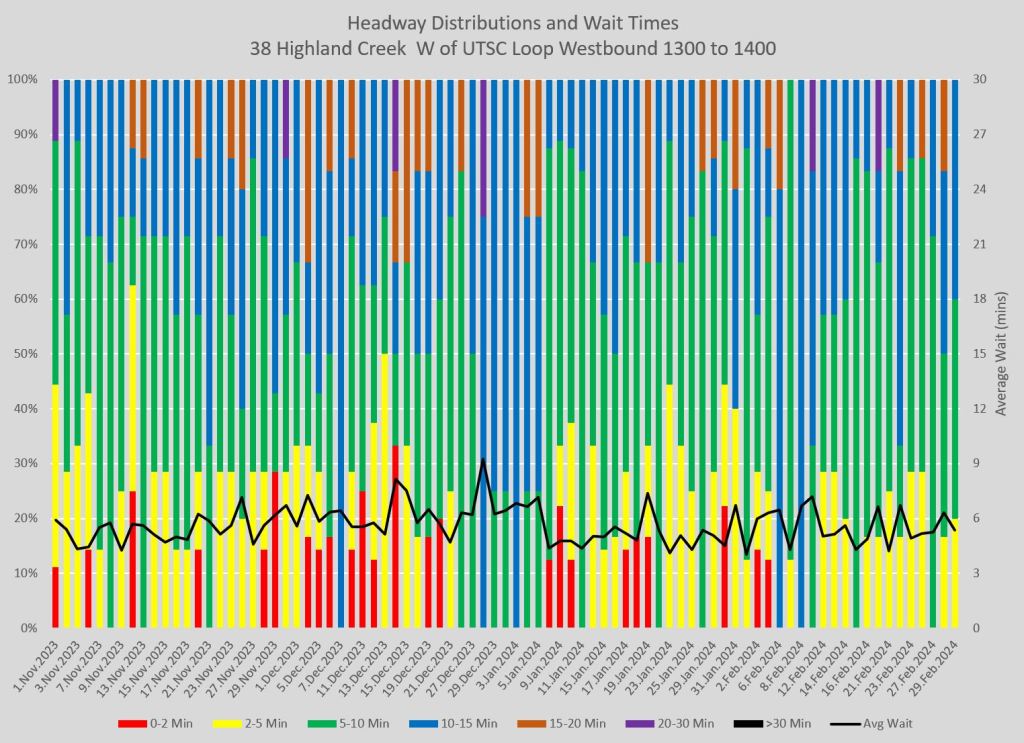
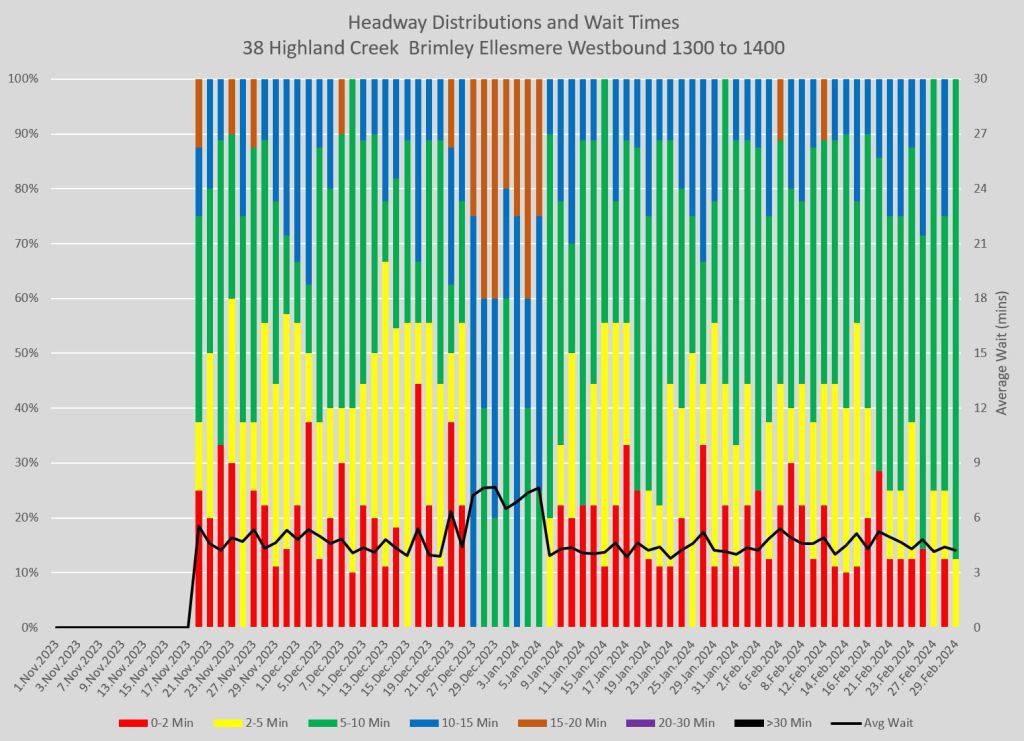
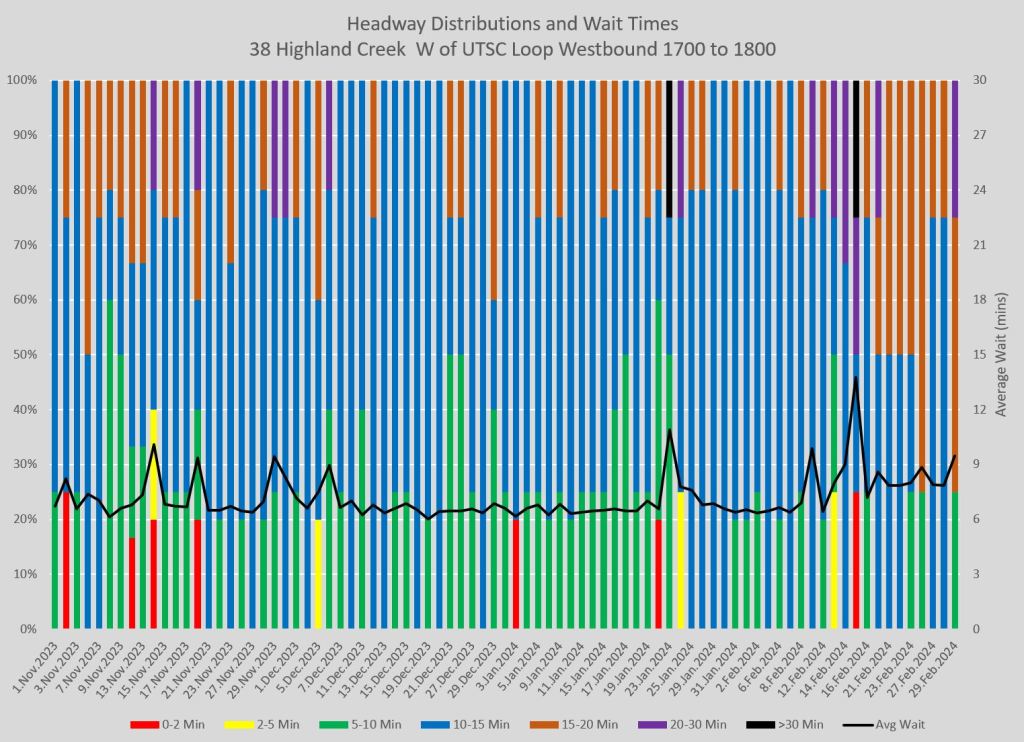
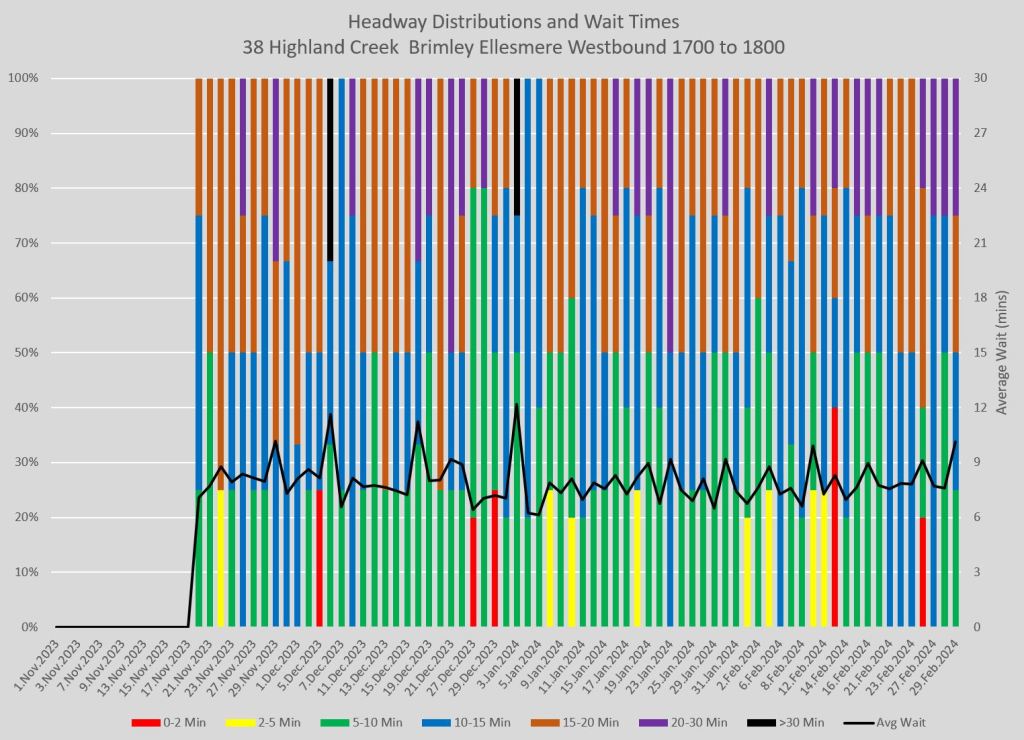
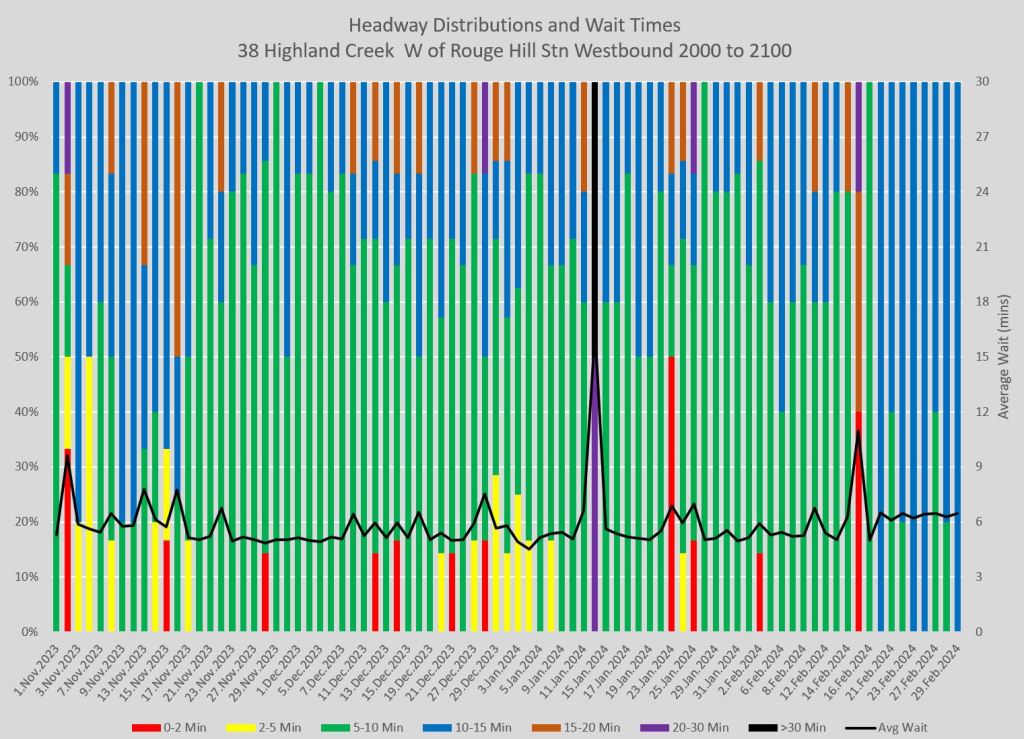
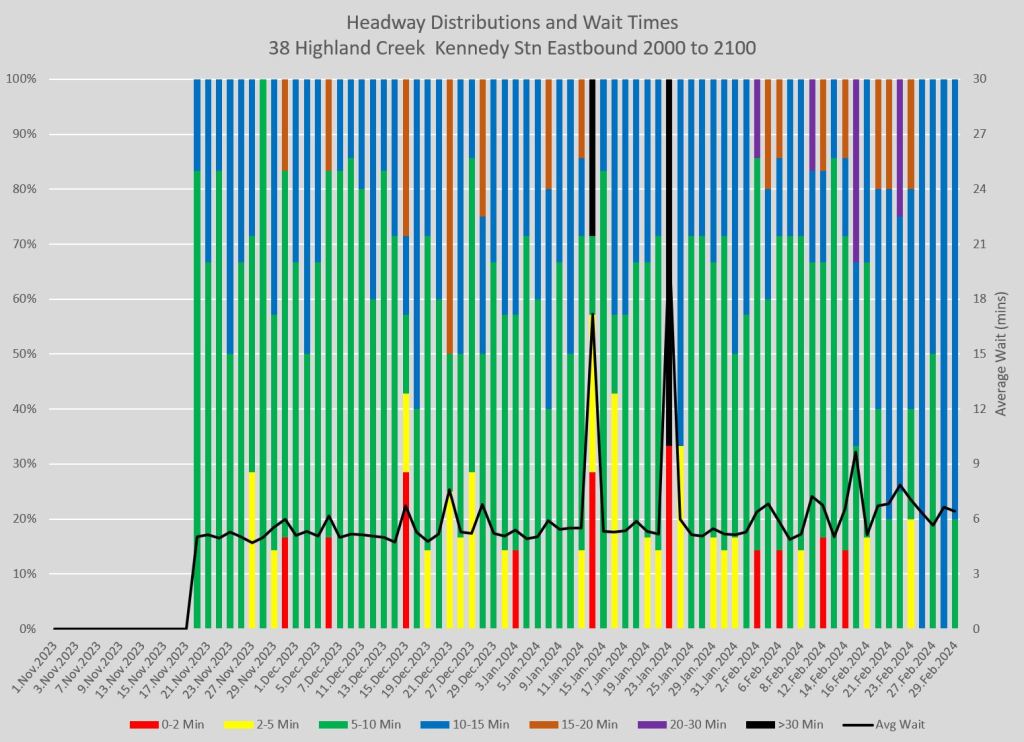
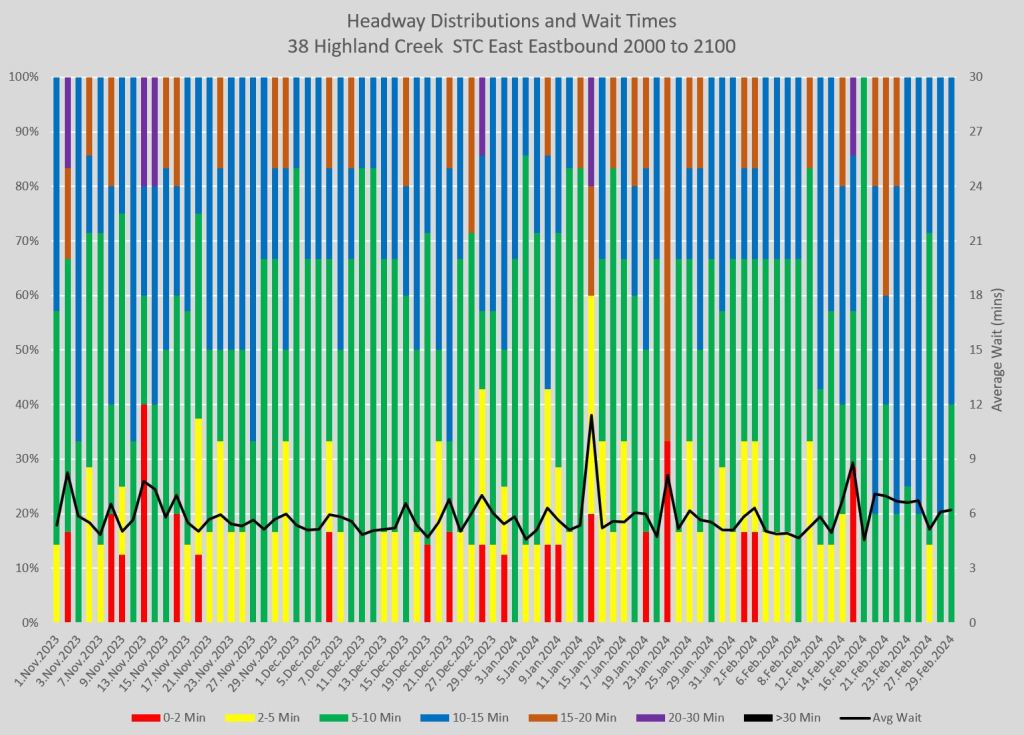
Another way to look at headway reliability is to plot the proportion of headways falling within specific ranges. The charts below compare headways westbound from Rouge Hill, UTSC and Brimley/Ellesmere from November 2023 to February 2024. Each row of charts shows one hourly time period in the AM peak, midday, PM peak and early evening.
Each colour band represents a range of headways, and ideally the bands should be consistent with the colour corresponding to the scheduled headway dominant. If they change from day to day, this illustrates a situation where riders cannot expect consistent service.
Red and yellow bands cover values from 0-2 and 2-5 minutes respectively which for most routes indicates bunching. Darker colours at the top of the chart indicate wide gaps. Note that a single wide gap can be followed by several short headways depending on the degree of bunching, and so the red and yellow bands tend to be more prominent.
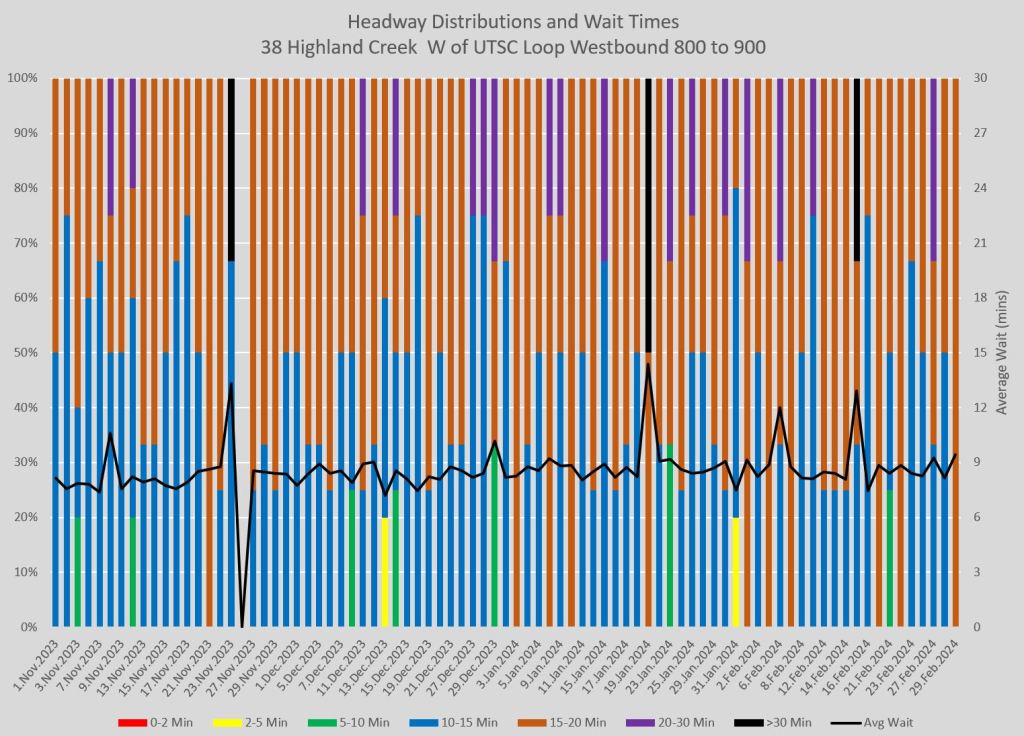
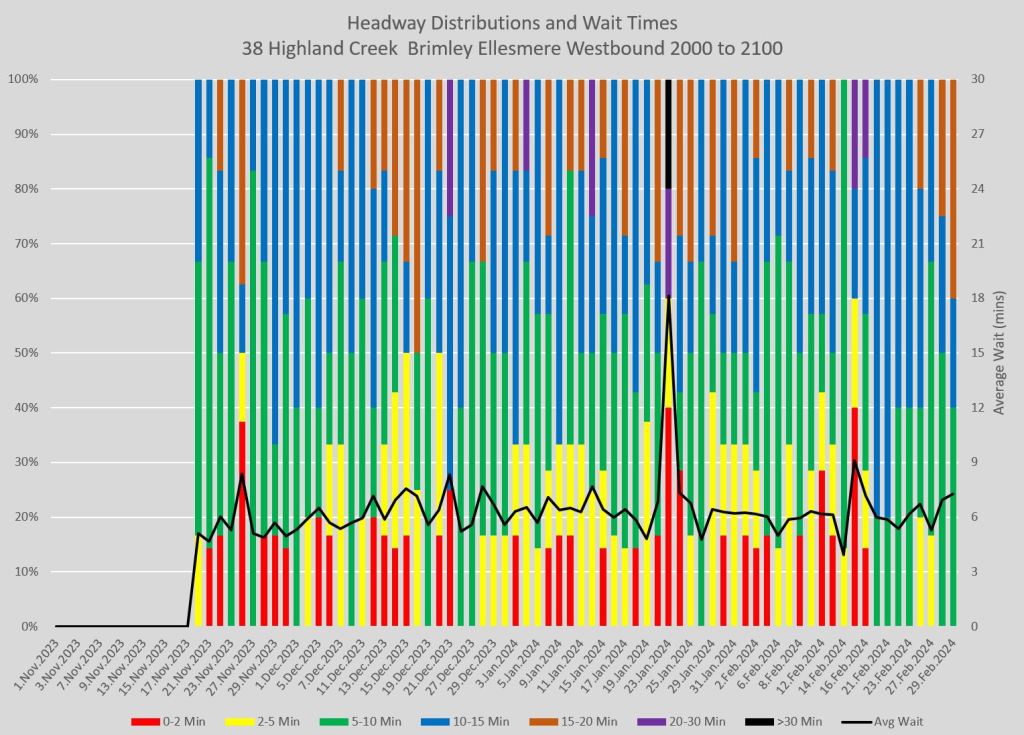
The three columns of charts correspond to locations progressively further from the terminus at Rouge Hill, and the change in the distribution of headways shows how service tends to bunch as it moves west along the route. The character of the service also varies by time of day with four intervals reading down each column.
The horizontal black lines show the weighted average wait times. This reflects the fact that if service were absolutely regular, the average wait would be half a headway, and all riders would experience the same service quality. When service is erratic, the number of riders affected by gaps is higher than average, whereas fewer riders have the benefit of a short wait from bunching.
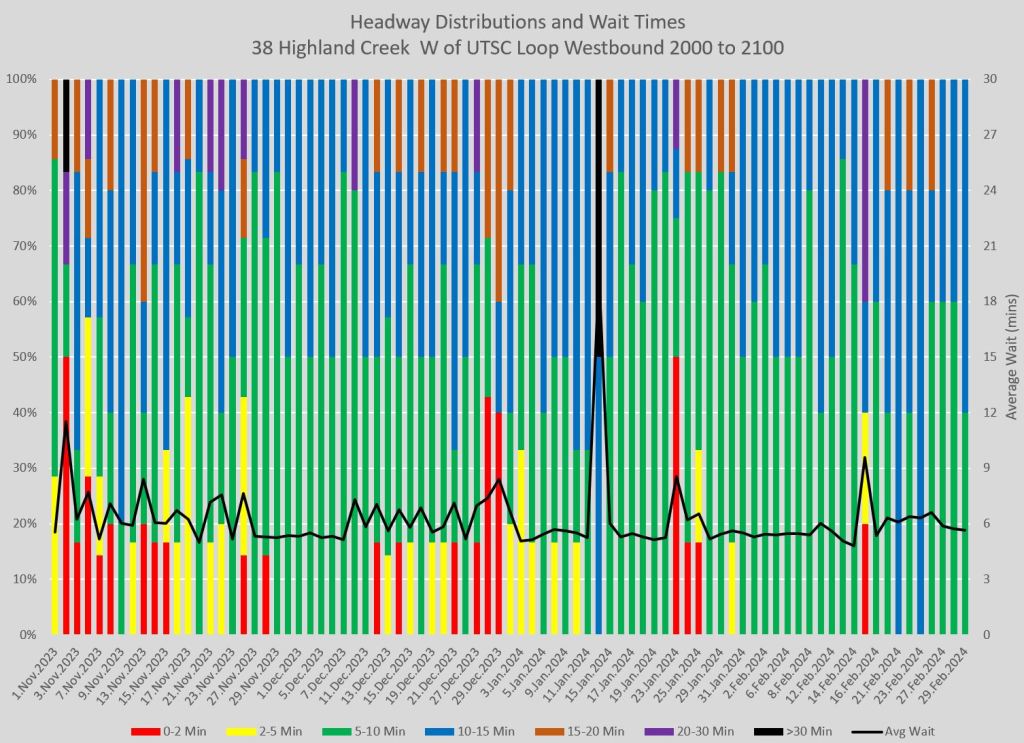
The middle chart in the second row shows the effect of the UTSC short turn service combining with the through service from Rouge Hill. Headways and wait times are erratic and bunching is common. The bunching is even worse westbound from STC.


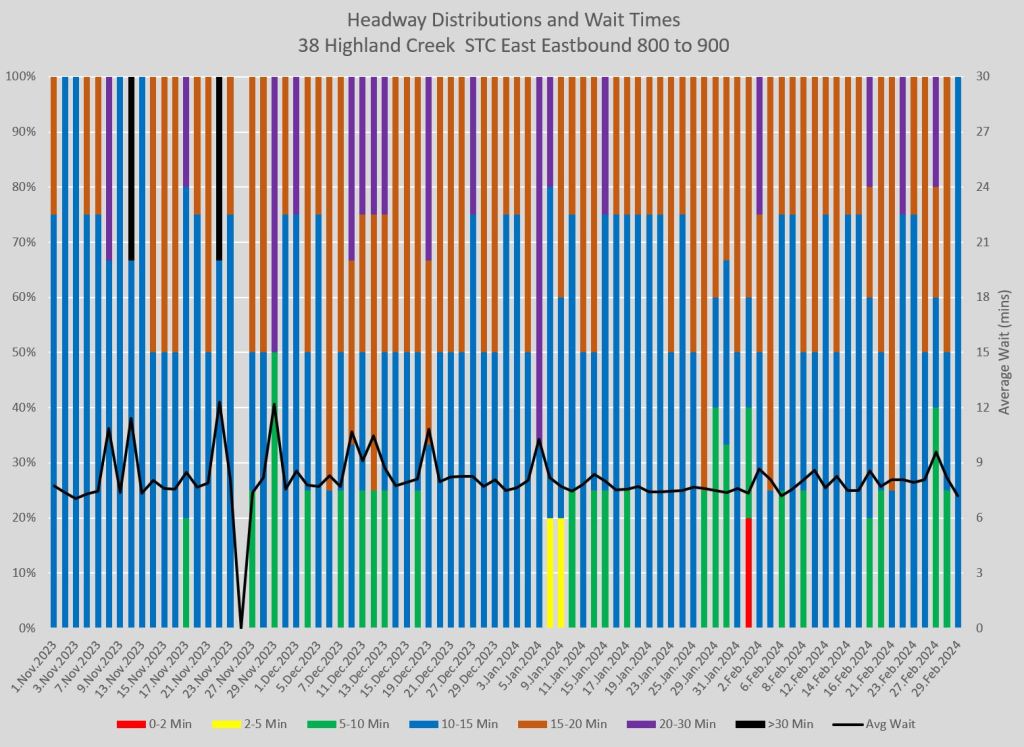
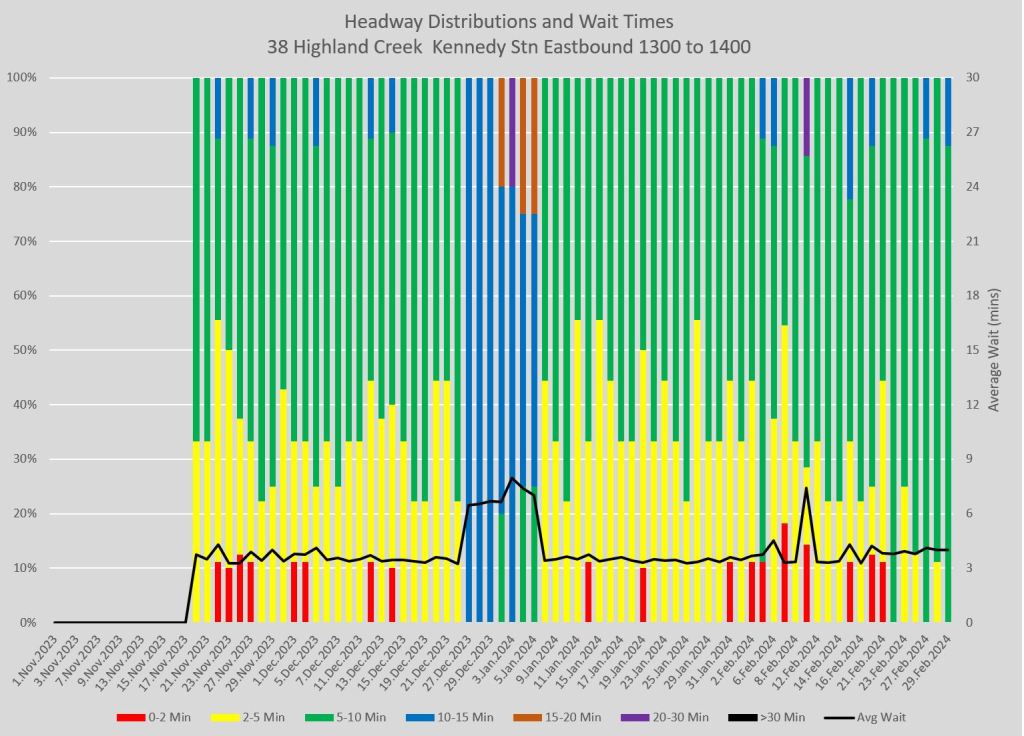
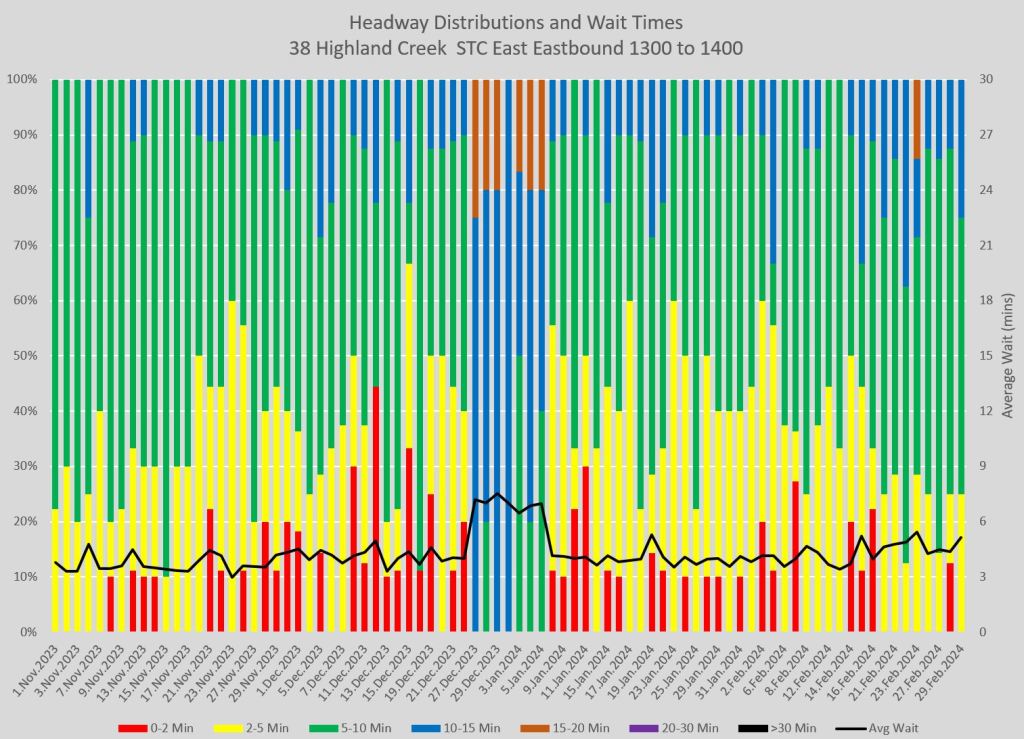
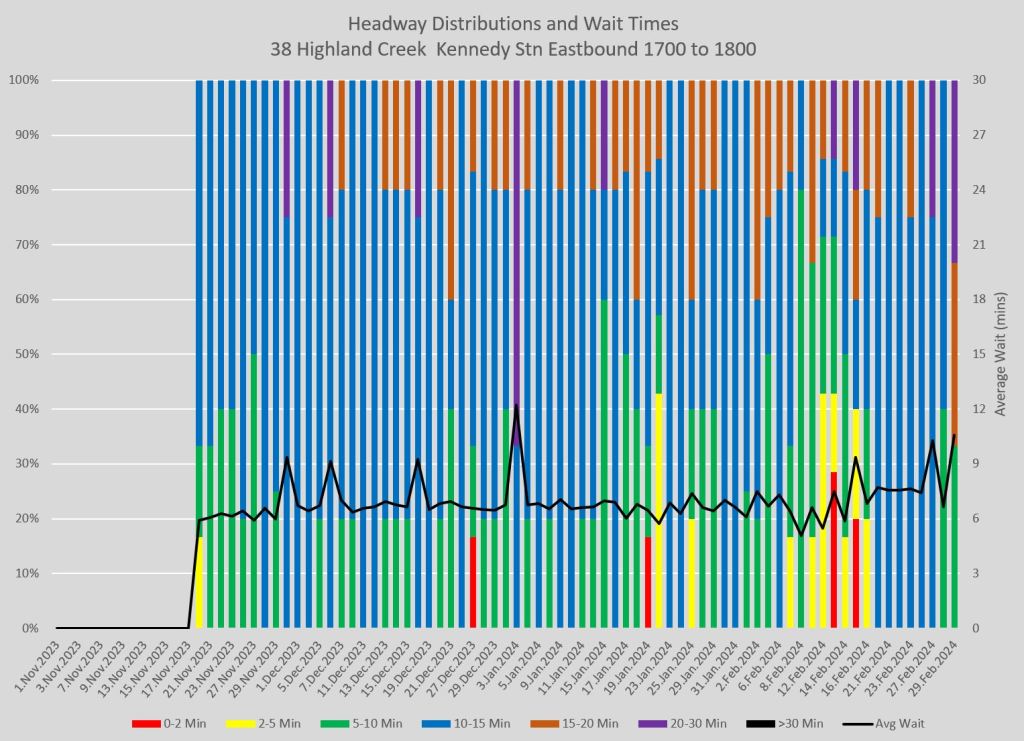
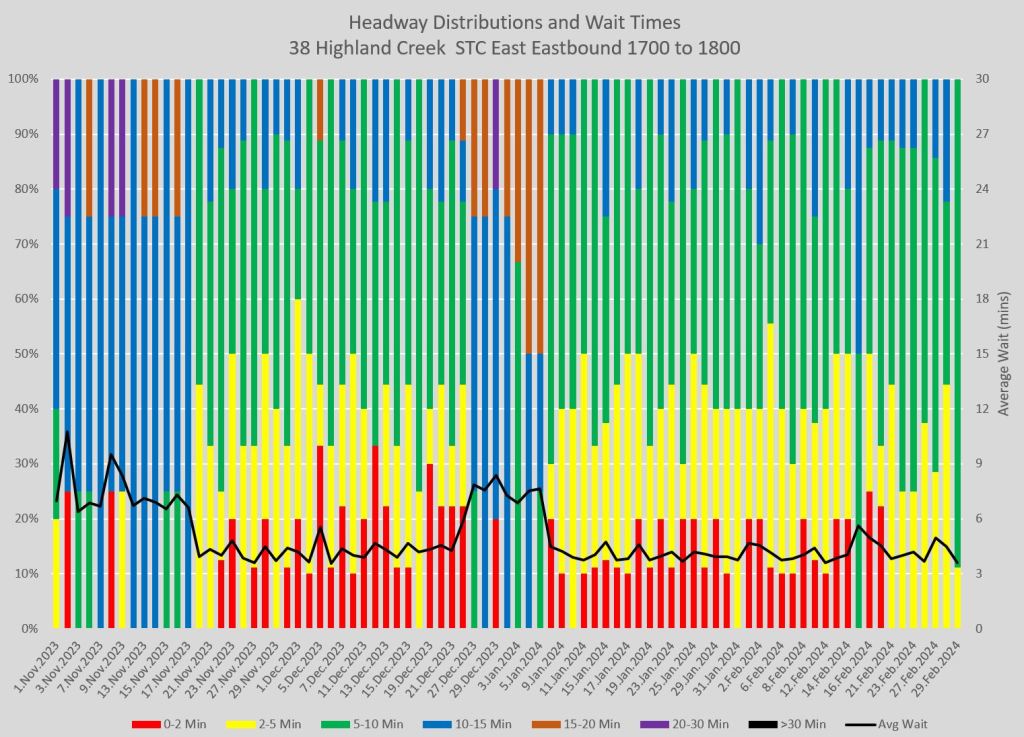
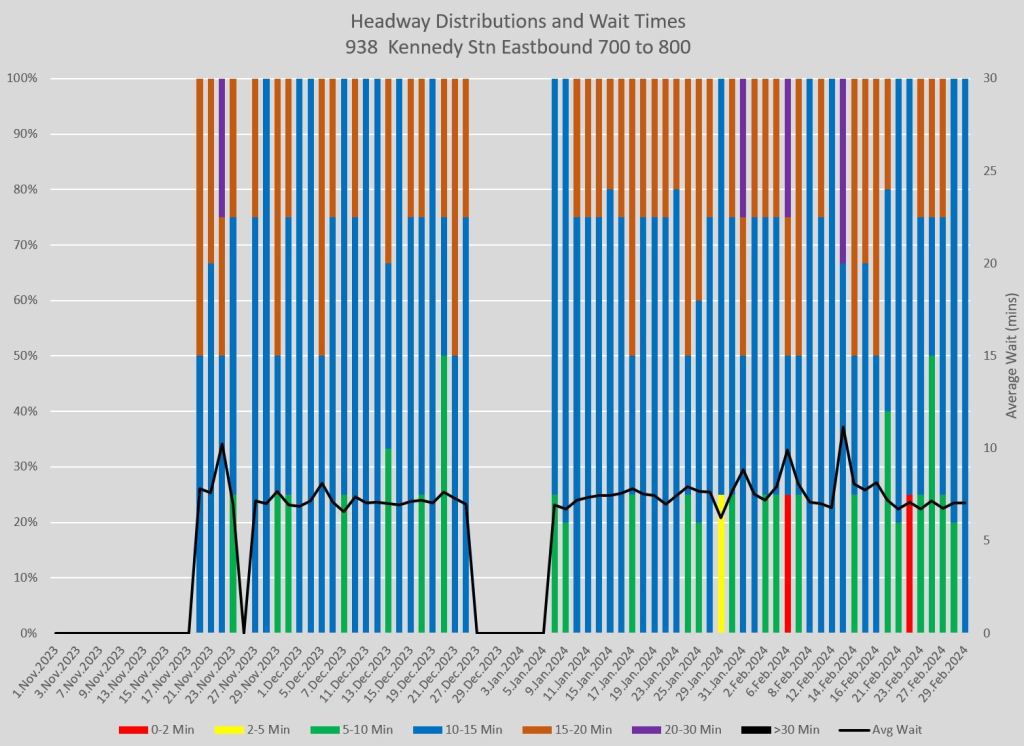
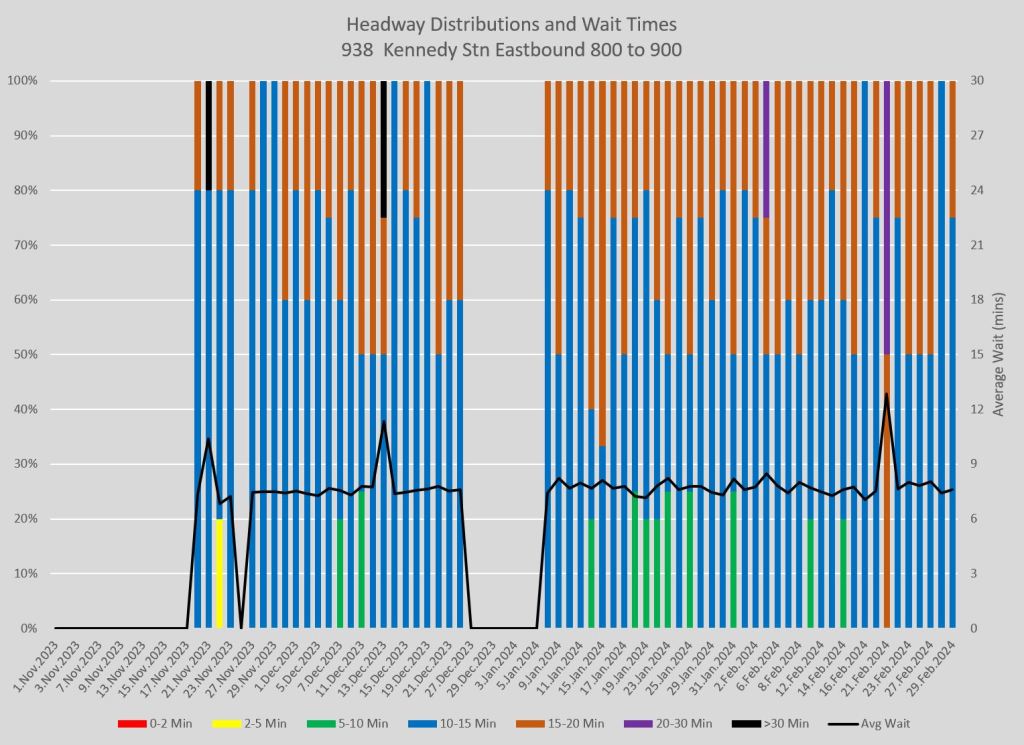
The following charts show eastbound headway distributions leaving Kennedy Station and leaving STC. Midday service shows more bunching from the terminus at Kennedy than other periods. In the PM peak, bunching eastbound from STC is much more prevalent than at Kennedy.

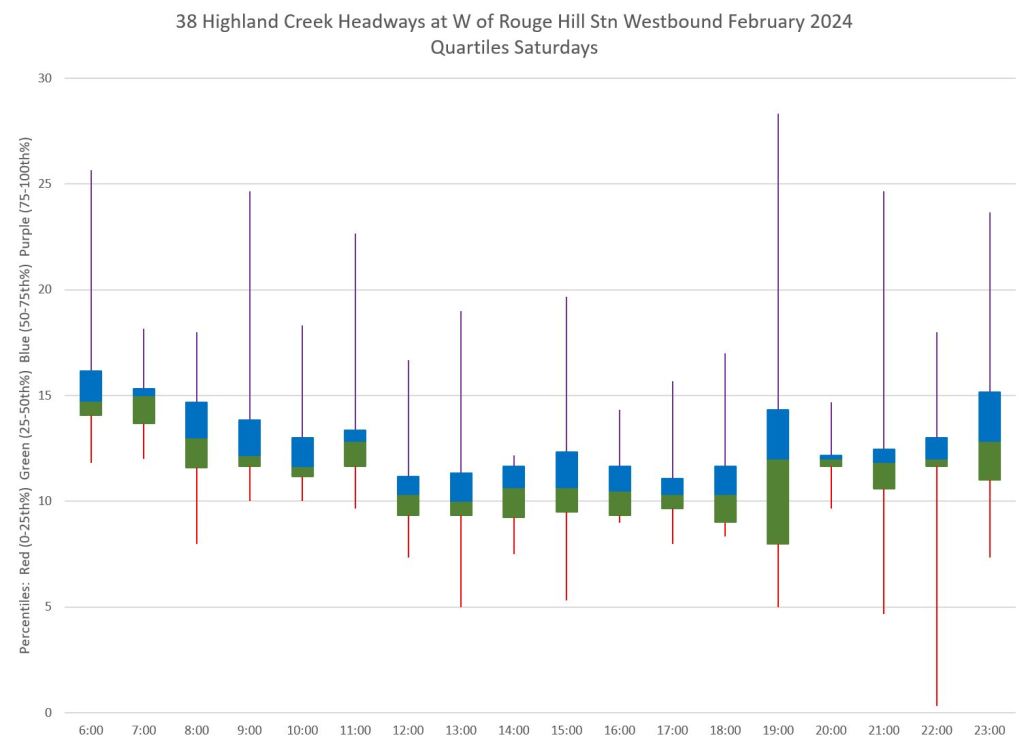
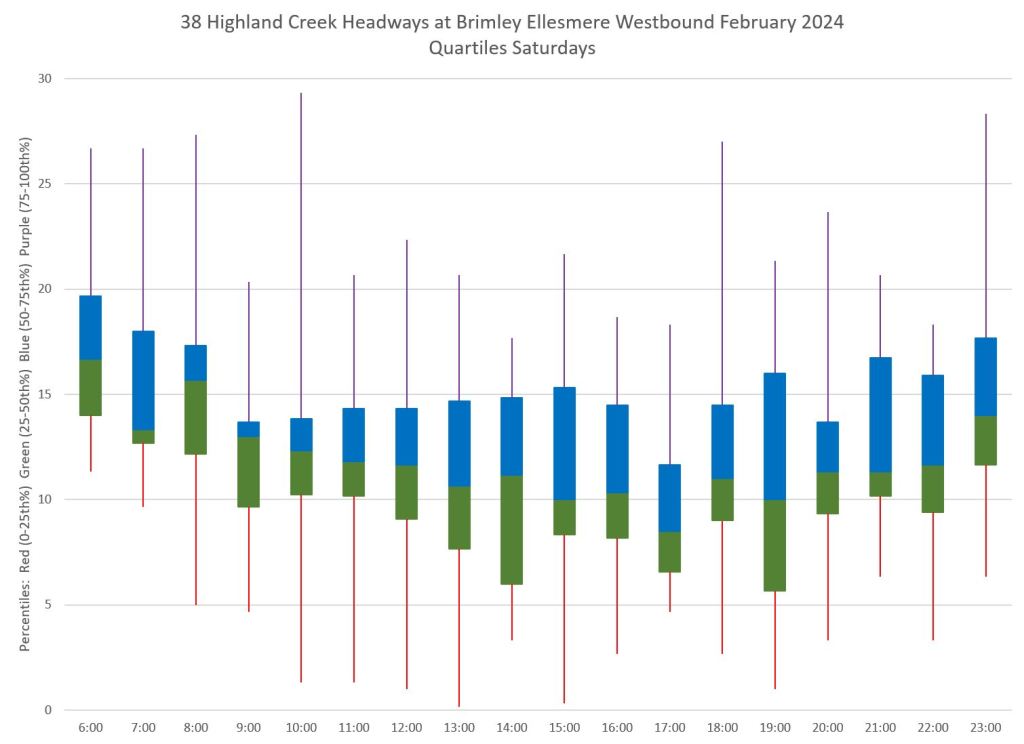
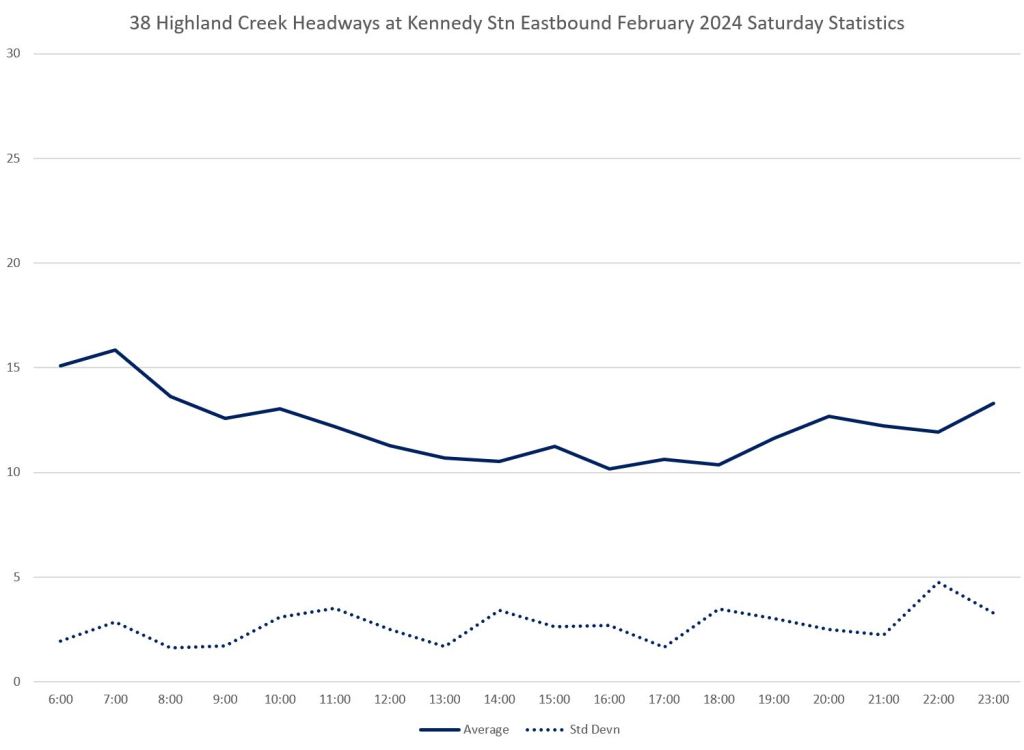
The charts below show the weekend data in three different formats:
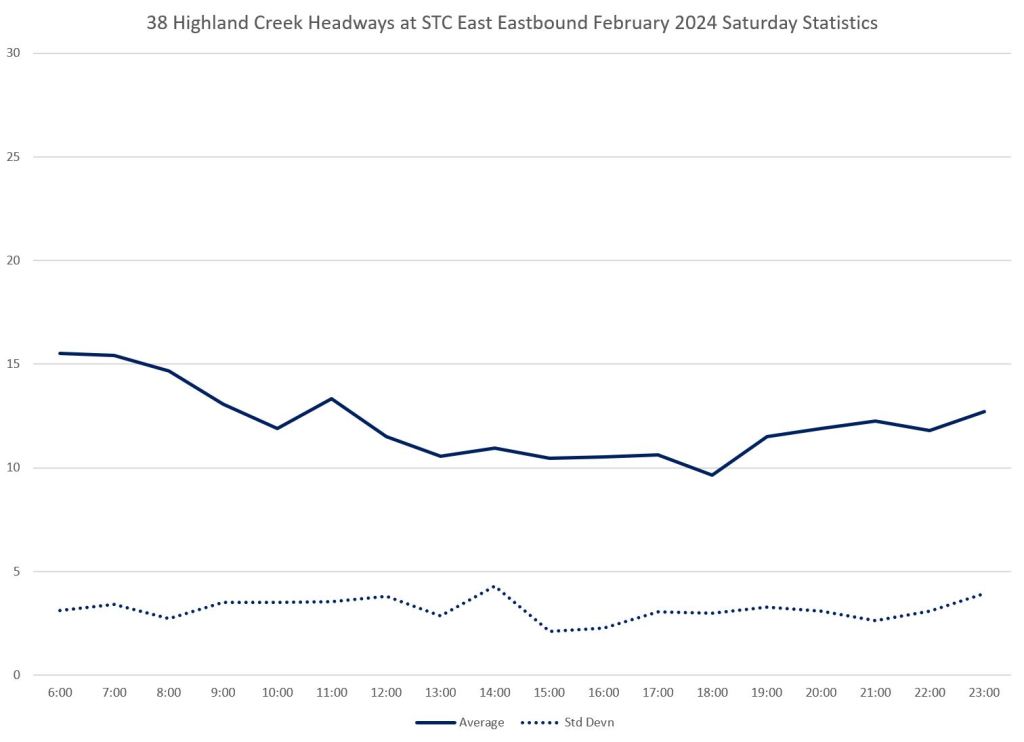
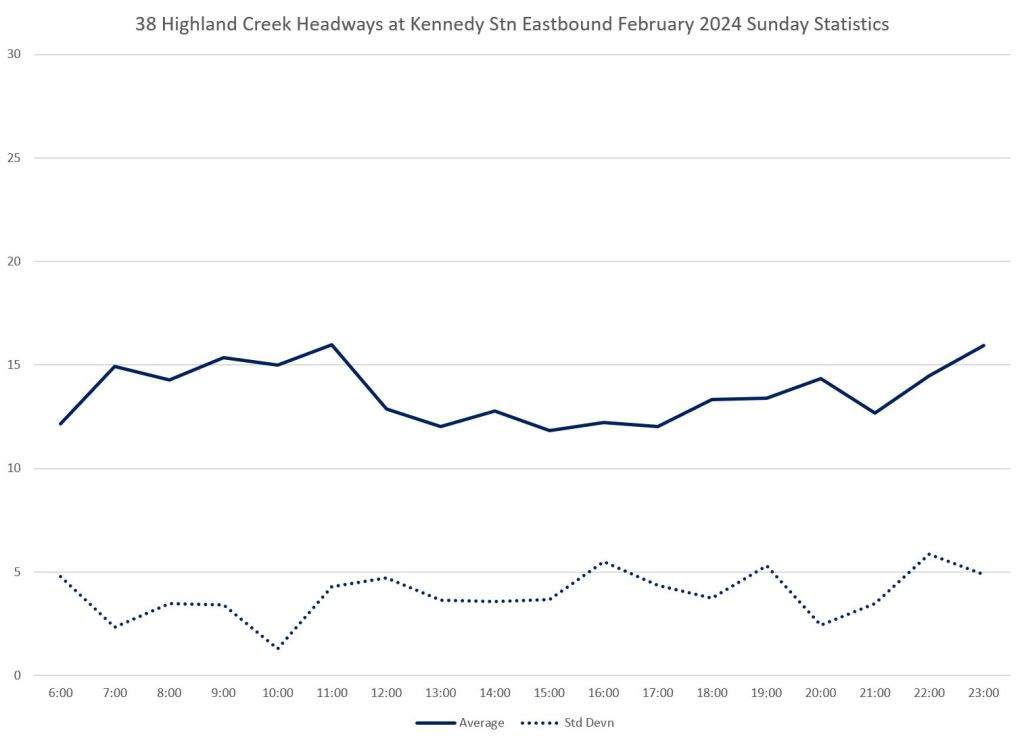
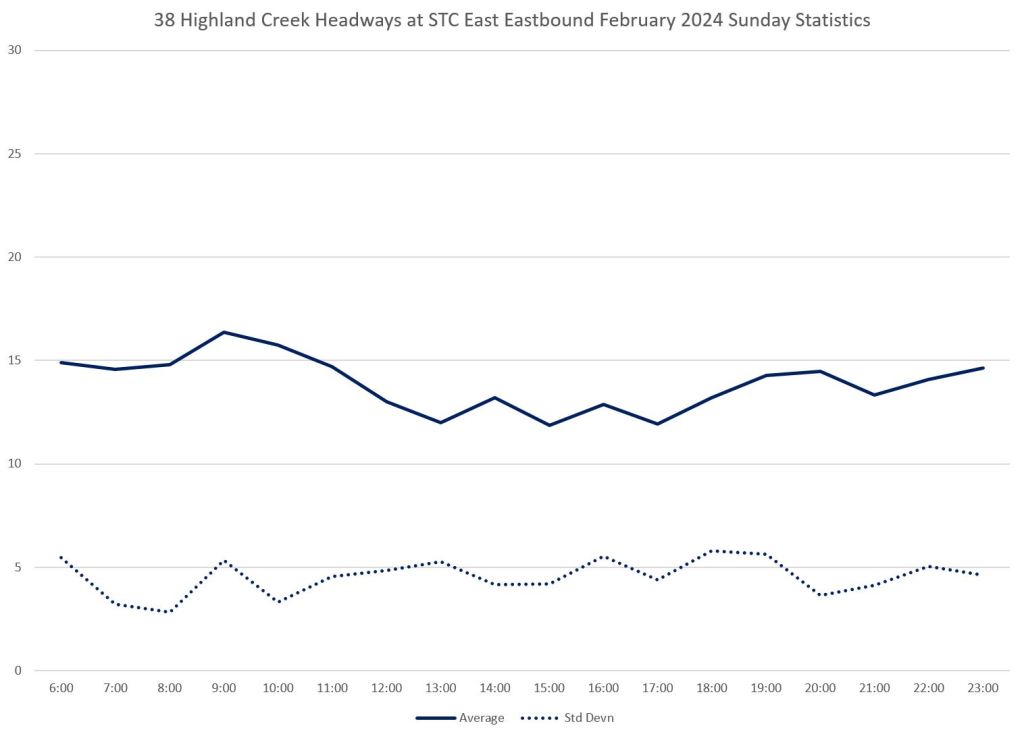
- The left column shows hourly averages and standard deviations in the data. This is the same format as in the earlier weekday charts, but with only one line because all Saturdays and all Sundays are plotted as one group on their own chart. The solid line is the average values, and the dotted line shows the standard deviations.
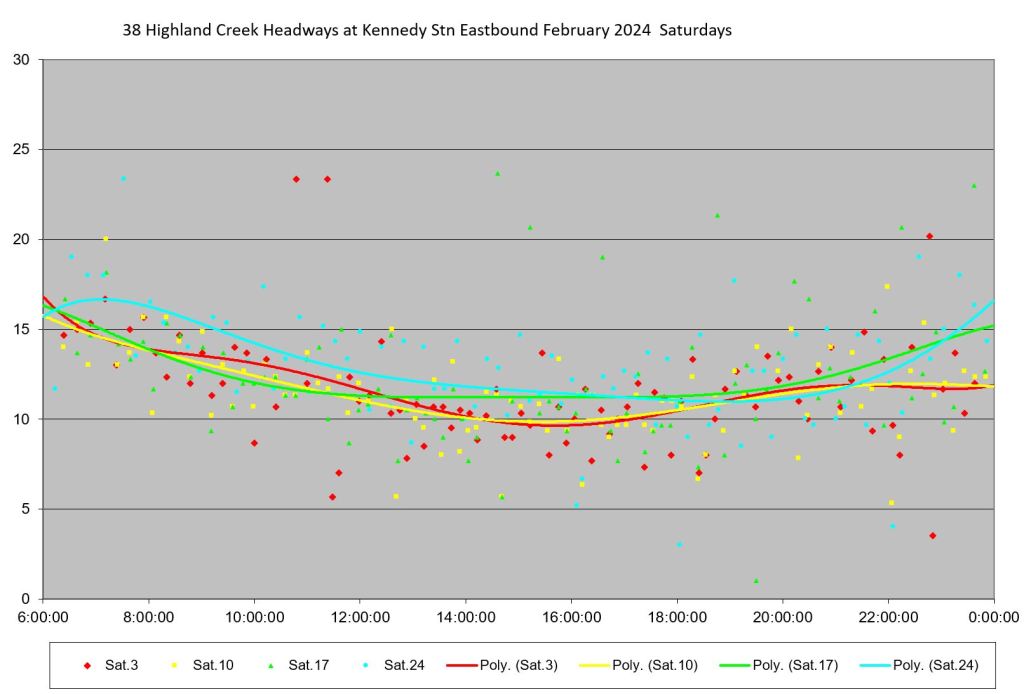
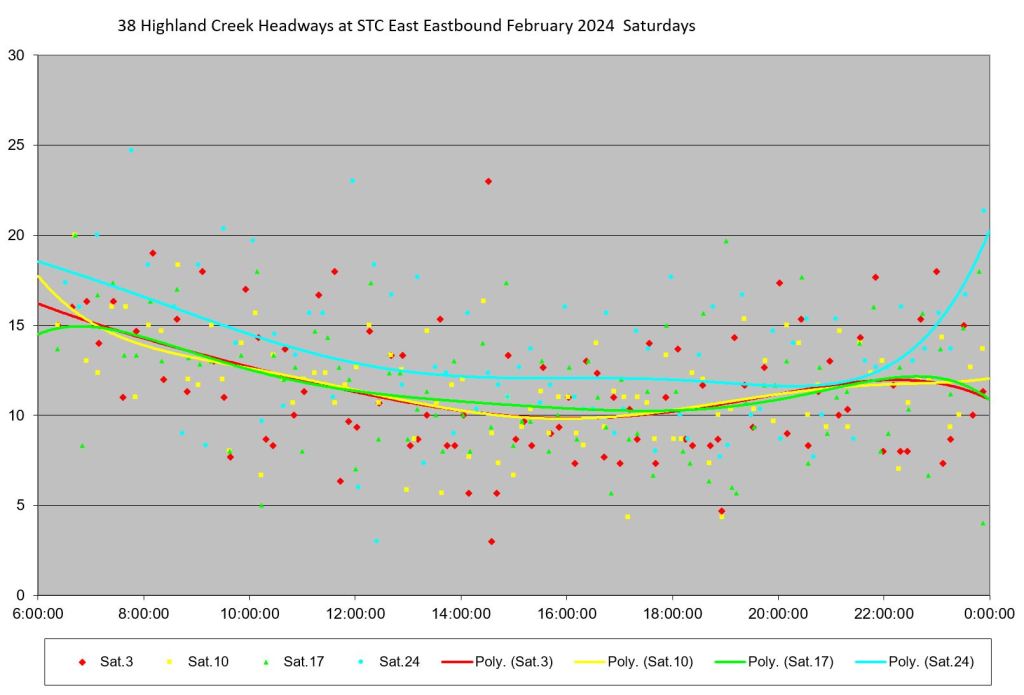
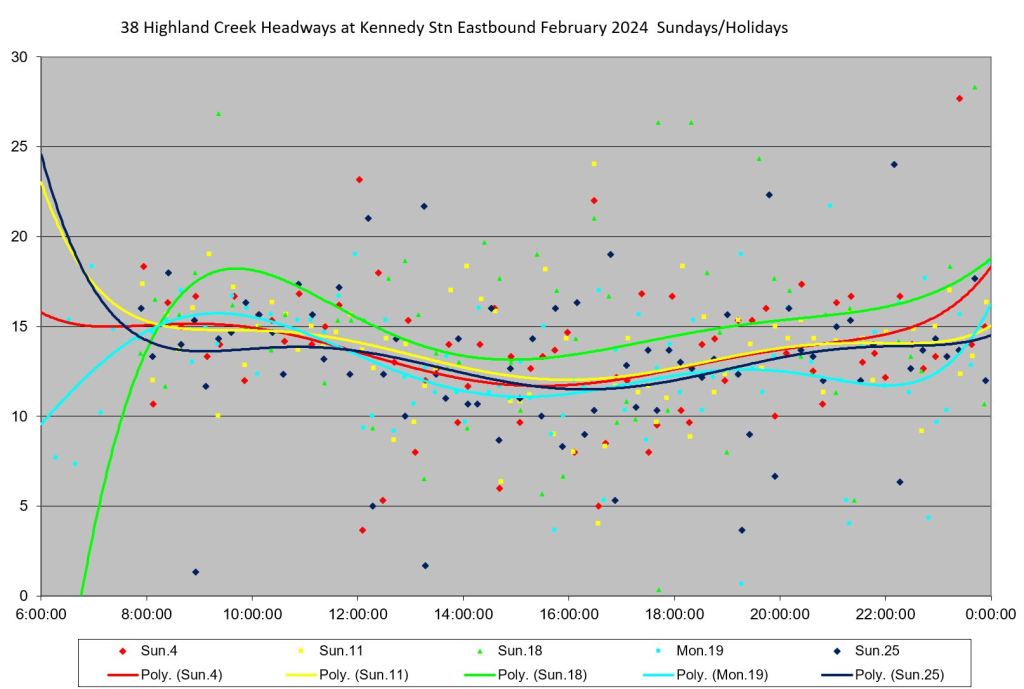
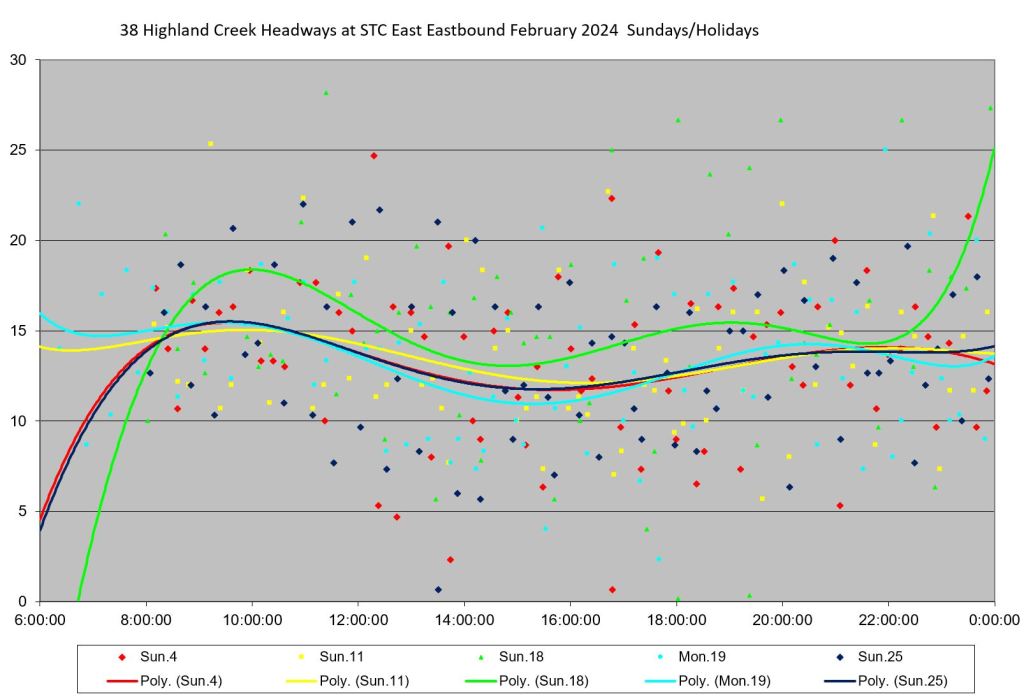
- The centre column shows the detailed data with each dot representing one bus and the lines showing a best fit curve through the data for each day. The scatter in the data values is reflected in the SD line on the left side chart.
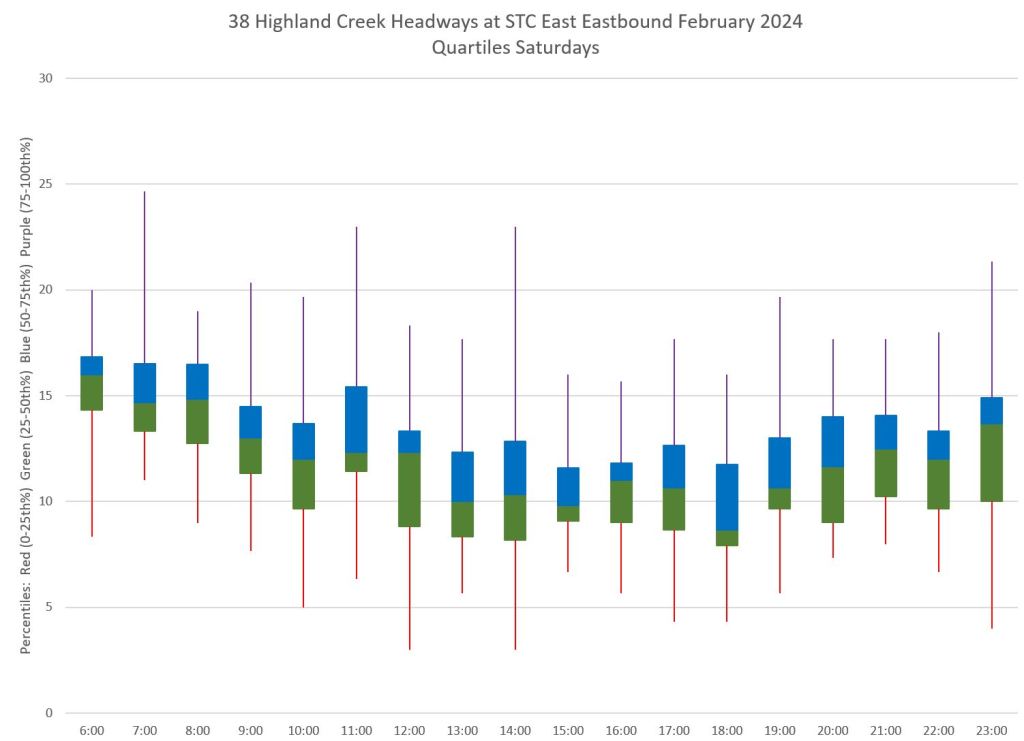
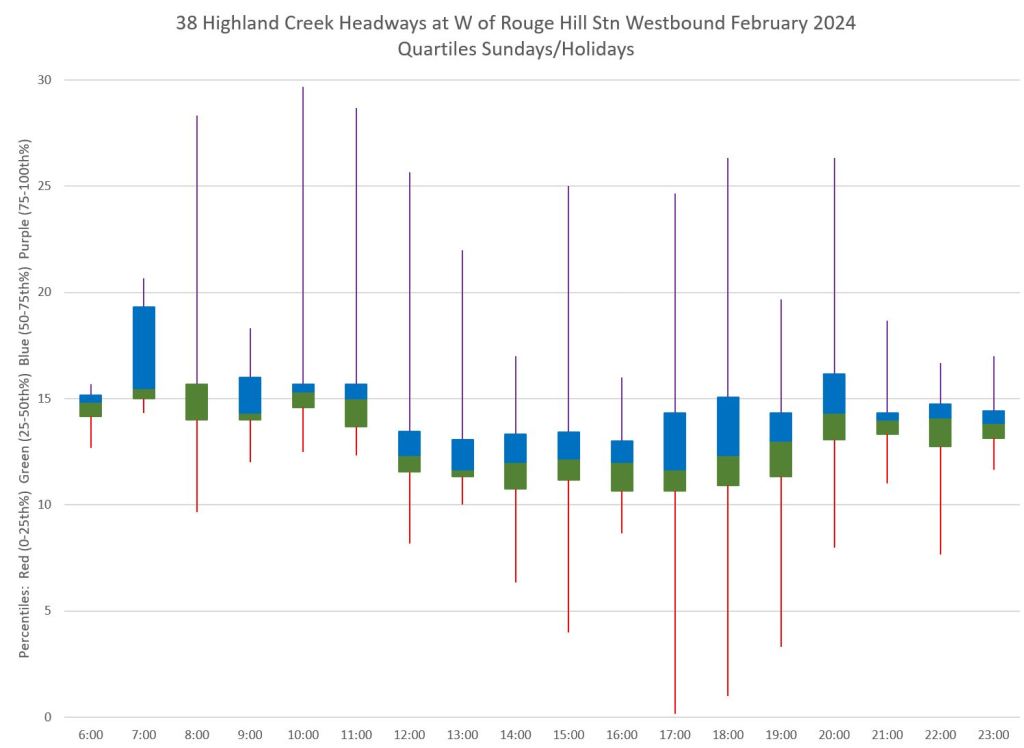
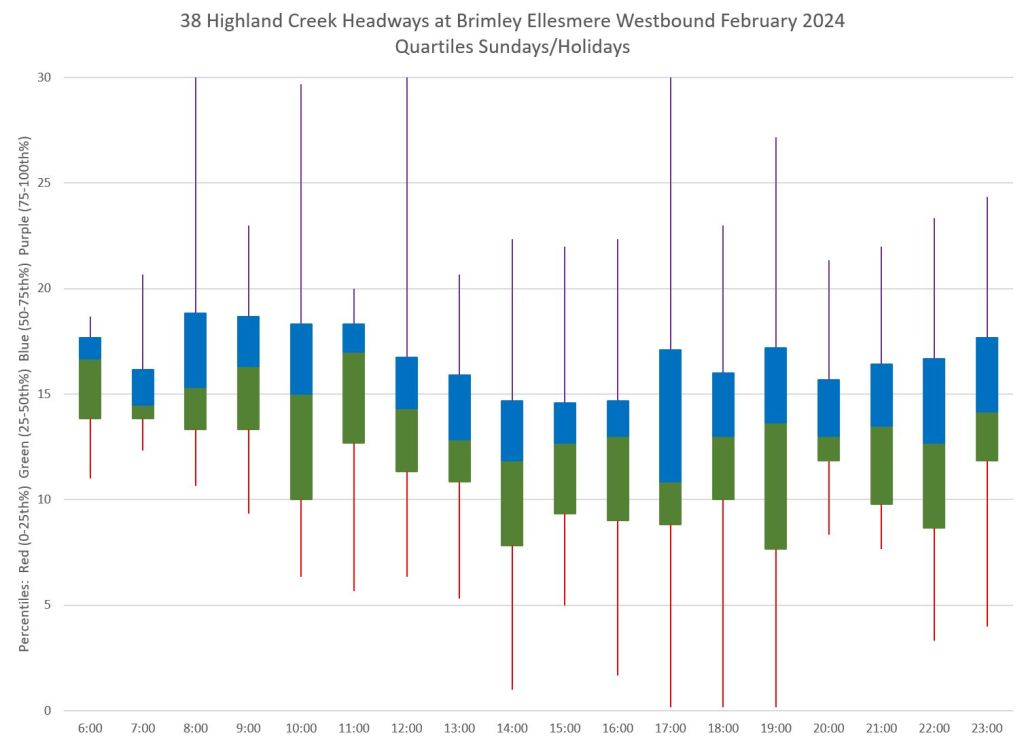
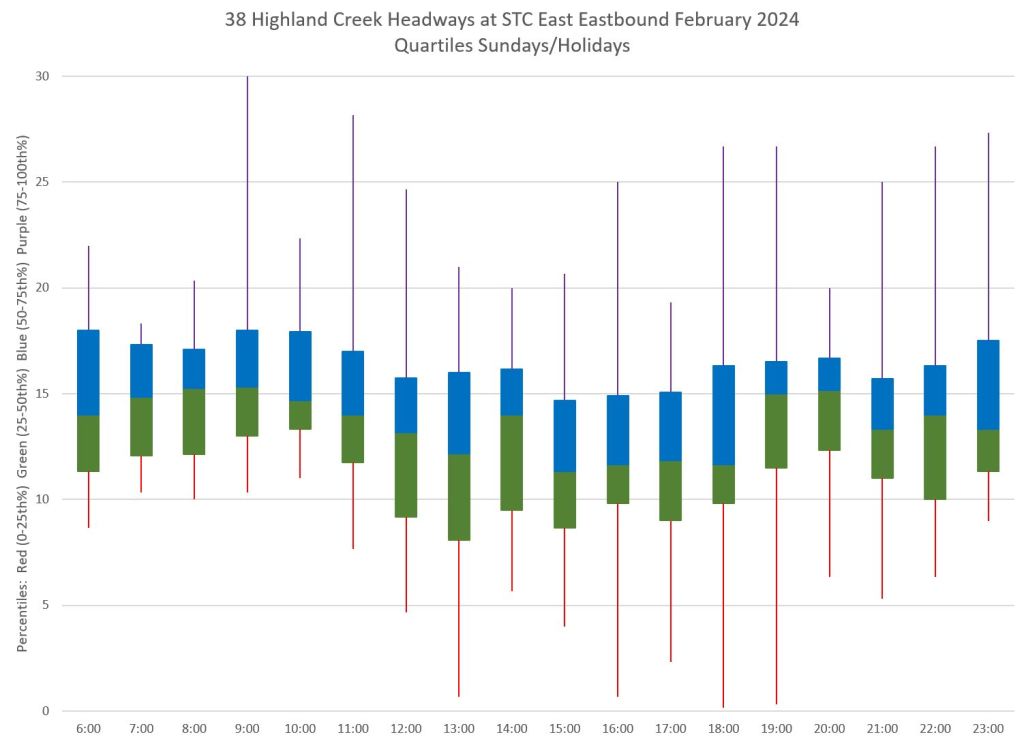
- The right column shows the data values summarized into quartiles by hour. The solid blue and green boxes hold the middle quartiles with 50% of the trips while the “tails” on either side show the range of the upper and lower 25%. Ideally both the boxes and the tails should not extend very far showing that most headways lie in a narrow band
On weekends, standard deviations in headways of five minutes are common indicating that many individual values lie in a band at least ten minutes wide, and some lie beyond that. Times leaving terminals are slightly better, but not by much. This is fairly typical weekend service for most routes, and shows how the wider scheduled headways, at 10-12 minutes, suffer from the spread in actual values from one bus to the next.
At or near a terminus, the SD should be as close to zero as possible. With SD values at or above 5 minutes and average headways in the 10-12 minute range, bunching will occur even on weekends. This is reflected in the detail and quartile charts.
Data are shown westbound at Rouge Hill and at Brimley/Ellesmere, eastbound at Kennedy Station and leaving STC. The contrast between these shows how service might leave a terminal with acceptable “on time” performance, but fails to maintain this later in the route.
Saturday Service


Sunday Service


Full Chart Sets
The PDFs linked below contain the full set of charts for the locations discussed above including detailed charts for weekdays through February 2024.
- Westbound at Rouge Hill Stn
- Westbound from UTSC Loop
- Westbound at Brimley & Ellesmere
- Eastbound from Kennedy Stn
- Eastbound from STC
938 Highland Creek Express
The 938 Highland Creek Express operates eastbound from Kennedy Station to UTSC via STC only in the AM peak period. It operates westbound only in the PM peak period.
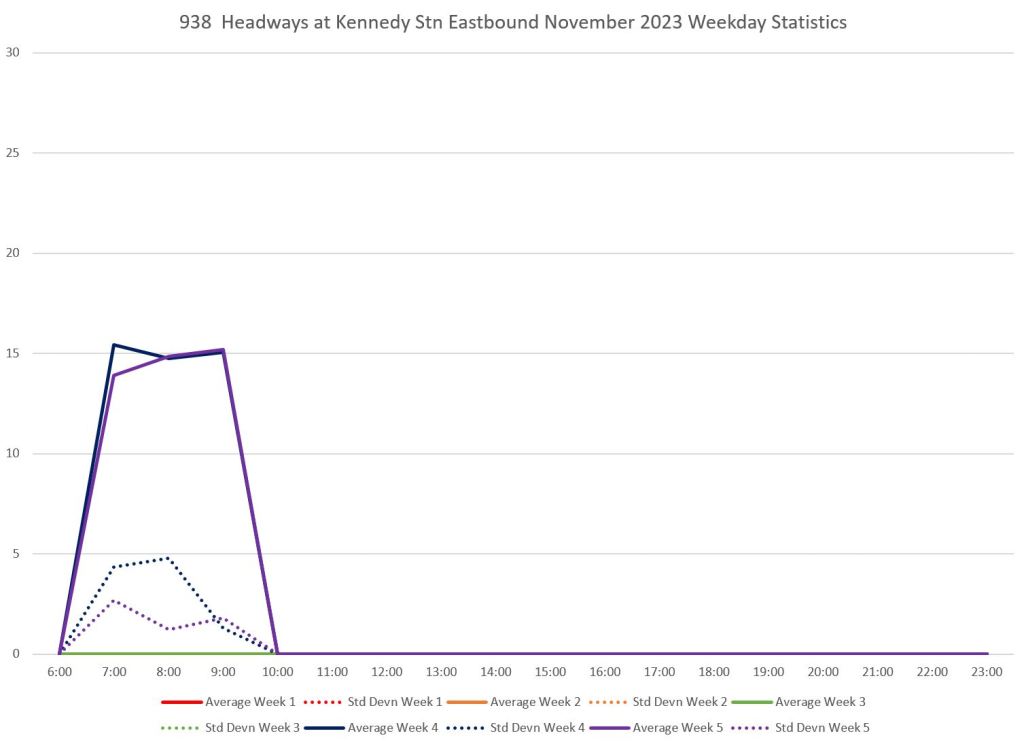

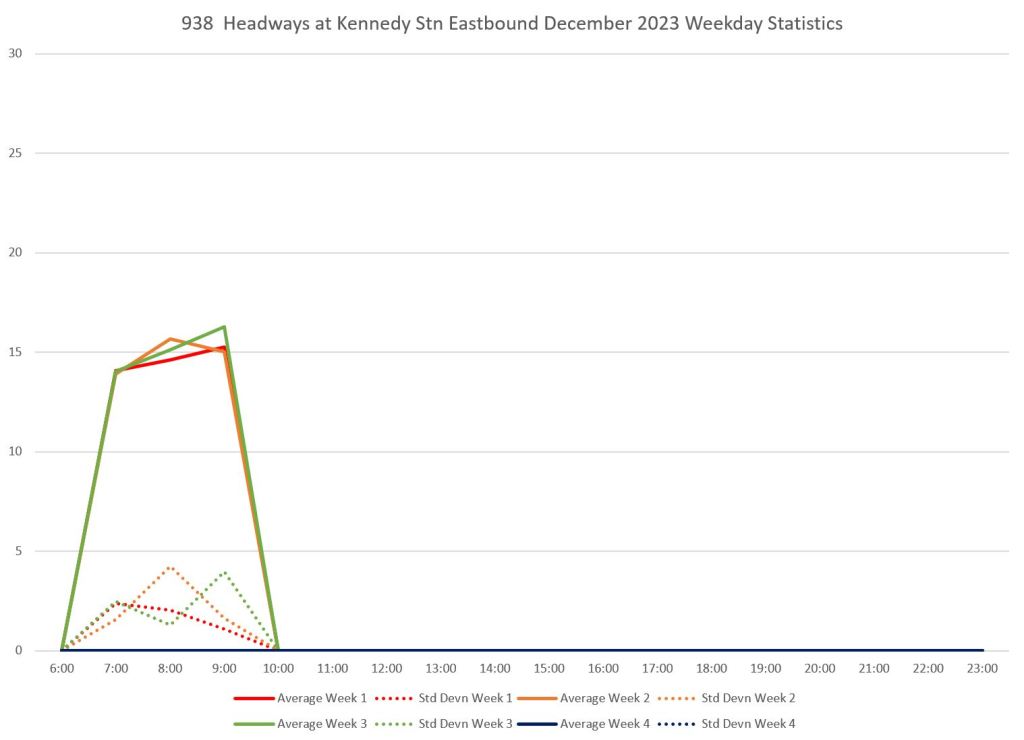


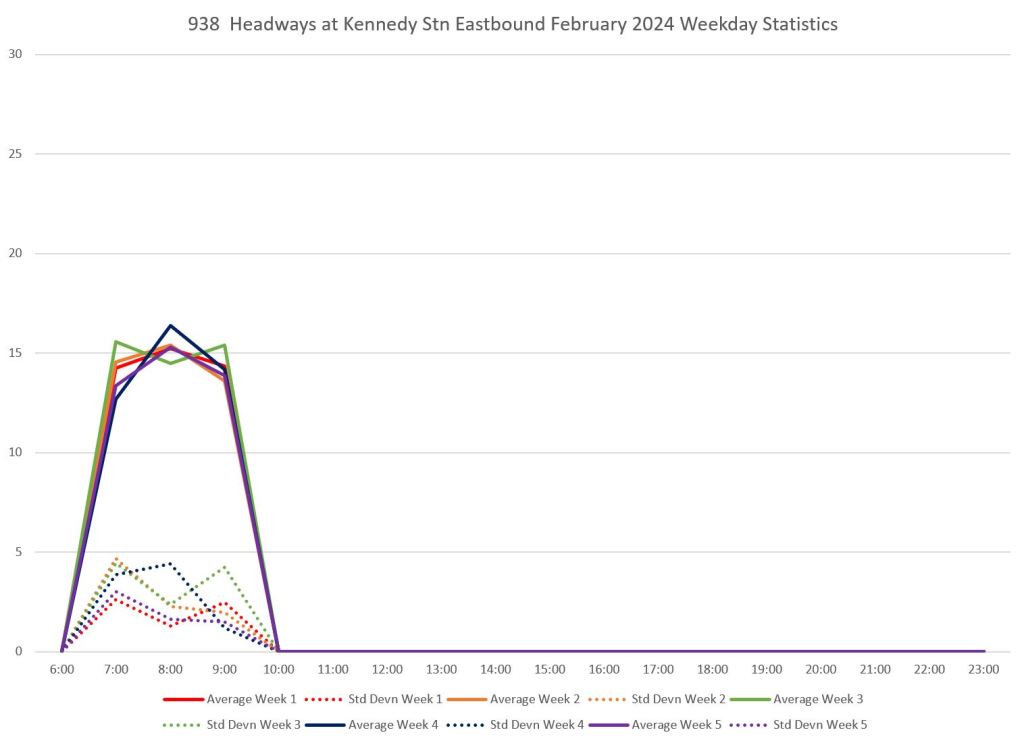

The charts above show that the headways bounce around a bit with SD values ranging up to, and occasionally above, five minutes. Here is the service plotted by headway distribution for the two peak hours.


Full Chart Sets
The PDFs linked here show the details of weekday service in February 2024.
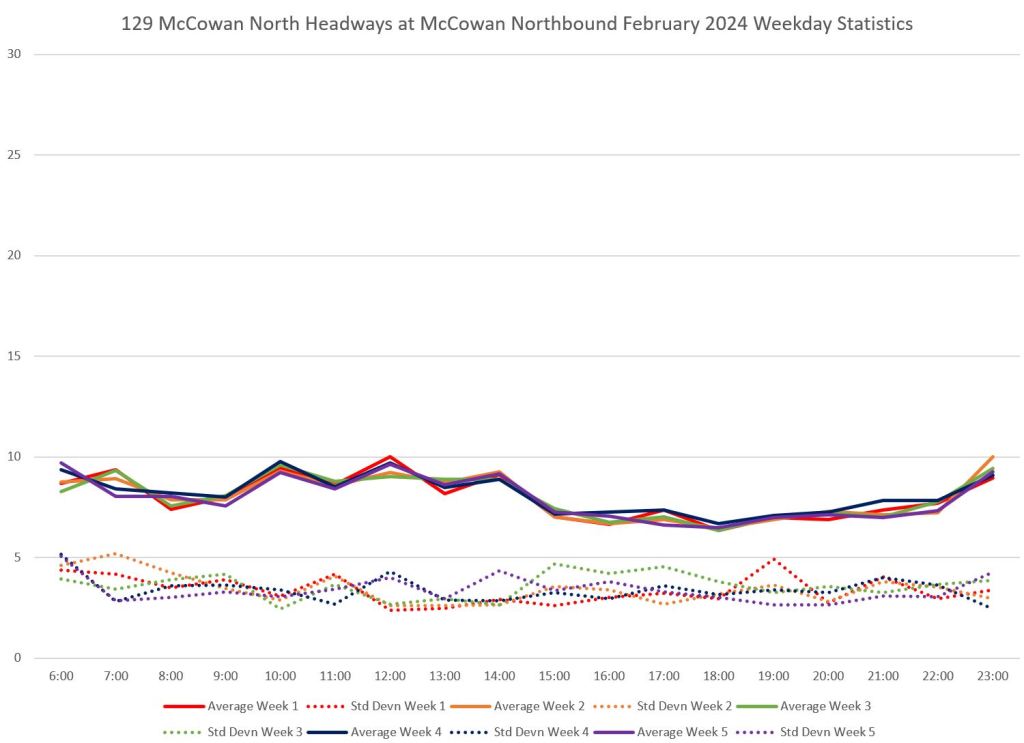
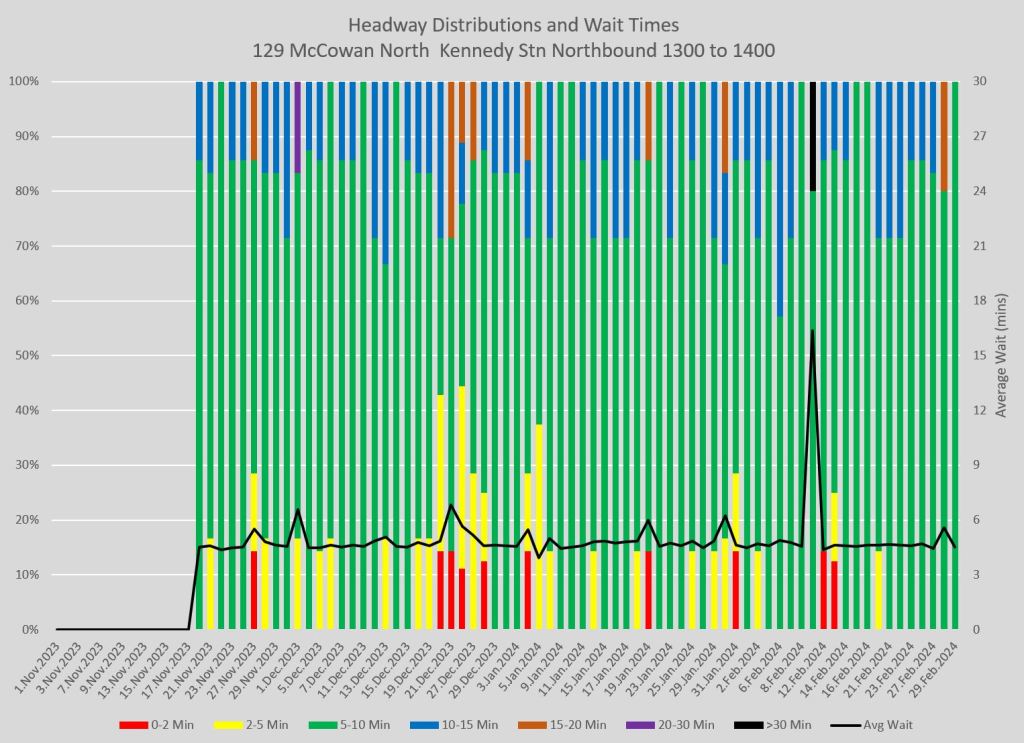
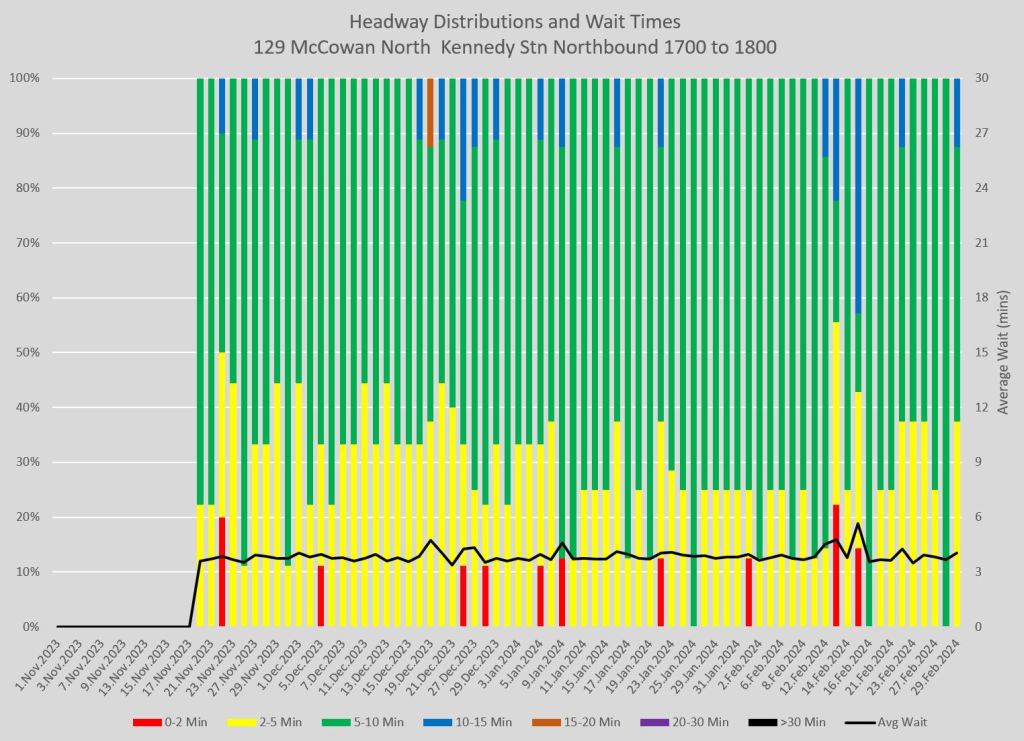
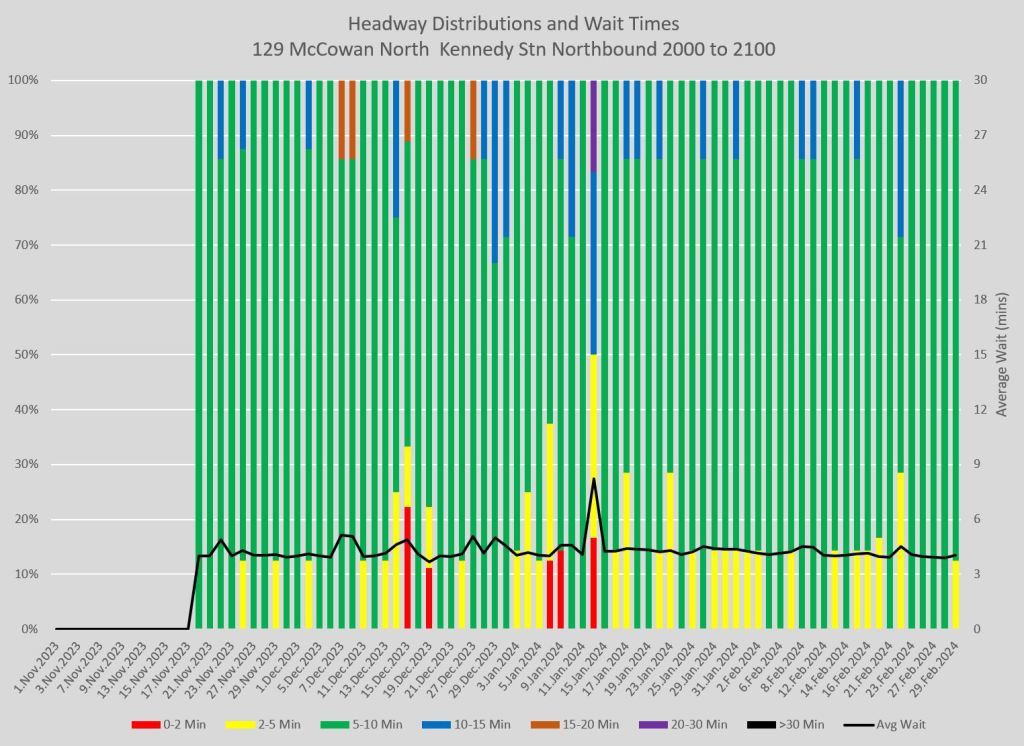
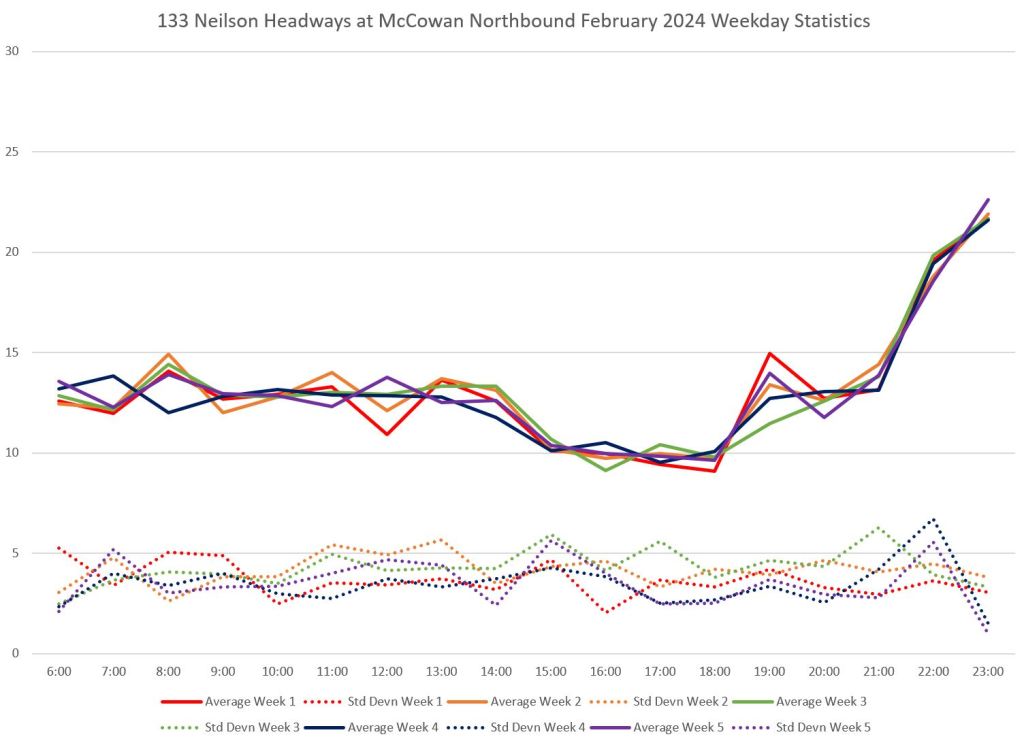
129 McCowan North
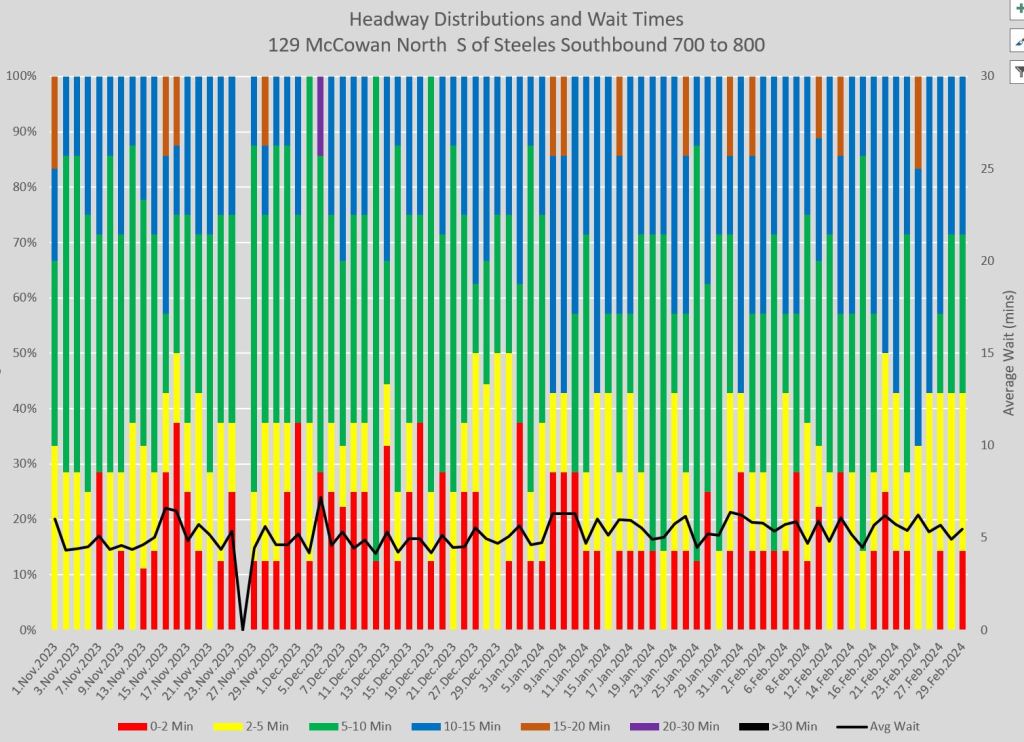
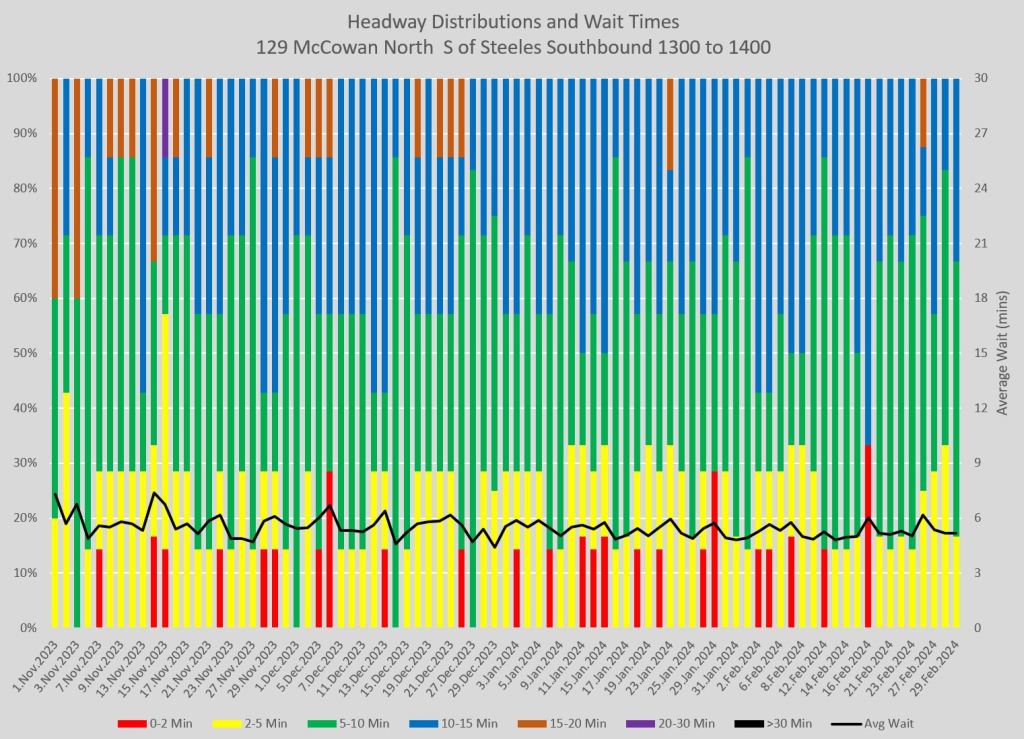
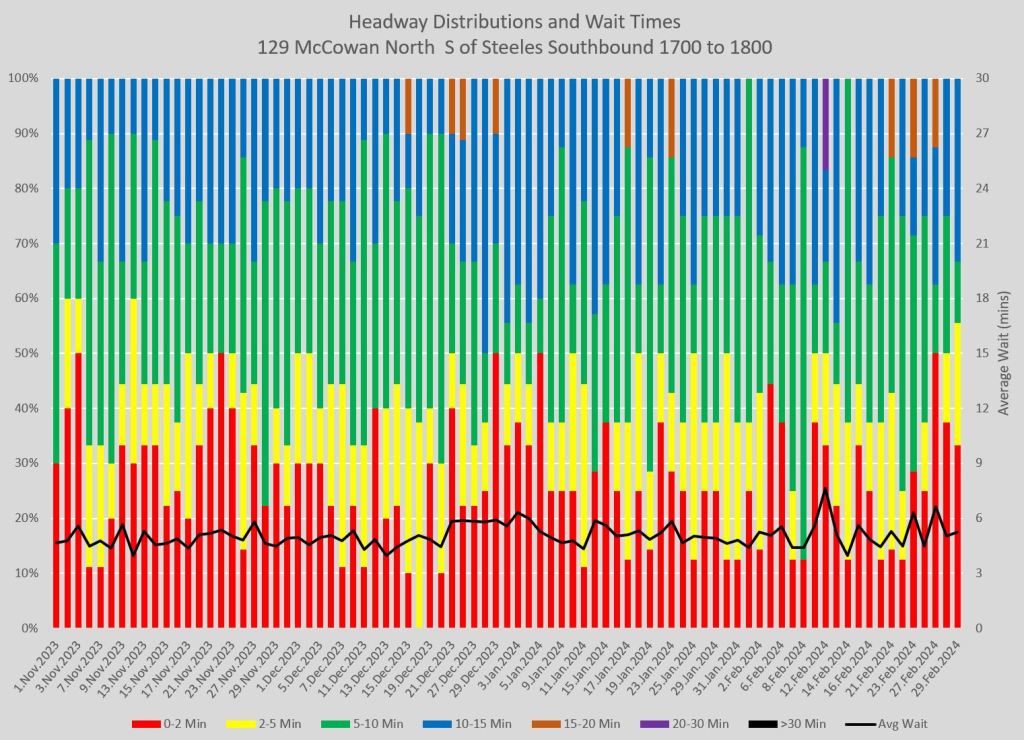
For this route and others following, I have included only the weekday headway distribution charts.
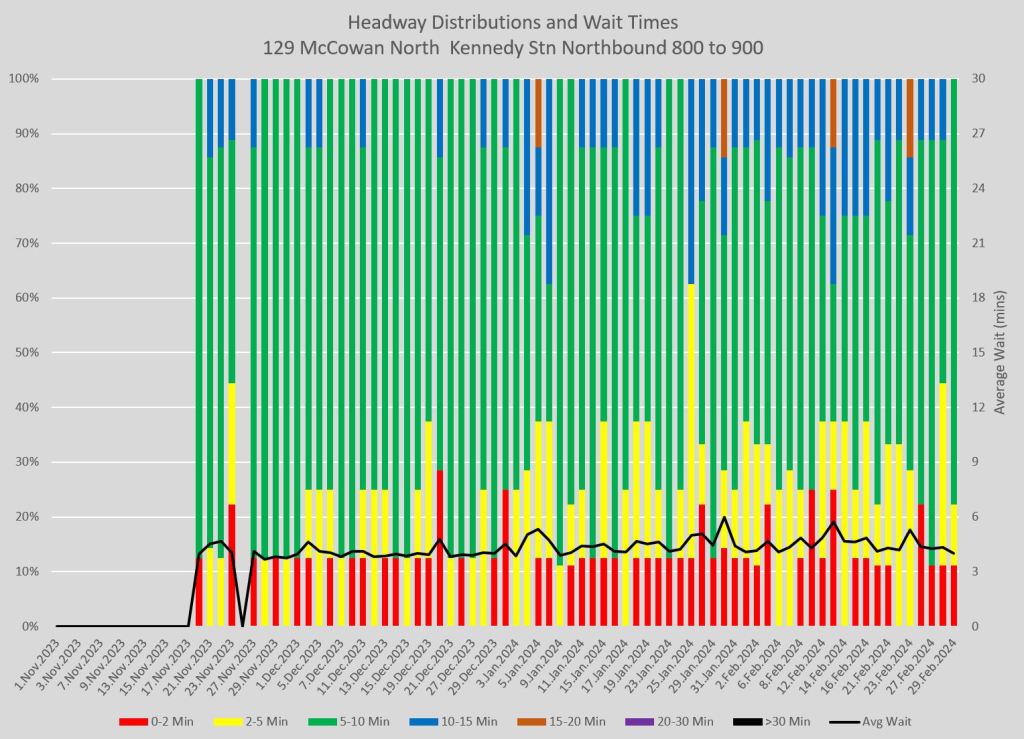
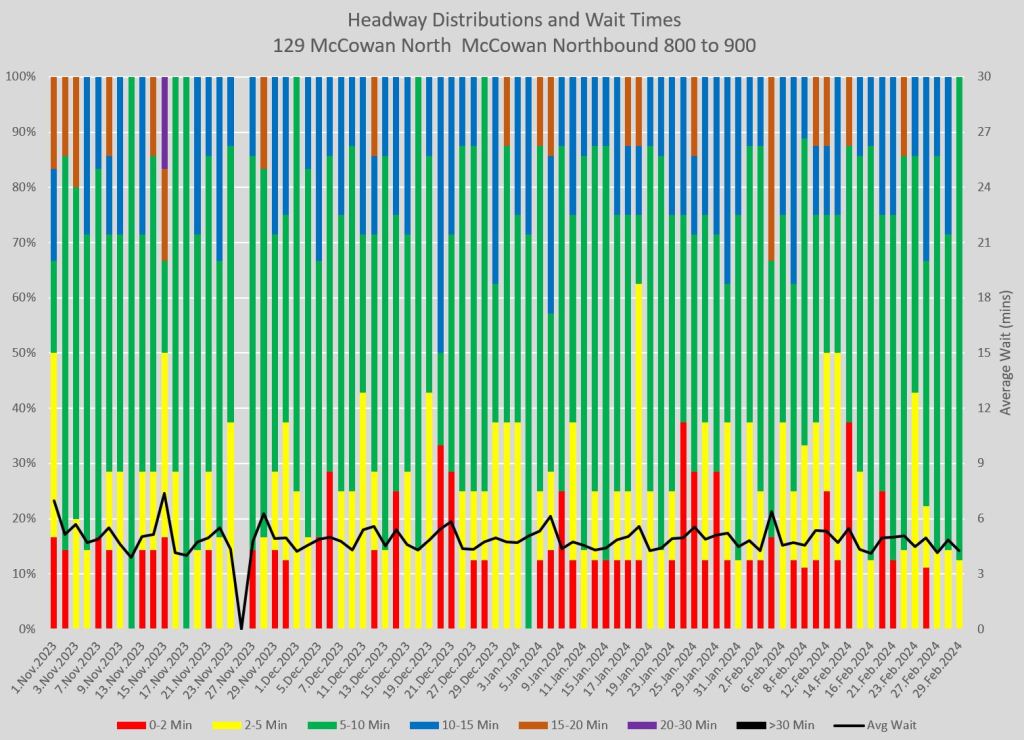
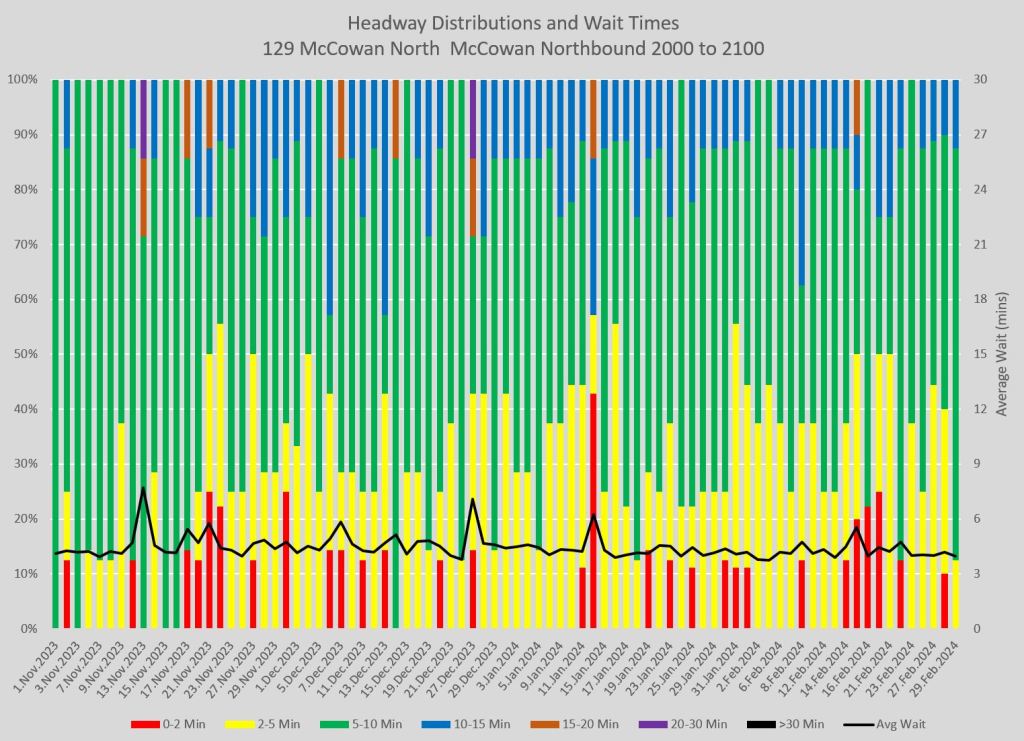
The 129 McCowan North bus operates from Kennedy Station to Steeles via STC. Some trips extend north to Major Mackenzie as a contract service to York Region.
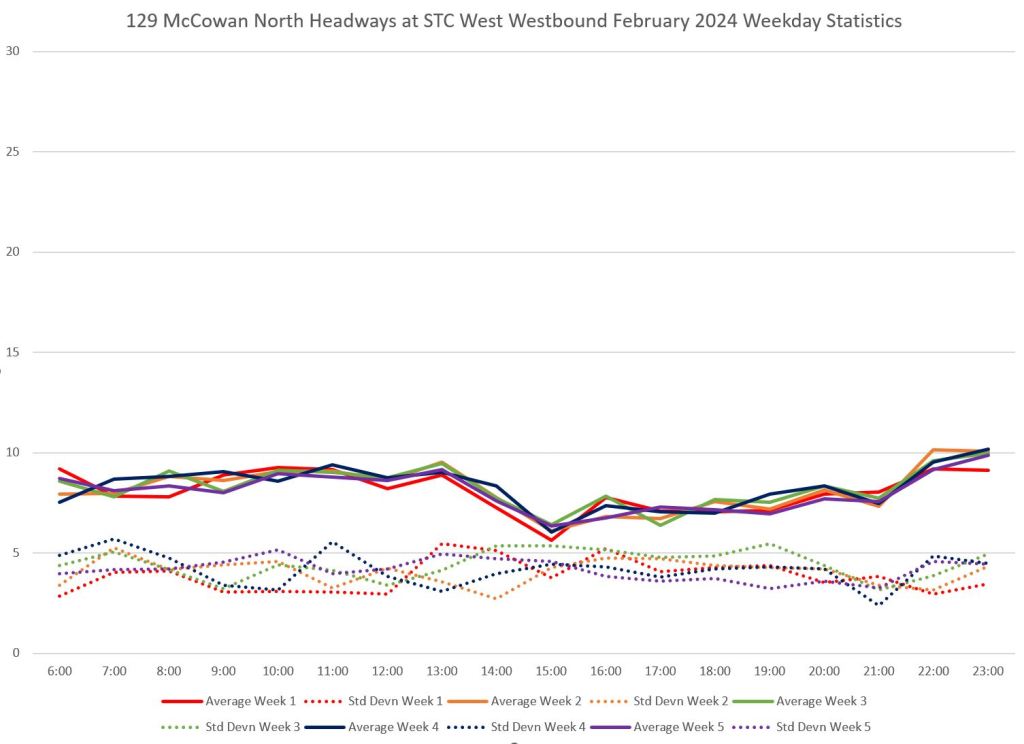
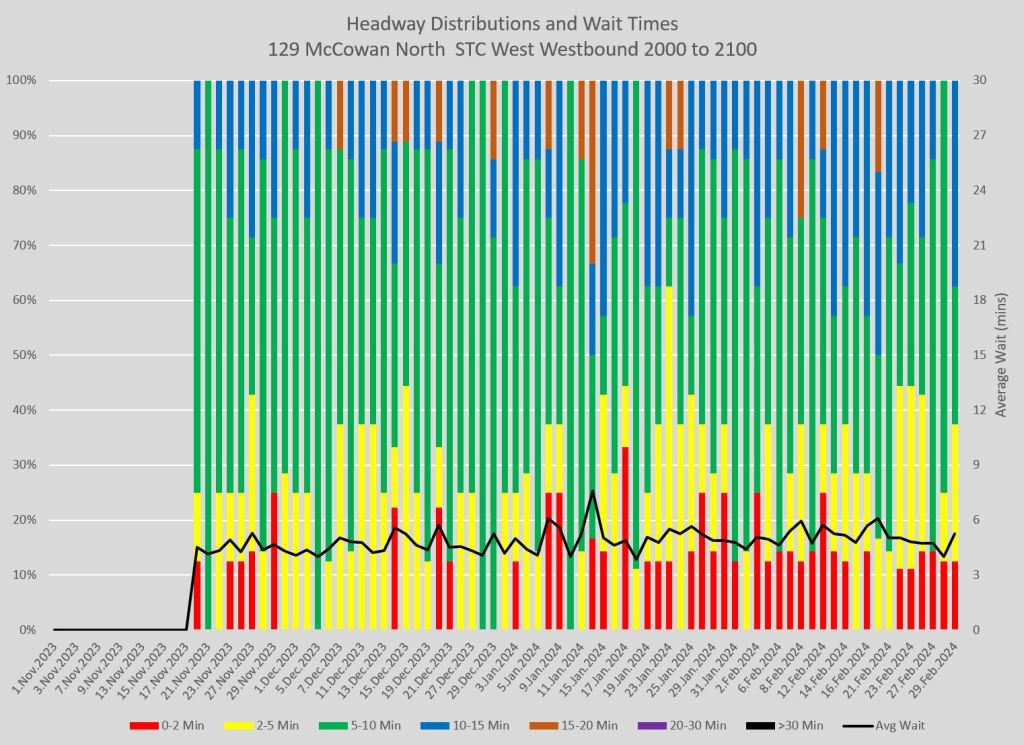
Service leaving Kennedy Station commonly has short headways indicating bunching, and this is worse by the time service leaves STC and turns north on McCowan particularly in the PM peak and early evening.

Northbound


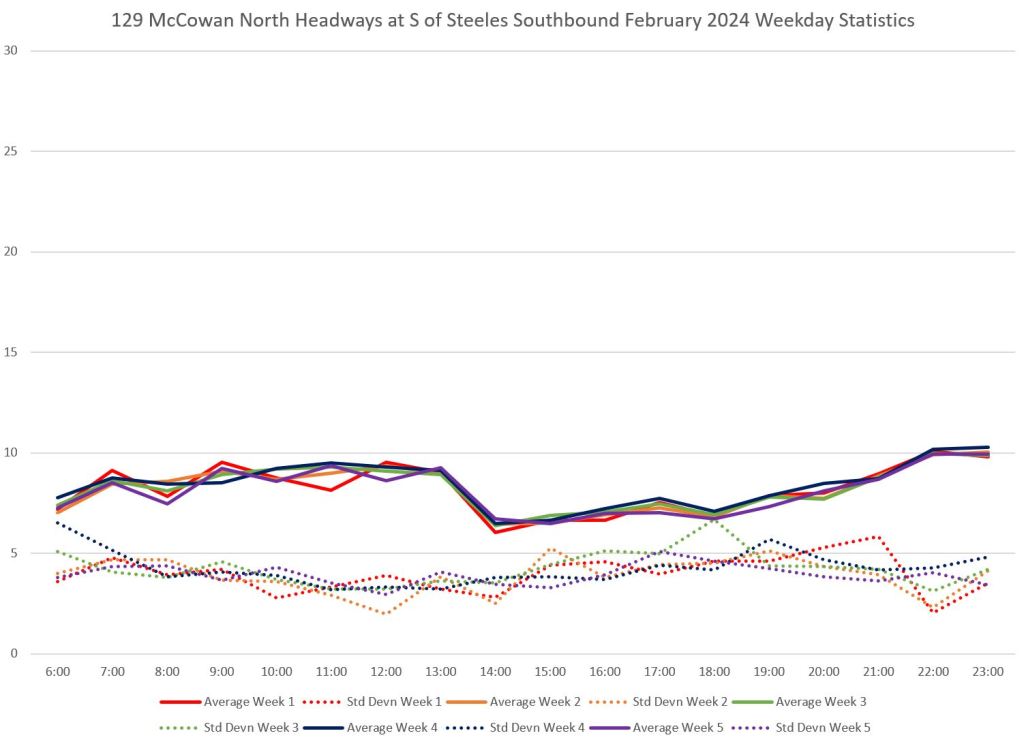
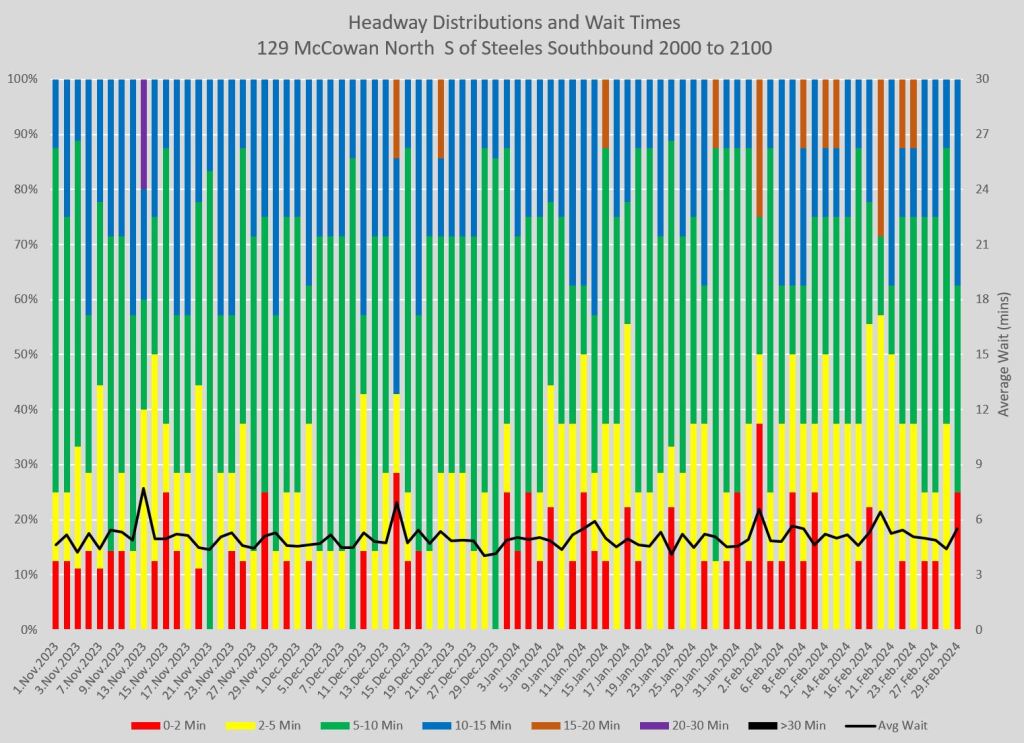
Southbound
Southbound service from Steeles is erratic particularly in the peak periods. Note that the weighted wait times are higher than half of the scheduled headway (AM peak 8′, PM peak 7′) showing the effect of uneven service on the rider experience. This will also affect vehicle crowding with buses running in gaps carrying a higher load than the service design provides for.


Full Chart Sets
The PDFs linked here show the details of weekday service in February 2024.
- Northbound from Kennedy Station
- Northbound leaving STC at McCowan
- Southbound on McCowan south of Steeles
- Southbound leaving STC
Service North of Steeles
Although this is not part of the SRT corridor service, I am including this for those who are interested. Service leaving Major Mackenzie southbound can be somewhat erratic depending on the time of day and day of the week. With infrequent scheduled service, being “on time” is key.
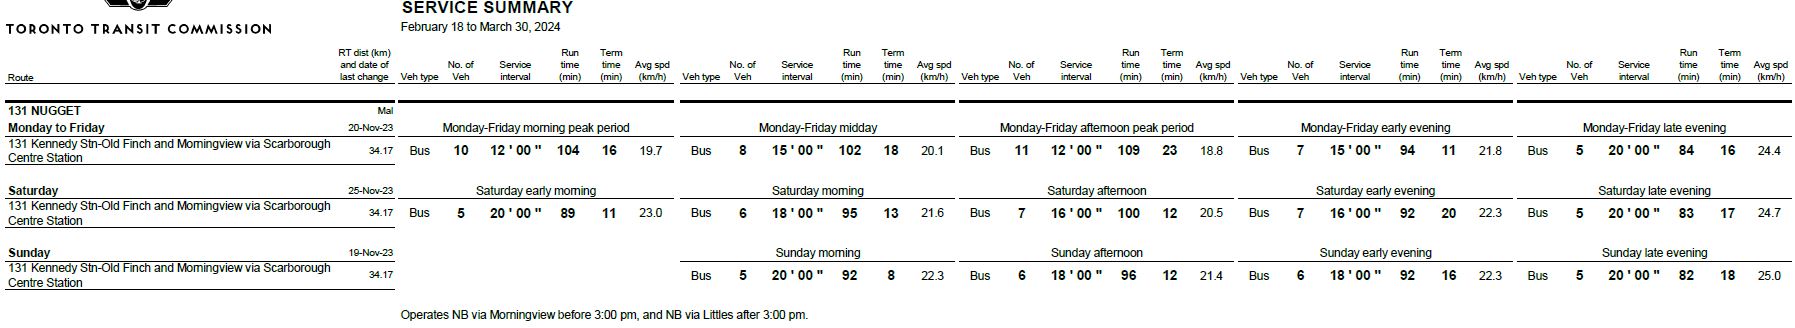
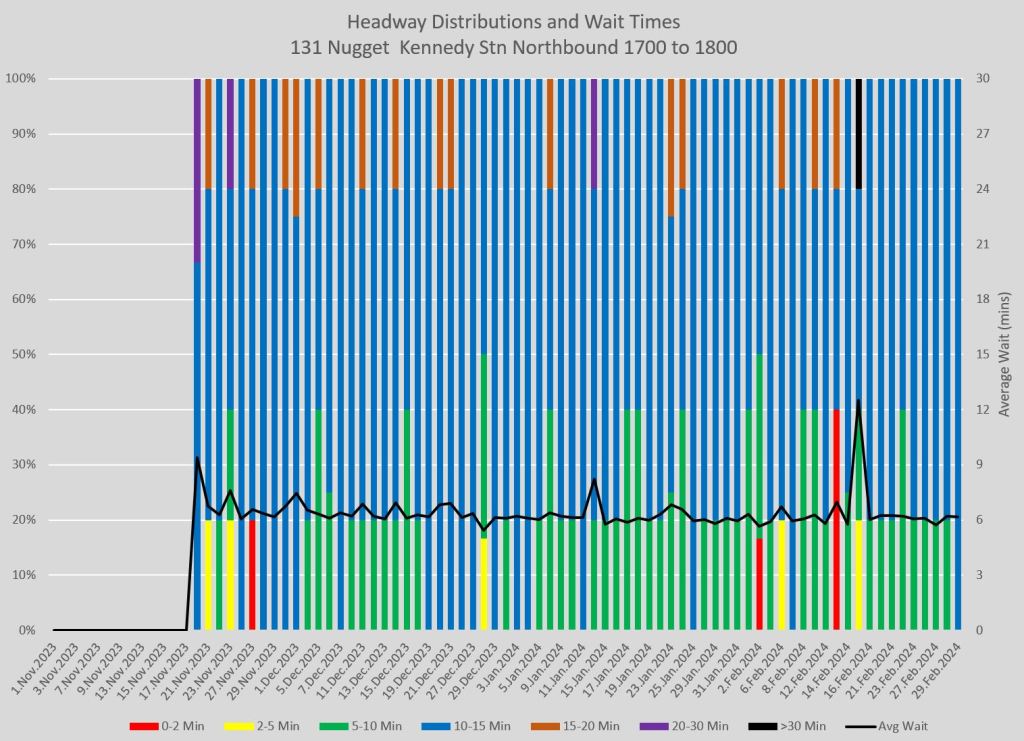
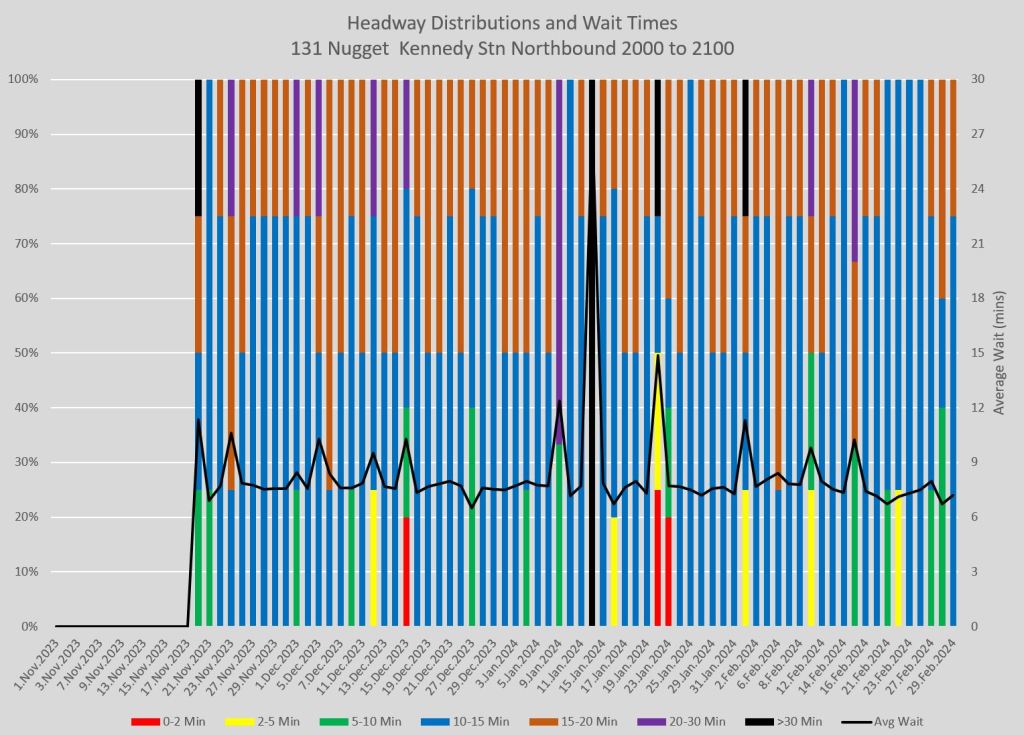
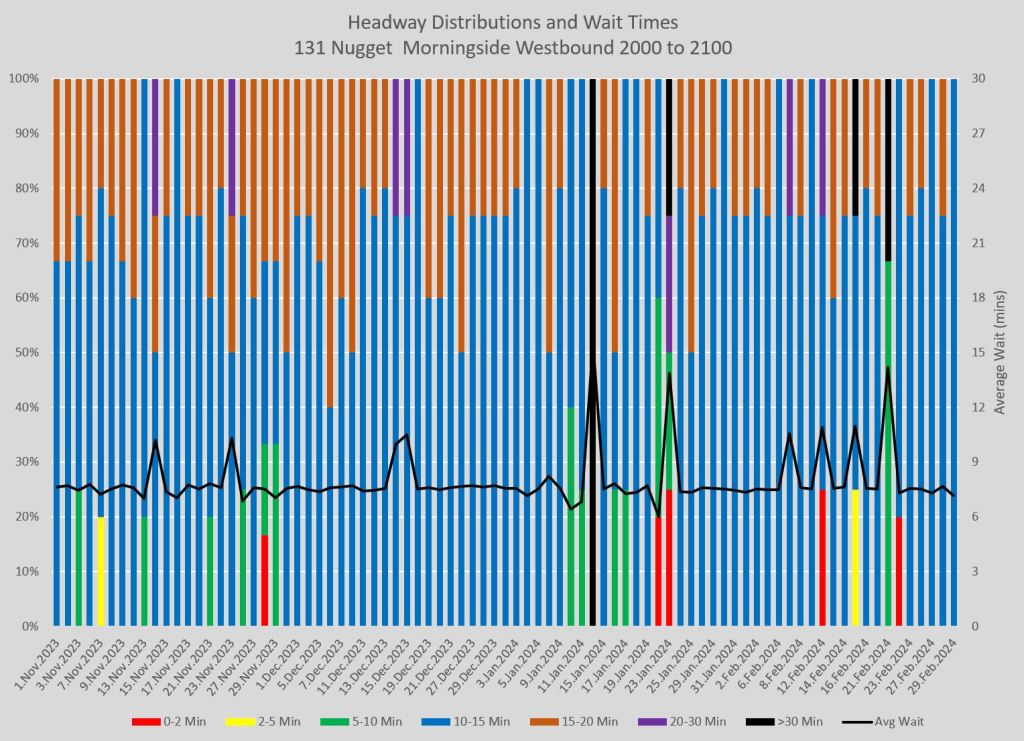
131 Nugget
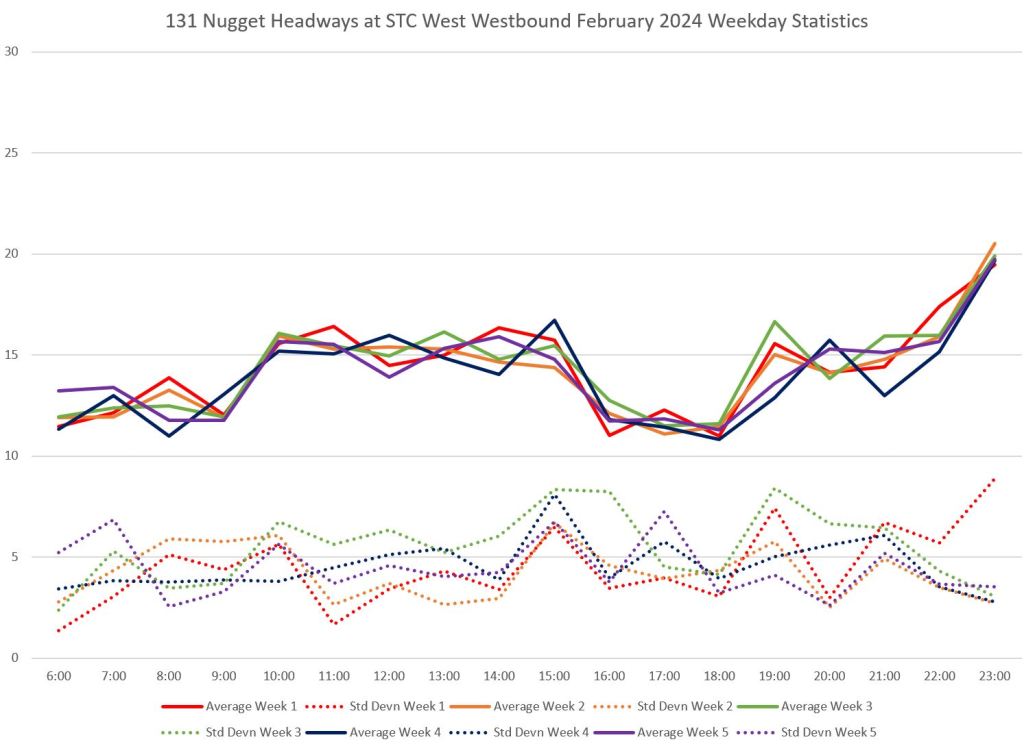
The 131 Nugget bus operates from Kennedy Station to Finch & Morningview via STC. Service on this route is more reliable than on 38 Rouge Hill or 129 McCowan North. Evening service is less reliable as scheduled headways widen, as does the amount of variation notably outbound from Kennedy Station. PM peak service inbound from STC is also ragged, but as I commented earlier, this is less of an issue due to overlapping services on the SRT corridor.
Northbound
The service leaving Kennedy Station is slightly more reliable than leaving STC depending on the time of day. However, the SD values are routinely at 4 minutes or more in February.

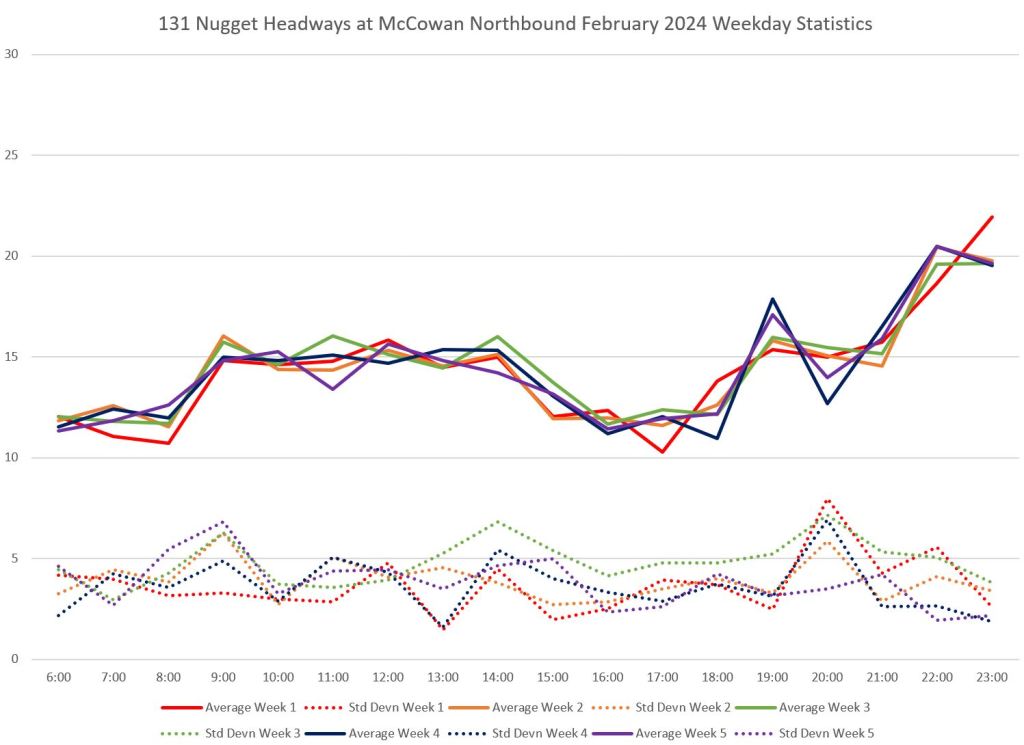
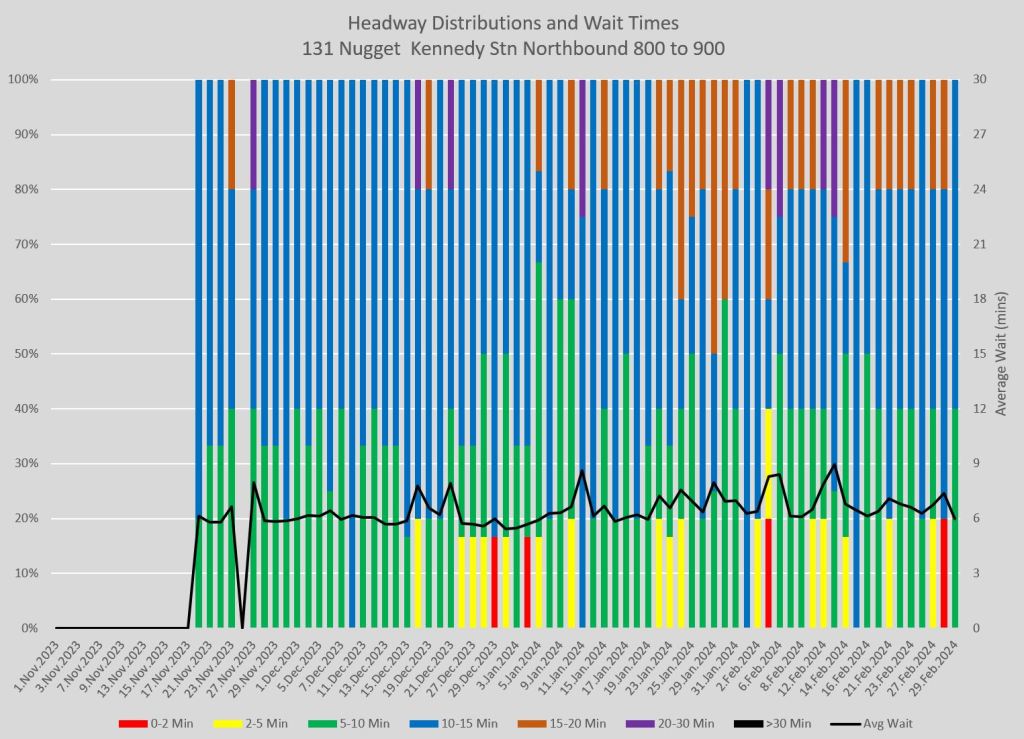
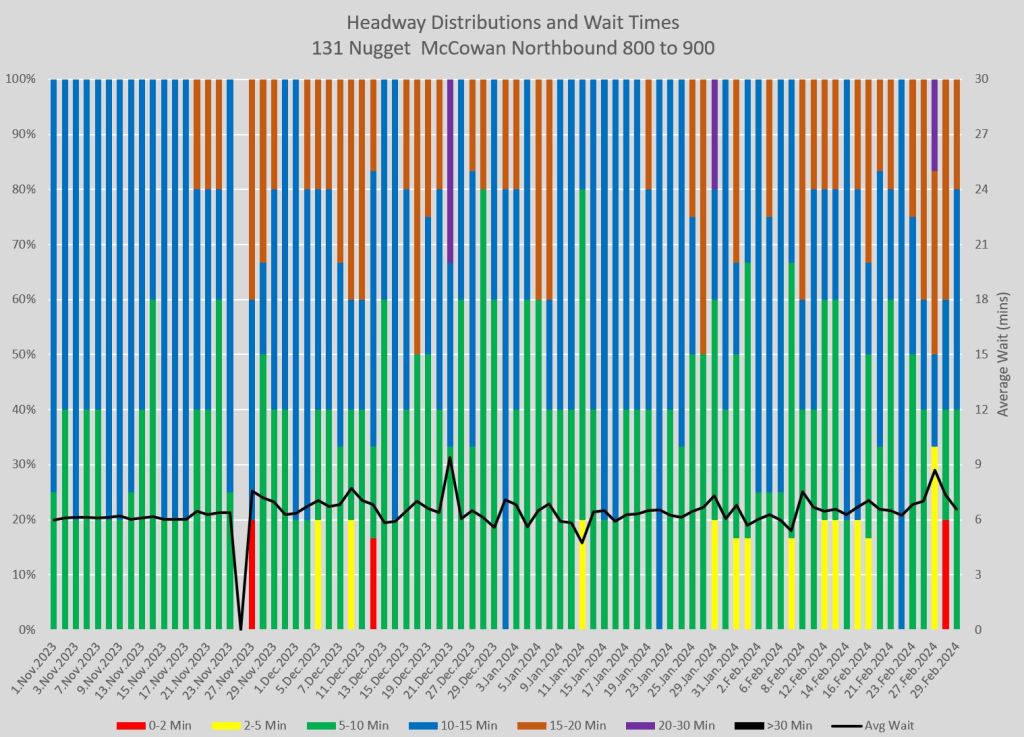
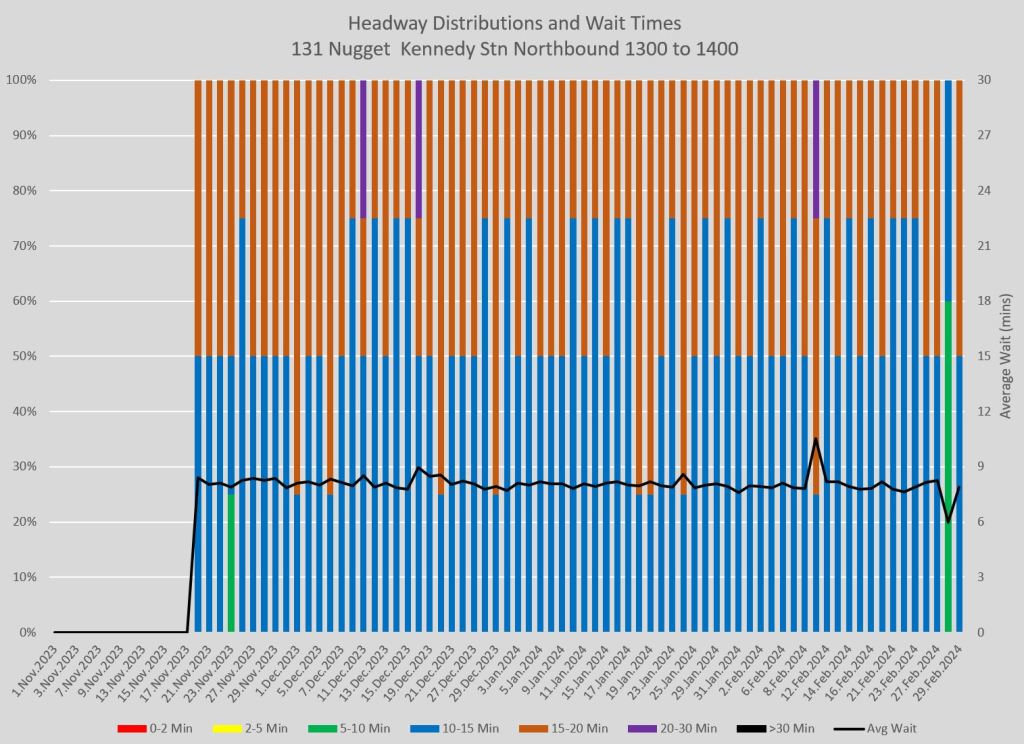
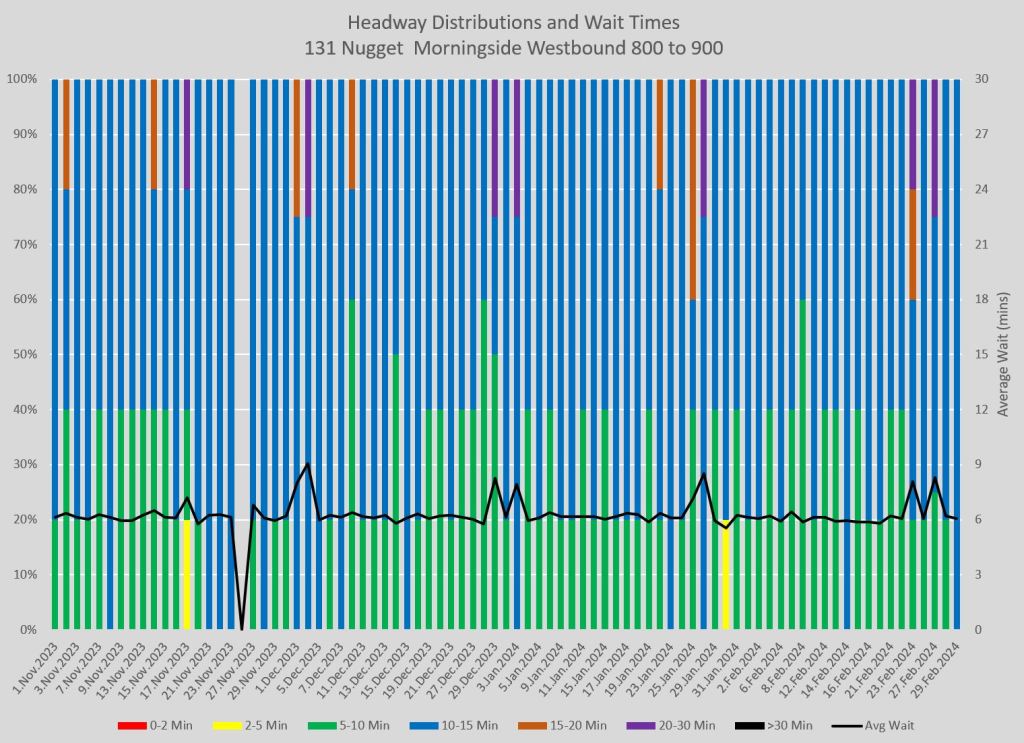
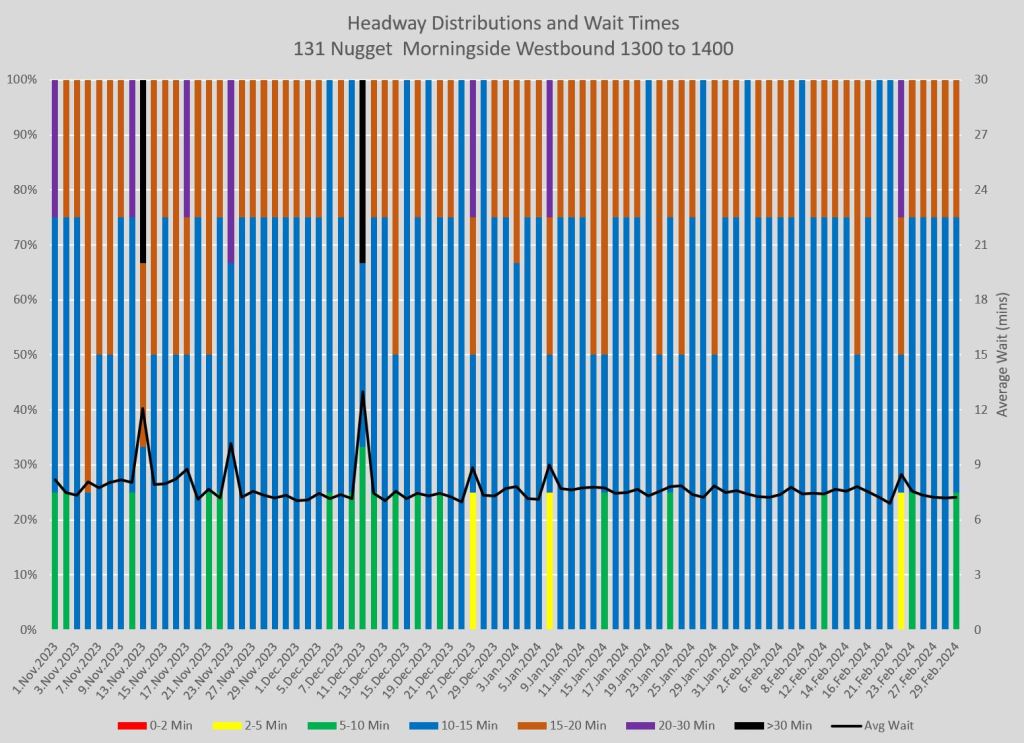
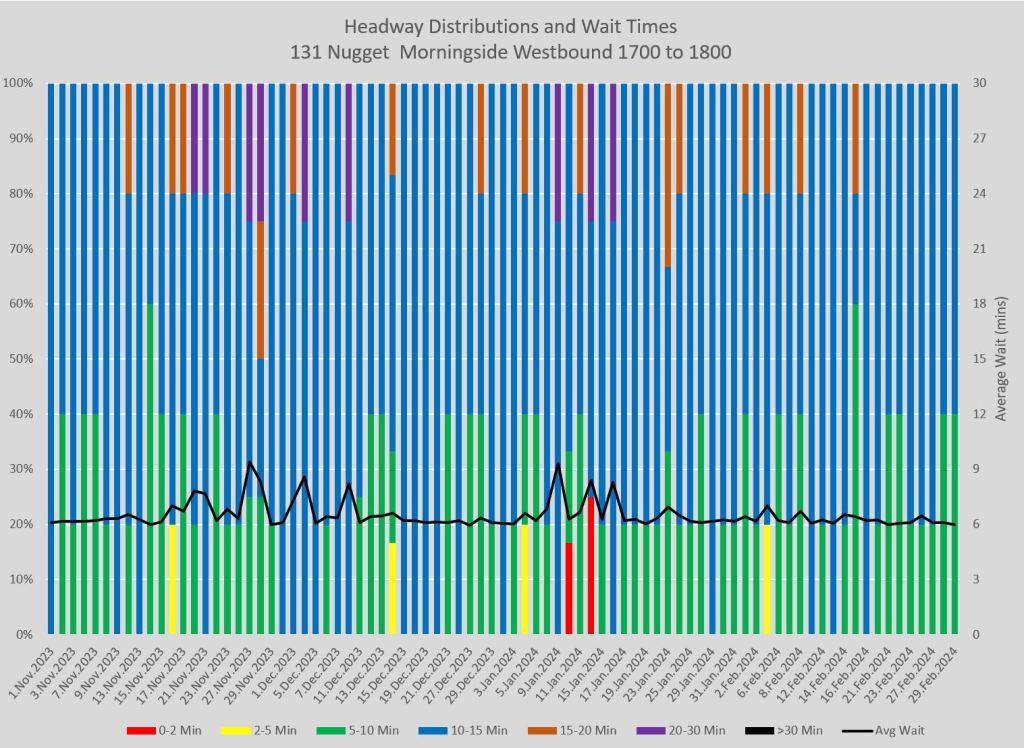
The charts below show the headway distributions over the November-February period for four time periods.


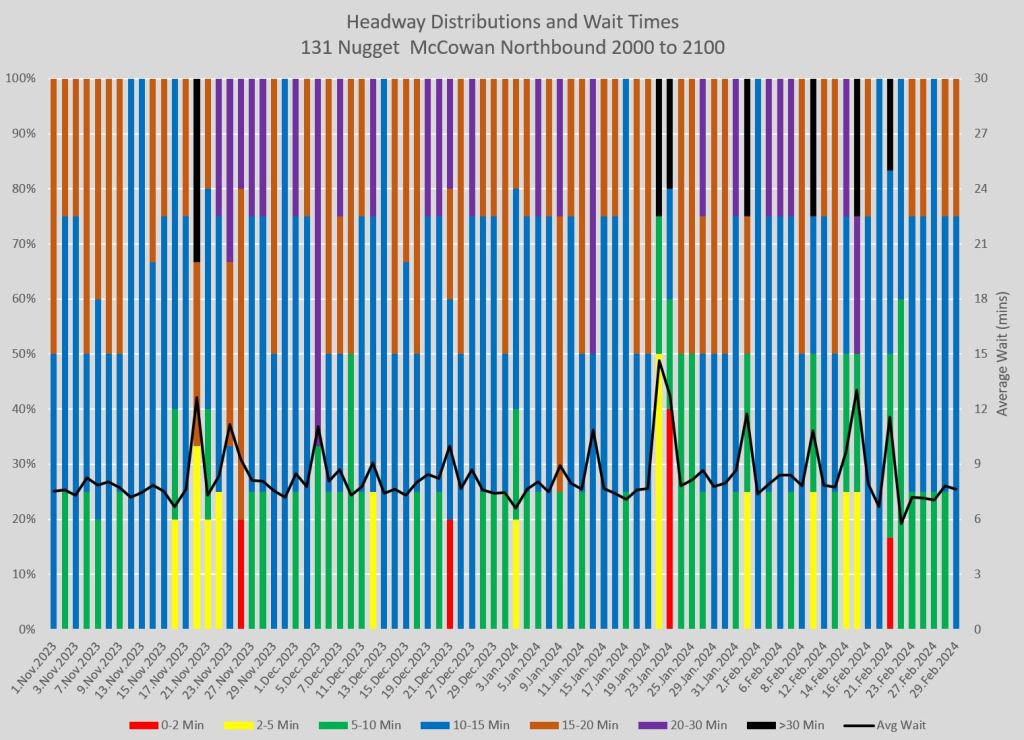
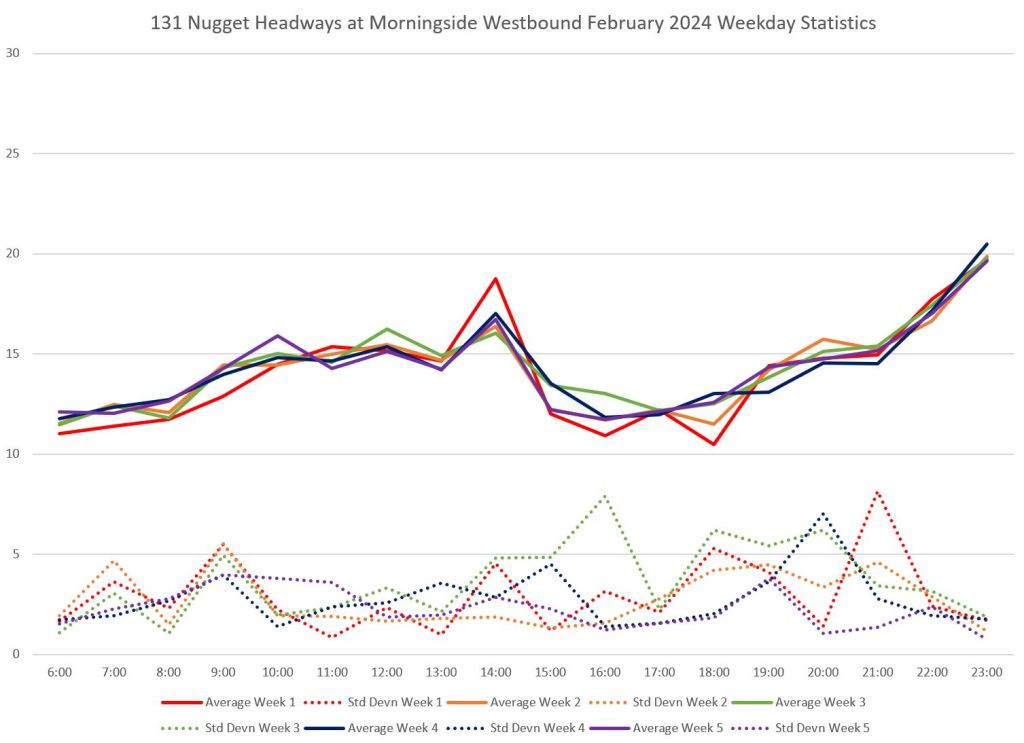
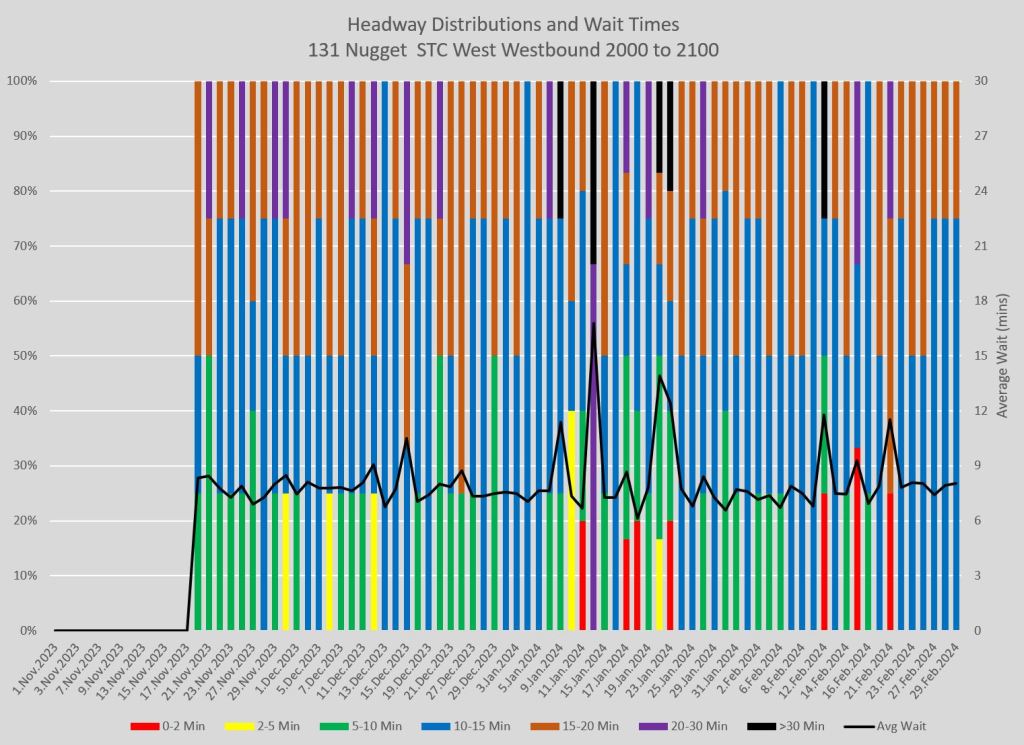
Southbound
The north end of 131 Nugget is an on-street loop, and the location where buses take their layover varies. In order to get consistent headway information, I used Morningside & McLevin as the screenline to measure inbound headways.
The SD values leaving the outer end of the line are moderate until the late afternoon and evening, but are considerably higher by the time the service leaves STC.
Here are the headway distributions.


Full Chart Sets
The PDFs linked here show the details of weekday service in February 2024.
- Northbound from Kennedy Station
- Northbound from STC at McCowan
- Southbound at McLevin & Morningside
- Southbound from STC
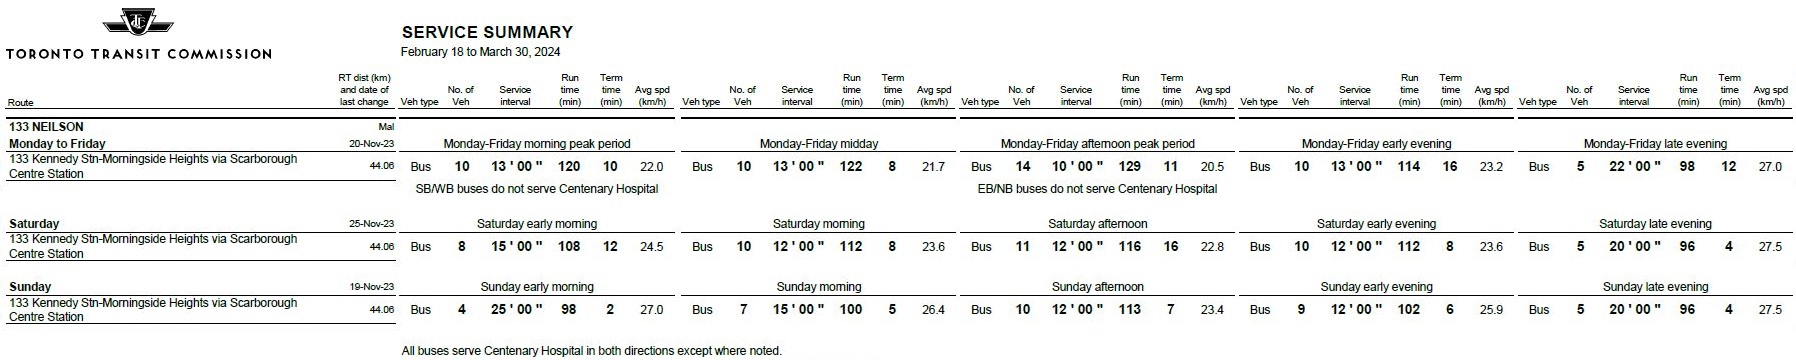
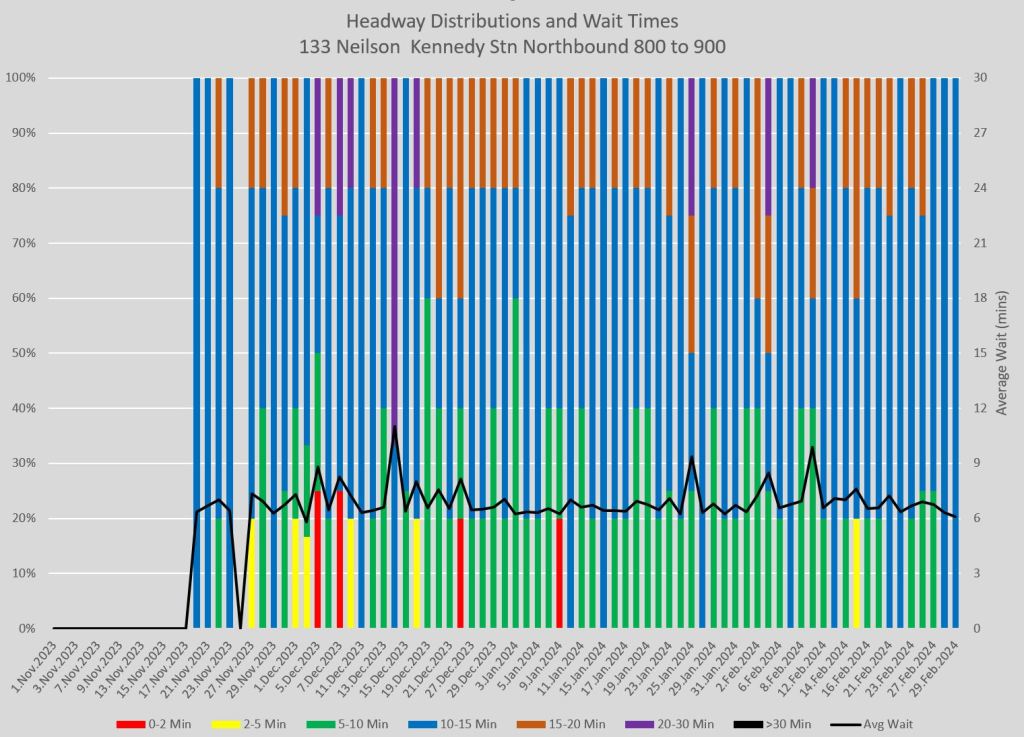
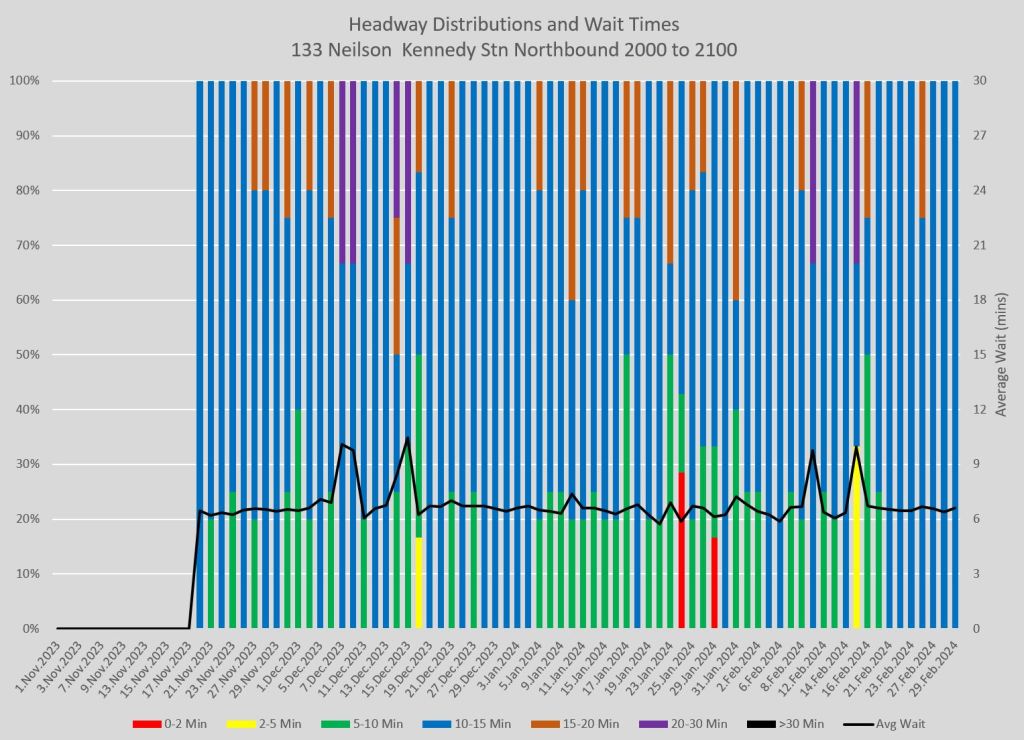
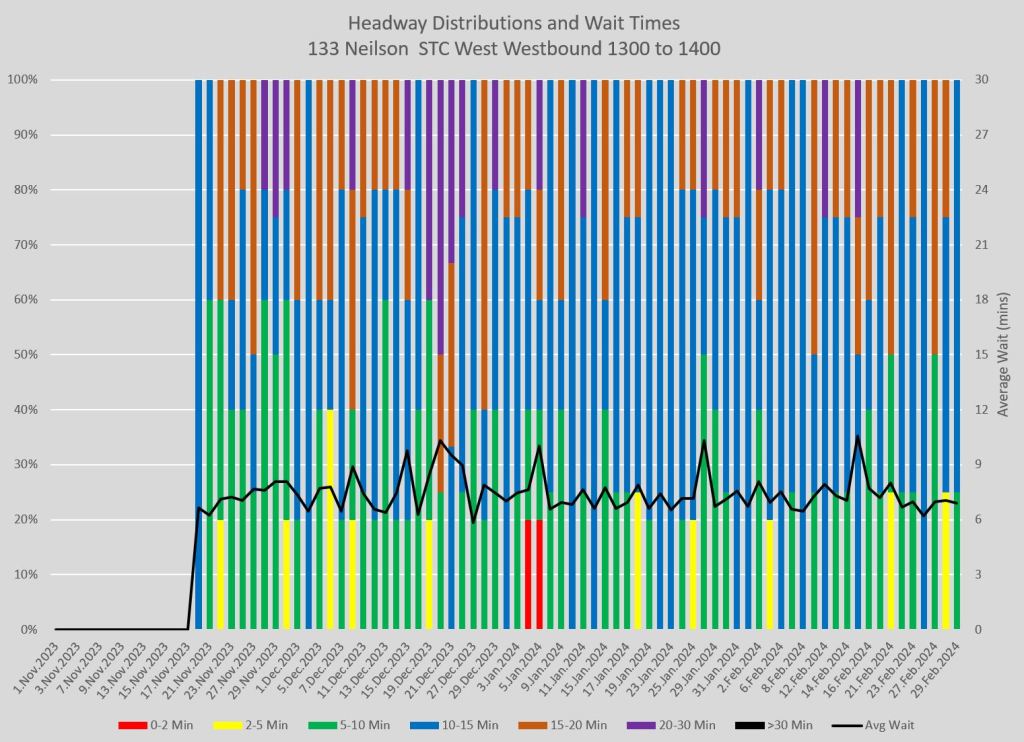
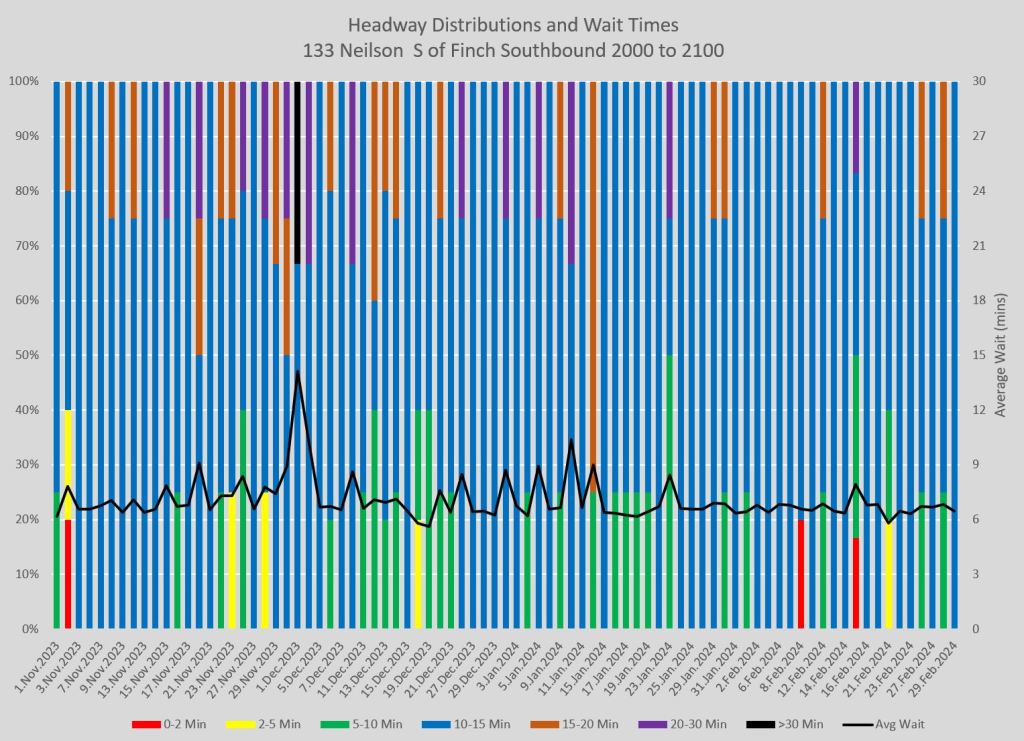
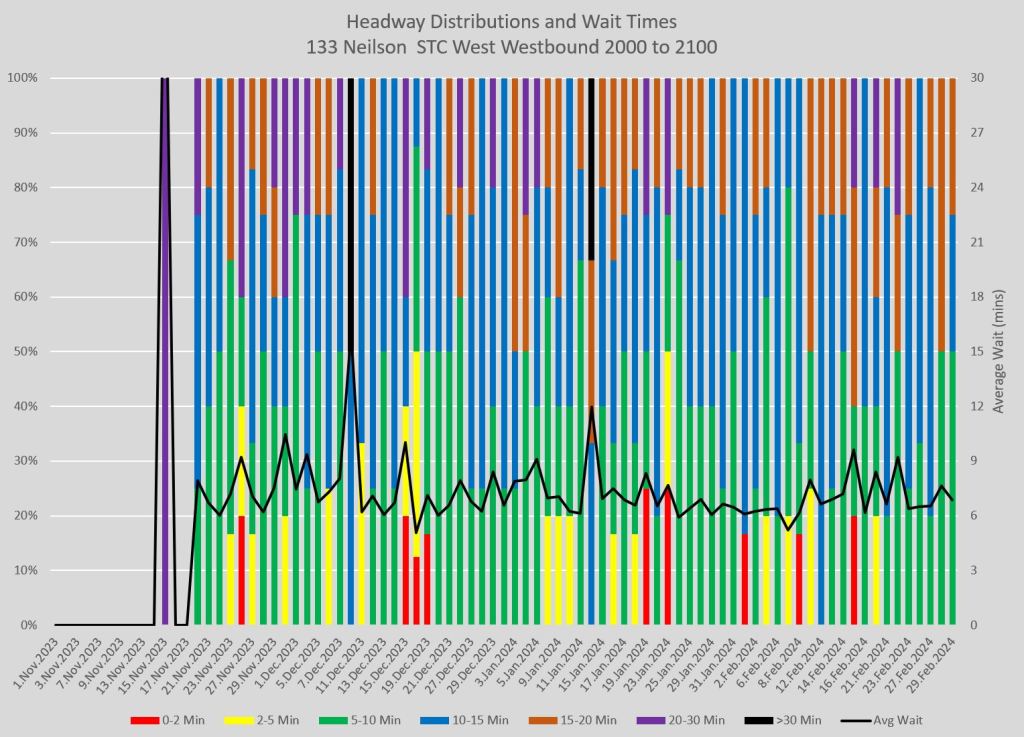
133 Neilson
The 133 Neilson bus operates from Kennedy Station to Finch & Morningside via STC. Except during peak periods, all trips serve Rouge Valley Centenary Health Centre at Ellesmere and Neilson.
Northbound
Service outbound has standard deviations of headways in the 3-5 minute range which translate to service on a range of 6 to 10 minutes around the scheduled value, about two thirds of the time.


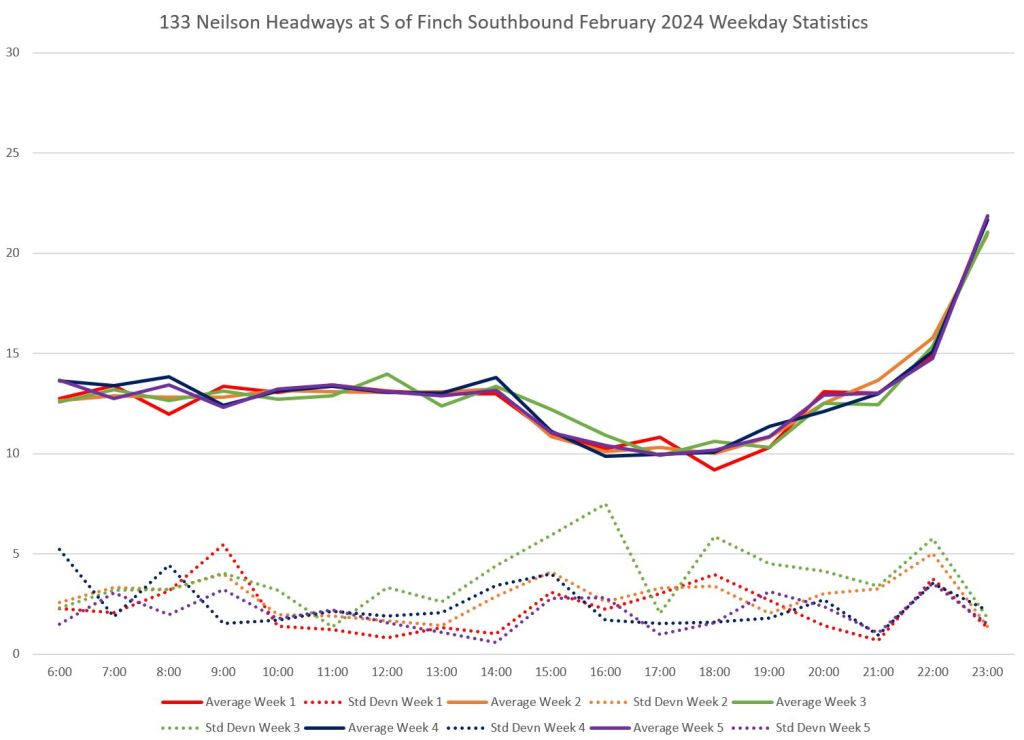
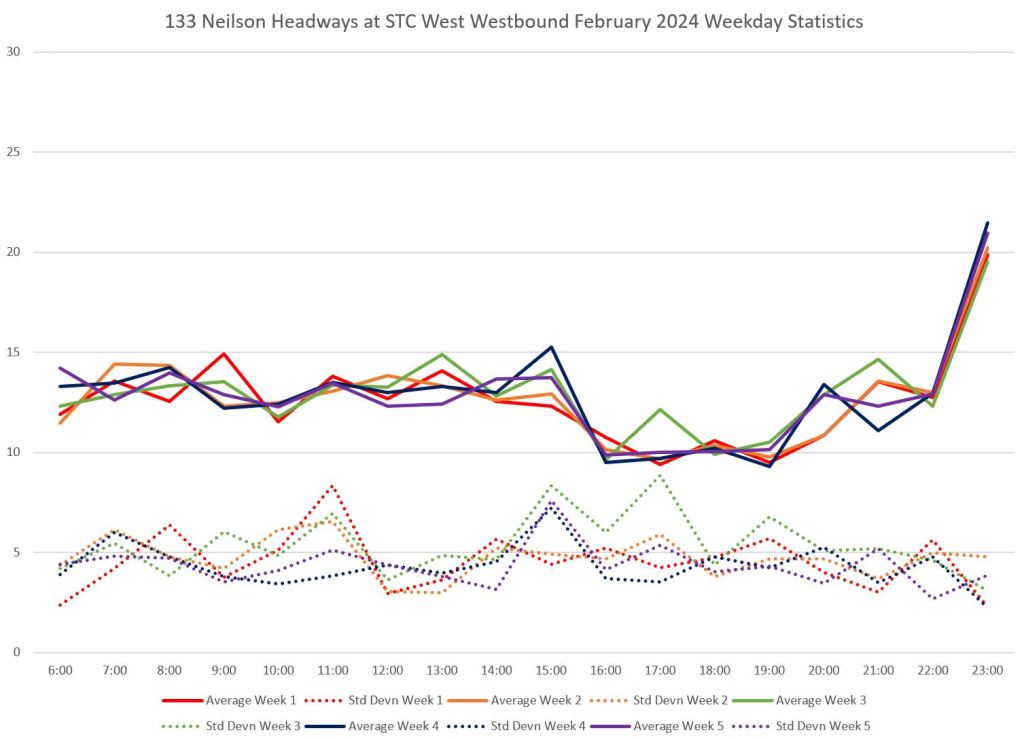
Southbound
Inbound service from Finch is better behaved than the outbound service near the terminal, but the SD values are higher by the time buses leave STC showing the development of bunches particularly in the PM peak when the average headway drops to 10 minutes, but the SD value stays at 5.


This analysis continues in Part 2.

I have not had to go up there, and I suppose if I am lucky I won’t have to.
I am curious, with all this service, I assume that someone travelling strictly between Kennedy station and STC will have much more frequent departures to choose from, which may make the overall travel time a wash even if the buses are slower. (Does your data look at average travel times Kennedy <> STC?)
Steve: Please see this article for a review of travel times on the 903 Express which I use as a surrogate for all routes.
I guess the next point is, if I used to travel on the RT from Kennedy to STC to catch my bus, and now it comes directly to Kennedy, do I save time overall? I am only worrying about headways on one line, not two.
Steve: You trade off the transfer at STC for longer travel time between Kennedy and STC. Generally speaking, the delta in travel time is bigger than the typical saved transfer time, but you don’t have to get off the bus.
Last question, and I don’t think your data looks at this here, is how good were the headways of these routes when they ran to STC only? In other words, with random headways being a TTC trademark, are they that much worse with the extension to Kennedy?
Steve: I did not start collecting data for most of these routes before November 2023. However, the early weeks of November do show up in the headway distribution charts for locations served by these routes before the change, and there is little difference before/after mid-November.
I would think that people who actively used the RT, and now use the shuttles, would have some interesting stories/opinions.
Steve: An underlying point in these articles is that there’s more to these routes than the section between Kennedy and STC stations, and that the TTC has reliability problems. This is not really news, but is intended to document what is going on. We are not at the “job done” stage just because we have red lanes and, eventually, a BRT roadway.
LikeLike
Do you also have any data about the 43 Kennedy and 57 Midland? I’m curious if the lanes along Kennedy/Midland have any major impact on the local routes.
Steve: I didn’t get data for these routes from November-February, but will add them to the March list. I have data for 43 Kennedy from a year ago as a comparison, but nothing for 57 Midland. Thanks for raising this as I should have been tracking them too through this period.
LikeLike