
This article updates tracking charts of travel times on three proposed RapidTO bus corridors with data to the end of 2023. The routes covered are:
- 29/929 Dufferin from King to Wilson
- 35/935 Jane from Eglinton to Pioneer Village Station
- 39/939 Finch East from Victoria Park to McCowan
- 54 Lawrence East from Victoria Park to PortUnion
I will turn to other RapidTO corridors including the existing Eglinton-Kingston red lanes in Part II of this series.
Without going into a lot of interpretive detail, the purpose of these charts is:
- To show the travel times under “best case” conditions of low road traffic in Spring 2020 (the covid pandemic onset), and the changes since that time.
- To show the variation in travel times day-by-day and at varying times of the day.
If RapidTO can flatten out variations in travel times and get the typical time to a consistently lower level, bus service should not only be faster but more reliable. That was the goal on King Street which, for a time, achieved it’s purpose of improving transit.
The focus of too much transit politics is on saving time getting from point “A” to “B” and not enough on ensuring that this time is consistent from day-to-day, hour-to-hour. This includes both on-vehicle travel time and reliability of the interval between buses, a frequent topic on this site.
Toronto’s Executive Committee will consider a report RapidTO: Surface Transit Network Plan at its meeting on January 30, 2024. I will report on the full document after their discussion and additional information, if any, from the meeting.
Introduction
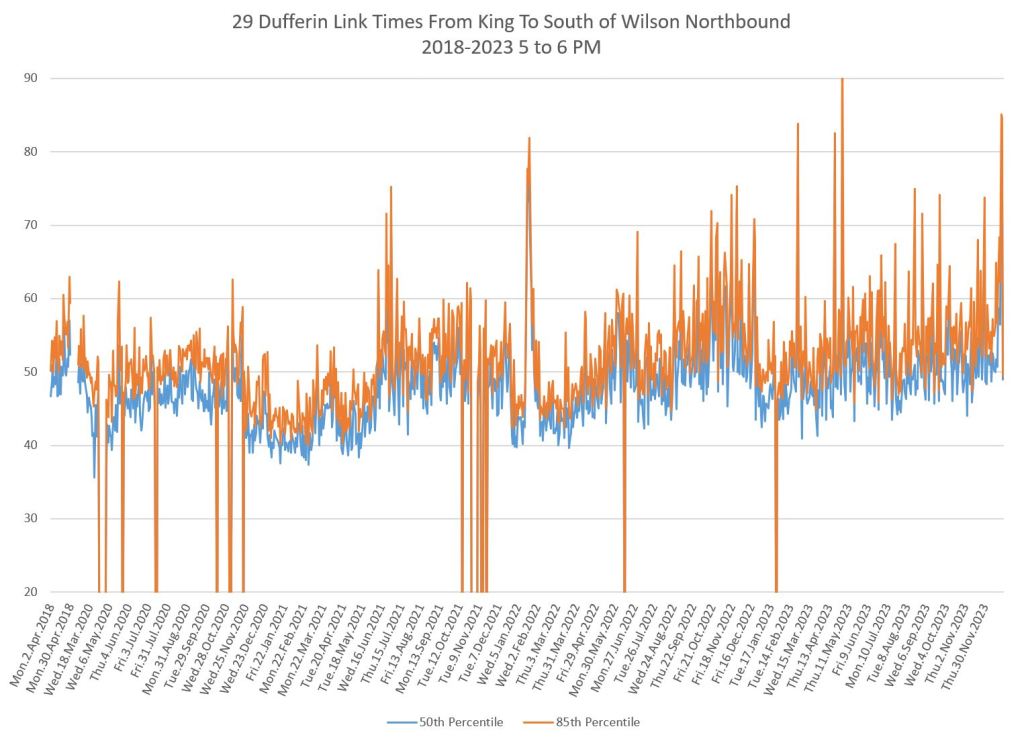
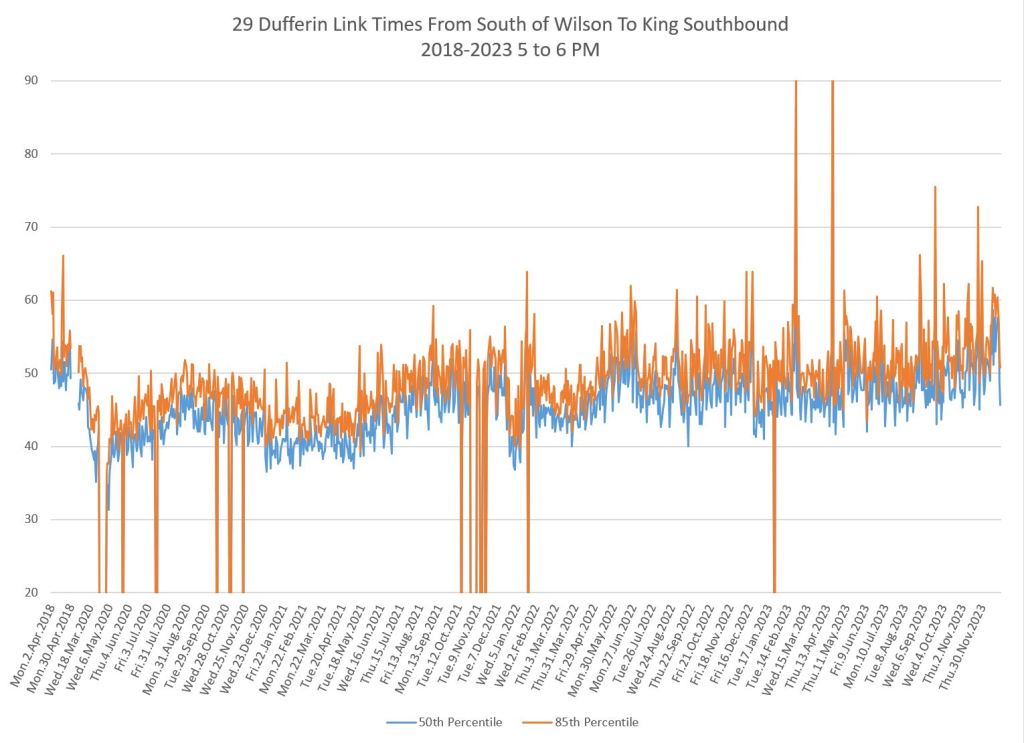
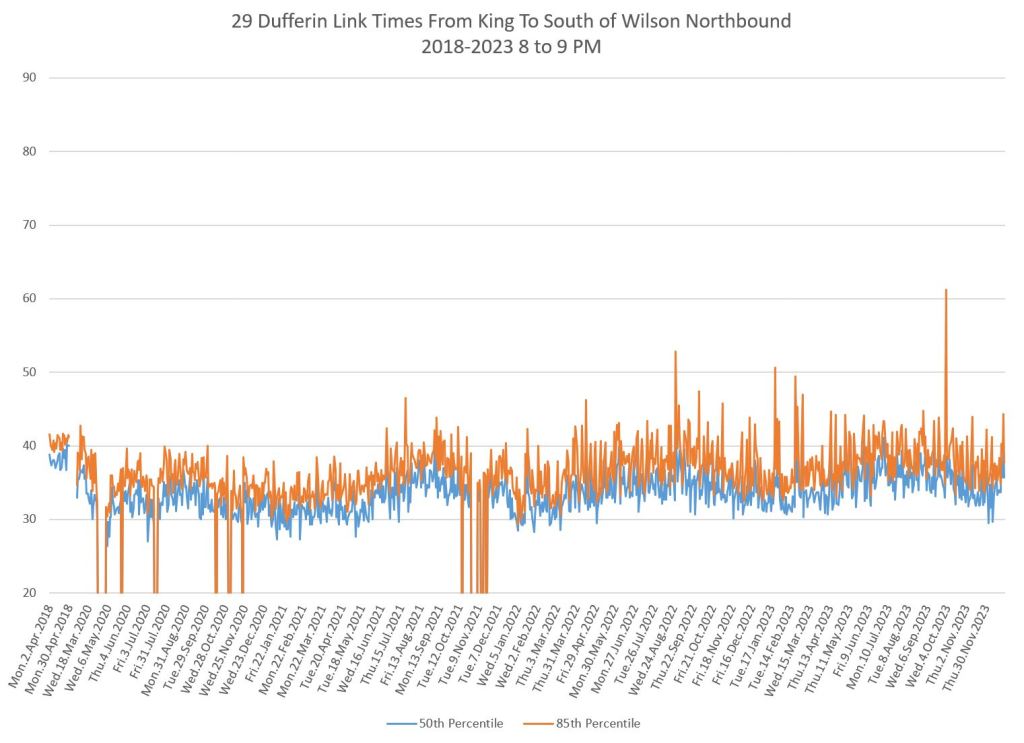
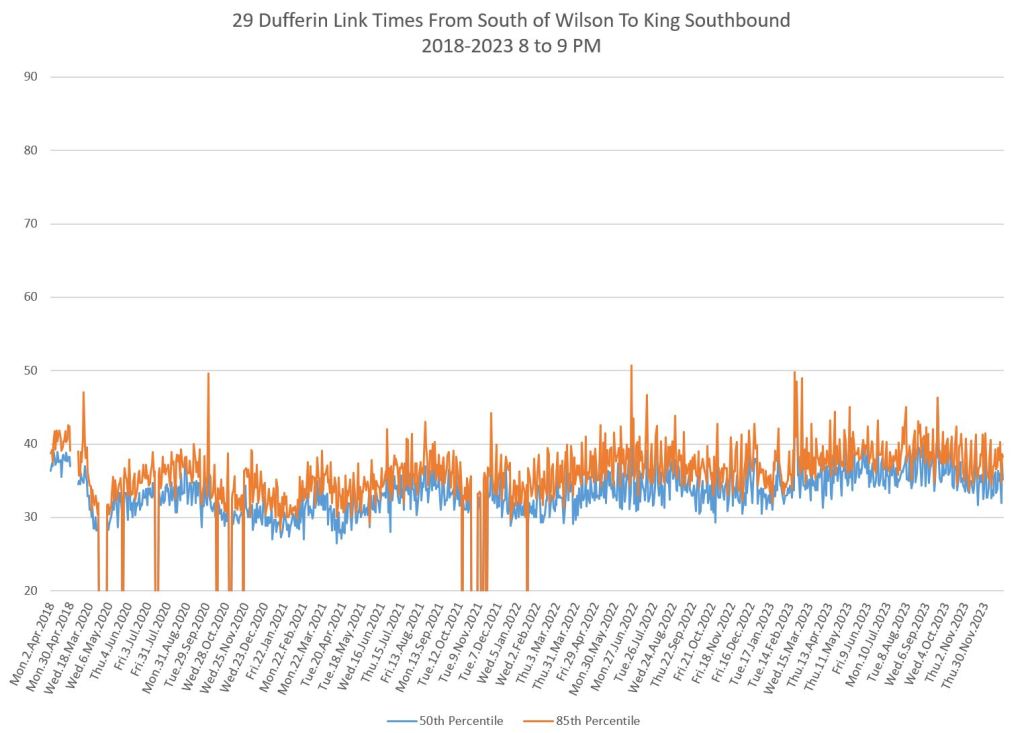
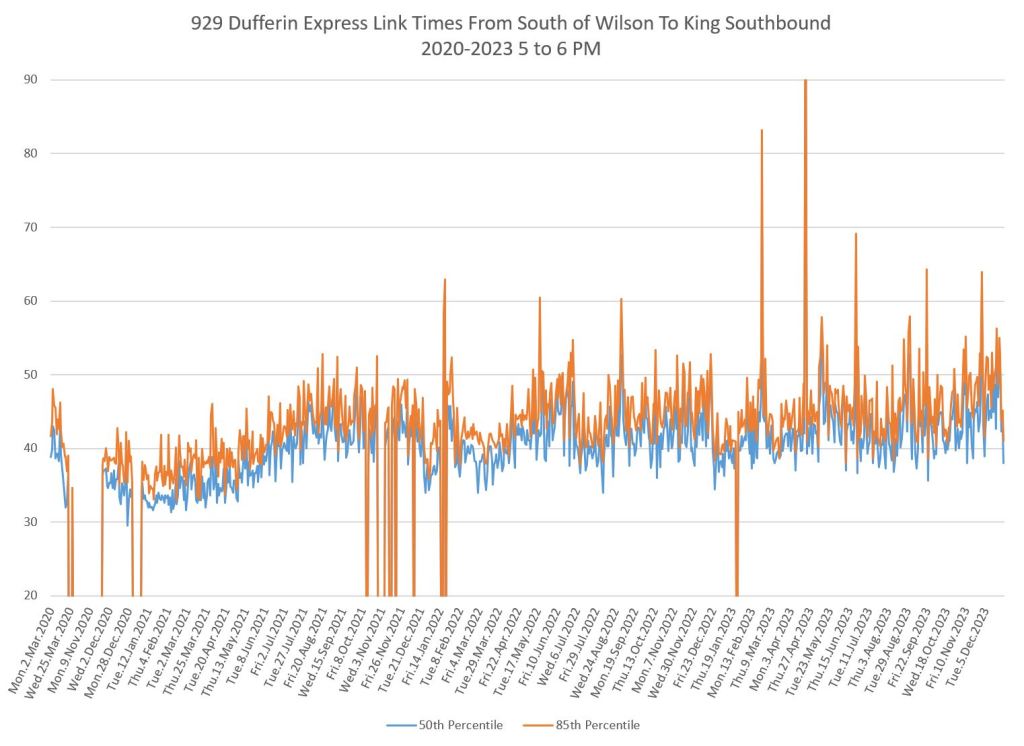
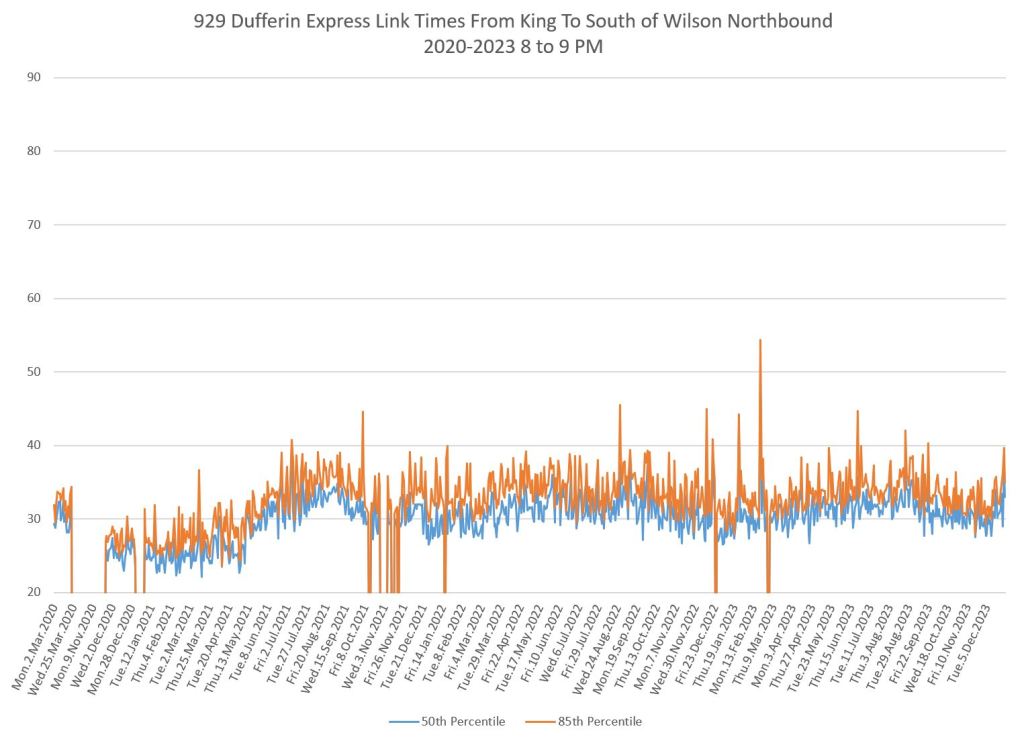
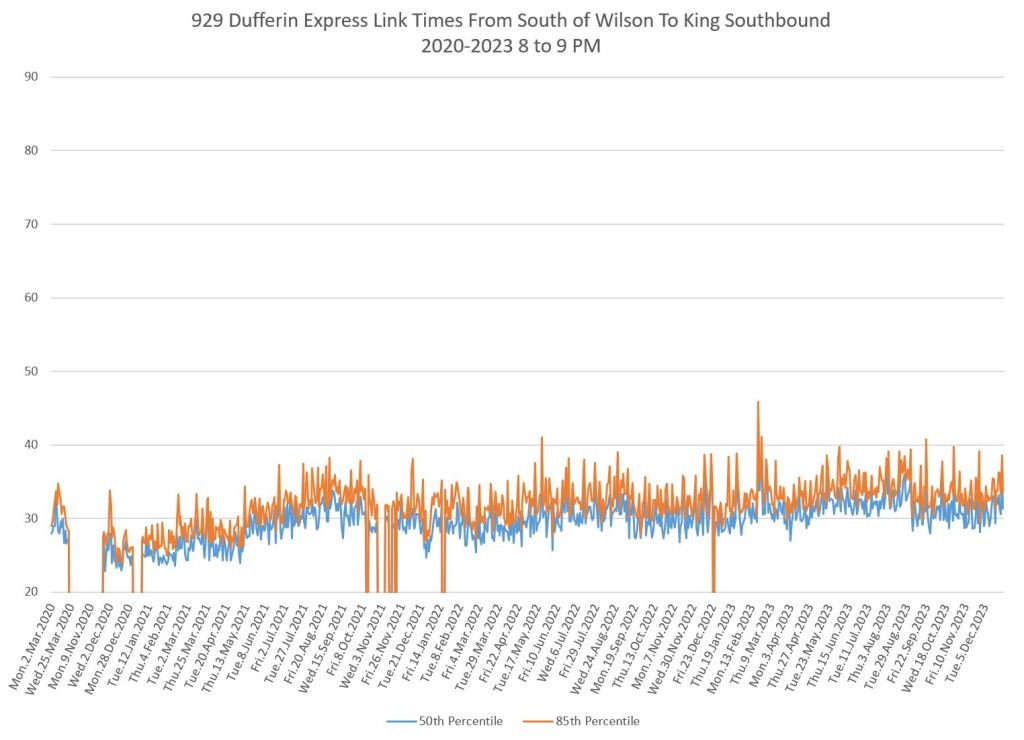
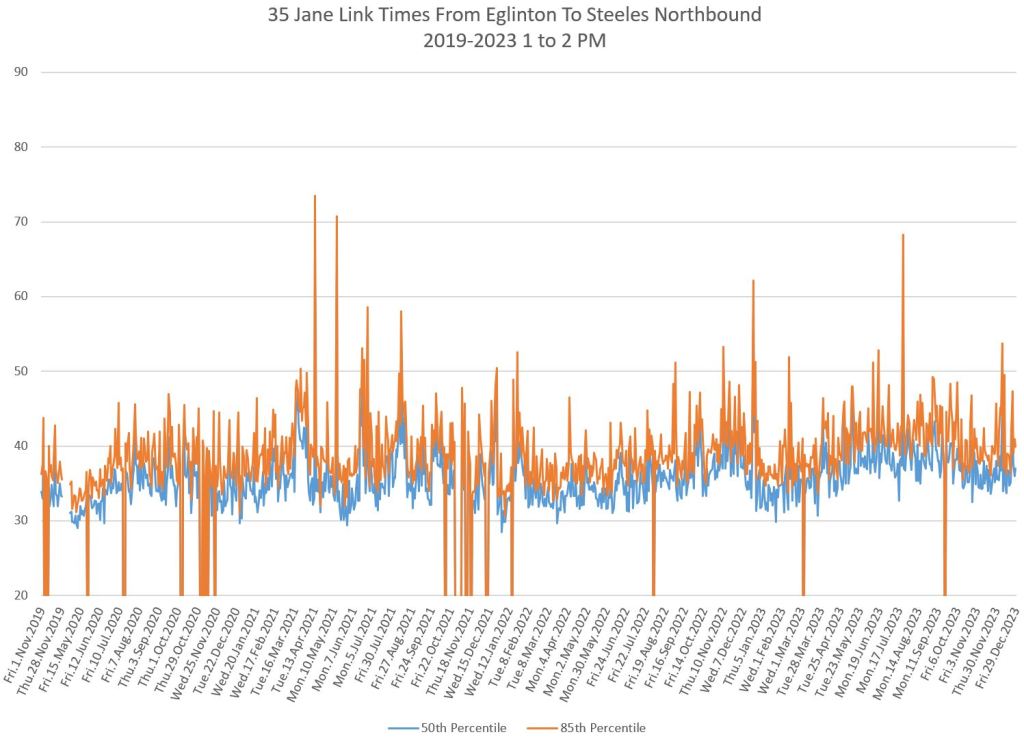
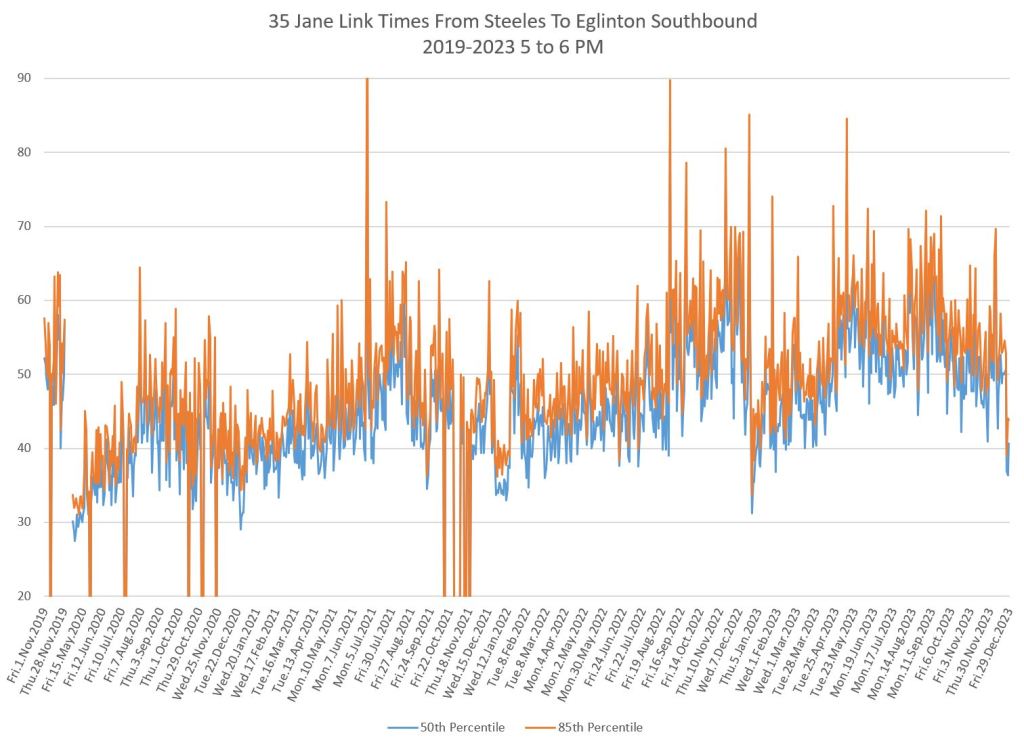
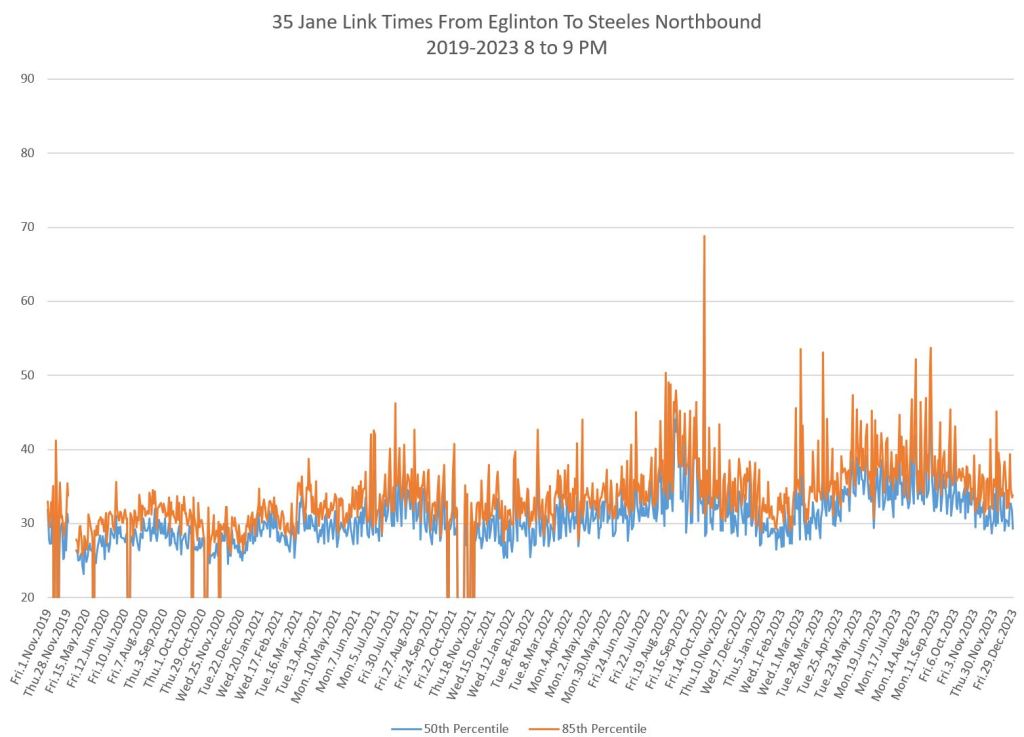
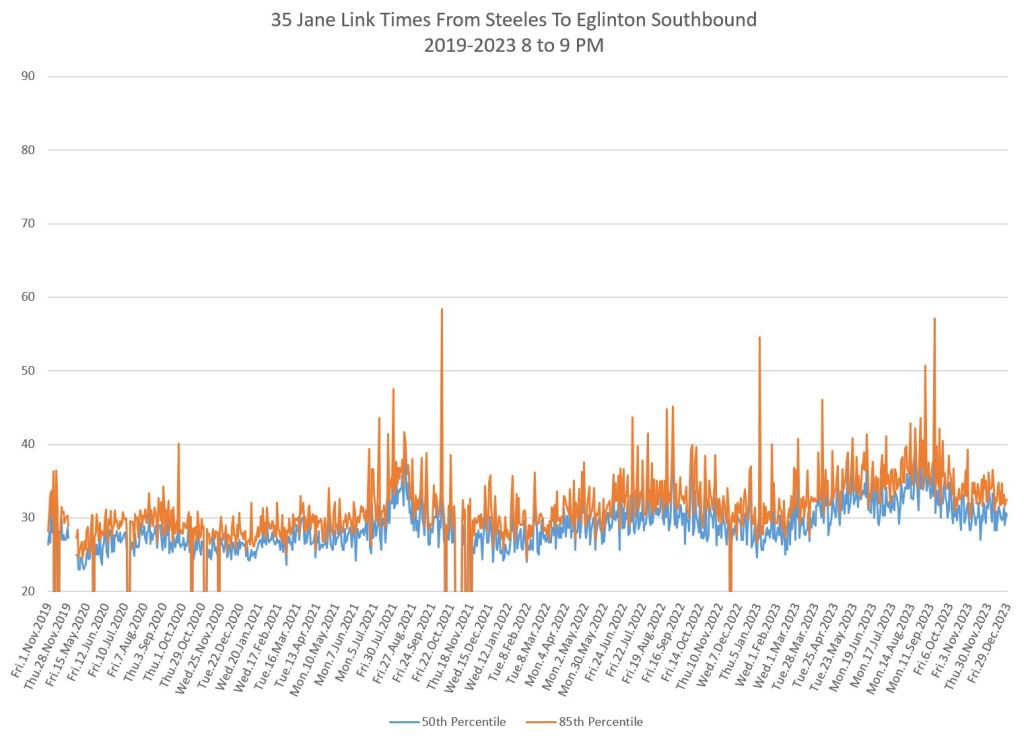
In each route’s analysis, charts of median and 85th percentile of travel times show how consistent, or not, bus travel has been in recent years. Data are presented for four hourly periods beginning at 8am, 1pm, 5pm and 8pm to show how conditions change through the day.
These routes have local and express service, although the express version did not run all of the time during the comparison period. Travel time differences are shown between the local and express service to show how much or little advantage the express buses have. The differences are often small enough that waiting for an express bus could consume more time than simply taking the next local that shows up.
29/929 Dufferin
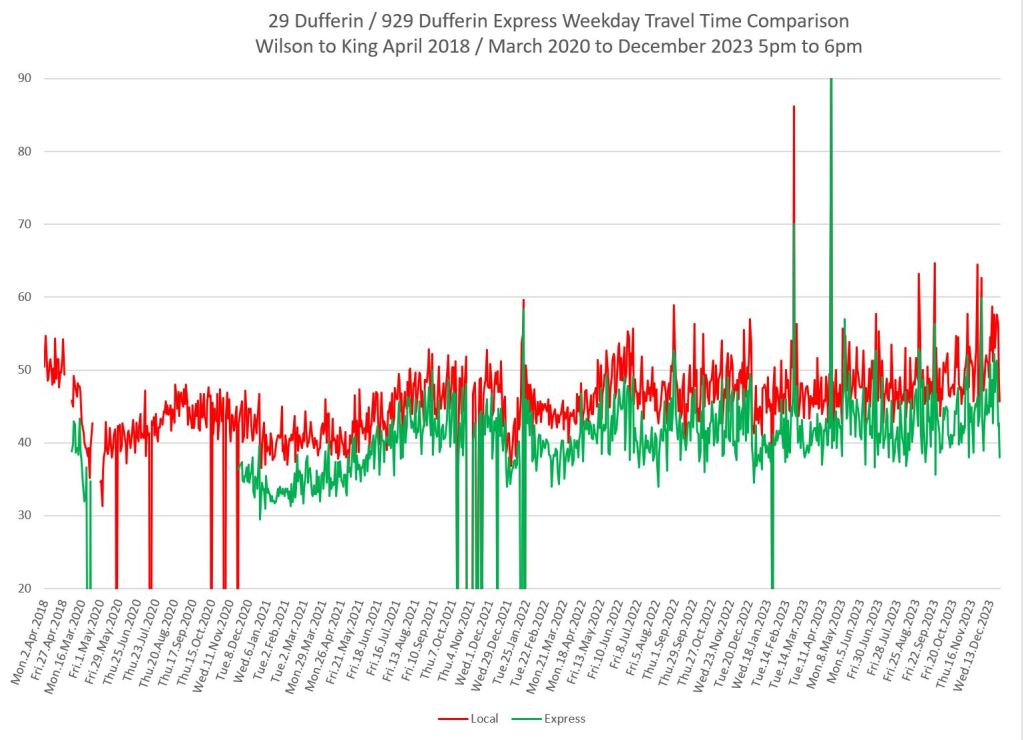
Local Service
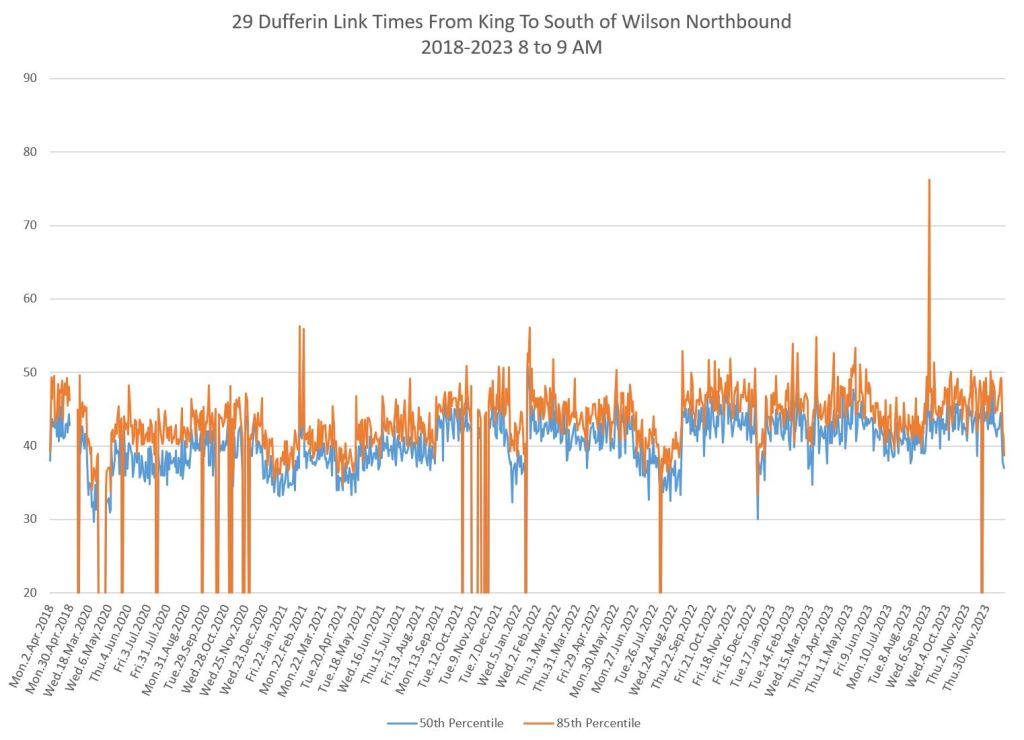
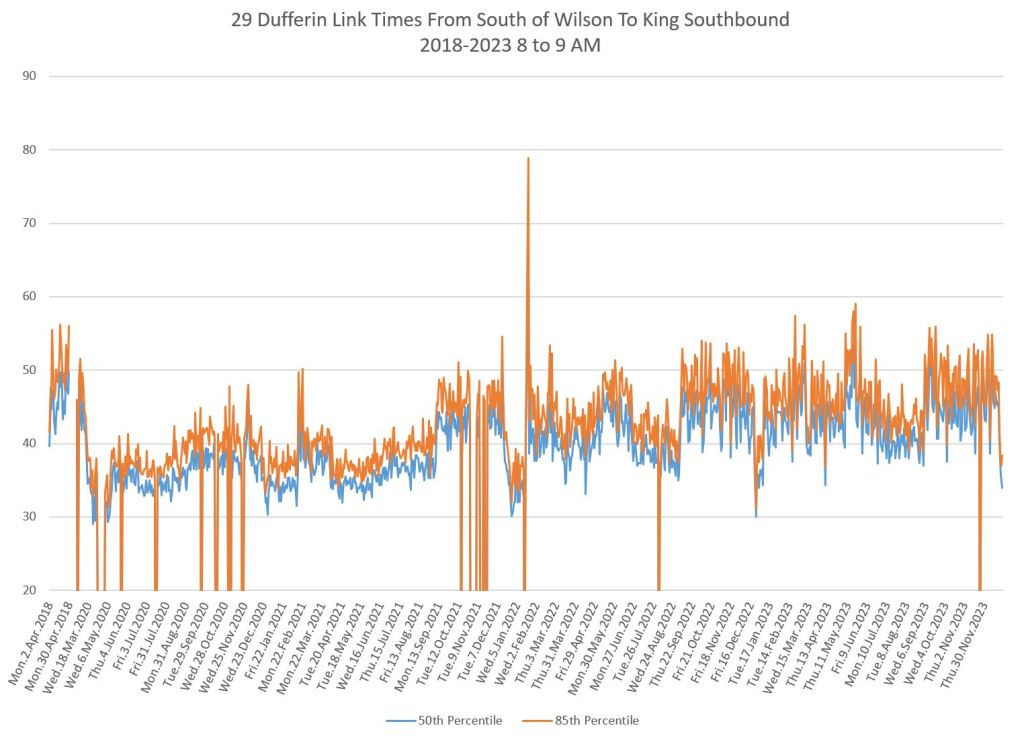
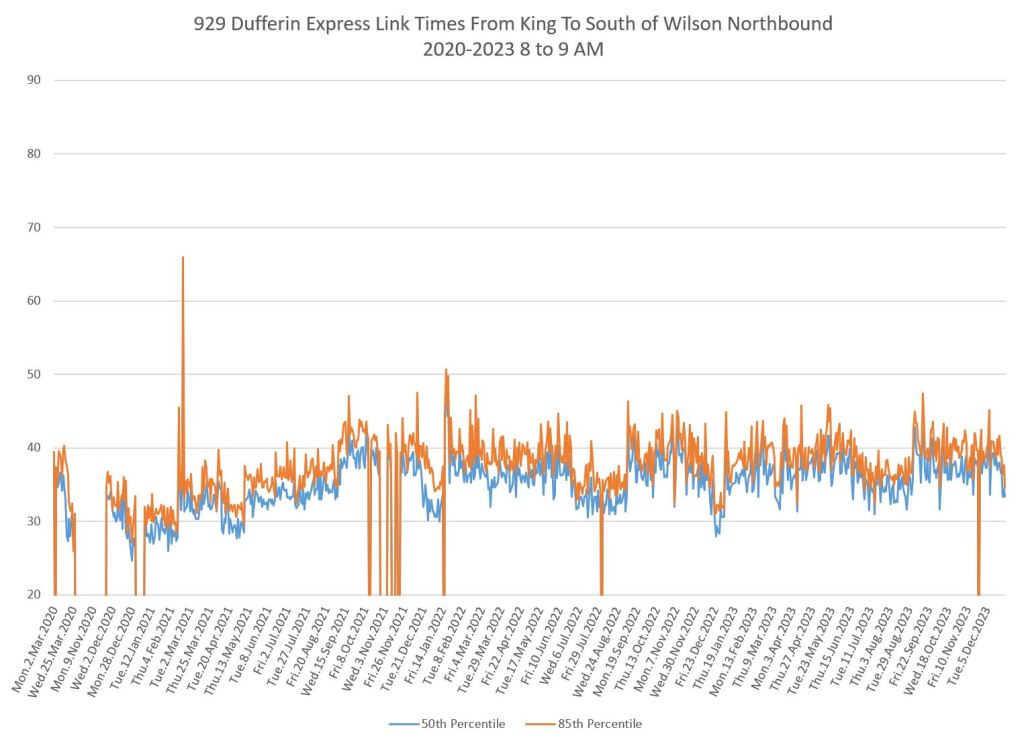
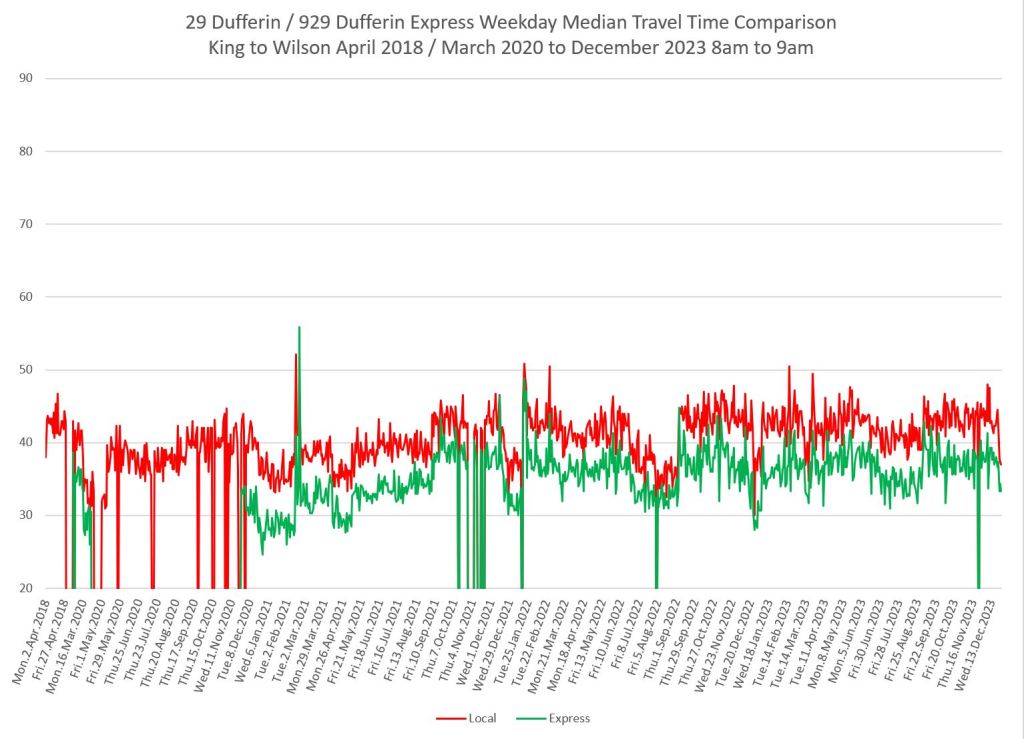
Data for April 2018 are included as a pre-pandemic point of reference.
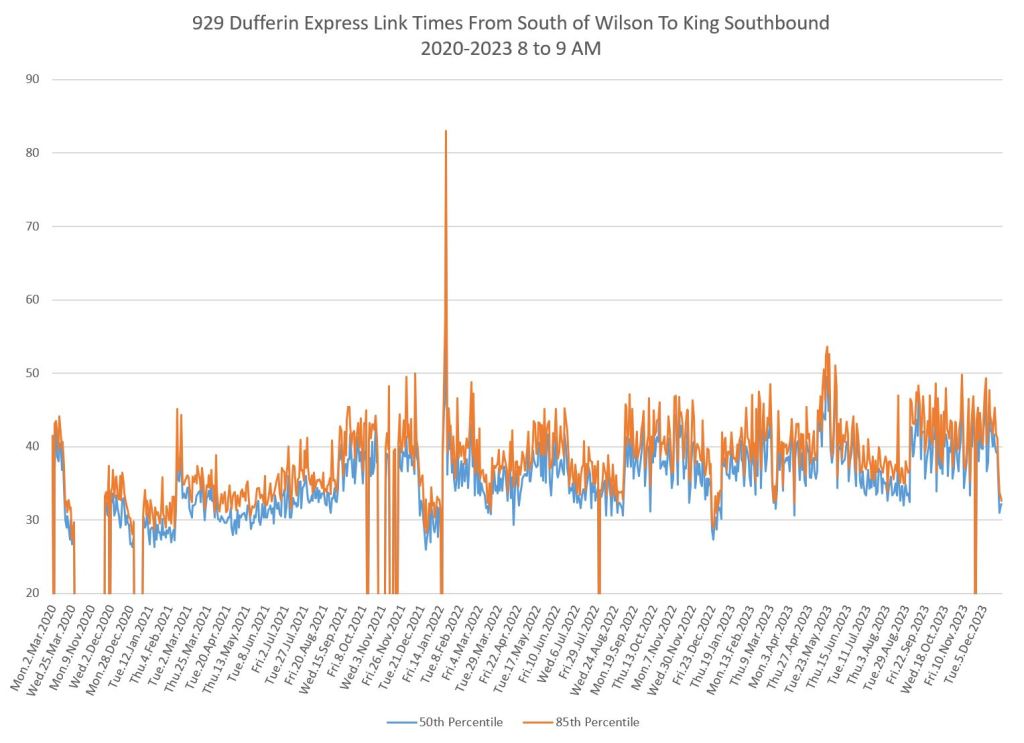
The pandemic onset is marked by a drop in travel times in both directions in March 2020. This is probably as low a value as one is likely to see. Note that travel times bounce up again almost immediately.
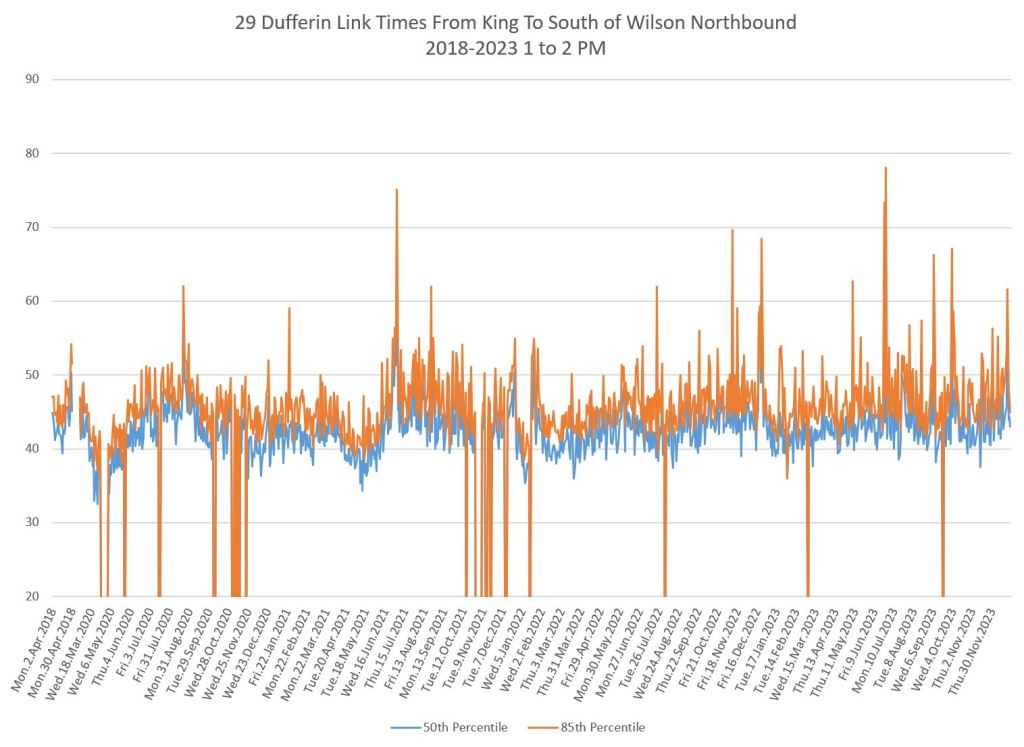
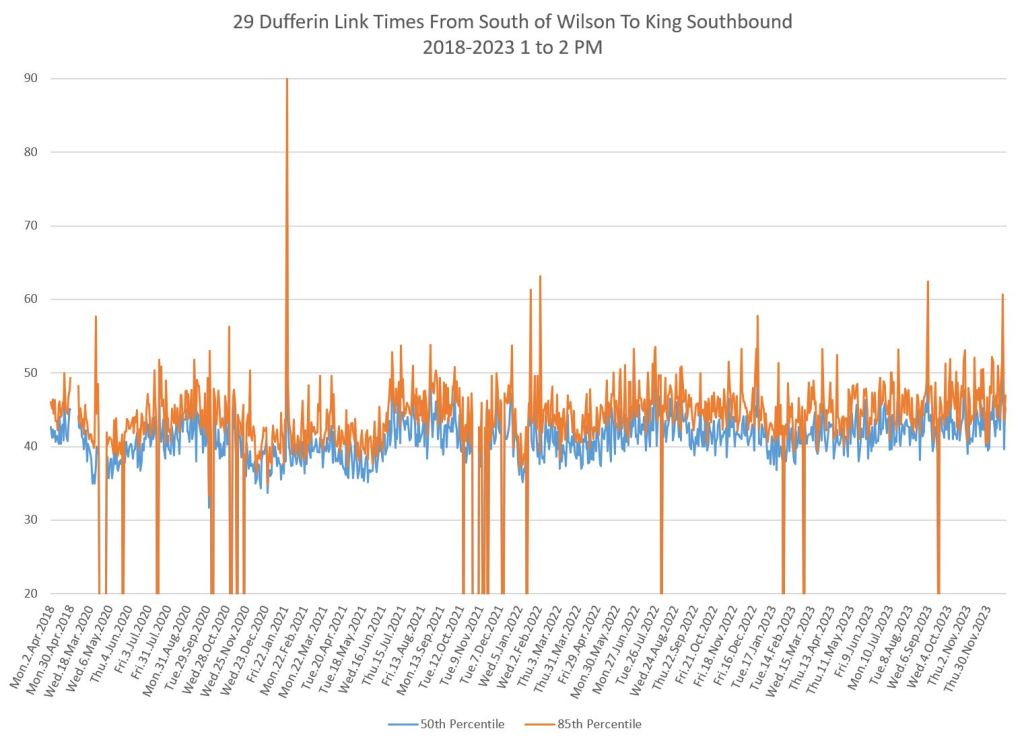
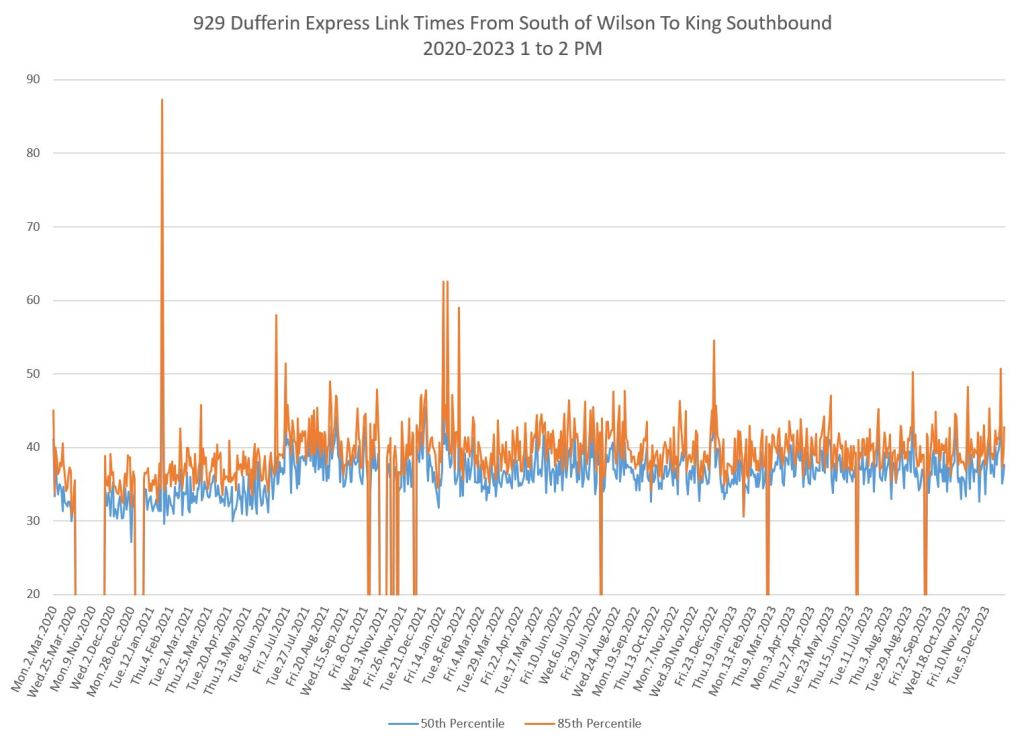
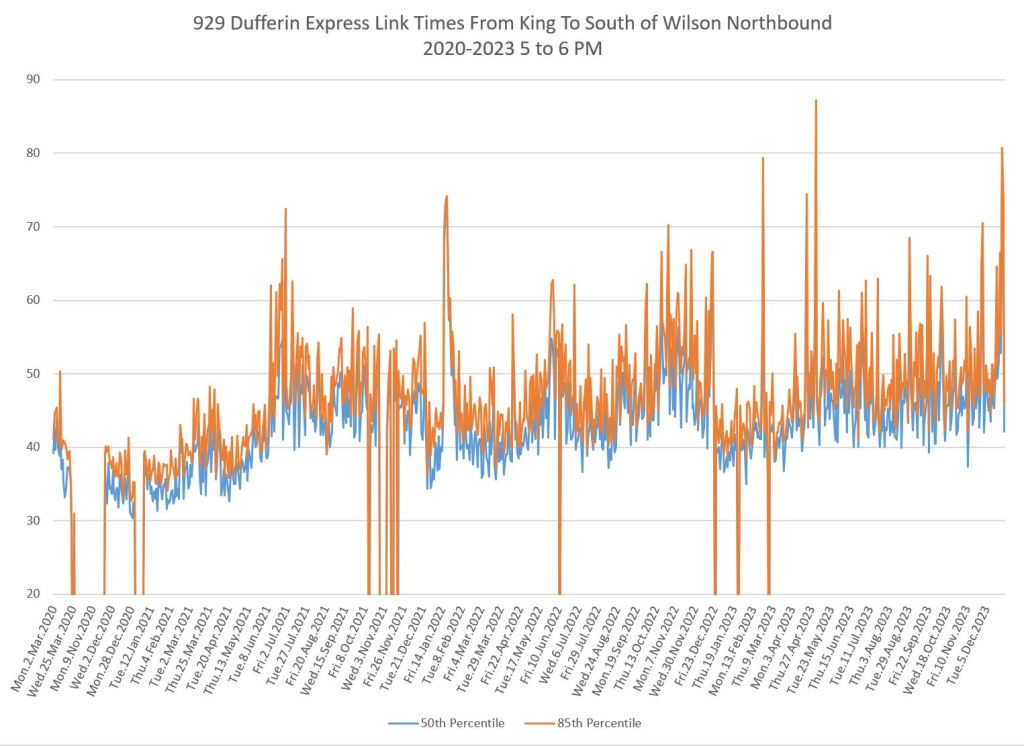
Seasonal drops at the end of December are evident for most times and directions.
Note that the 85th percentile (orange) sits close by and follows the median (50th percentile, blue) fairly closely in the AM peak. This is typical of most routes where operating conditions in the morning produce fewer service disruptions than later in the day.
By the afternoon peak, the 85th percentile is often much higher, and travel times are less consistent, and this problem is worst in the peak direction, northbound.
Express Service
As with the local service, the 85th percentile pulls upward on early afternoon and PM peak services. Also in the PM peak, travel times are gradually rising.
Service was dropped during the early part of the pandemic, but was restored in late November 2020.

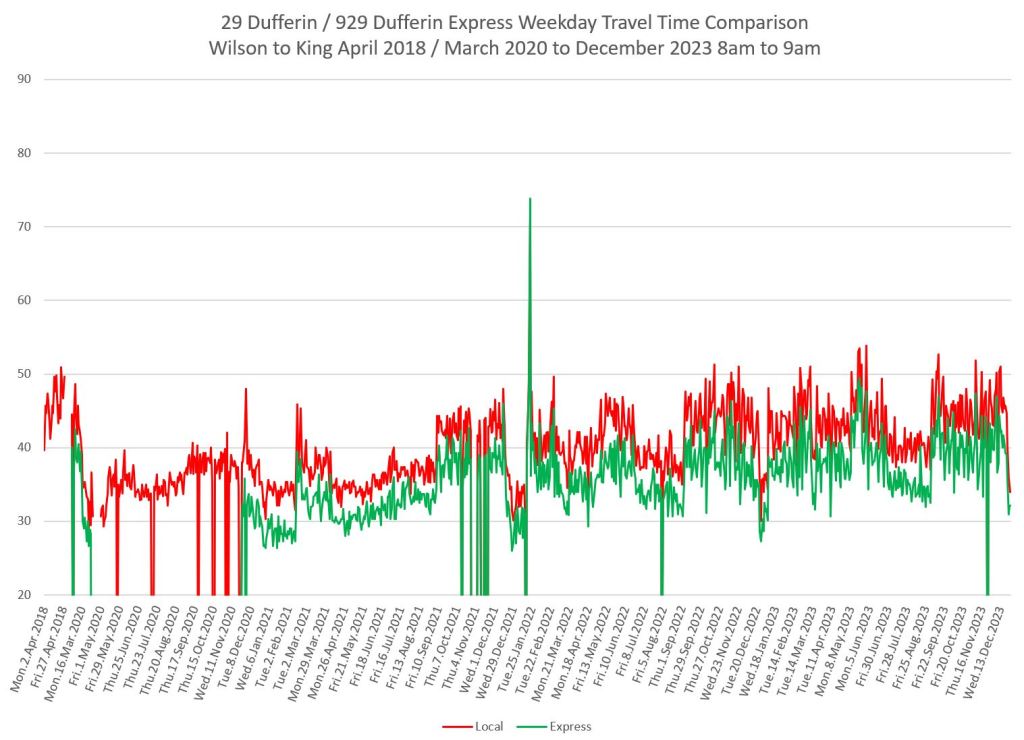
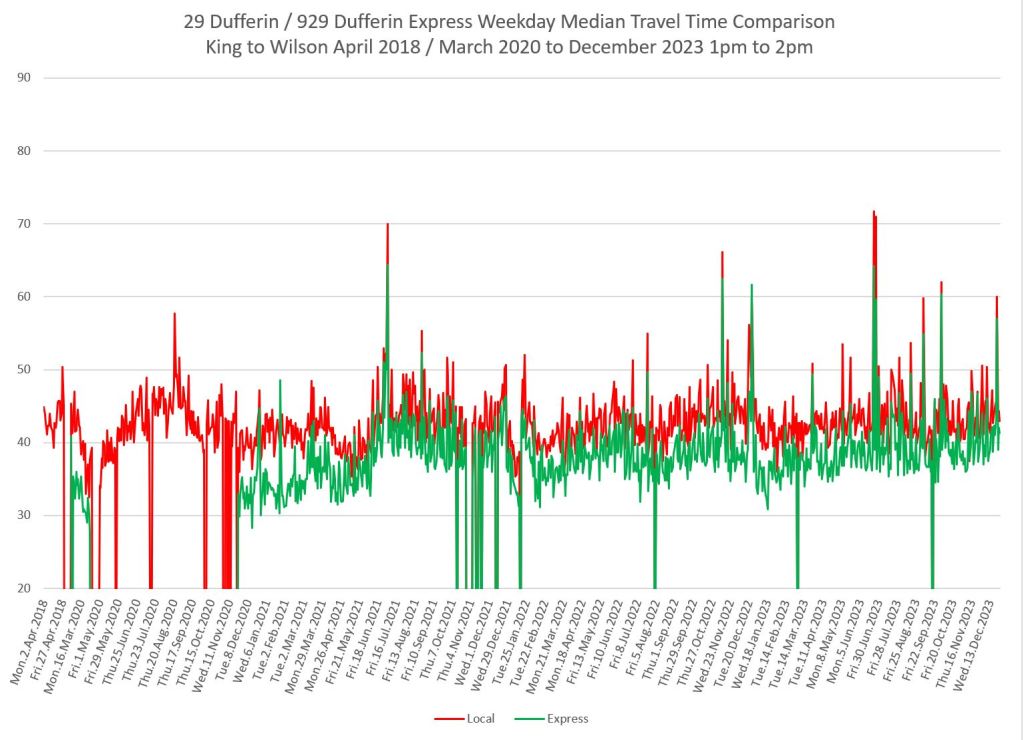
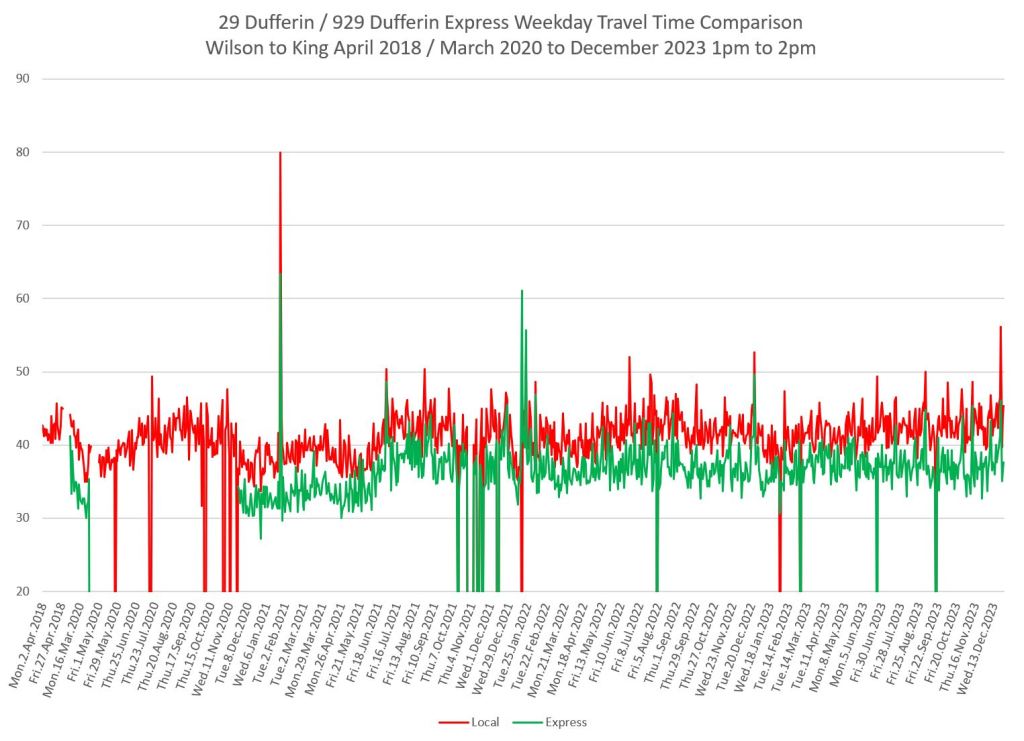
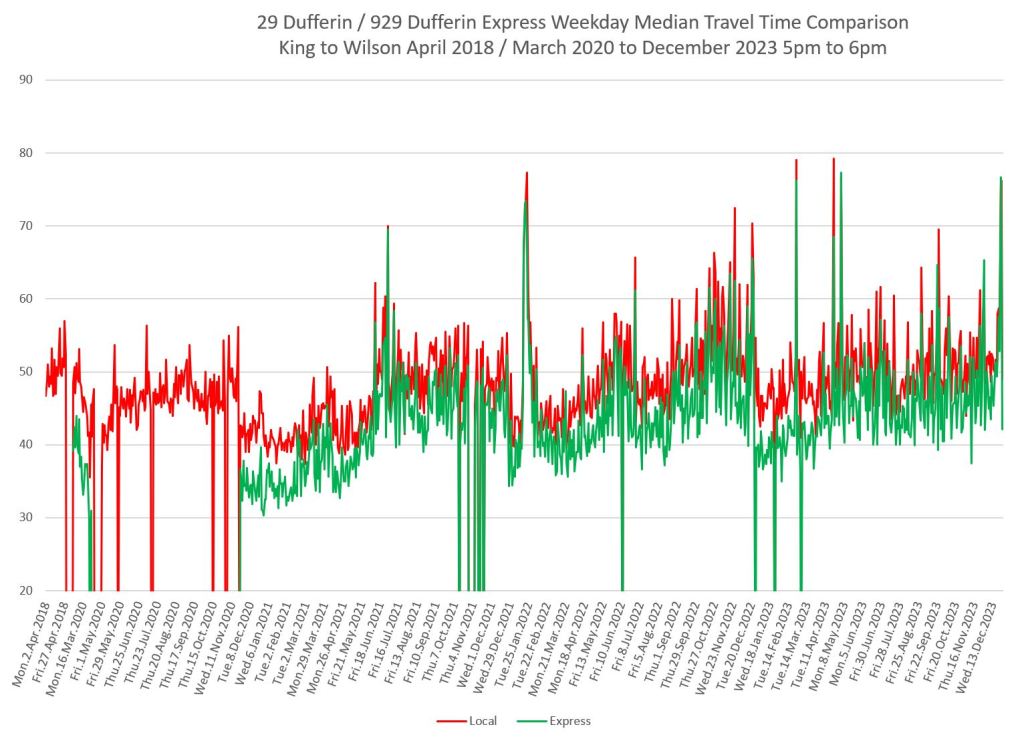
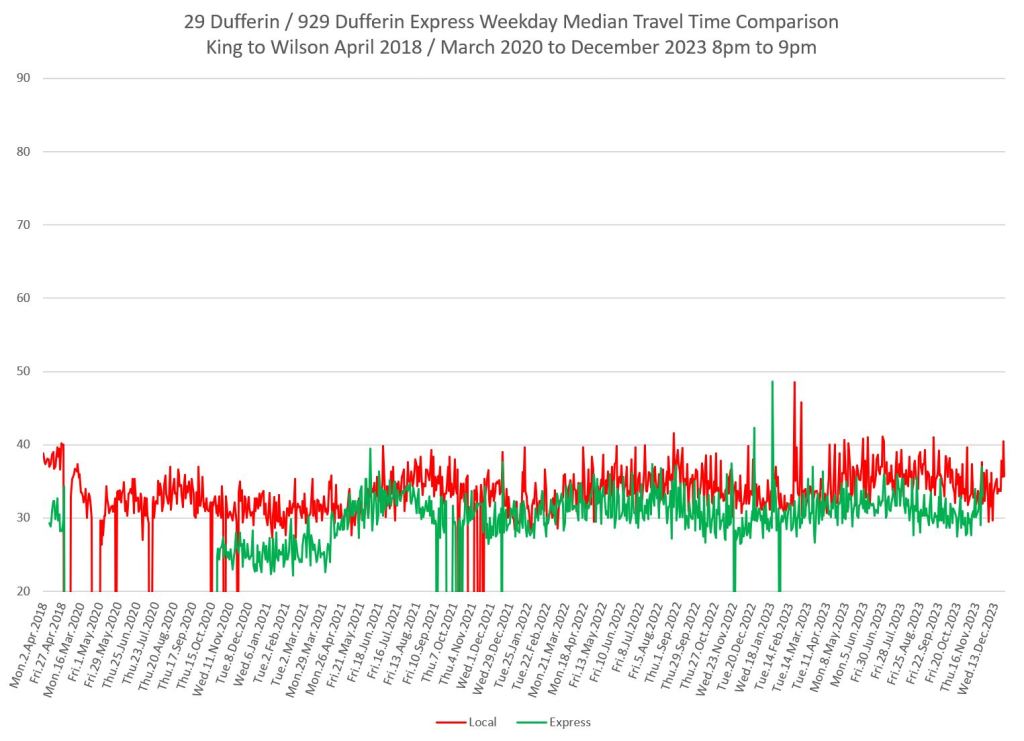
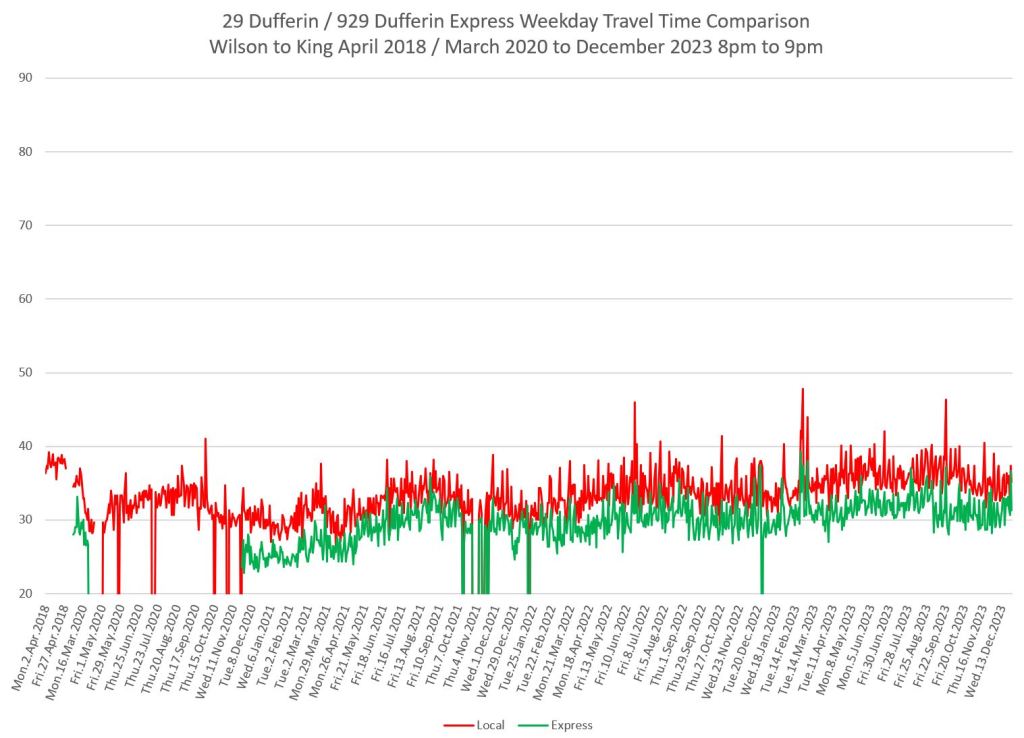
Difference Between Local and Express
In these charts the local bus times are in red, and the express buses are in green.
In all charts, there is a bump in the travel times for express buses at the start of April 2021 which reduces their speed advantage over the locals. The change in service design was that articulated 18m buses replaced the 12m standard buses on a 1:1 basis.
The difference between the two services stays fairly constant except for that change. Note that the spread between local and express buses is best in the AM peak southbound.
Dufferin at Yorkdale Mall
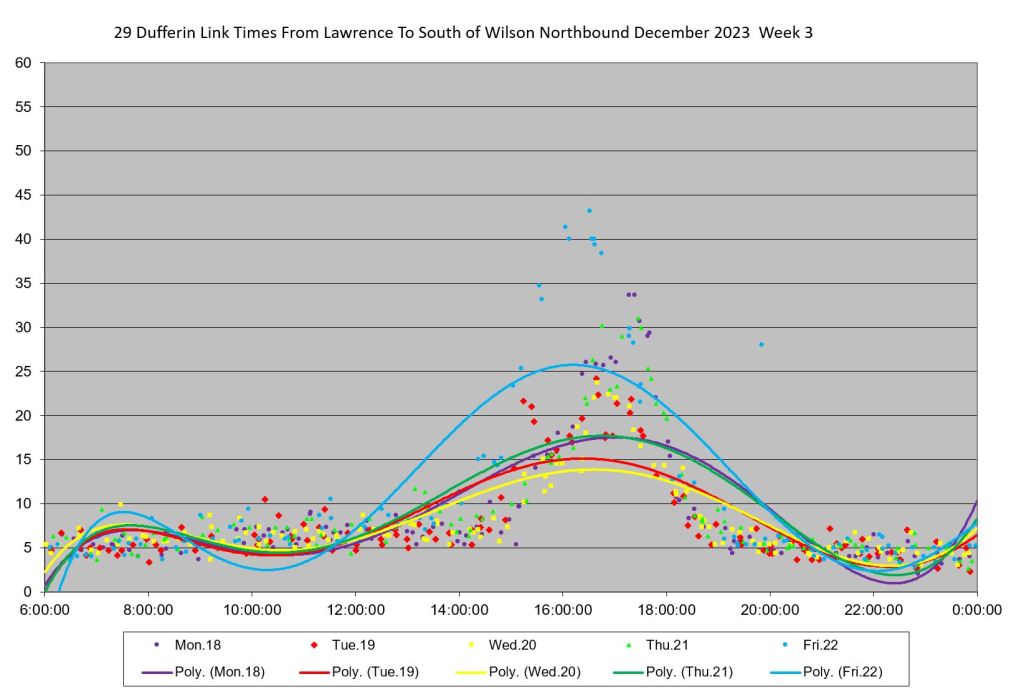
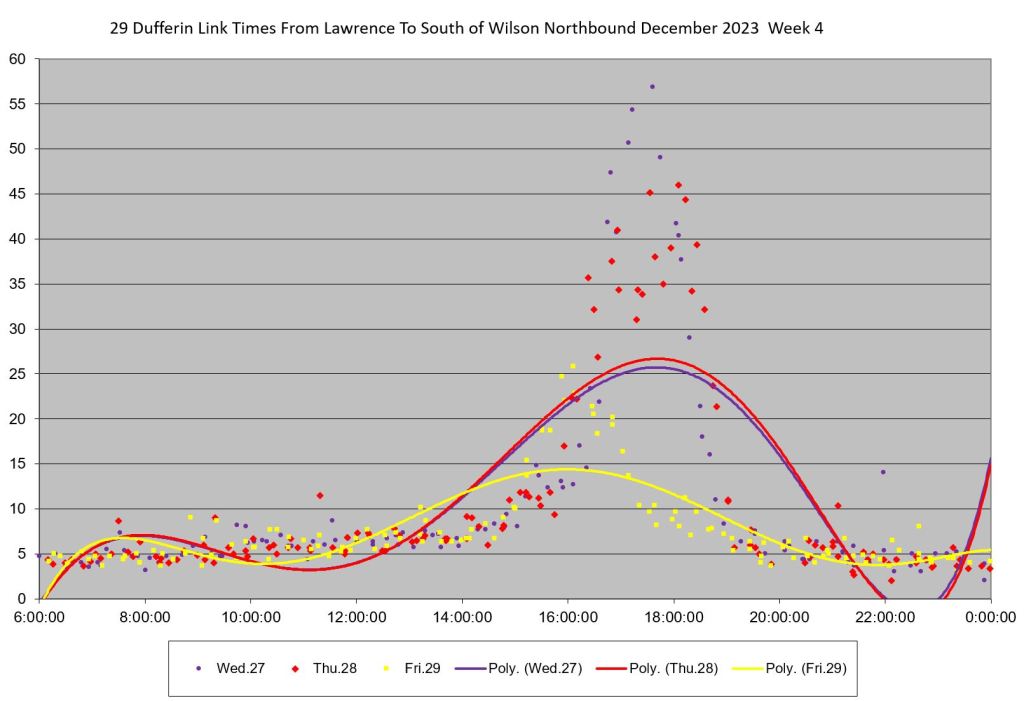
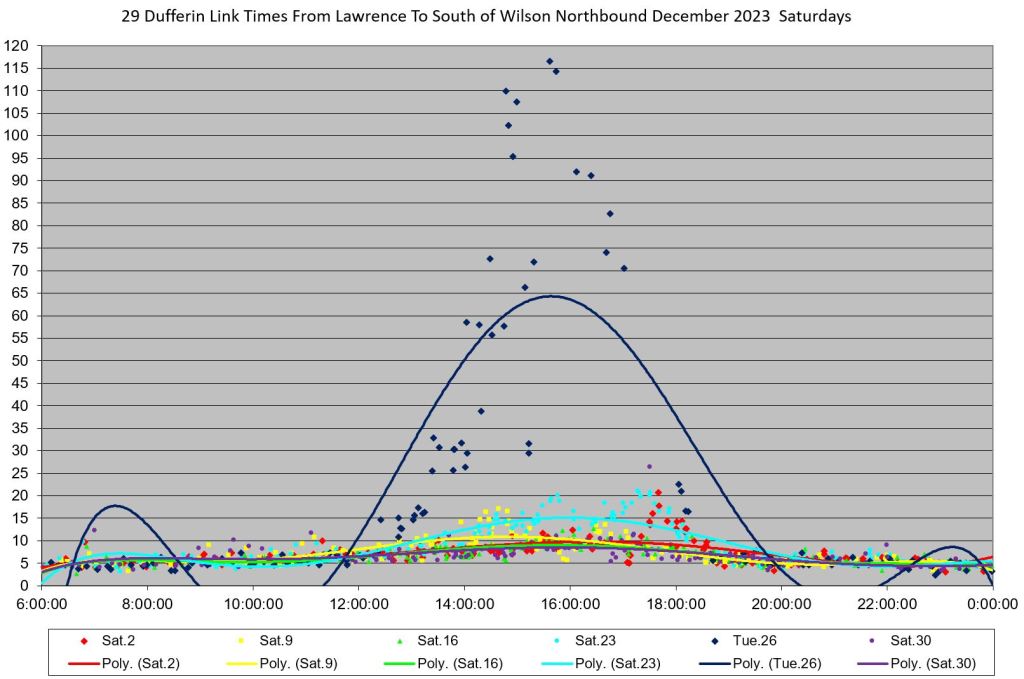
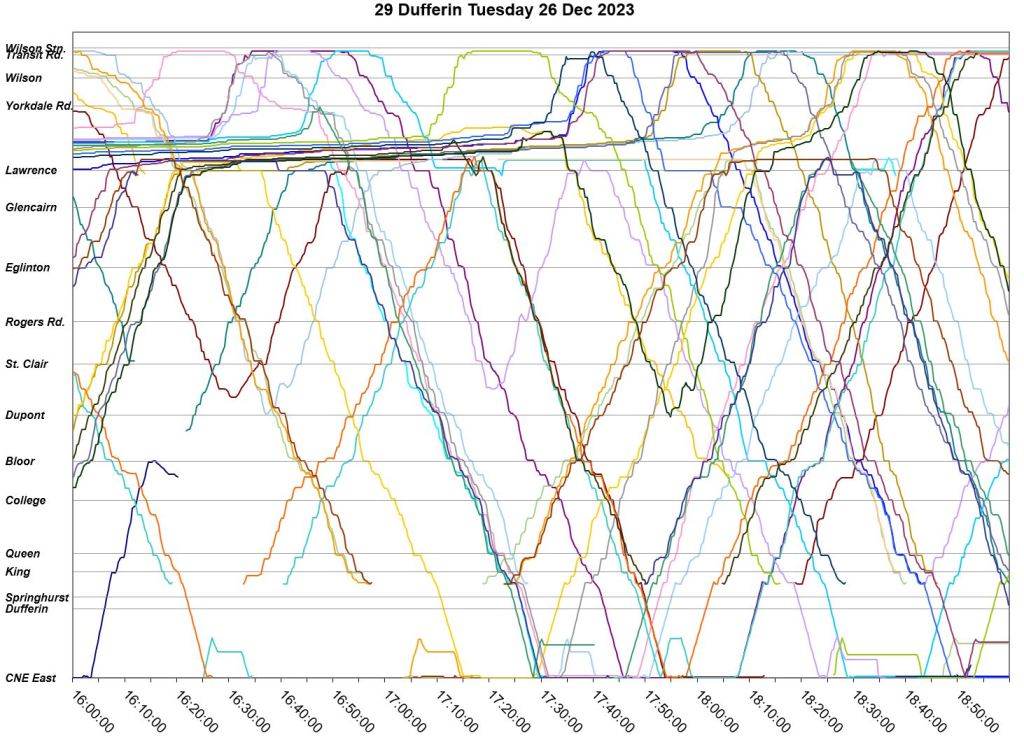
No discussion of 29 Dufferin would be complete without a nod to Yorkdale Mall. On certain days, traffic congestion there can be quite severe notably in the Christmas season. Here are the weekday and Saturday (Boxing Day is included as an “honourary Saturday”) travel times between Lawrence and Wilson northbound shown in two formats:
- The charts on the left show the individual data points with trend lines interpolated through them. Note that these lines are not averages or medians, but rather a best fit curve.
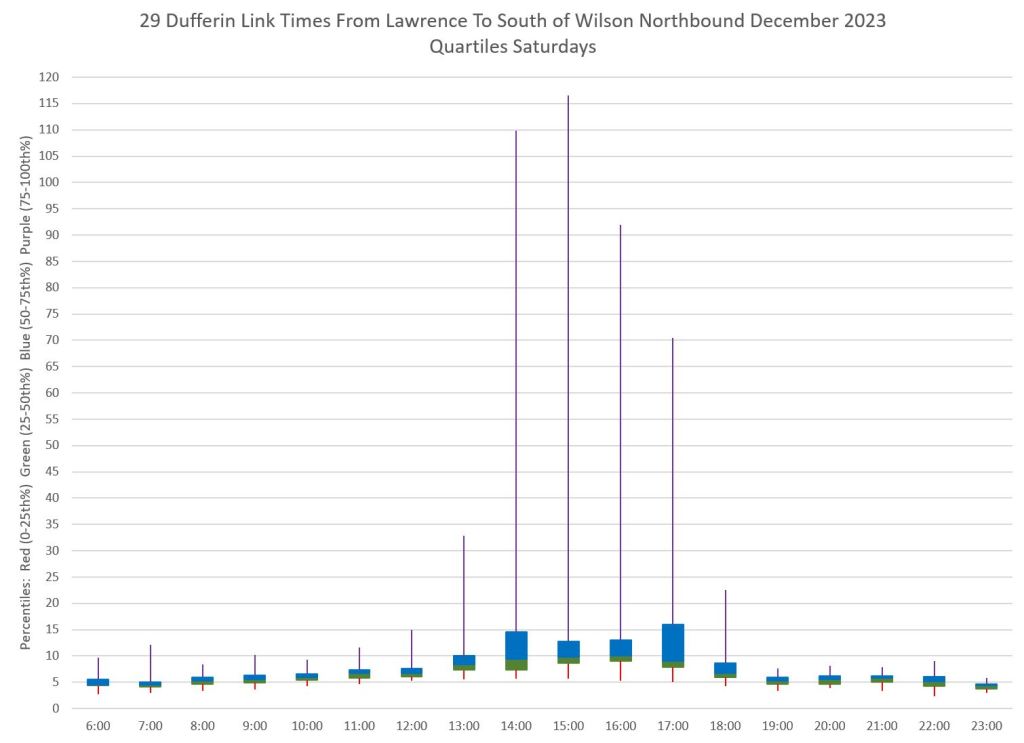
- The charts on the right show hourly values in “block and whisker” format to illustrate the changing range of values by quartile. Ideally, the block in the centre (25th to 75th quartile) should be short, and the whiskers (below 25th, above 75th) should also be short indicating that the outliers are close to the median.
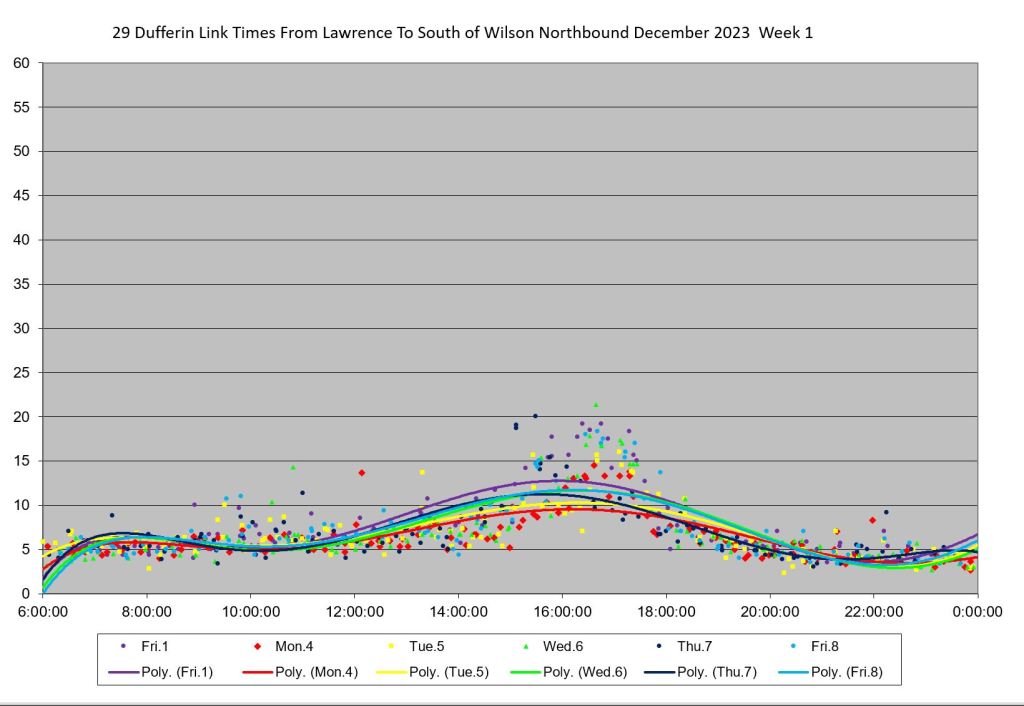
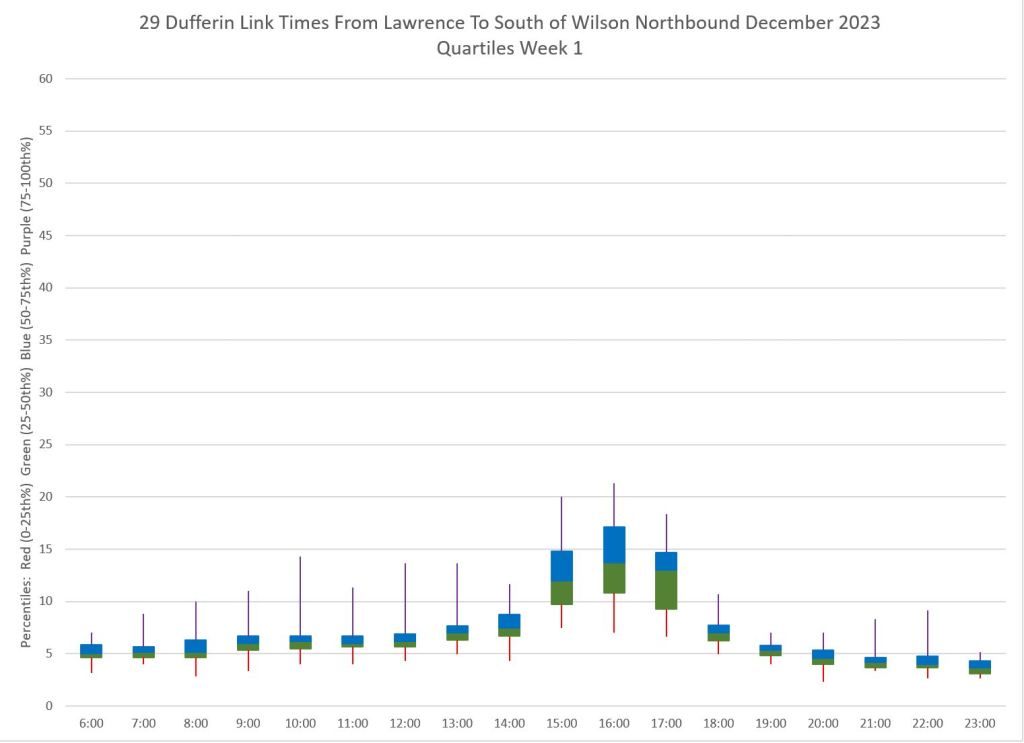


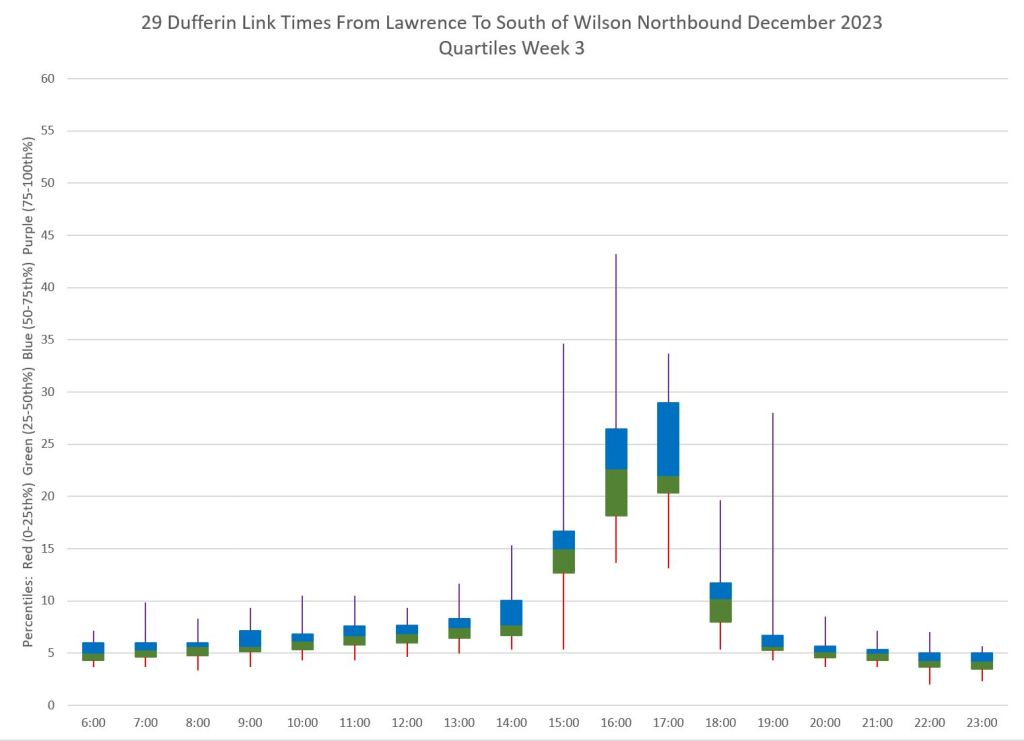
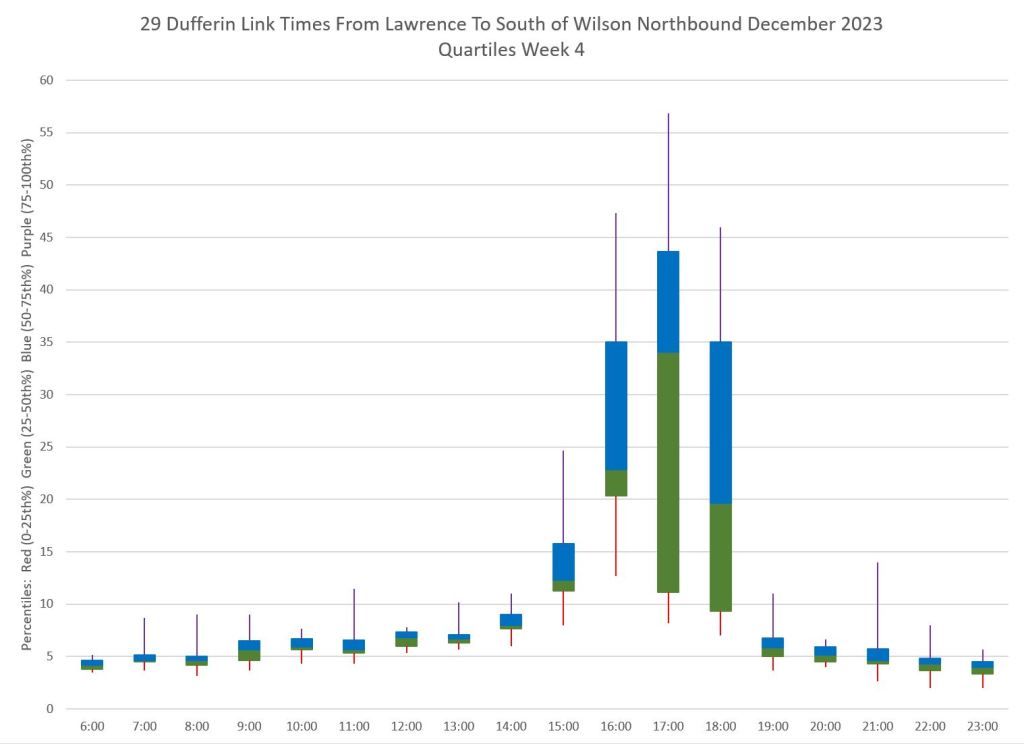
Note that the scale for the “Saturday” chart is double that of the weekday chart so that all of the data points for Boxing Day would fit. Yes, buses were taking almost two hours to travel a few kilometres, and most of that near the mall.
The Saturday/Boxing Day charts are a special case where the scale is set to 120 minutes so that all of the data will fit. Yes, some buses took almost two hours to cover this distance.
This chart also illustrates the problem of working only with averages or medians. On the right, the central blocks are small because the data includes all Saturdays, and the better-behaved service for five of them dominates the unusual Boxing Day data. Only when one looks at the outliers is the problem immediately obvious.
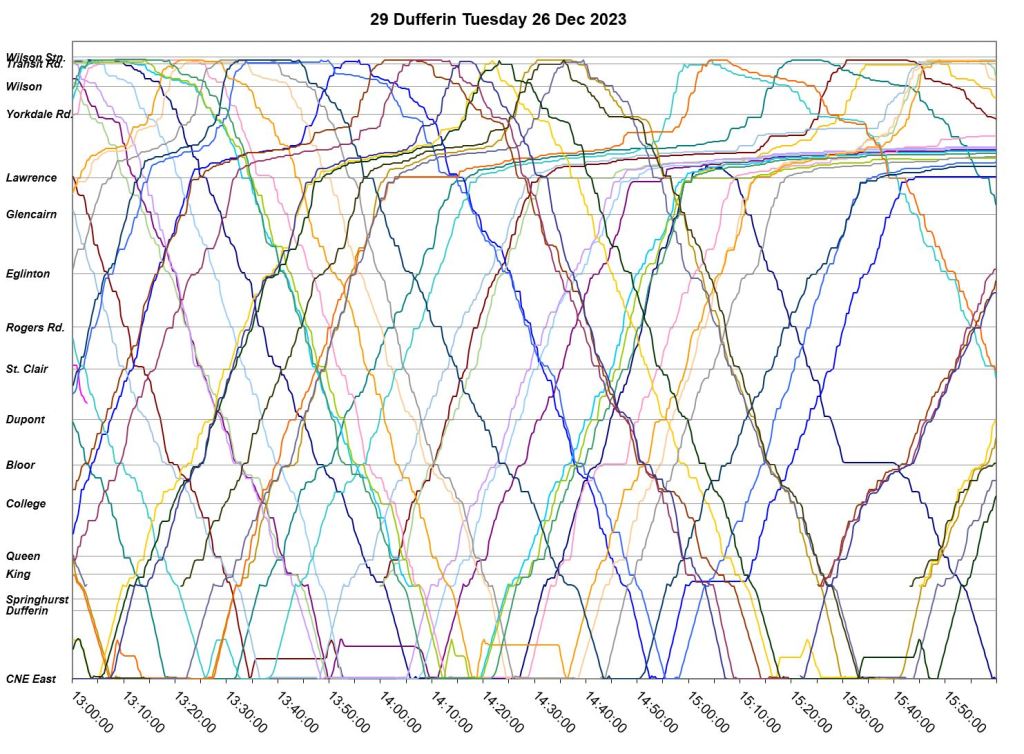
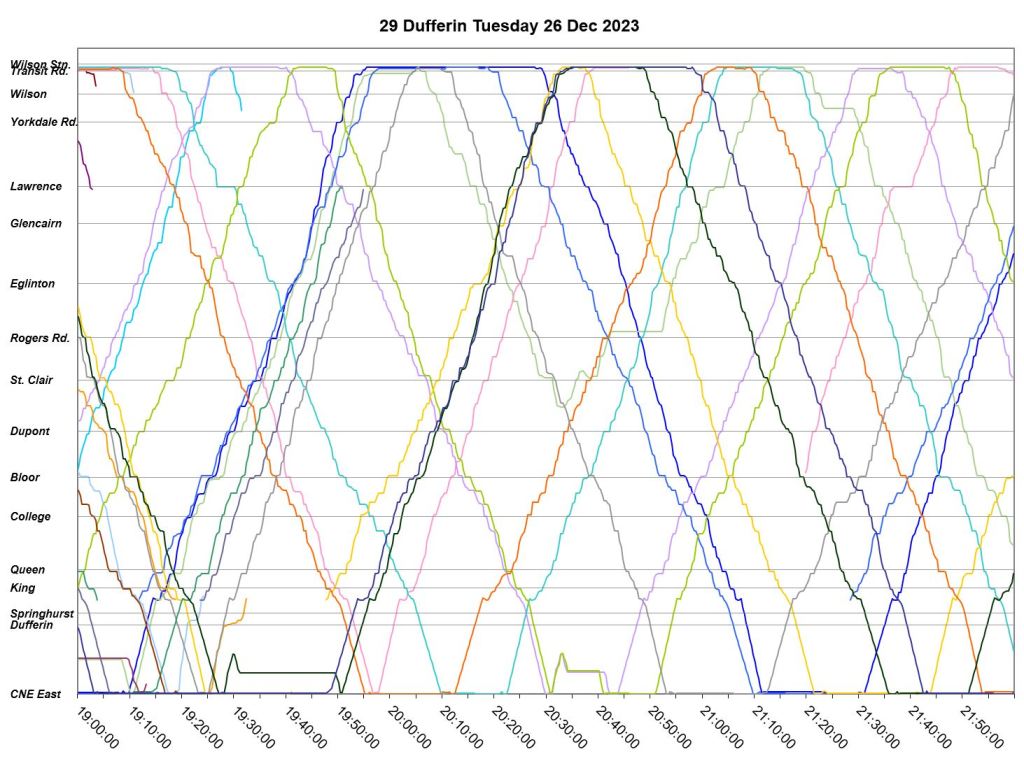
The service chart for Boxing Day shows just how appallingly bad the congestion was. In the early afternoon, the service is reasonably well spaced, although a few buses are running in pairs. However, as more and more buses are trapped at Yorkdale, service on the rest of the route disintegrates with many short turns, wide gaps and bunching of what service does appear. The situation is not resolved until after 8pm when regularly spaced buses dominate the chart again.
This happens every year (pandemic years excepted).
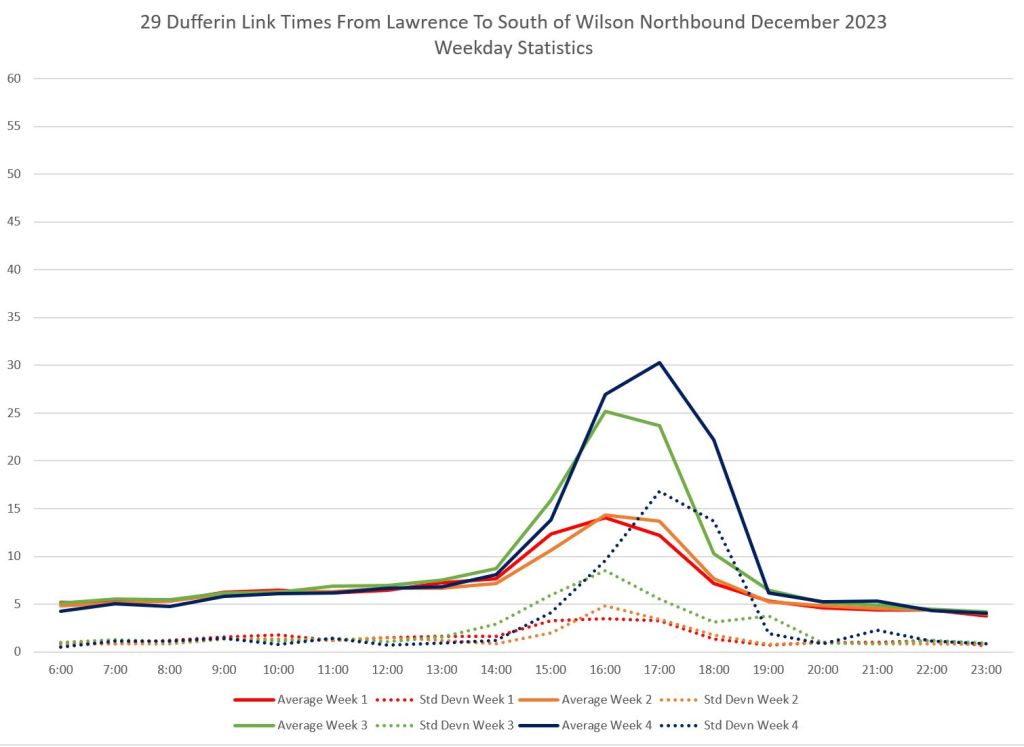
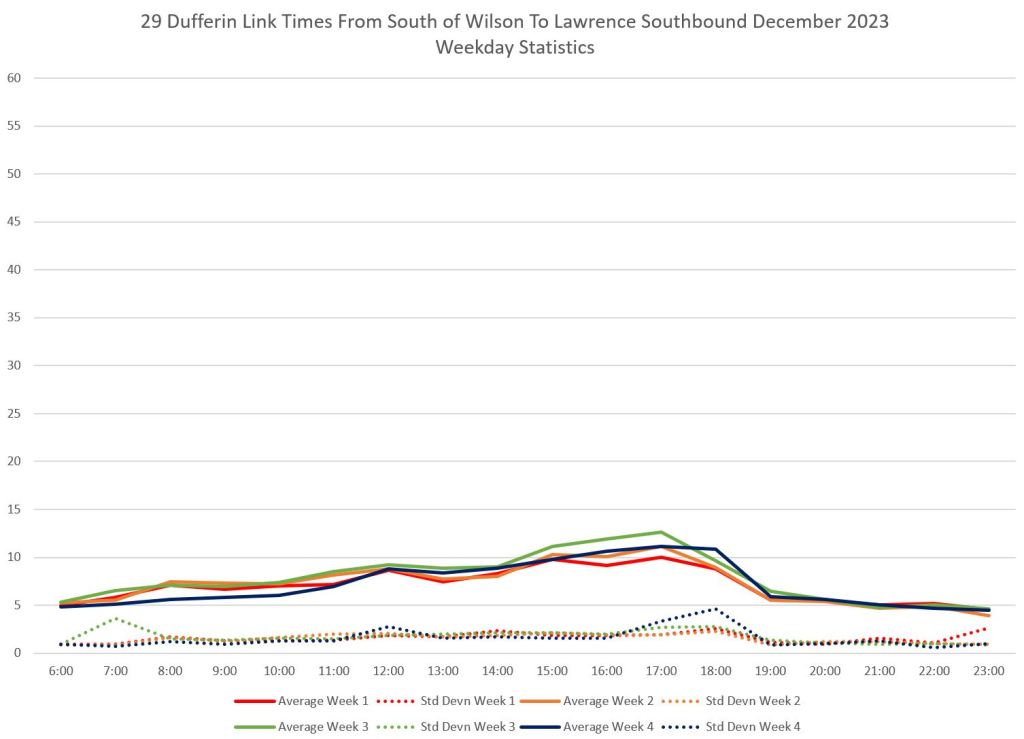
This problem occurs on weekdays with heavy shopping days affecting traffic, although not as badly as on the 26th, and it is almost entirely northbound. The difference is obvious in the charts of averages and standard deviations of weekday travel times.
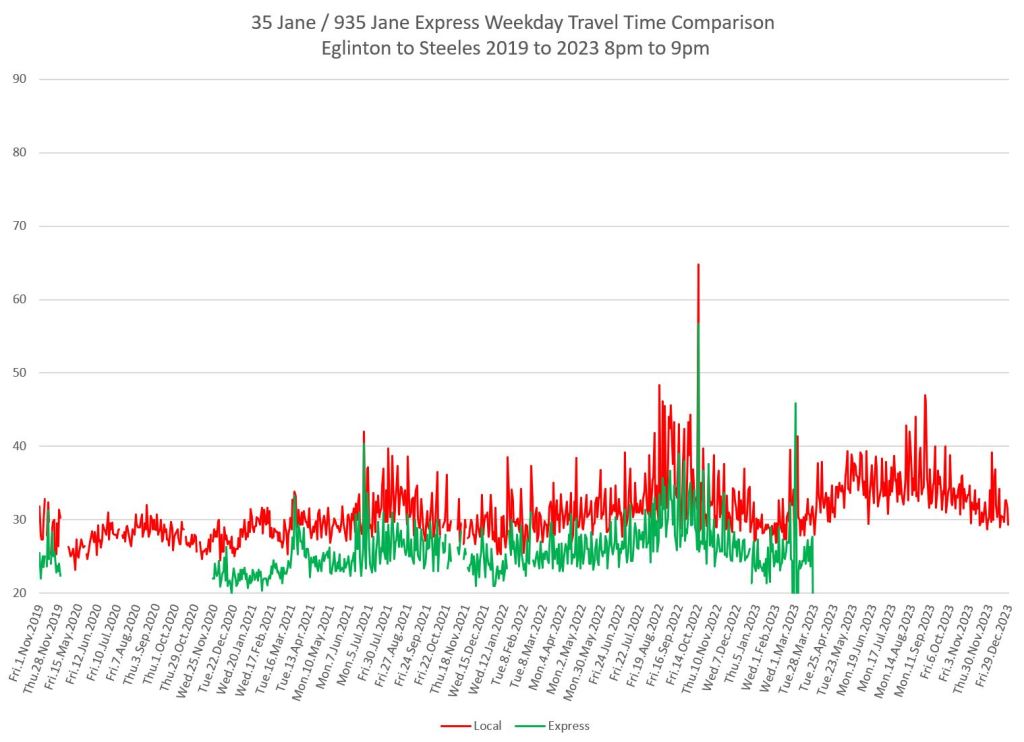
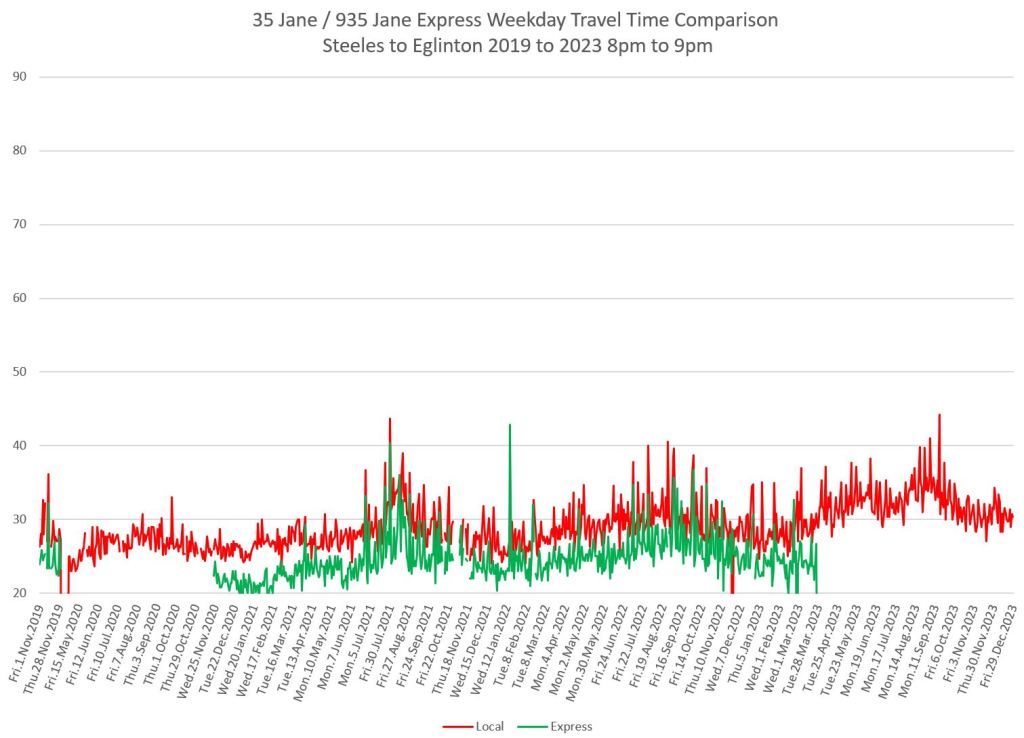
35/935 Jane
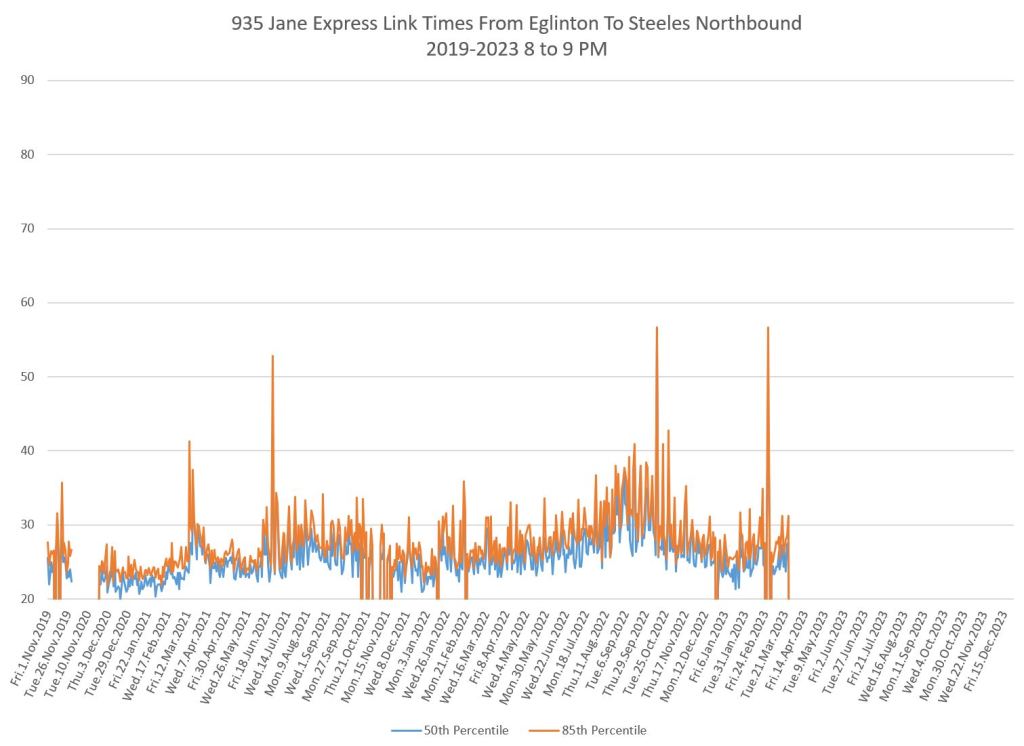
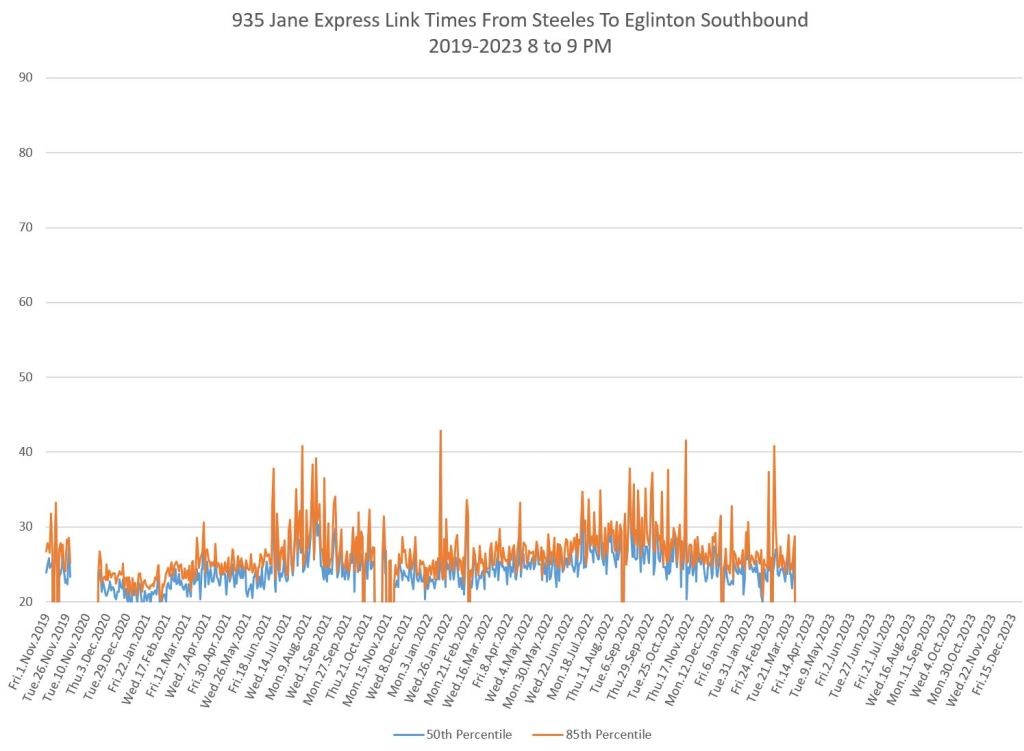
Local Service
Of the four periods shown here, the evening service shows the tightest clustering of median and 85th percentile values over past years. Despite falls corresponding to specific events, these times have risen gradually to 2023, and the spread in values is growing particularly for the PM peak


Express Service
Travel times on the express service mirror the local service with more erratic times in the PM peak.

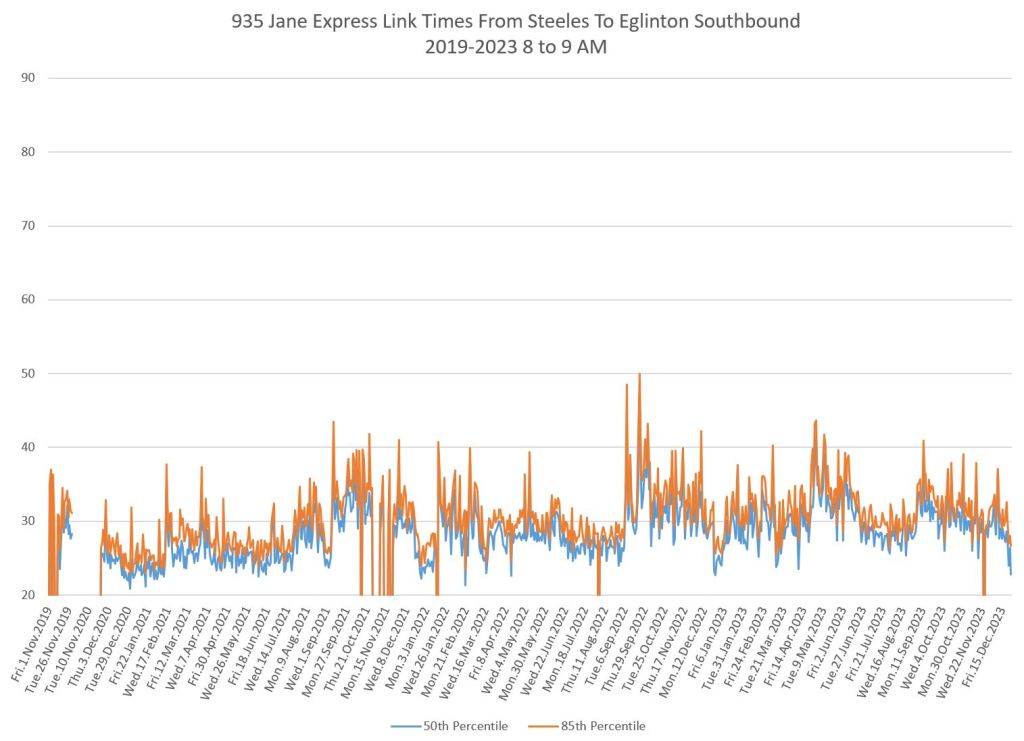

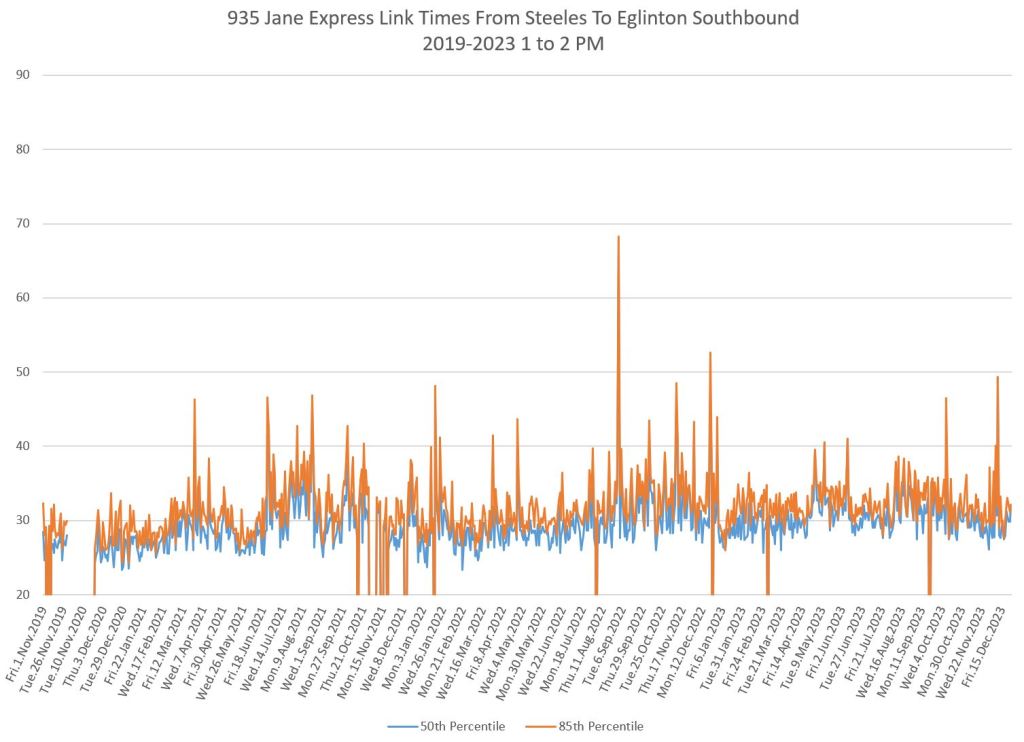
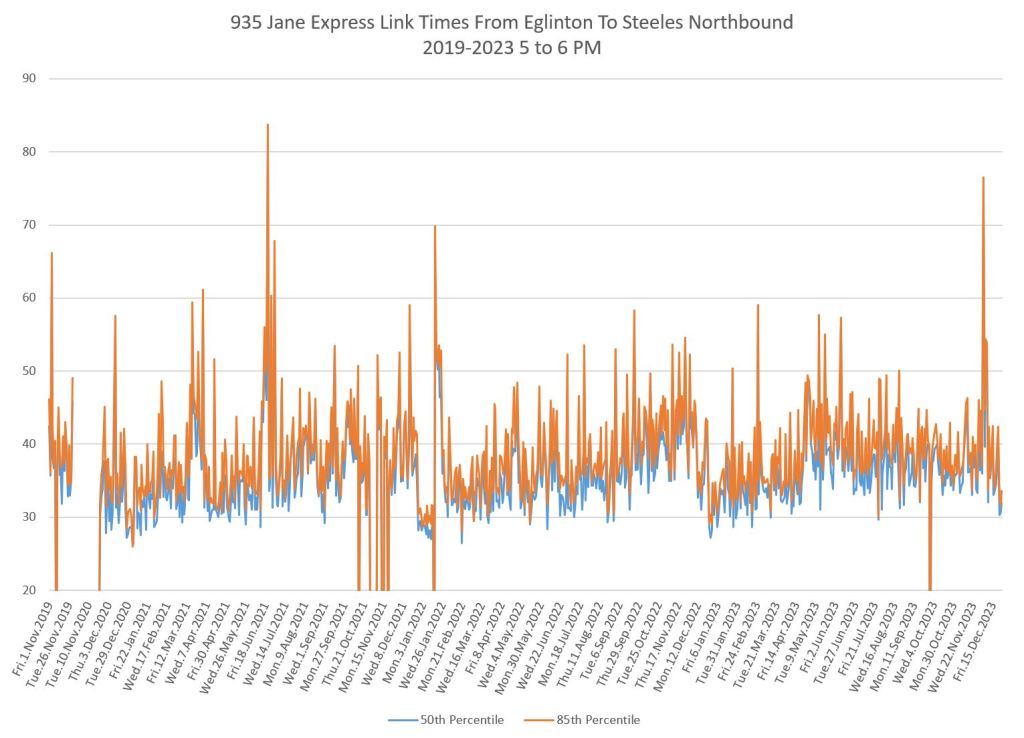
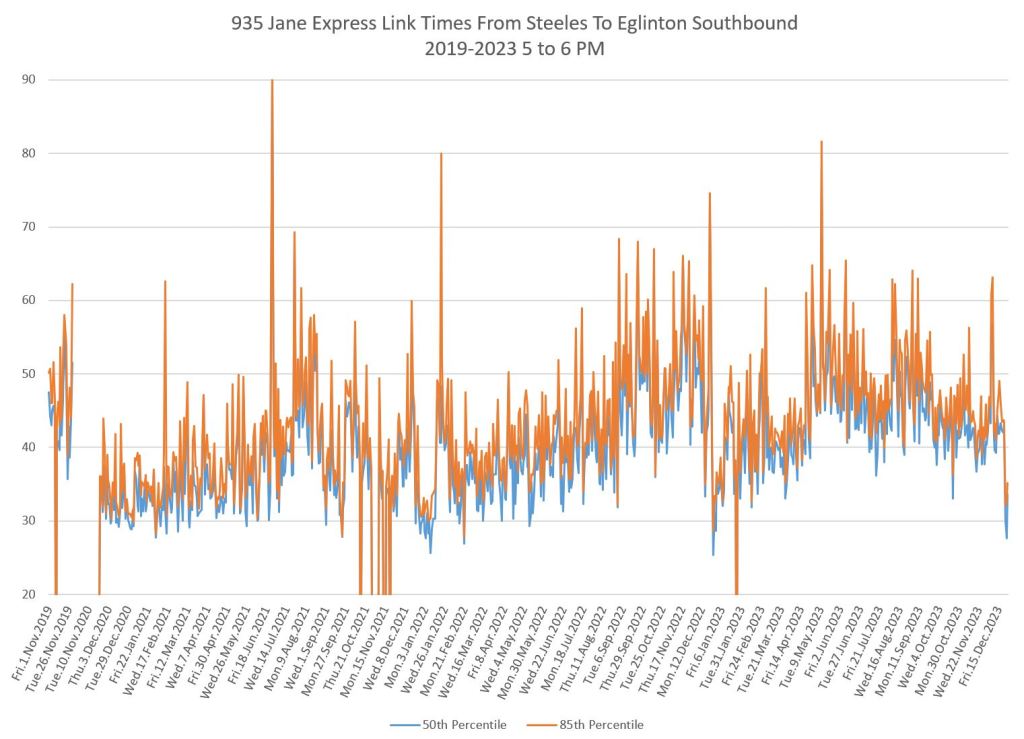
Note that service on the 935 Jane Express was dropped in the early part of the pandemic, but was restored late in the same year. Evening service was discontinued at the end of March 2023.
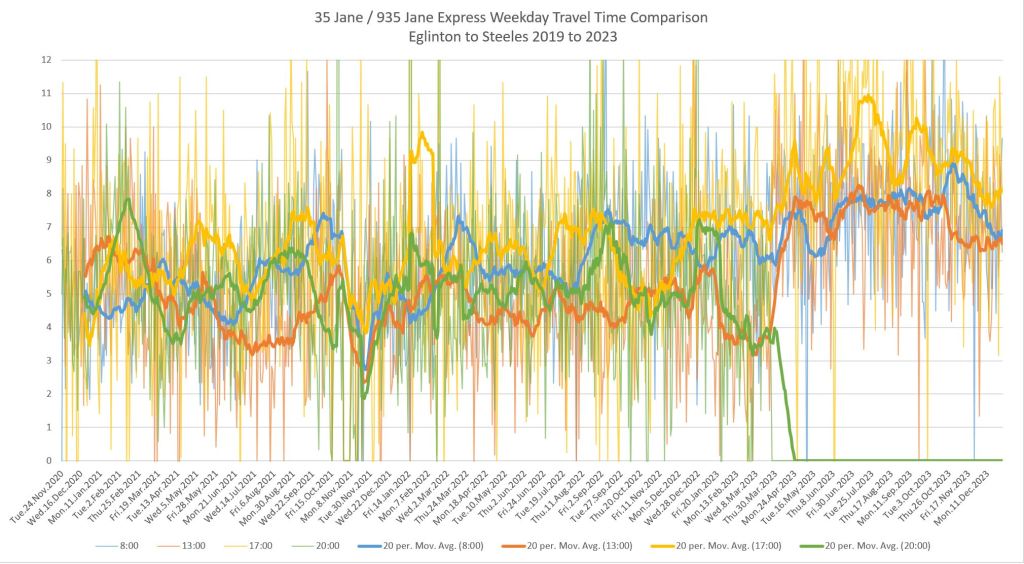
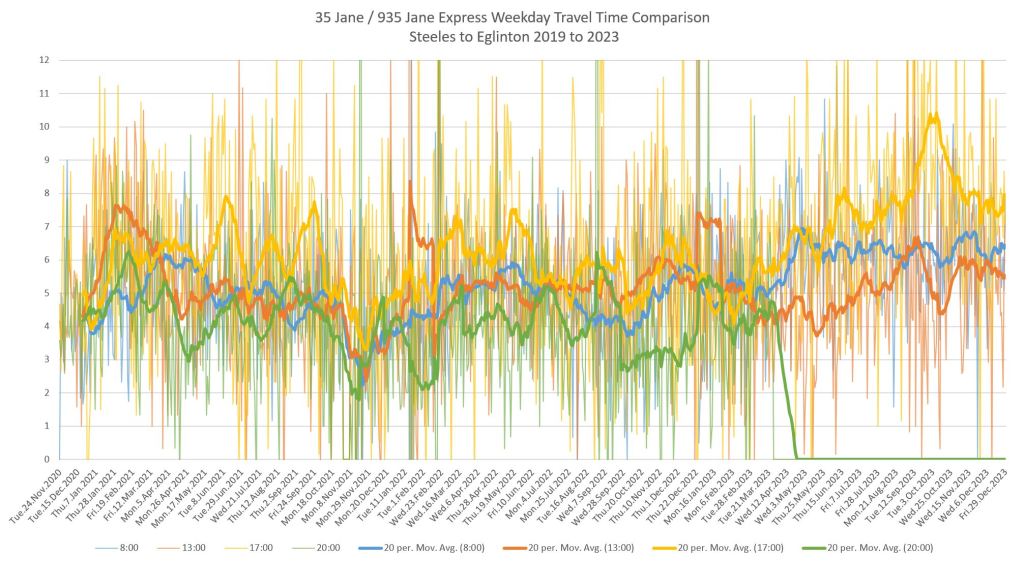
Difference Between Local and Express
Both the local and express branches suffer from irregular travel times.
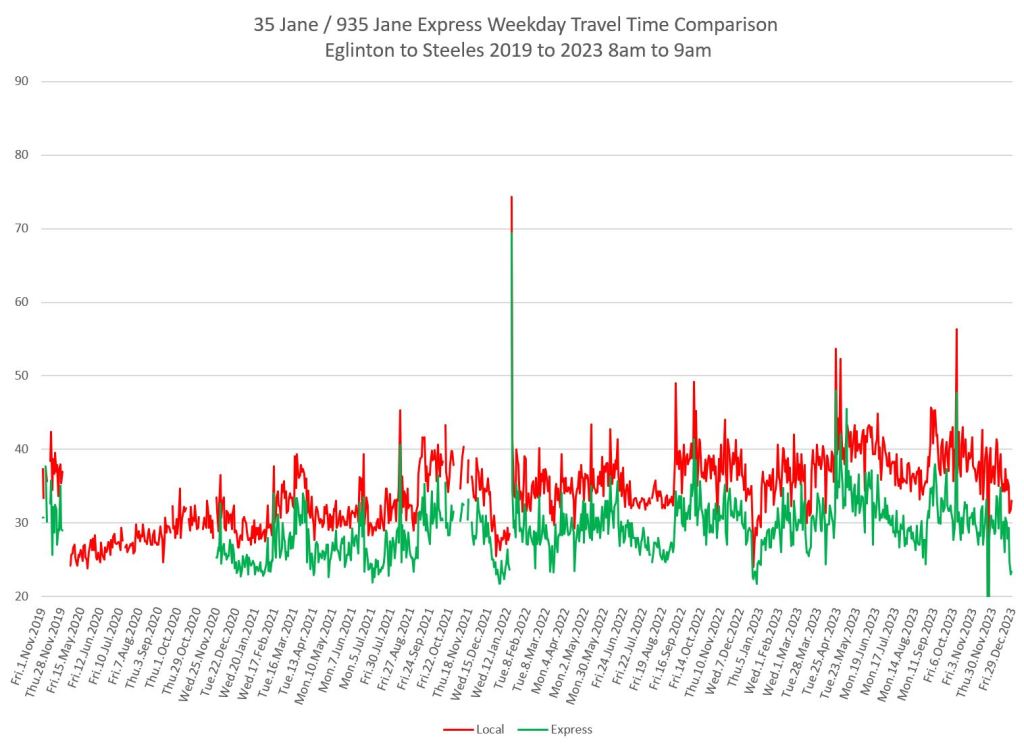
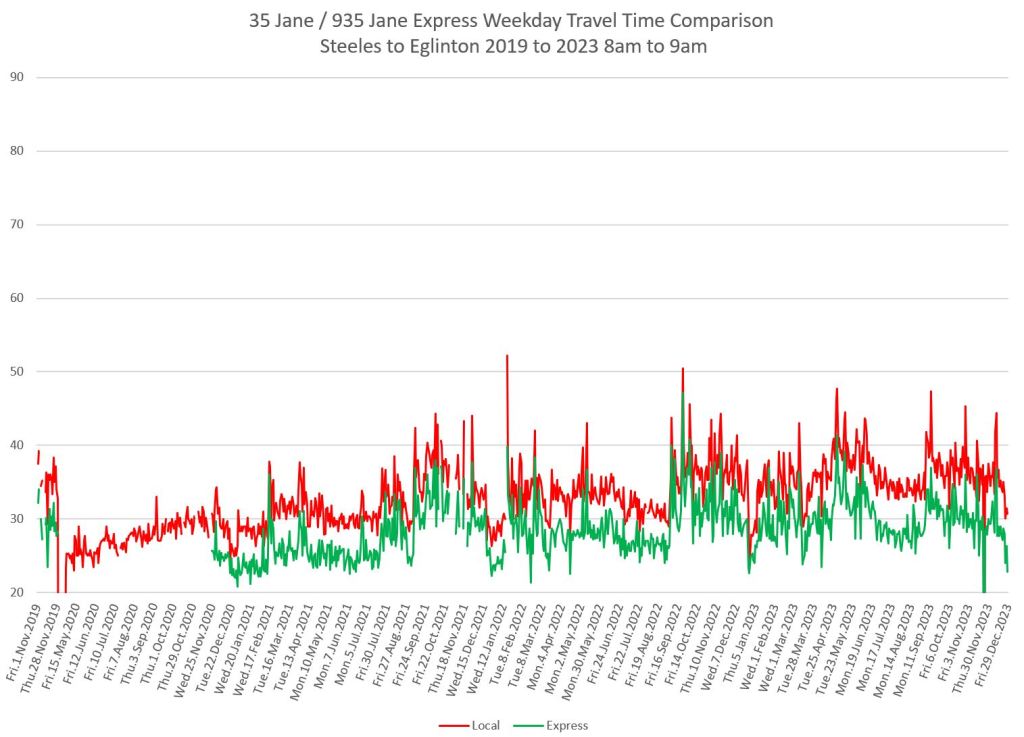
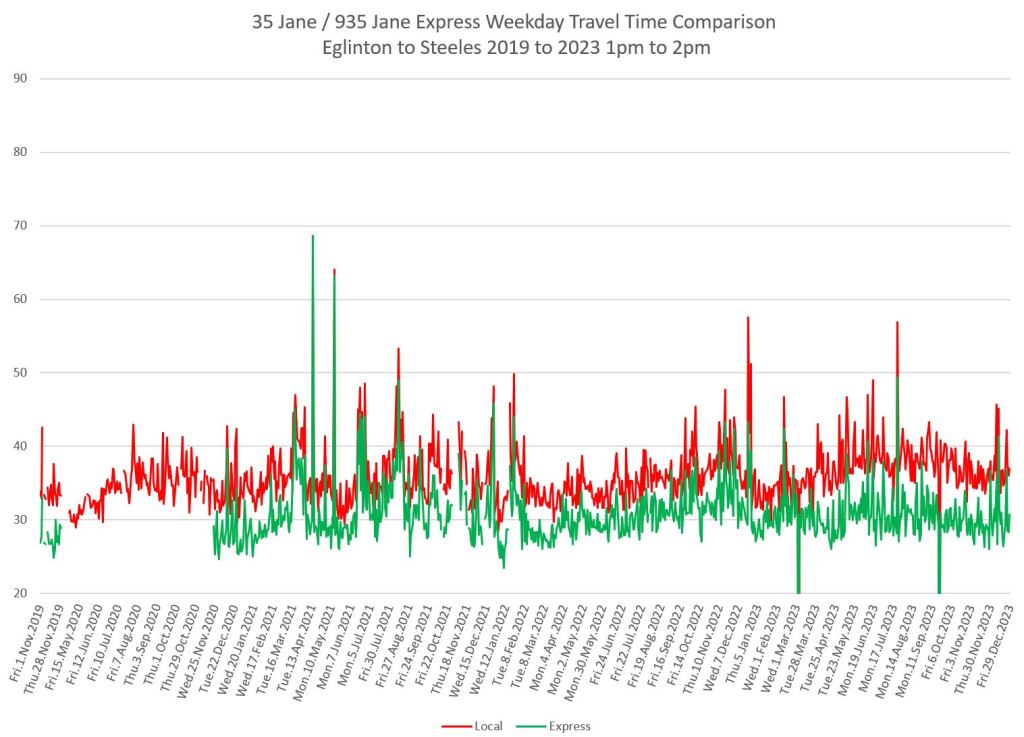
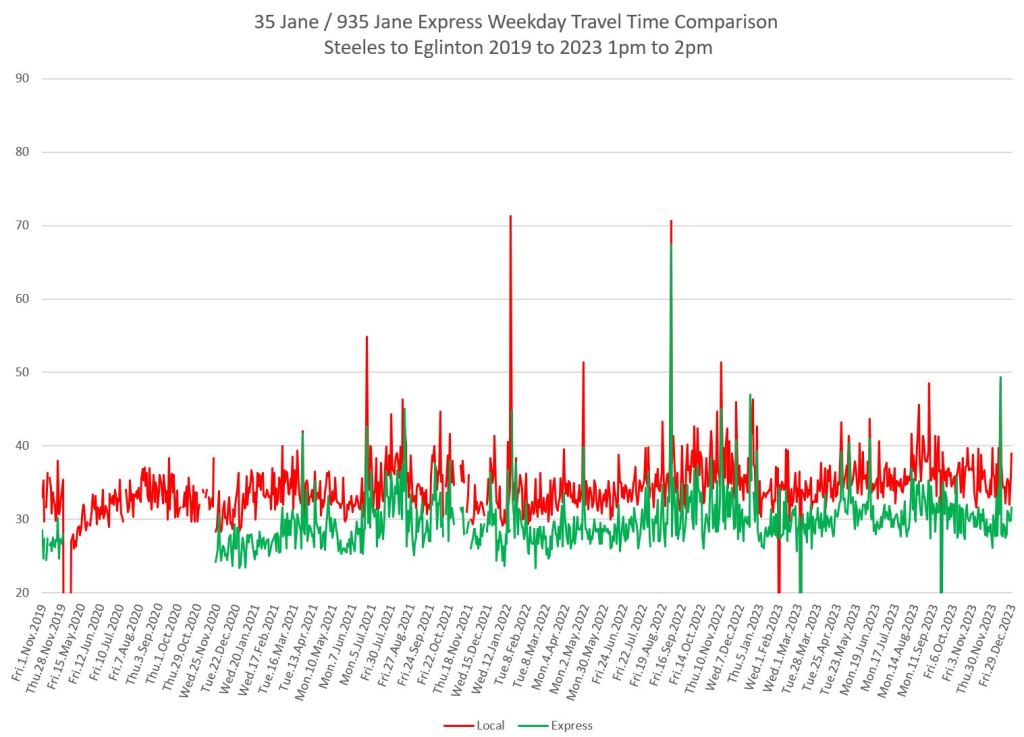
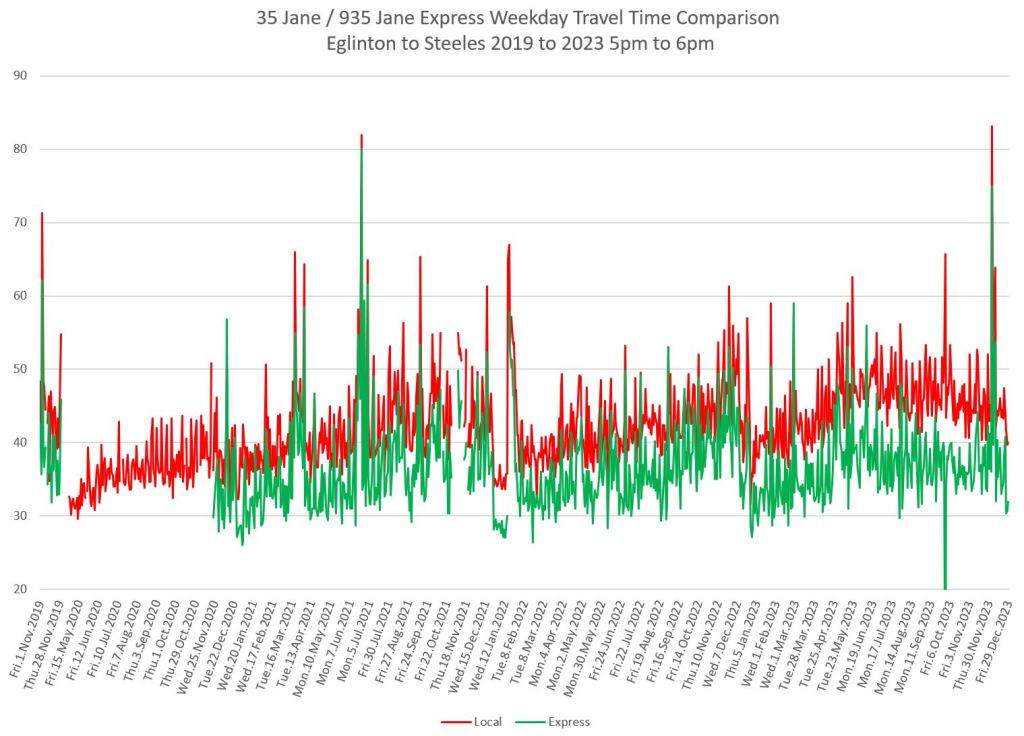
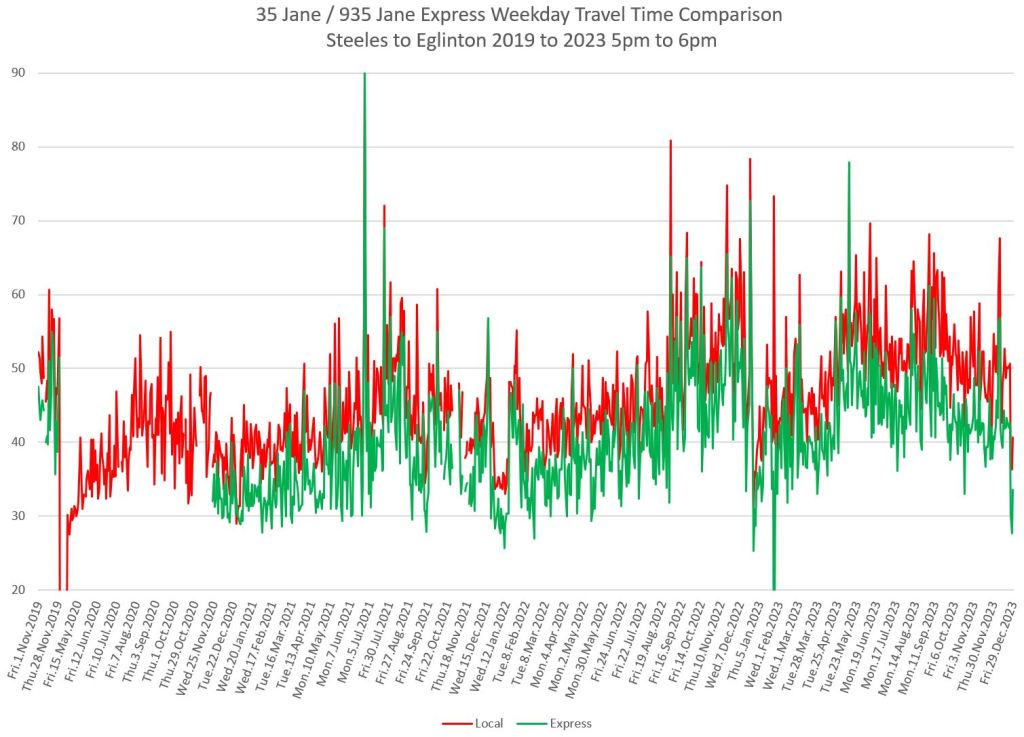
The medians run about 5 minutes apart but this varies through the day. The charts below show moving averages of the difference between local and express travel times by time of day with some of the highest values in the PM peak.
Note how “spiky” the underlying data values are. This shows how averages (the thick lines) do not reflect the scale of day-by-day rider experience.
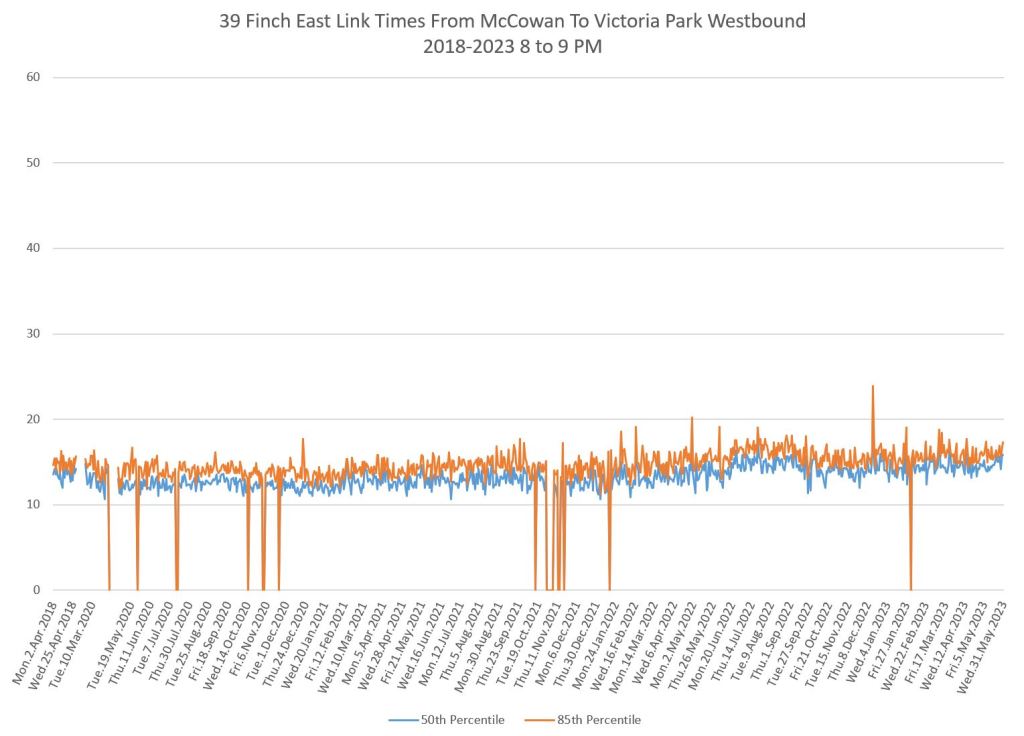
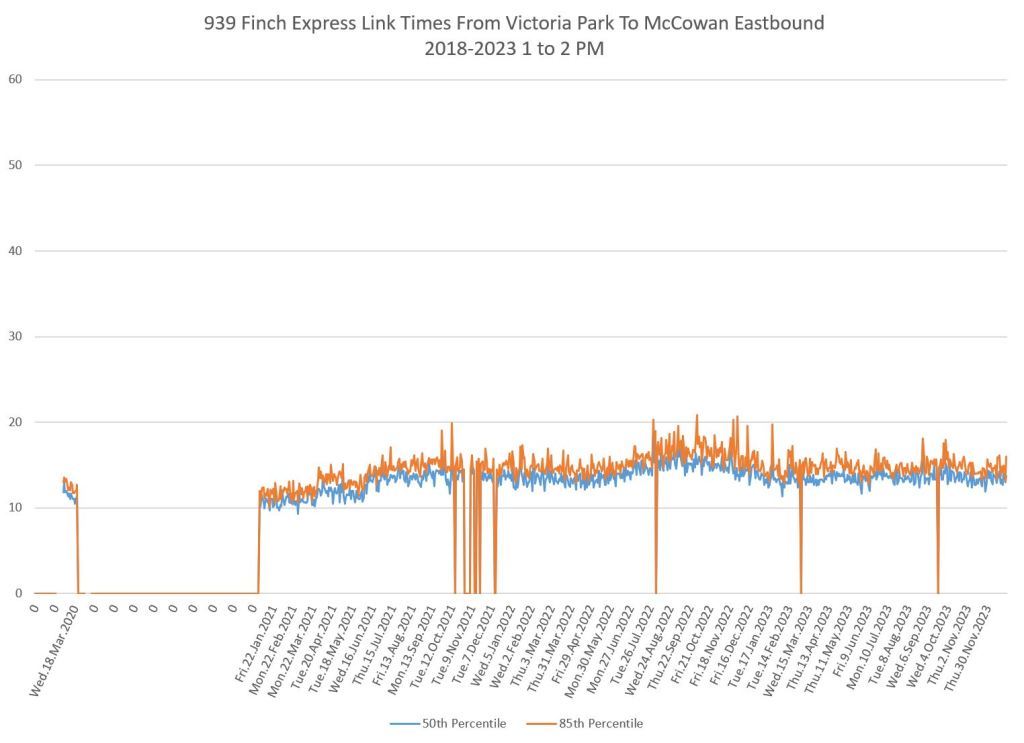
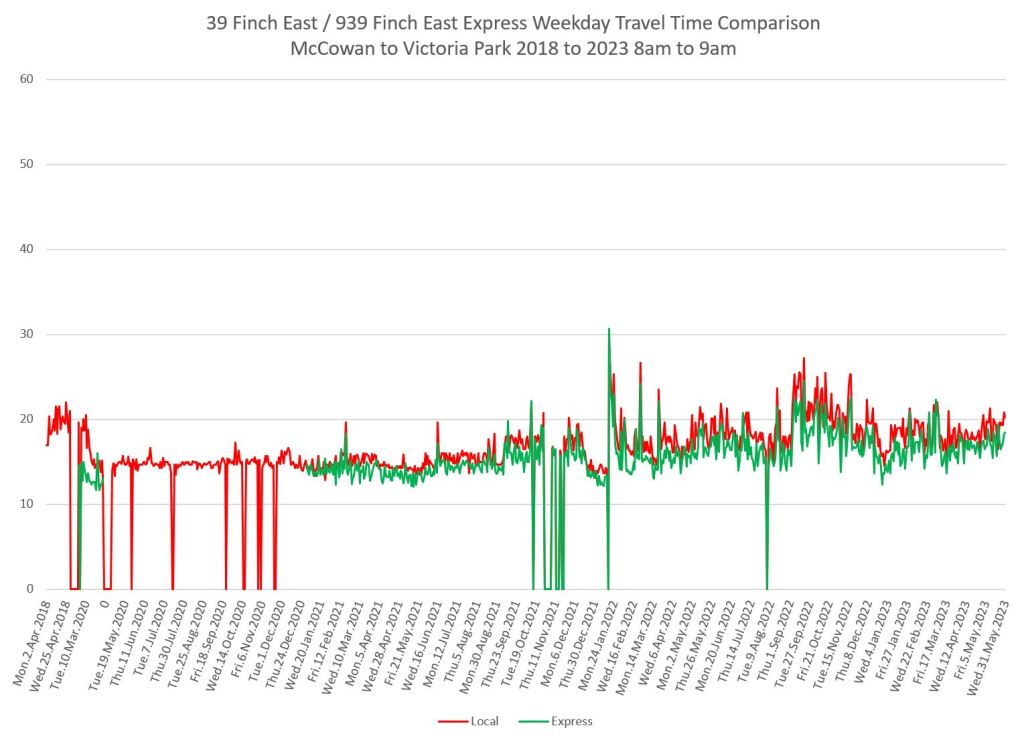
39/939 Finch East
A longer section of Finch East was once touted for RapidTO treatment, but the current work will look only at the segment between Victoria Park and McCowan.
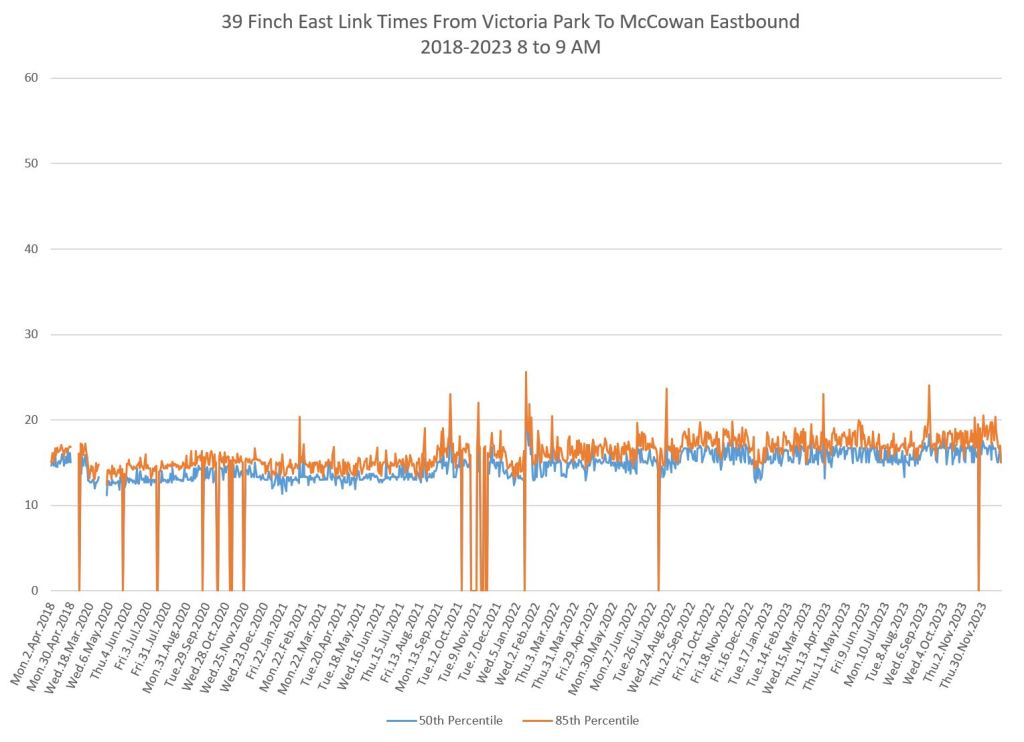
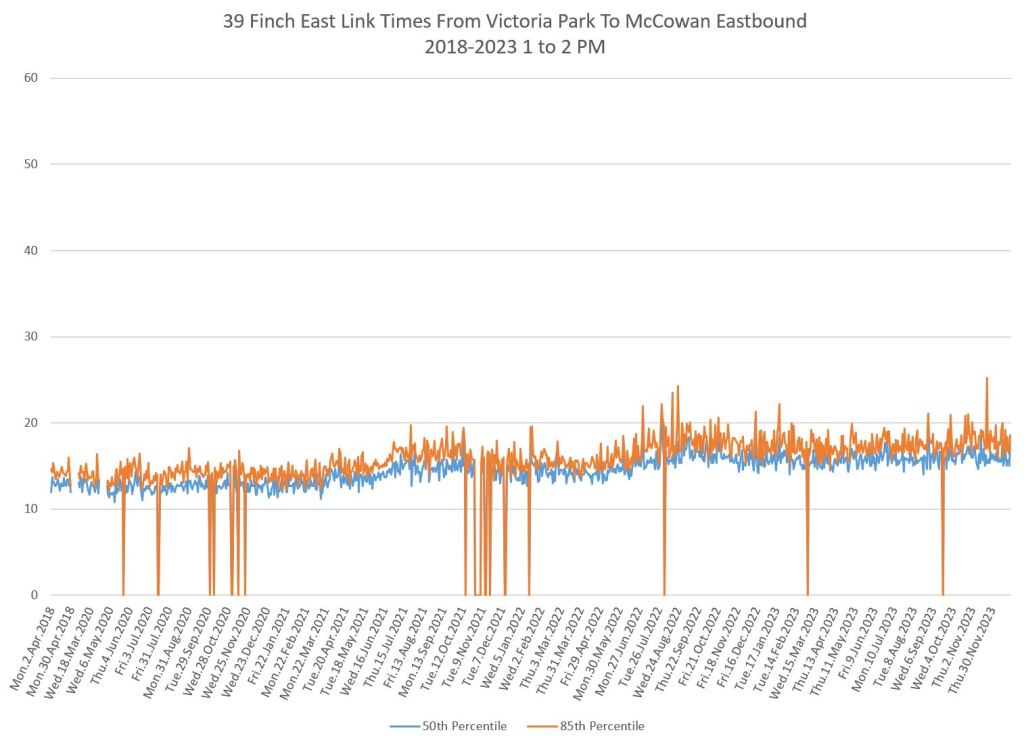
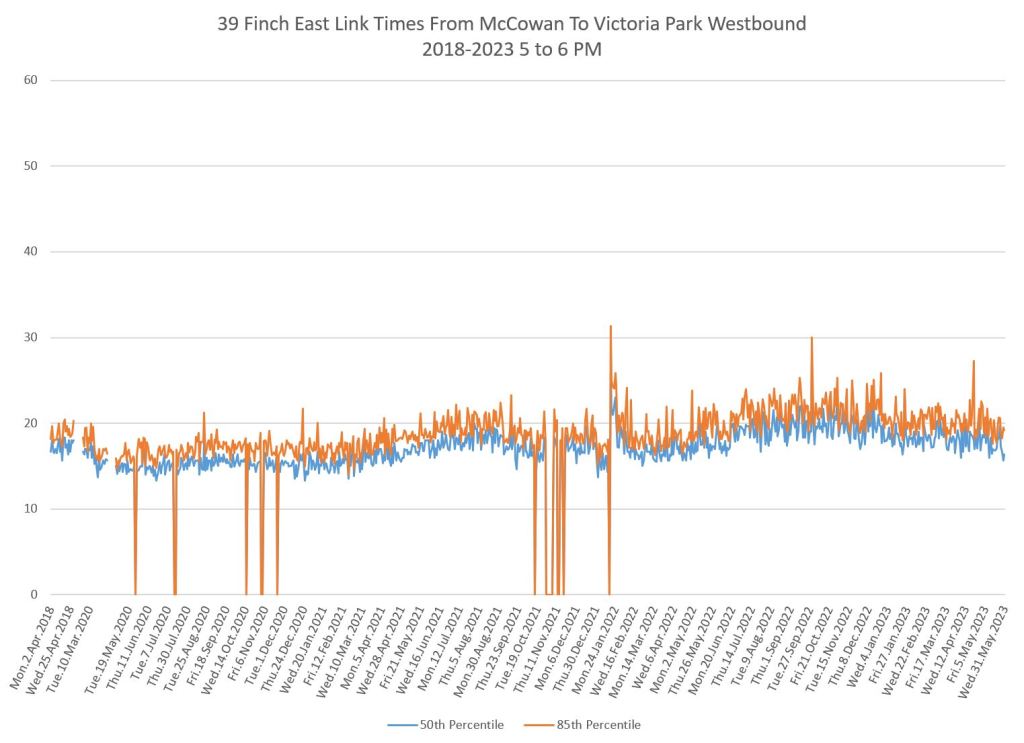
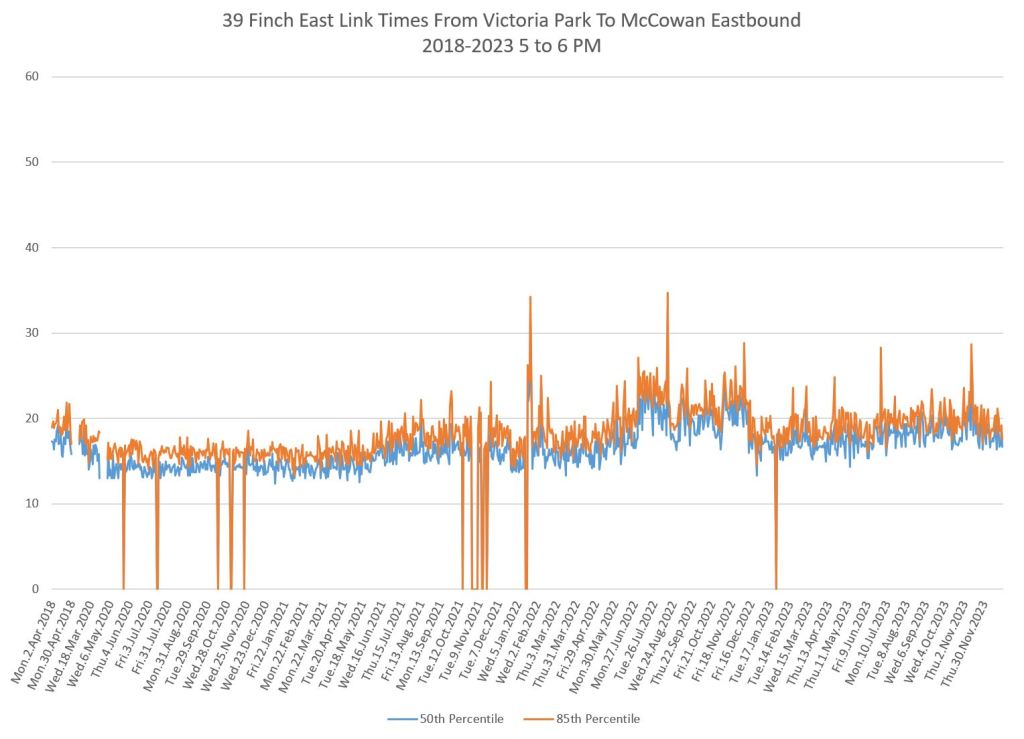
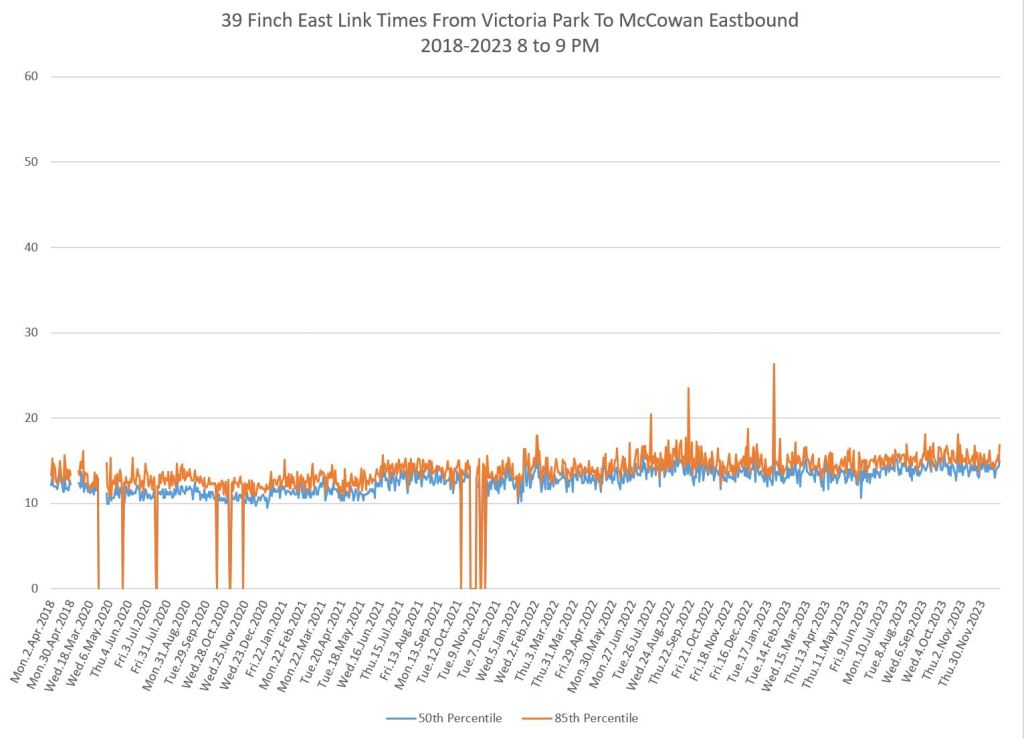
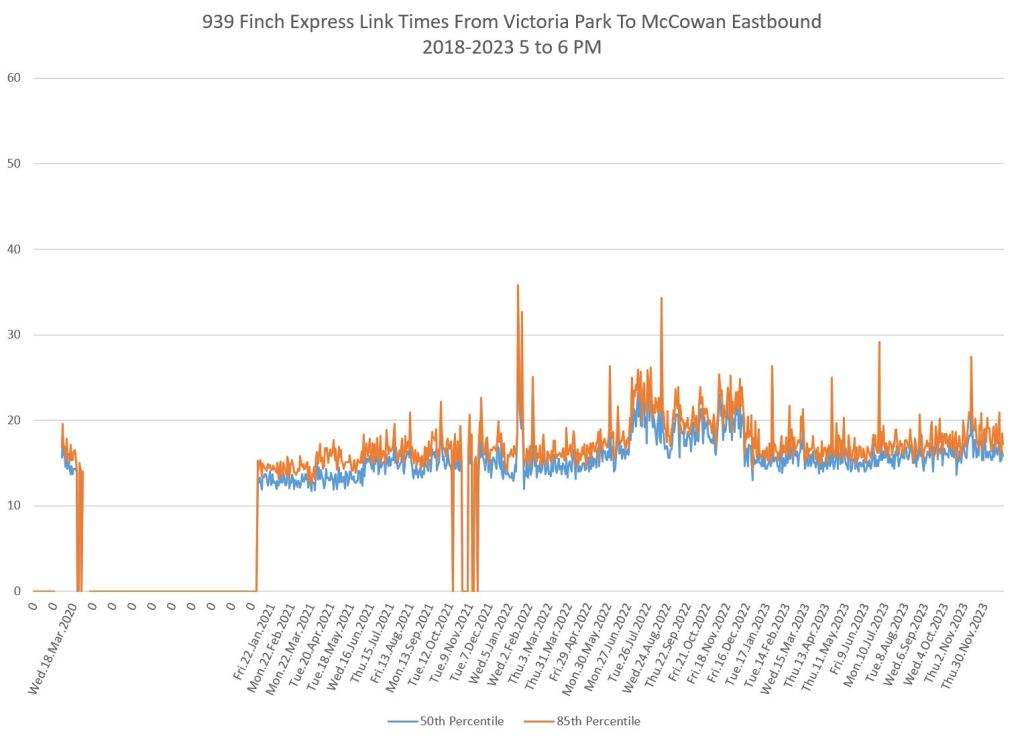
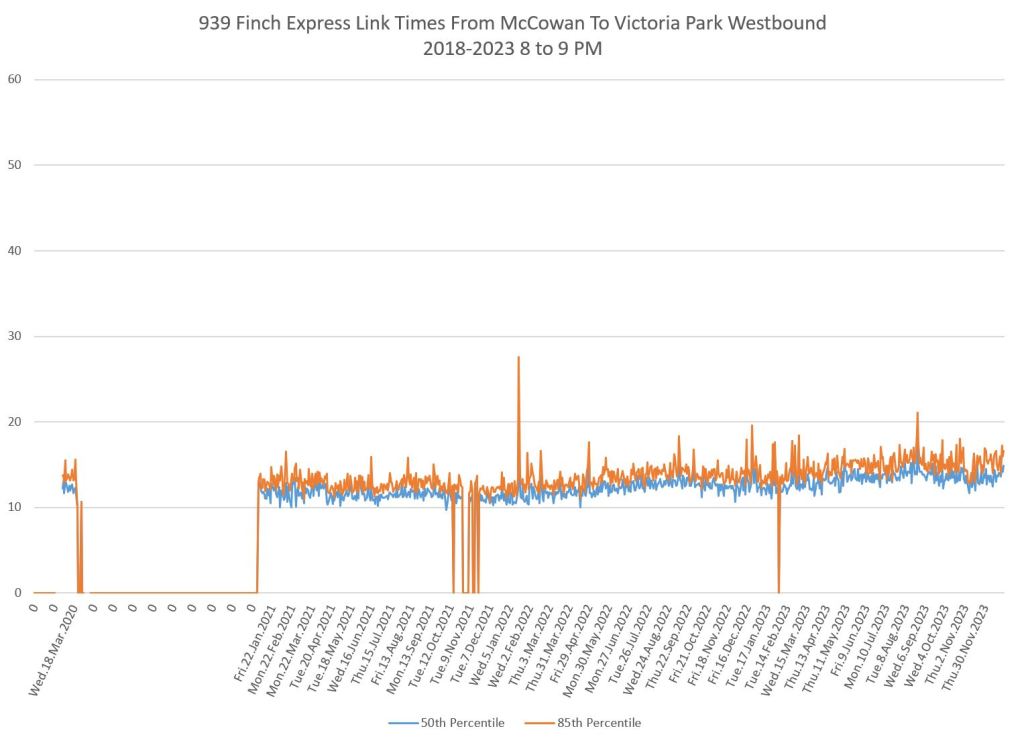
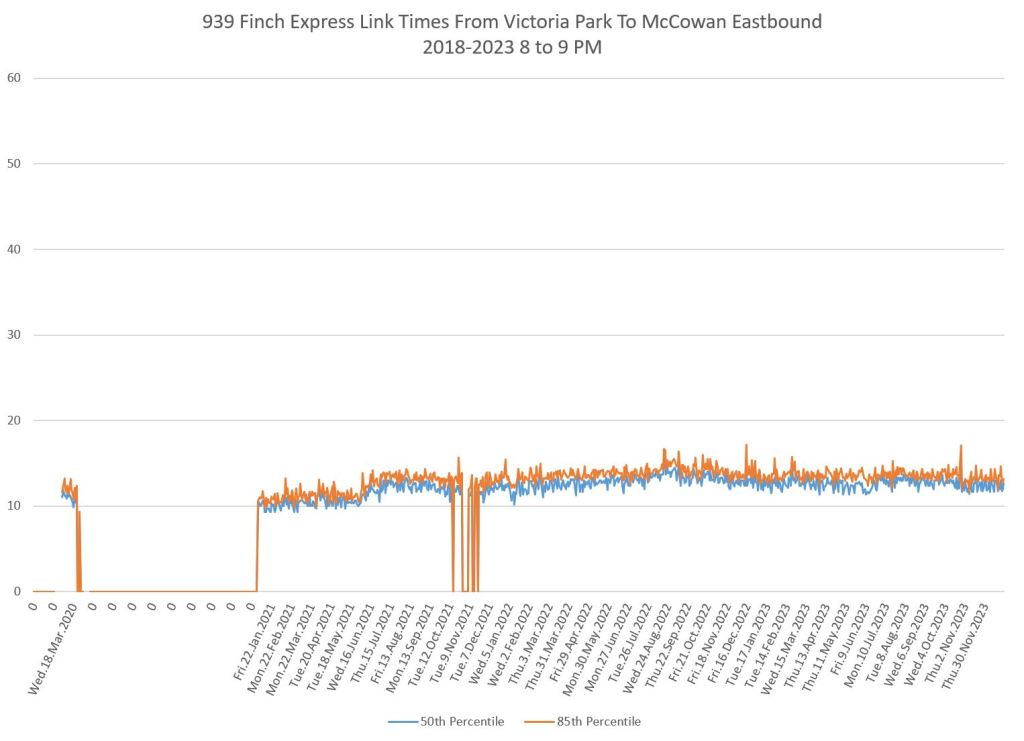
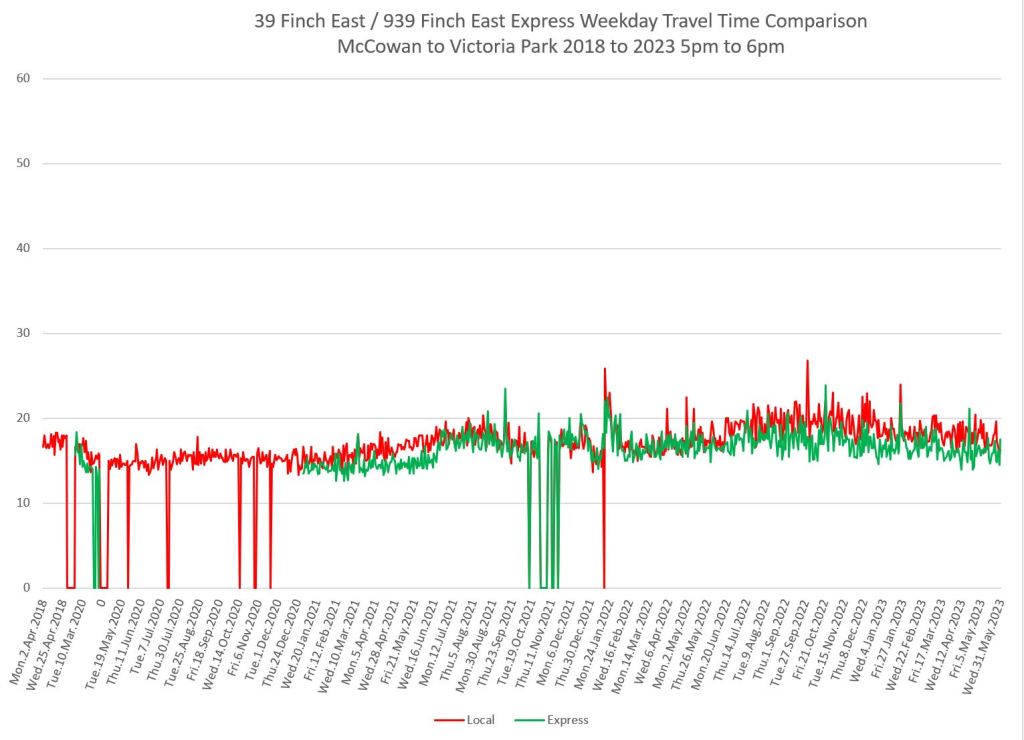
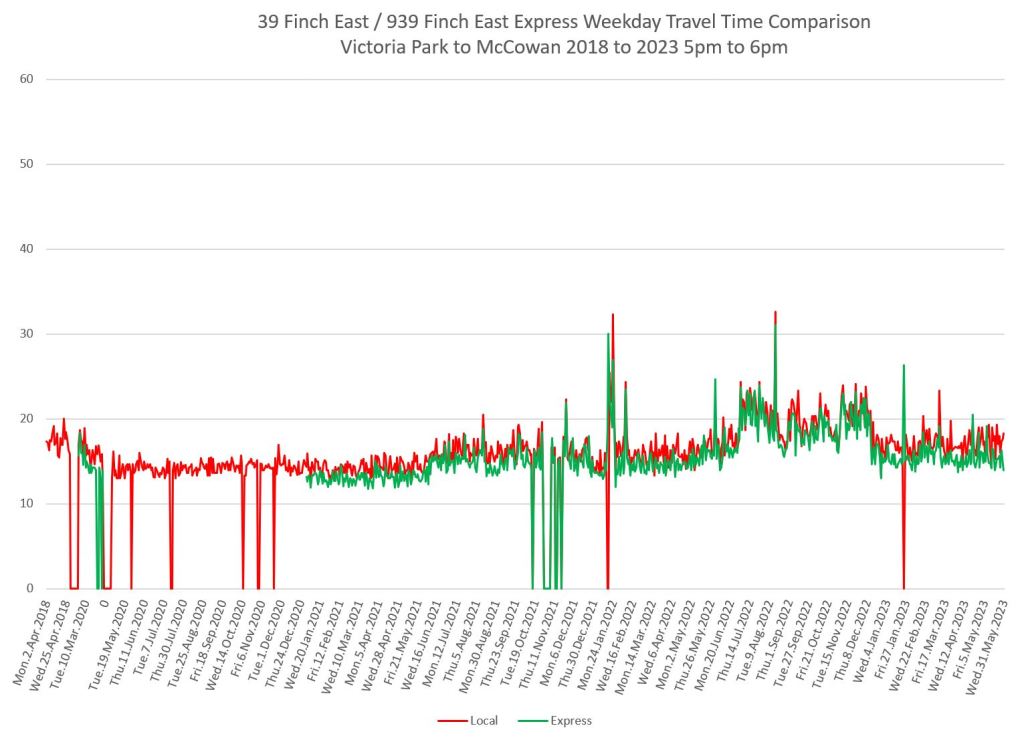
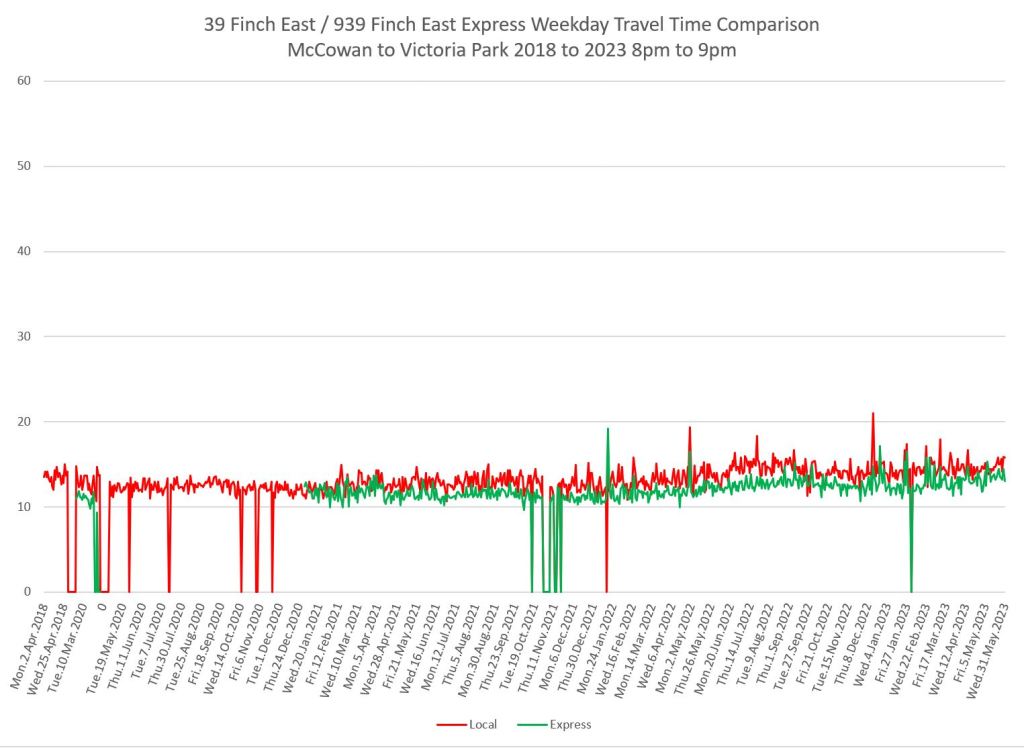
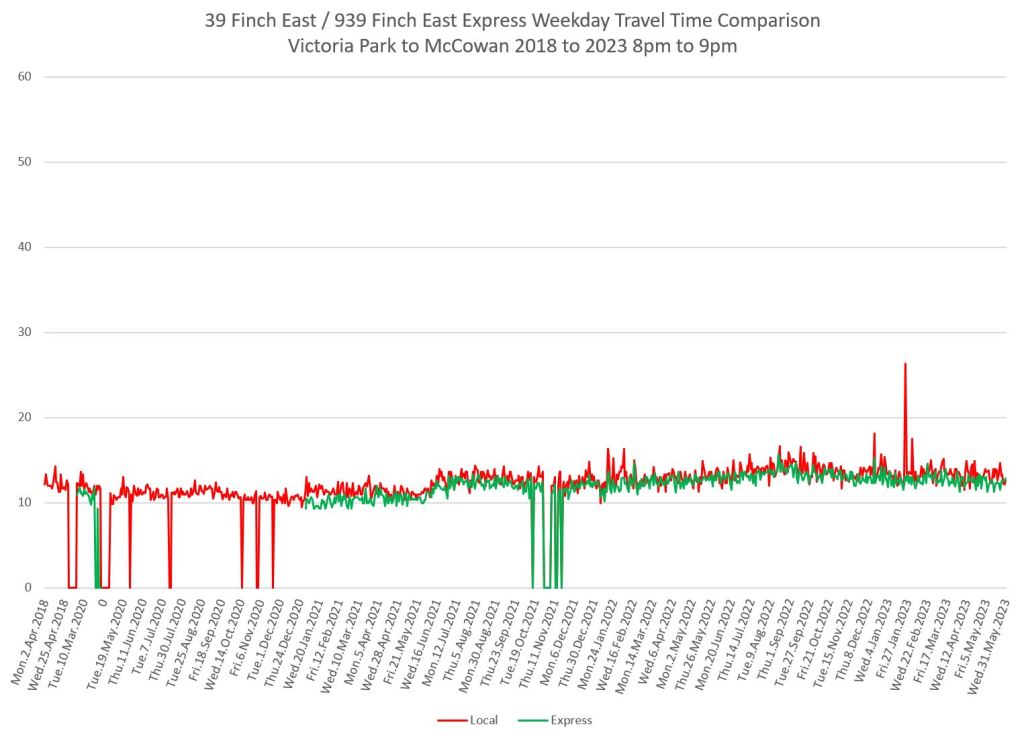
The scale of these charts goes only to 60 minutes, compared with 90 minutes on the charts above which leaves room for some very high values. Unlike the other routes, the data on Finch East show fairly small changes in travel times over the day with the main effect being in the peak direction during peak periods.
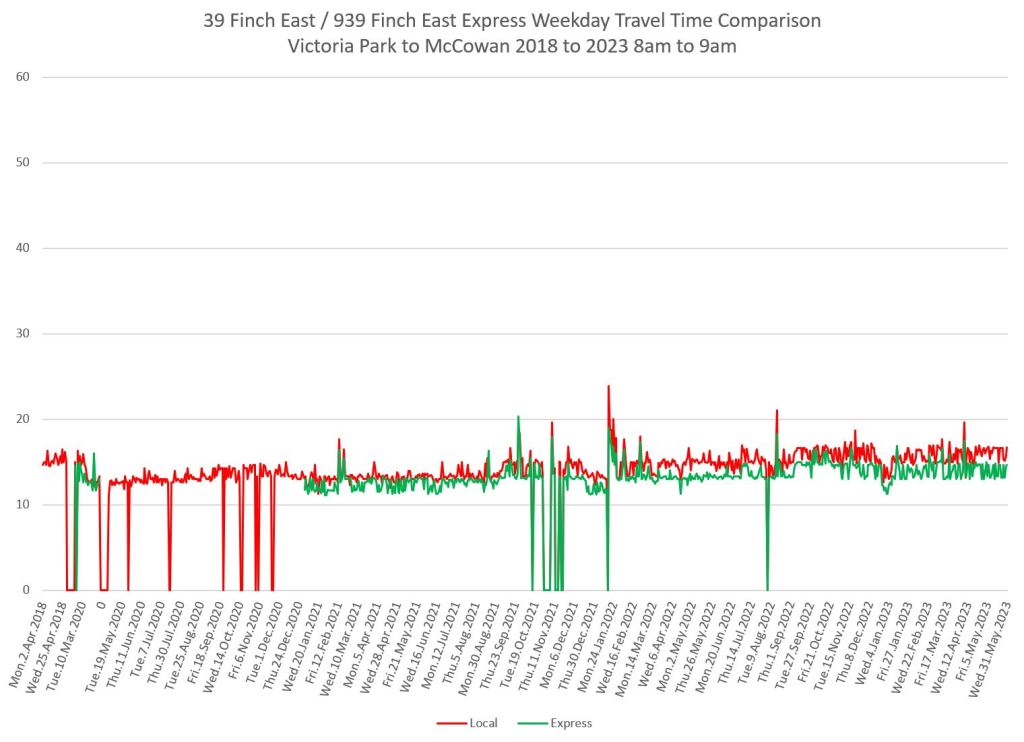
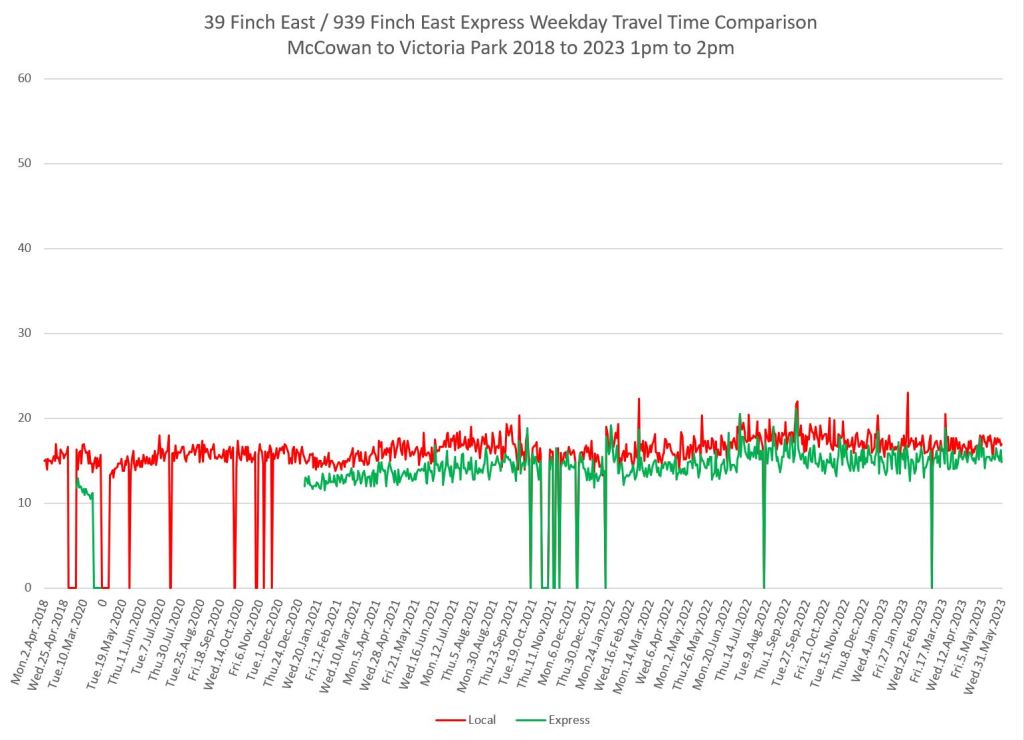
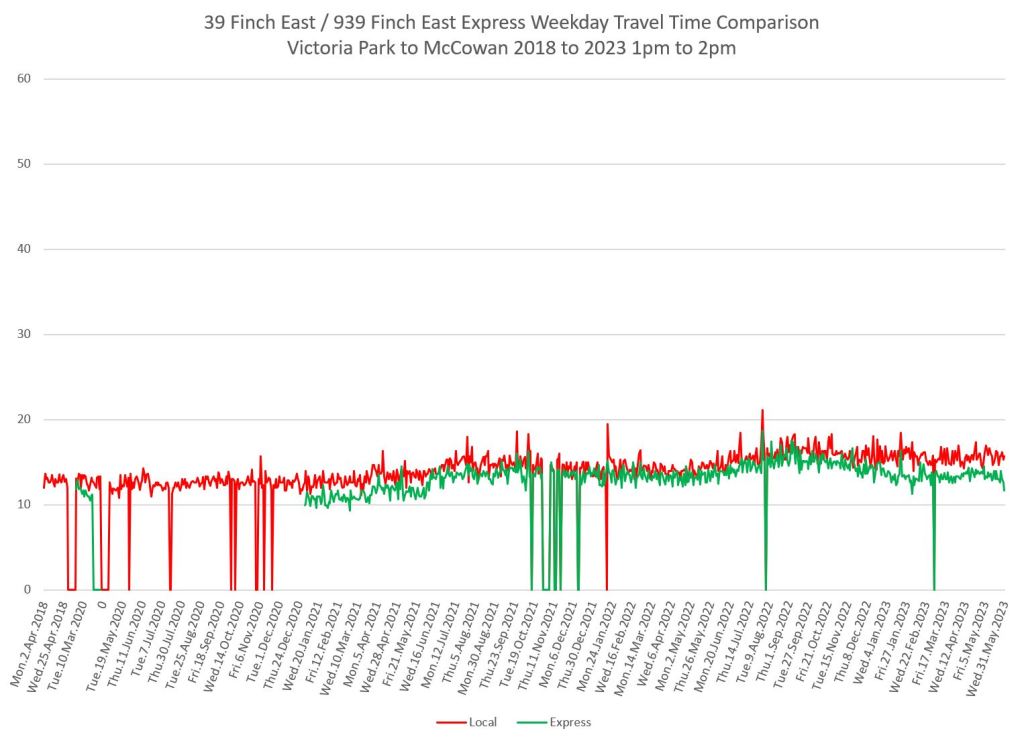
Local Service


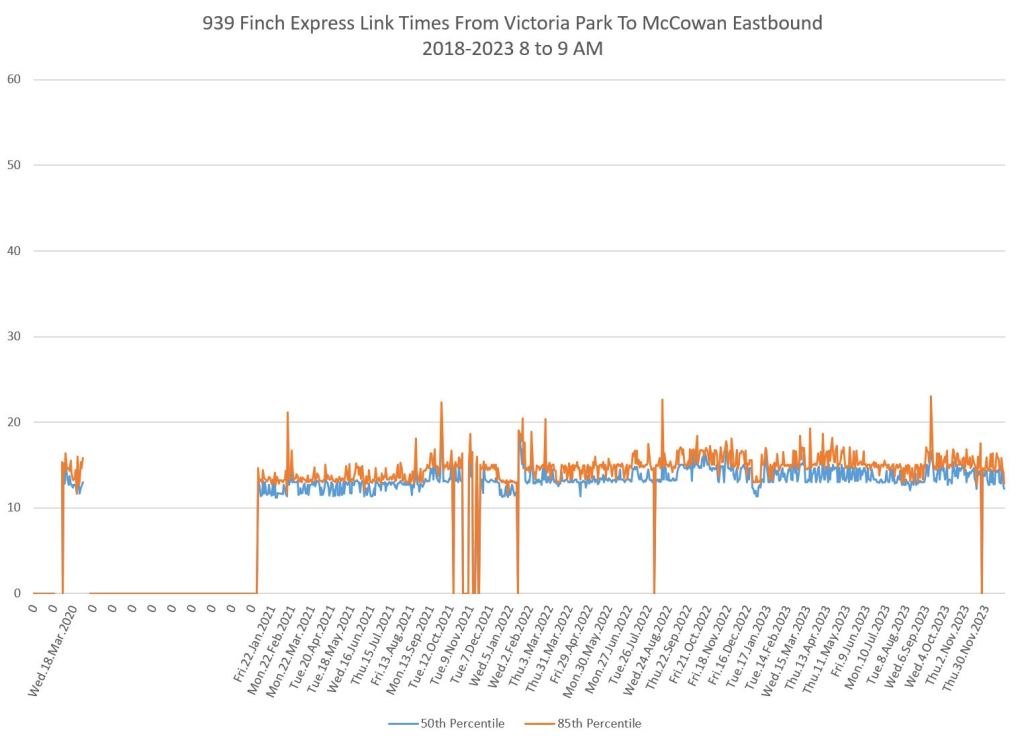
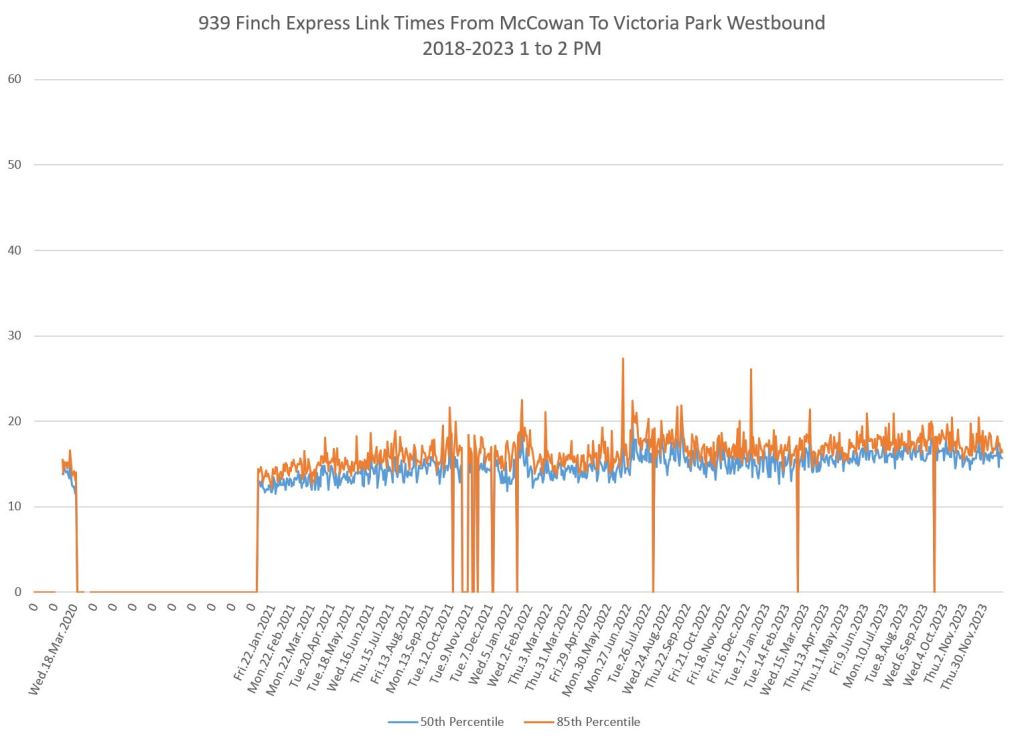
Express Service
As with the local service, the express travel times do not vary much except during the peak period, peak direction.


Difference Between Local and Express
Over this segment, there is little difference in travel times between the local and express branches of the route. The growth in times from March 2020 to December 2023 is relatively small compared to other routes earlier in this article. This suggests that congestion has not yet become a serious issue.
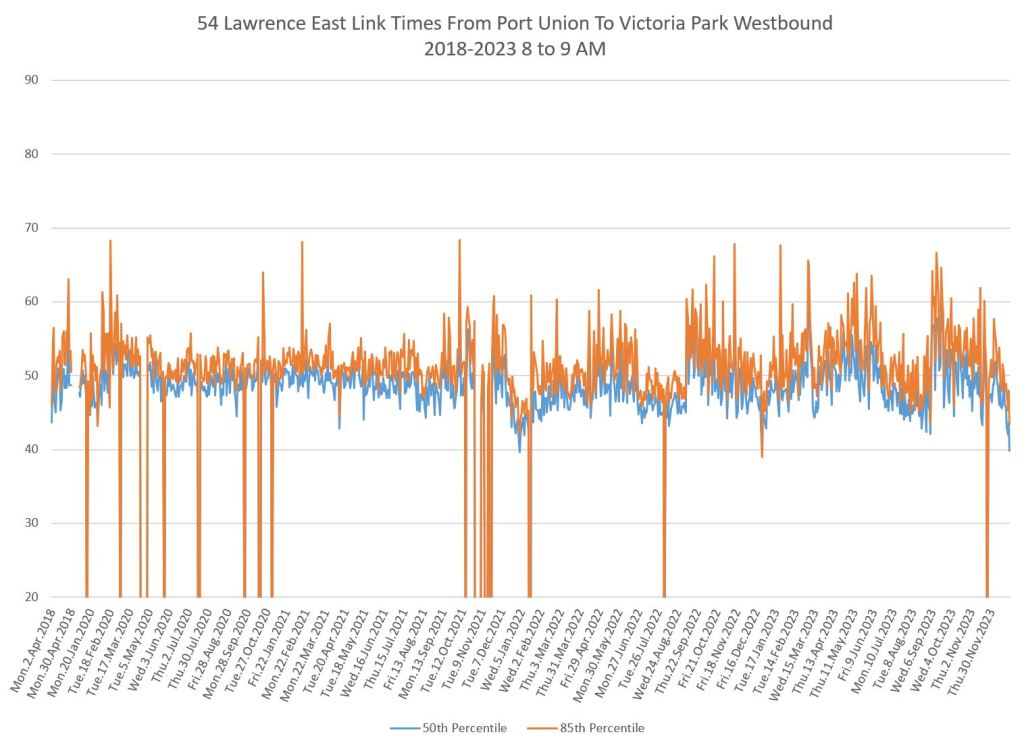
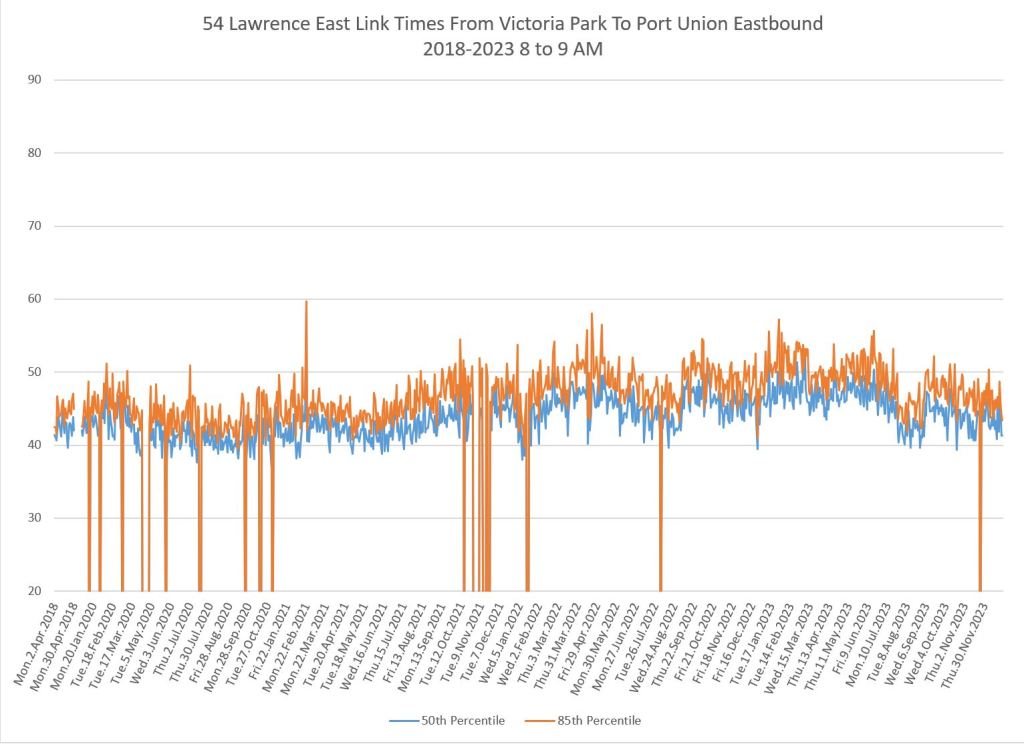
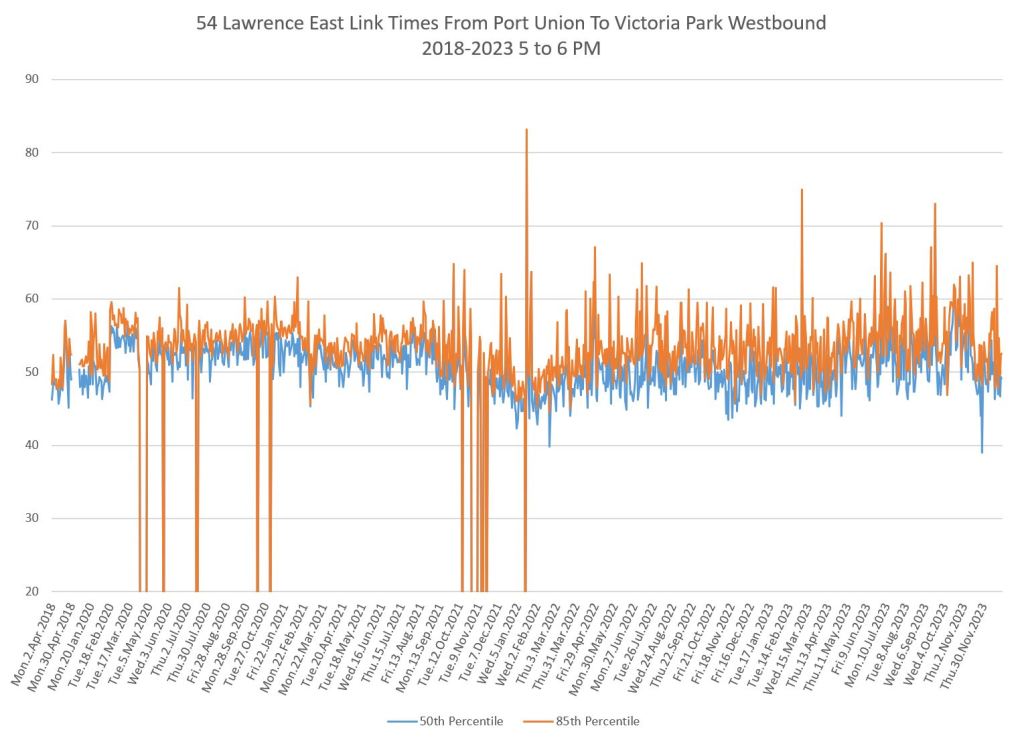
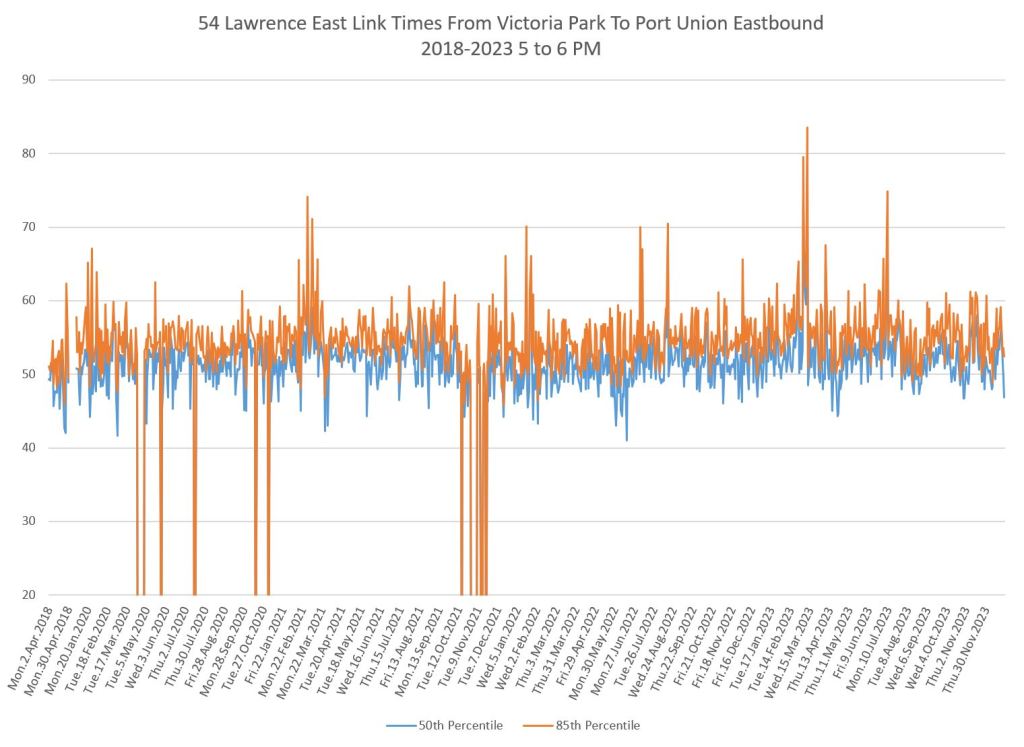
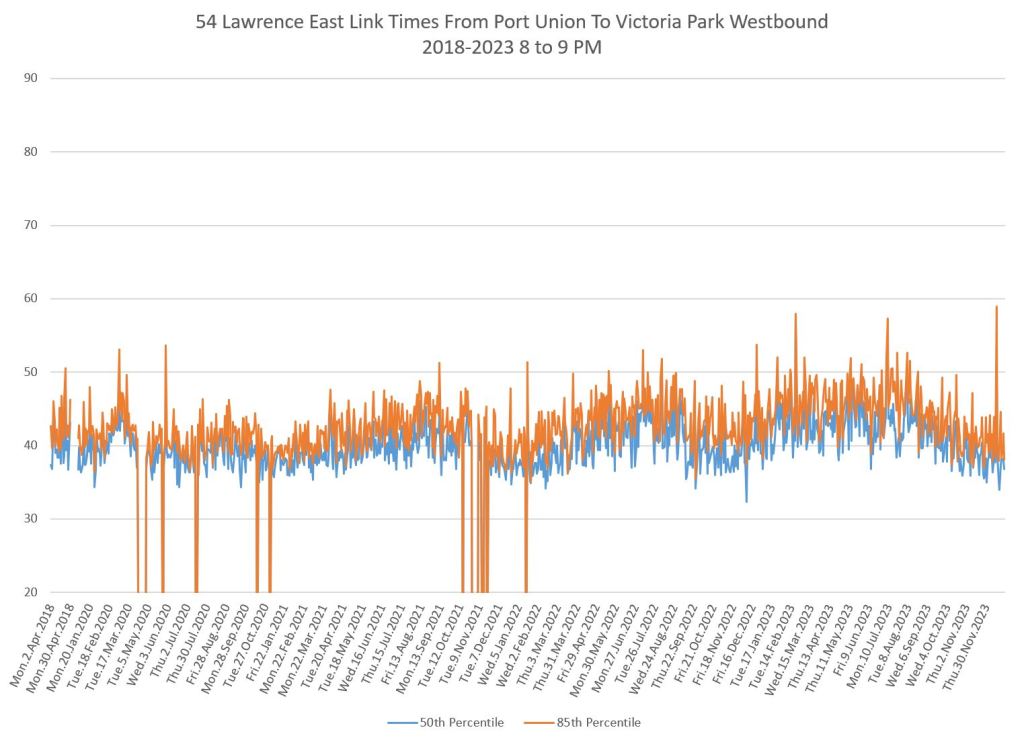
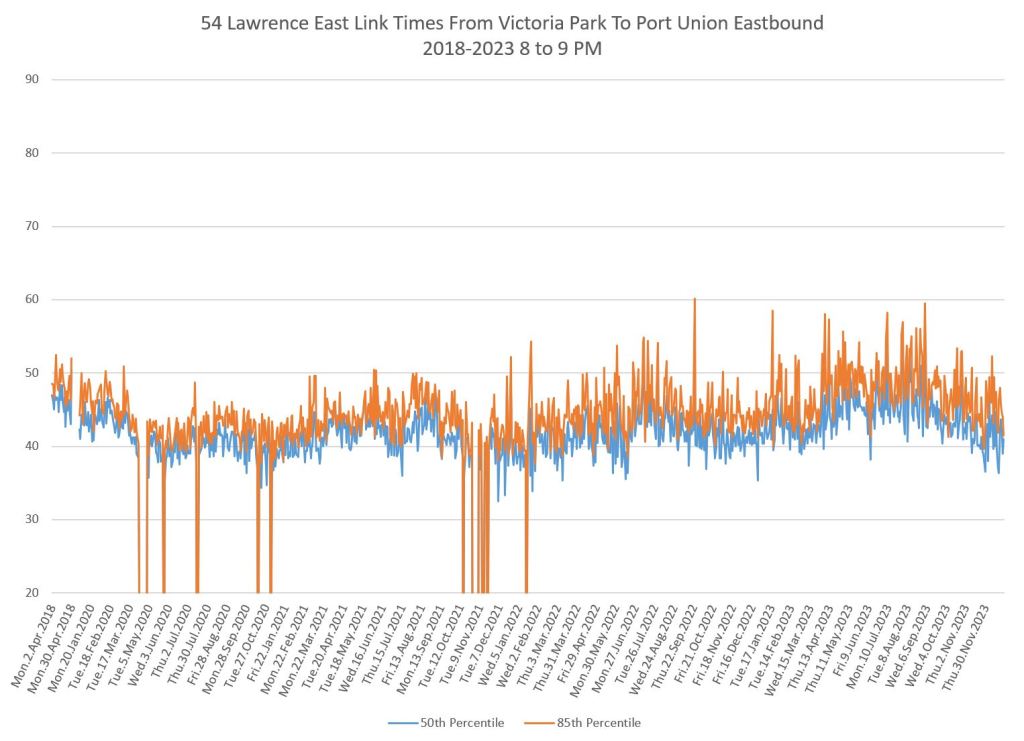
54 Lawrence East
These charts cover the segment from Victoria Park to Port Union. The City’s current study only reaches to Morningside but I have included a longer segment.
The express service on Lawrence does not run west to Victoria Park and is not included here.
Travel times have not changed much over the years. There was little effect from the pandemic in 2020 and only modest growth since then. However, the 85th percentile values often spike above the medians. This is a case where RapidTO lanes could improve the reliability of travel times even though the average values might not drop very much.


Unlike Yorkdale Mall, the 929 DUFFERIN EXPRESS bus has an express bus stop at Sylvan Avenue, which has a street front south entrance to Dufferin Mall. There is another express stop at Dufferin Park, where people have to cross an asphalt desert to get to the north entrance of Dufferin Mall.
Yorkdale Mall customers have to safari across the parking lot to reach Yorkdale Mall from any Dufferin bus. The 929 DUFFERIN EXPRESS has an express bus stop at Jane Osler Blvd. with a 6-lane stroad and asphalt desert facing them.
How many malls or shopping plazas are on other RapidTO Corridors with their own asphalt deserts? Hopefully, plans for densification of malls and shopping malls will include better access for transit users.
LikeLike
Thanks Steve, and a nod to the data collectors/sharers as well. I don’t know these routes too well, to not at all, but the narrow roads of old core TO eg. much of Dufferin and parts of Jane really are a challenge to boost transit in, not to mention having safer cycling, which at least the TTC buses are more safe to be taken over by, though probably with wind effects.
Maybe Dufferin should have a subway, not a busway? At least there’s a mall at one end, and maybe if Mr. F gets back in we can have a mall put in at the Lakefront/Ex area, not just parking lots.
Steve: The data are provided by the TTC from their Vision vehicle tracking system. All of the analytical work, including boiling down raw location data into a usable format, is my own.
LikeLike
And for a relative Luddite dinosaur like me, that seems like an awful lot of dull rigourous work, thank you again. Not that the facts/numbers seem to apply or matter some times, eg. a 23-19 vote in 2016 on 1 (b) on a motion by Cnclr Matlow on EX20.2 to use facts/best practices when deciding to allocate the billions. Because SSE I’d heard….
Steve: An advantage of (a) having done this for a long time and (b) being an IT professional is that I have developed a set of programs and templates over the years for slicing and dicing the mounds of tracking data. Occasionally, I will cook up something new, but even then the underlying machinery is in place and it’s more a question of presentation which has its own challenges. I wouldn’t say it’s all automatic, but the dog work is largely hands-off now. Then the trick is to find the points worth mentioning in articles and ensuring that the data back up my analysis. Anyhow, you’re welcome!
LikeLike